
3. E&P data for the non-specialistdm4ep.com/data/figures-chap03.pdfSeismic Interpretation...
5
The Management of Oil Industry Data © 2013, Steve Hawtin http://dm4ep.com/ 8 3. E&P data for the non-specialist Figure 14: Overly simplified view of the specialist’s activities Figure 15: Typical oil company Value Chain Figure 16: Different metaphors for data handling in E&P companies
Transcript of 3. E&P data for the non-specialistdm4ep.com/data/figures-chap03.pdfSeismic Interpretation...
The Management of Oil Industry Data © 2013, Steve Hawtin http://dm4ep.com/ 8
3. E&P data for the non-specialist
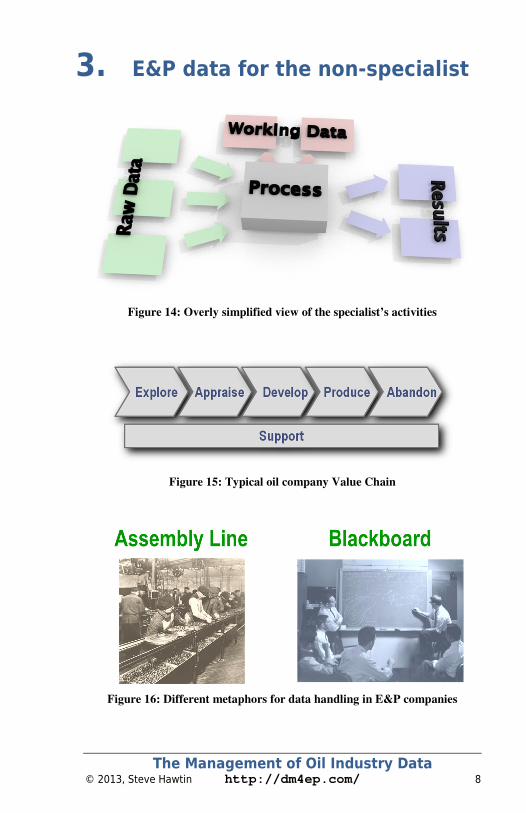
Figure 14: Overly simplified view of the specialist’s activities
Figure 15: Typical oil company Value Chain
Figure 16: Different metaphors for data handling in E&P companies
The Management of Oil Industry Data © 2013, Steve Hawtin http://dm4ep.com/ 9
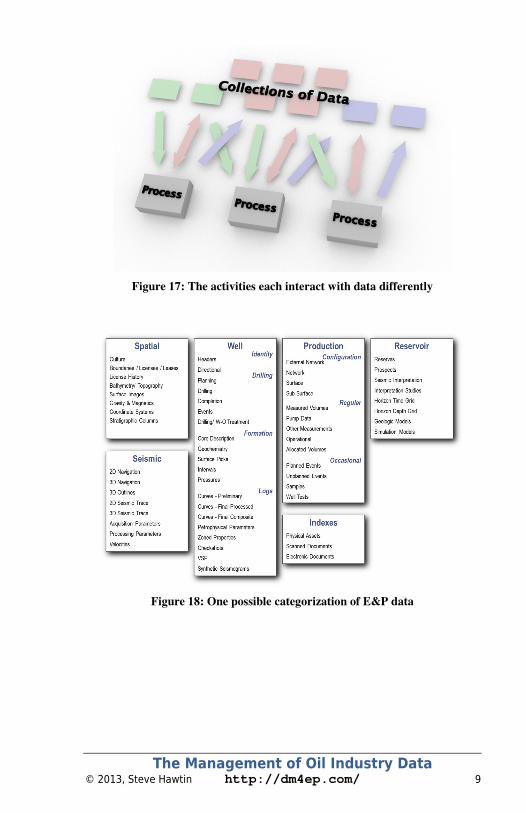
Figure 17: The activities each interact with data differently
Figure 18: One possible categorization of E&P data

The Management of Oil Industry Data © 2013, Steve Hawtin http://dm4ep.com/ 10
Figure 19: The subsurface
Figure 20: Drilling rig in South Texas
Figure 21: Measurements taken down the borehole
The Management of Oil Industry Data © 2013, Steve Hawtin http://dm4ep.com/ 11
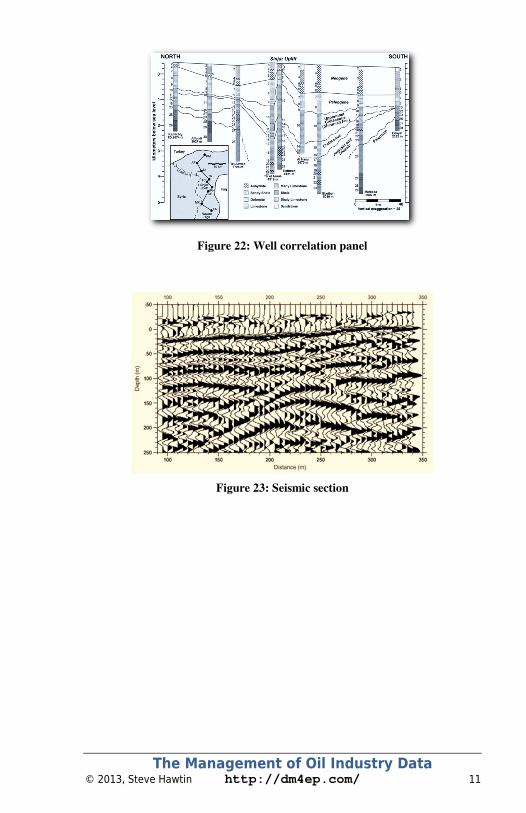
Figure 22: Well correlation panel
Figure 23: Seismic section
The Management of Oil Industry Data © 2013, Steve Hawtin http://dm4ep.com/ 12
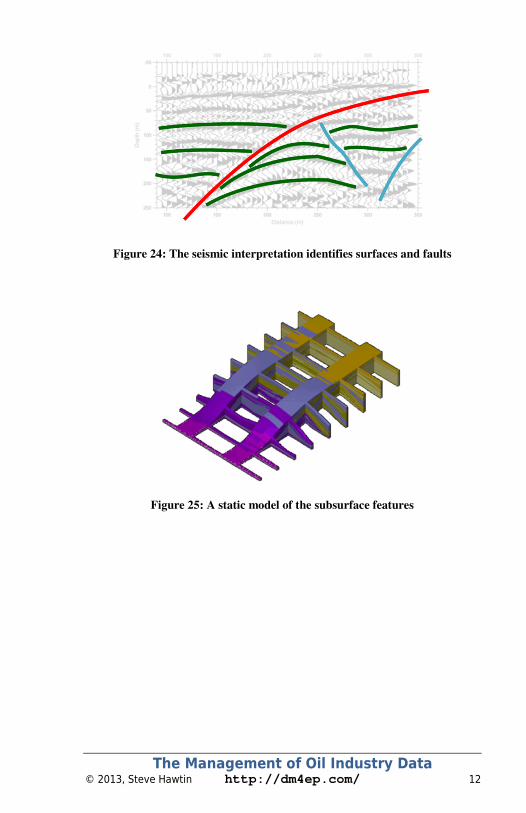
Figure 24: The seismic interpretation identifies surfaces and faults
Figure 25: A static model of the subsurface features