3-D image-based numerical computations of snow ... · PDF file940 N. Calonne et al.: 3-D...
13
The Cryosphere, 6, 939–951, 2012 www.the-cryosphere.net/6/939/2012/ doi:10.5194/tc-6-939-2012 © Author(s) 2012. CC Attribution 3.0 License. The Cryosphere 3-D image-based numerical computations of snow permeability: links to specific surface area, density, and microstructural anisotropy N. Calonne 1,2 , C. Geindreau 2 , F. Flin 1 , S. Morin 1 , B. Lesaffre 1 , S. Rolland du Roscoat 2 , and P. Charrier 2 1 M´ et´ eo-France – CNRS, CNRM-GAME, URA1357, CEN, Grenoble, France 2 Universit´ e Joseph Fourier Grenoble 1 – Grenoble INP – CNRS, 3S-R UMR5521, Grenoble, France Correspondence to: N. Calonne ([email protected]), C. Geindreau ([email protected]), and F. Flin ([email protected]) Received: 2 March 2012 – Published in The Cryosphere Discuss.: 19 March 2012 Revised: 12 July 2012 – Accepted: 19 July 2012 – Published: 10 September 2012 Abstract. We used three-dimensional (3-D) images of snow microstructure to carry out numerical estimations of the full tensor of the intrinsic permeability of snow (K). This study was performed on 35 snow samples, spanning a wide range of seasonal snow types. For several snow samples, a signif- icant anisotropy of permeability was detected and is consis- tent with that observed for the effective thermal conductivity obtained from the same samples. The anisotropy coefficient, defined as the ratio of the vertical over the horizontal com- ponents of K, ranges from 0.74 for a sample of decomposing precipitation particles collected in the field to 1.66 for a depth hoar specimen. Because the permeability is related to a char- acteristic length, we introduced a dimensionless tensor K * = K/r 2 es , where the equivalent sphere radius of ice grains (r es ) is computed from the specific surface area of snow (SSA) and the ice density (ρ i ) as follows: r es = 3/(SSA × ρ i ). We define K and K * as the average of the diagonal components of K and K * , respectively. The 35 values of K * were fitted to snow density (ρ s ) and provide the following regression: K = (3.0 ± 0.3)r 2 es exp ((-0.0130 ± 0.0003)ρ s ). We noted that the anisotropy of permeability does not affect signifi- cantly the proposed equation. This regression curve was ap- plied to several independent datasets from the literature and compared to other existing regression curves or analytical models. The results show that it is probably the best currently available simple relationship linking the average value of per- meability, K , to snow density and specific surface area. 1 Introduction The intrinsic permeability (K) is an important physical prop- erty of snow. Defined in a tensorial way, K (m 2 ) links the pressure gradient ∇p (Pa m -1 ) and the discharge per unit area q (m s -1 ) through the Darcy’s law q =-(1/μ)K∇p, where μ is the dynamic viscosity of the fluid (kg m -1 s -1 ). The intrinsic permeability is of particular interest to quantify transport properties of snow and firn, such as wind pump- ing processes (Colbeck, 1989, 1997), air convection (Aki- taya, 1974; Powers et al., 1985; Brun and Touvier, 1987; Sturm and Johnson, 1991; Albert et al., 2004) and liquid wa- ter flow (Colbeck, 1975, 1976; Waldner et al., 2004; Kat- sushima et al., 2009; Yamaguchi et al., 2010). It is a key variable for a wide number of applications such as atmo- spheric and firn chemistry (Freitag et al., 2002; Neumann, 2003; Grannas et al., 2007; Domine et al., 2008) or snow-firn metamorphism (Albert, 2002; H¨ orhold et al., 2009). Perme- ability has also been proposed as a means of characteriza- tion for quantitative snow classification (Bader, 1939; Jor- dan et al., 1999; Arakawa et al., 2009). Indeed, most physi- cal properties of snow, including its permeability, are linked to the geometrical arrangement of ice, air, water vapor and sometimes liquid water, referred to as its microstructure. The first quantitative investigations of snow permeability are attributed to Bader (1939). Shimizu (1970), Sommerfeld and Rocchio (1993), Jordan et al. (1999) and Arakawa et al. (2010) realized extensive experiments on seasonal snow and proposed parameterizations depending on grain size and den- sity. However, these studies are characterized by a significant Published by Copernicus Publications on behalf of the European Geosciences Union.
Transcript of 3-D image-based numerical computations of snow ... · PDF file940 N. Calonne et al.: 3-D...

The Cryosphere, 6, 939–951, 2012www.the-cryosphere.net/6/939/2012/doi:10.5194/tc-6-939-2012© Author(s) 2012. CC Attribution 3.0 License.
The Cryosphere
3-D image-based numerical computations of snow permeability:links to specific surface area, density, and microstructuralanisotropy
N. Calonne1,2, C. Geindreau2, F. Flin1, S. Morin1, B. Lesaffre1, S. Rolland du Roscoat2, and P. Charrier2
1Meteo-France – CNRS, CNRM-GAME, URA1357, CEN, Grenoble, France2Universite Joseph Fourier Grenoble 1 – Grenoble INP – CNRS, 3S-R UMR5521, Grenoble, France
Correspondence to:N. Calonne ([email protected]), C. Geindreau ([email protected]),and F. Flin ([email protected])
Received: 2 March 2012 – Published in The Cryosphere Discuss.: 19 March 2012Revised: 12 July 2012 – Accepted: 19 July 2012 – Published: 10 September 2012
Abstract. We used three-dimensional (3-D) images of snowmicrostructure to carry out numerical estimations of the fulltensor of the intrinsic permeability of snow (K ). This studywas performed on 35 snow samples, spanning a wide rangeof seasonal snow types. For several snow samples, a signif-icant anisotropy of permeability was detected and is consis-tent with that observed for the effective thermal conductivityobtained from the same samples. The anisotropy coefficient,defined as the ratio of the vertical over the horizontal com-ponents ofK , ranges from 0.74 for a sample of decomposingprecipitation particles collected in the field to 1.66 for a depthhoar specimen. Because the permeability is related to a char-acteristic length, we introduced a dimensionless tensorK∗
=
K/r2es, where the equivalent sphere radius of ice grains (res)
is computed from the specific surface area of snow (SSA)and the ice density (ρi) as follows:res= 3/(SSA× ρi). WedefineK andK∗ as the average of the diagonal componentsof K andK∗, respectively. The 35 values ofK∗ were fittedto snow density (ρs) and provide the following regression:K = (3.0 ± 0.3)r2
es exp((−0.0130± 0.0003)ρs). We notedthat the anisotropy of permeability does not affect signifi-cantly the proposed equation. This regression curve was ap-plied to several independent datasets from the literature andcompared to other existing regression curves or analyticalmodels. The results show that it is probably the best currentlyavailable simple relationship linking the average value of per-meability,K, to snow density and specific surface area.
1 Introduction
The intrinsic permeability (K ) is an important physical prop-erty of snow. Defined in a tensorial way,K (m2) links thepressure gradient∇p (Pa m−1) and the discharge per unitareaq (m s−1) through the Darcy’s lawq = −(1/µ)K∇p,whereµ is the dynamic viscosity of the fluid (kg m−1 s−1).The intrinsic permeability is of particular interest to quantifytransport properties of snow and firn, such as wind pump-ing processes (Colbeck, 1989, 1997), air convection (Aki-taya, 1974; Powers et al., 1985; Brun and Touvier, 1987;Sturm and Johnson, 1991; Albert et al., 2004) and liquid wa-ter flow (Colbeck, 1975, 1976; Waldner et al., 2004; Kat-sushima et al., 2009; Yamaguchi et al., 2010). It is a keyvariable for a wide number of applications such as atmo-spheric and firn chemistry (Freitag et al., 2002; Neumann,2003; Grannas et al., 2007; Domine et al., 2008) or snow-firnmetamorphism (Albert, 2002; Horhold et al., 2009). Perme-ability has also been proposed as a means of characteriza-tion for quantitative snow classification (Bader, 1939; Jor-dan et al., 1999; Arakawa et al., 2009). Indeed, most physi-cal properties of snow, including its permeability, are linkedto the geometrical arrangement of ice, air, water vapor andsometimes liquid water, referred to as its microstructure.
The first quantitative investigations of snow permeabilityare attributed toBader(1939). Shimizu(1970), Sommerfeldand Rocchio(1993), Jordan et al.(1999) andArakawa et al.(2010) realized extensive experiments on seasonal snow andproposed parameterizations depending on grain size and den-sity. However, these studies are characterized by a significant
Published by Copernicus Publications on behalf of the European Geosciences Union.

940 N. Calonne et al.: 3-D image-based computations of snow permeability
scatter in the results, which seems mainly due to experimen-tal issues (Sommerfeld and Rocchio, 1993) and to sometimesambiguous definitions of grain size (Jordan et al., 1999). Inaddition existing field permeameters require snow samplesto be several cm large (cylinder diameter on the order of10 to 20 cm typically, and cylinder height from several totens of cm) (Shimizu, 1970; Albert et al., 2000; Arakawaet al., 2009) which generally exceeds the size within whichsnow properties can reasonably be considered homogeneous(Schneebeli et al., 1999; Pielmeier and Schneebeli, 2003;Matzl and Schneebeli, 2006, 2010; Marshall and Johnson,2009).
More recently, the availability of 3-D images of snow andfirn from X-ray tomography (Brzoska et al., 1999; Coleouet al., 2001; Freitag et al., 2004; Schneebeli and Sokratov,2004; Kaempfer et al., 2005; Chen and Baker, 2010) openedthe way to numerical simulations, applying to snow the meth-ods developed for porous media in general (Spanne et al.,1994; Ferreol and Rothman, 1995; Martys and Chen, 1996;Arns et al., 2001, 2004). In particular, such techniques allowto estimate the permeability for snow samples much smallerthan those used for experimental measurements, thereby re-ducing if not eliminating issues associated with the intrinsicheterogeneity of the samples probed. Recently,Freitag et al.(2002) andCourville et al.(2010) computed one componentof the permeability of firn samples using Lattice-Boltzmanmodeling andZermatten et al.(2011) performed direct pore-level simulations on five snow samples. While these numeri-cal computations methods are particularly promising, the ob-tained results show only a qualitative agreement with previ-ous experimental studies and theoretical models, and do nottake into account the anisotropy of the permeability.
We carried out numerical estimations of the full 3-D tensorof intrinsic permeability (K ) on 35 3-D images of seasonalsnow obtained from microtomography. Computations wereperformed with the software Geodict (Thoemen et al., 2008;Koivu et al., 2009; Calonne et al., 2011) and were based onthe periodic homogenization method (Auriault et al., 2009).The main objective of this paper was to elaborate a parame-terization of the snow permeability from other variables mea-surable in the field. For this purpose, we studied the relation-ship between the computed permeability, snow density andgrain size, defined here as the equivalent sphere radius, at thescale of the representative elementary volume (REV). Thisrelationship obtained using our data was compared to exist-ing literature datasets as well as other equations from theo-retical models and regressions. In addition, we focused onthe anisotropy of permeability, available from the computed3-D tensor of permeability.
2 Methods
2.1 Snow samples
Numerical computations were performed on 35 tomographicimages obtained from previous experiments or field sam-pling (e.g. Calonne et al., 2011), spanning most types ofseasonal snow, i.e. precipitation particles (PP), decomposingand fragmented precipitation particles (DF), rounded grains(RG), faceted crystals (FC), depth hoar (DH) and melt forms(MF), according to the International Classification for Sea-sonal Snow on the Ground (ICSSG) (Fierz et al., 2009).
Two-thirds of the snow samples come from controlledcold-room experiments: a first series (PP, DF and RG) wasobtained by subjecting deposited natural snow to isothermalconditions at 271 K (Flin et al., 2004). Another RG samplewas obtained under similar conditions, but after sieving. Asecond series (RG, FC and DH) was obtained under a tem-perature gradient of 43 K m−1 at 269 K and corresponds tovarious stages of metamorphism of the initial sieved snow(RG) into FC then DH. Two other similar experiments, witha gradient of 16 and 100 K m−1 at 268 and 270 K, providedtwo samples (FC and DH) (Coleou et al., 2001; Flin and Br-zoska, 2008). A series of MF samples was obtained by graincoarsening in water-saturated snow using the method ofRay-mond and Tusima(1979) followed by draining their liquidwater content (Coleou et al., 2001; Flin et al., 2011).
The remaining snow samples were directly collected in thefield: 10 snow specimens (PP, DF and RG) were sampledat increasing depths in the snowpack of the Girose glacier(Ecrins, French Alps) (Flin et al., 2011). Another PP samplewas collected at Col de Porte (Chartreuse, French Alps).
All 3-D images considered in this study are cubic, havean edge size ranging from 2.51 to 9.66 mm, and a resolutionbetween 4.91 micrometer (µm) and 10 µm, depending on thesnow type. Additional information are indicated in Table 1 ofthe Supplement.
2.2 Computations of snow permeability
Auriault (1991, 2011) has shown that physical phenomena inrandom and in periodic medium can be modeled by a simi-lar equivalent continuous macroscopic description, providedthat the condition of separation of scales is satisfied. Thisfundamental condition may be expressed asε � 1, whereε
represents the separation of scale and is defined asε = l/L,in which l andL are the characteristic lengths of the hetero-geneities at the pore scale and of the macroscopic sample orexcitation, respectively. This condition implies the existenceof a representative elementary volume (REV) of sizel of thematerial and the physical phenomena. The REV constitutesthe smallest fraction of the sample volume from which a vari-able representative of the whole can be determined. In prac-tice, periodic boundary conditions are thus widely used tocompute effective properties of random media (Kanit et al.,
The Cryosphere, 6, 939–951, 2012 www.the-cryosphere.net/6/939/2012/

N. Calonne et al.: 3-D image-based computations of snow permeability 941
2003; Bernard et al., 2005; Koivu et al., 2009; Calonne et al.,2011). Assuming for snow thatε � 1, we applied the ho-mogenization method for periodic structures to derive theDarcy’s law from the physics at the pore scale (Ene andSanchez-Palencia, 1975), as described in the following. Letus consider a rigid porous matrix, which is periodic with pe-riod �, i.e. the size of the REV, and is fully saturated by anincompressible Newtonian fluid of densityρ and viscosityµ. �s and�f are the domains occupied by the solid and thefluid, respectively. The common boundary of�s and�f isdenoted0. The porosity is defined asφ = |�f
|/|�|. At thepore scale, the steady state flow is described by
µ4v − ∇p = ρ(v · ∇)v within �f (1a)
∇ · v = 0 within �f (1b)
v = 0 on0 (1c)
where v and p are the velocity and the pressure of thefluid, respectively. Using the homogenization method, itcan be shown that the corresponding macroscopic de-scription strongly depends on the order of magnitudeof the pore Reynolds number,Rel = |ρ(v · ∇)v|/|µ4v| =
O(ρvcl/µ) wherevc is a characteristic value of fluid veloc-ity. WhenRel <O(1), the macroscopic flow is described byDarcy’s law, otherwise non-linearities appear at the macro-scopic scale (Mei and Auriault, 1991). In what follows, it isassumed thatRel <O(1), which is typically the case if weconsider airflow through snow and firn induced by moderatewinds (< 6 m s−1) over the snowpack surface (Albert, 2002).Under such conditions, the macroscopic description is writ-ten:
〈v〉 = −Kµ
∇p, ∇ · 〈v〉 = 0, with 〈v〉 =1�
∫�f v d� (2)
where〈v〉 = q represents the Darcy’s velocity andK is the in-trinsic permeability tensor of the porous media. This tensor,which is symmetric and positive, is defined asKij = 〈kij 〉.The second order tensork is the solution of the followingboundary value problem over the REV,
µ4v − ∇p − ∇p = 0 within �f (3a)
∇ · v = 0 within �f (3b)
v = 0 on0 (3c)
where v = −(1/µ)k∇p, the pressure fluctuationp (with〈p〉 = 0) are the periodic unknowns and∇p is a given macro-scopic gradient of pressure. The components of the per-meability tensorK were estimated by solving the aboveboundary value problem (Eqs. 3a–3c) on a REV extractedfrom tomographic images (see Sect.3.6), using the soft-ware Geodict (http://www.geodict.de). The boundary valueproblem is solved by using the finite difference method.Within this method a staggered grid (voxel) is used. The val-ues of velocity and pressure are defined at center points ofthe faces and volume of the cubic unit cells, respectively.
The partial differential equations for incompressible Stokesflow (Eqs. 3a–3c) are solved by using the FFF-Stokes solverbased on fast Fourier transform. Periodic boundary condi-tions are applied on the external boundaries of each volume(seeWiegmann, 2007for more details).
Before carrying out the computations, voxels that are partof the network of interconnected pores were detected by im-age analysis, allowing to determine the ratio between closedand open porosity and to check that it was very small (lessthan 0.004 for all the samples). This means that it is correctto consider that air can flow through the whole porosity ofthe REVs for all of our samples.
In the following, the non-diagonal terms of the tensorK ,about 50 times lower than diagonal terms, are not presented(the x-, y- and z-axes of 3-D images correspond to the prin-cipal directions of the microstructure, z being along the di-rection of the gravity). We noteKx , Ky and Kz the diag-onal term of the permeability tensor computed in the x-, y-and z-direction, respectively,K the average value of the threeterms, andKxy the average value ofKx andKy . In the fol-lowing, we mostly useKz, Kxy andK, i.e. the vertical com-ponent, the average of the two horizontal components, andthe average value of the three components of the permeabil-ity tensor, respectively.
2.3 Dimensionless permeability
The intrinsic permeability is strongly linked to a character-istic length of the microstructure of the medium considered(Boutin and Geindreau, 2010). Because the dimension of thepermeability is a square length,K is often normalized by acharacteristic length to the square, leading to a dimensionlesstensor that we noteK∗.
Among various existing length metrics for snow (Fierzet al., 2009), we focus on the equivalent sphere radius ofsnow (res, in m) (Sommerfeld and Rocchio, 1993; Lucianoand Albert, 2002), also called the optical radius, optical-equivalent grain size or OGS (e.g.Grenfell and Warren,1999; Painter et al., 2006; Fierz et al., 2009; Brucker et al.,2011). It is a characteristic length of the ice grains at themicroscopic scale, which corresponds to the radius of amonodisperse collection of spheres having the same specificsurface area (SSA) value than the sample considered. Thesnow SSA is defined as the total surface area of the air–iceinterface per unit mass and can be quantitatively estimatedby various means experimentally (e.g.Matzl and Schneebeli,2006; Domine et al., 2008; Gallet et al., 2009; Arnaud et al.,2011) and numerically using 3-D images (e.g.Flin et al.,2011). The equivalent sphere radius and snow SSA are re-lated by the following equation:
res=3
SSA× ρi(4)
whereρi = 917 kg m−3 is the ice density. In the following,K∗ thus corresponds toK/r2
es and we keep the notationK∗,
www.the-cryosphere.net/6/939/2012/ The Cryosphere, 6, 939–951, 2012
942 N. Calonne et al.: 3-D image-based computations of snow permeability
K∗z andK∗
xy for the average, vertical and horizontal compo-nents ofK∗, respectively.
One could also choose to normalizeK by a characteris-tic length corresponding to the pore space and use the hy-draulic radius (rh), commonly applied to flow through pipesand open channels. This normalization is equivalent to usingres, because these two radii are linked by the simple relation-ship:rh = res(1− φ)/(3φ) (Bear, 1972), whereφ representssnow porosity. The granulometric analysis is another possi-ble way to estimate a characteristic length (Zermatten et al.,2011). However, this approach is less convenient since it can-not be performed in the field, but only using 3-D images.
2.4 Microstructural properties
Snow porosity (φ), and thus snow density (ρs = ρi (1− φ), inkg m−3), were estimated from 3-D images using a standardvoxel counting algorithm.
The specific surface area (SSA, in m2 kg−1) was computedfrom 3-D images using a stereological method as describedby Flin et al.(2011) where this quantity is obtained by aver-aging SSA estimations computed along 3 orthogonal direc-tions (x, y, z). The equivalent sphere radius was then com-puted from SSA using Eq. (4).
The anisotropy coefficient of permeability,A(K ), wascomputed from numerical estimations of the permeabilitytensor such asA(K) = Kz/Kxy .
The full tensor of the effective thermal conductivity (keff,in W m−1 K−1) of the 35 snow samples considered was com-puted using the periodic homogenization. The effective ther-mal conductivity of most snow samples presented here werealready described and included in a previous study (Calonneet al., 2011). Computations were extended to a few samplesadditionally considered in the present study. The coefficientof anisotropy of the effective thermal conductivityA(keff)was defined similarly to that of intrinsic permeability, by ra-tioing the vertical and horizontal components of the tensor.
2.5 Representative elementary volume
The representative elementary volume (REV) of our sam-ples was estimated by calculating values of a given vari-able from several sub-volumes of increasing sizes withinthe same sample. The size of the REV was assumed to bereached once values did not vary significantly when the sizeof the sub-volumes of computation increased. Note that theREV size depends on the variable and on the sample stud-ied: REVs with respect to permeability are generally equalto or larger than those for other variables, such as density,SSA or the effective thermal conductivity (Kanit et al., 2003;Rolland du Roscoat et al., 2007). Thus, a special attentionmust be paid to ensure that computations are carried out on asufficiently large volume.
3 Results and discussion
3.1 Overview of the numerical calculations
The average value of the three components of the intrinsicpermeability of snow, notedK, ranges from 4× 10⁻¹⁰ to6× 10−9 m2 for the 35 samples considered in this study. Thisrange of values is consistent with previous experimental andnumerical estimates of snow permeability (e.g.Sommerfeldand Rocchio, 1993; Albert et al., 2000; Luciano and Albert,2002; Domine et al., 2008; Arakawa et al., 2009; Courvilleet al., 2010; Zermatten et al., 2011). Density and SSA spanfrom 103 to 544 kg m−3 and from 4 to 56 m2 kg−1, respec-tively. For each sample, detailed values are provided in Ta-ble 2 of the Supplement.
Figure1 provides an overview of the above results for the35 samples of this study, showing the vertical (K∗
z ) and hor-izontal (K∗
xy) components of the dimensionless permeabilityvs. snow density. PP samples exhibit the largest values ofK∗
(1.05 forρs = 103 kg m−3), while the lowermost values areobtained for MF samples (2.16× 10⁻³ for ρs = 544 kg m−3).The figure clearly shows thatK∗
z , K∗xy and thusK∗ decrease
with increasingρs.
3.2 Anisotropy
As shown by Fig.1, values of the vertical (K∗z ) and horizontal
(K∗xy) components of the dimensionless permeability are not
identical, and some samples exhibit significant differences.Indeed, the anisotropy coefficients of permeability (A(K))range from 0.74 for a DF sample collected in the field, to1.66 for a particularly evolved DH sample obtained in coldroom. We note that this range ofA(K) values is consistentwith the values between 0.75 and 1.9 measured byLucianoand Albert(2002) on firn collected from 1 to 13 m depth atSummit, Greenland.
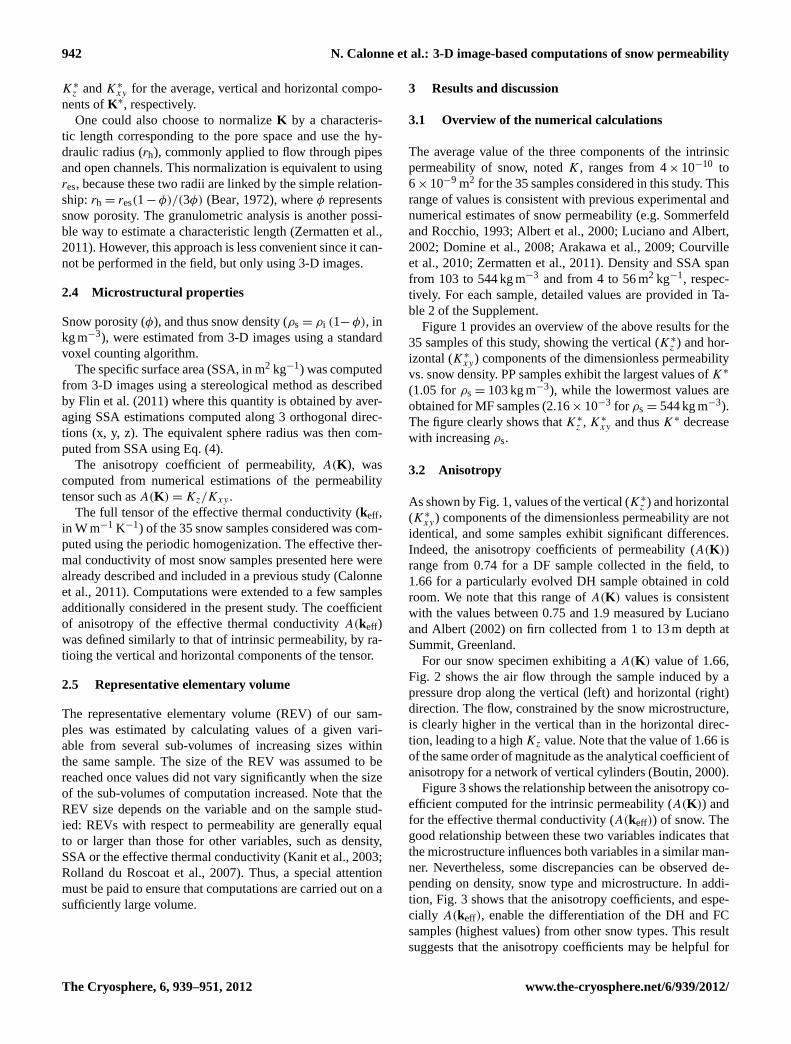
For our snow specimen exhibiting aA(K) value of 1.66,Fig. 2 shows the air flow through the sample induced by apressure drop along the vertical (left) and horizontal (right)direction. The flow, constrained by the snow microstructure,is clearly higher in the vertical than in the horizontal direc-tion, leading to a highKz value. Note that the value of 1.66 isof the same order of magnitude as the analytical coefficient ofanisotropy for a network of vertical cylinders (Boutin, 2000).
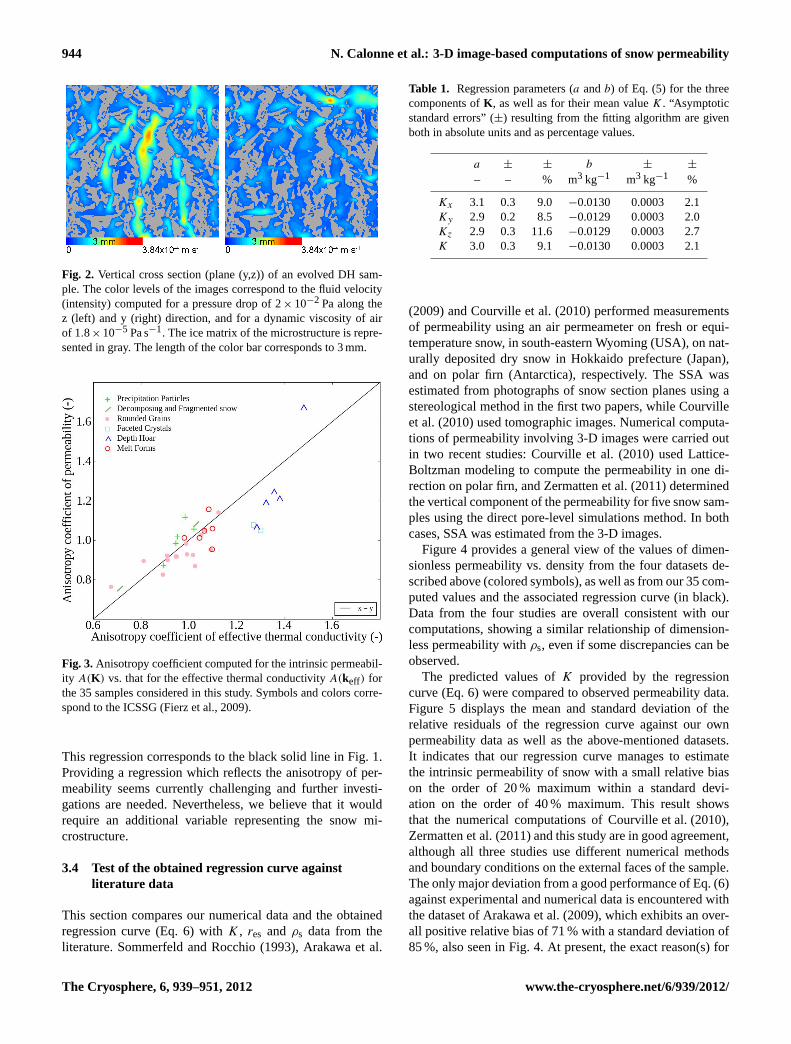
Figure3 shows the relationship between the anisotropy co-efficient computed for the intrinsic permeability (A(K)) andfor the effective thermal conductivity (A(keff)) of snow. Thegood relationship between these two variables indicates thatthe microstructure influences both variables in a similar man-ner. Nevertheless, some discrepancies can be observed de-pending on density, snow type and microstructure. In addi-tion, Fig.3 shows that the anisotropy coefficients, and espe-cially A(keff), enable the differentiation of the DH and FCsamples (highest values) from other snow types. This resultsuggests that the anisotropy coefficients may be helpful for
The Cryosphere, 6, 939–951, 2012 www.the-cryosphere.net/6/939/2012/

N. Calonne et al.: 3-D image-based computations of snow permeability 943
Fig. 1. Dimensionless permeability vs. snow density. “T” symbols indicate the values obtained by our numerical
computations. Tips and horizontal bars of the “T” shapes represent the vertical (K∗z ) and horizontal (K∗
xy)
components of K∗, respectively. Colors correspond to the ICSSG (Fierz et al., 2009). Analytical models,
numerical computations and fits are also plotted.
20
Fig. 1. Dimensionless permeability vs. snow density. “T” symbols indicate the values obtained by our numerical computations. Tips andhorizontal bars of the “T” shapes represent the vertical (K∗
z ) and horizontal (K∗xy ) components ofK∗, respectively. Colors correspond to the
ICSSG (Fierz et al., 2009). Analytical models, numerical computations and fits are also plotted.
quantitative classification of snow. However, due to the thinlayered nature of the snowpack (e.g.Schneebeli et al., 1999;Matzl and Schneebeli, 2006, 2010; Marshall and Johnson,2009), macroscopic measurements seem particularly chal-lenging to access such information except in special caseswhere the investigated material is sufficiently homogeneous(e.g.Luciano and Albert, 2002).
3.3 Regression analysis
The numerical data presented in Sect.3.1were used to builda regression curve allowing to infer the intrinsic permeabilityfrom snow density and equivalent sphere radius. Followingthe pioneering work ofShimizu(1970), a regression of thisform was seeked:
K/r2es= a exp(bρ). (5)
Other mathematical forms of equations were tested and noneof them proved better than Eq. (5). For the 35 samples stud-ied, the parametersa andb in Eq. (5) were calculated usingthe nonlinear least-squares Marquardt-Levenberg fitting al-gorithm, from the numerical estimates of permeability,res
andρs. Note that these computations were performed sepa-rately for each diagonal component ofK , as well as for theaverage valueK. The fitting algorithm used provides esti-mates of the uncertainty pertaining to the parametersa andb, in the form of “asymptotic standard errors”. These consti-tute an indication of the fit’s accuracy.
Table1 shows an overview of the fit parametersa andb
computed using the values ofKx , Ky , Kz andK, with theassociated “asymptotic standard errors”. For the whole com-putation, the “asymptotic standard errors” values are small(on the order of 10 % and 2 % fora and b, respectively),indicating a strong correlation between permeability, den-sity and res. Moreover, the table indicates that the param-eters obtained from the four different values ofK are in-significantly different from each other. The regression is thusnot affected by the anisotropy ofK presented in the previ-ous section. Based on our numerical estimates ofK , res andρs, which span a wide range of snow types, we propose thefollowing regression to infer an average permeability valueK from res andρs:
K = (3.0 ± 0.3)r2esexp((−0.0130± 0.0003)ρs). (6)
www.the-cryosphere.net/6/939/2012/ The Cryosphere, 6, 939–951, 2012
944 N. Calonne et al.: 3-D image-based computations of snow permeability
Fig. 2. Vertical cross section (plane (y,z)) of an evolved DH sample. The color levels of the images correspond
to the fluid velocity (intensity) computed for a pressure drop of 2x10⁻² Pa along the z (left) and y (right)
direction, and for a dynamic viscosity of air of 1.8x10⁻⁵ Pa s−1. The ice matrix of the microstructure is
represented in gray. The length of the color bar corresponds to 3 mm.
21
Fig. 2. Vertical cross section (plane (y,z)) of an evolved DH sam-ple. The color levels of the images correspond to the fluid velocity(intensity) computed for a pressure drop of 2× 10⁻² Pa along thez (left) and y (right) direction, and for a dynamic viscosity of airof 1.8×10⁻⁵ Pa s−1. The ice matrix of the microstructure is repre-sented in gray. The length of the color bar corresponds to 3 mm.
Fig. 3.Anisotropy coefficient computed for the intrinsic permeabil-ity A(K) vs. that for the effective thermal conductivityA(keff) forthe 35 samples considered in this study. Symbols and colors corre-spond to the ICSSG (Fierz et al., 2009).
This regression corresponds to the black solid line in Fig.1.Providing a regression which reflects the anisotropy of per-meability seems currently challenging and further investi-gations are needed. Nevertheless, we believe that it wouldrequire an additional variable representing the snow mi-crostructure.
3.4 Test of the obtained regression curve againstliterature data
This section compares our numerical data and the obtainedregression curve (Eq.6) with K, res and ρs data from theliterature.Sommerfeld and Rocchio(1993), Arakawa et al.
Table 1. Regression parameters (a andb) of Eq. (5) for the threecomponents ofK , as well as for their mean valueK. “Asymptoticstandard errors” (±) resulting from the fitting algorithm are givenboth in absolute units and as percentage values.
a ± ± b ± ±
– – % m3 kg−1 m3 kg−1 %
Kx 3.1 0.3 9.0 −0.0130 0.0003 2.1Ky 2.9 0.2 8.5 −0.0129 0.0003 2.0Kz 2.9 0.3 11.6 −0.0129 0.0003 2.7K 3.0 0.3 9.1 −0.0130 0.0003 2.1
(2009) andCourville et al.(2010) performed measurementsof permeability using an air permeameter on fresh or equi-temperature snow, in south-eastern Wyoming (USA), on nat-urally deposited dry snow in Hokkaido prefecture (Japan),and on polar firn (Antarctica), respectively. The SSA wasestimated from photographs of snow section planes using astereological method in the first two papers, whileCourvilleet al.(2010) used tomographic images. Numerical computa-tions of permeability involving 3-D images were carried outin two recent studies:Courville et al.(2010) used Lattice-Boltzman modeling to compute the permeability in one di-rection on polar firn, andZermatten et al.(2011) determinedthe vertical component of the permeability for five snow sam-ples using the direct pore-level simulations method. In bothcases, SSA was estimated from the 3-D images.
Figure4 provides a general view of the values of dimen-sionless permeability vs. density from the four datasets de-scribed above (colored symbols), as well as from our 35 com-puted values and the associated regression curve (in black).Data from the four studies are overall consistent with ourcomputations, showing a similar relationship of dimension-less permeability withρs, even if some discrepancies can beobserved.
The predicted values ofK provided by the regressioncurve (Eq.6) were compared to observed permeability data.Figure 5 displays the mean and standard deviation of therelative residuals of the regression curve against our ownpermeability data as well as the above-mentioned datasets.It indicates that our regression curve manages to estimatethe intrinsic permeability of snow with a small relative biason the order of 20 % maximum within a standard devi-ation on the order of 40 % maximum. This result showsthat the numerical computations ofCourville et al.(2010),Zermatten et al.(2011) and this study are in good agreement,although all three studies use different numerical methodsand boundary conditions on the external faces of the sample.The only major deviation from a good performance of Eq. (6)against experimental and numerical data is encountered withthe dataset ofArakawa et al.(2009), which exhibits an over-all positive relative bias of 71 % with a standard deviation of85 %, also seen in Fig.4. At present, the exact reason(s) for
The Cryosphere, 6, 939–951, 2012 www.the-cryosphere.net/6/939/2012/

N. Calonne et al.: 3-D image-based computations of snow permeability 945
Fig. 4. Dimensionless permeability vs. snow density. Our K∗ values (in black) are compared to results from
other studies (in color). Symbols correspond to the ICSSG (Fierz et al., 2009), excepting stars which are used
when firn is considered or when the snow type is not specified in the paper. Analytical models and fits are also
plotted.
23
Fig. 4.Dimensionless permeability vs. snow density. OurK∗ values (in black) are compared to results from other studies (in color). Symbolscorrespond to the ICSSG (Fierz et al., 2009), excepting stars which are used when firn is considered or when the snow type is not specifiedin the paper. Analytical models and fits are also plotted.
this discrepancy is (are) not understood. This could be due tothe difficulty of making reliable and reproducible measure-ments of permeability. A first source of error may be thephysical damage of the sample caused during its samplingor its handling (Sommerfeld and Rocchio, 1993). Shimizu(1970) and Sommerfeld and Rocchio(1993) also pointedout a bias linked to possible condensation/sublimation of thesnow microstructure induced by the airflow imposed throughthe snow sample during the measurement. Sample hetero-geneity could also be invoked.
Based on the mathematical equation of our proposed re-gression curve (Eq.6), accounting for a 10 % uncertainty onthe parametera of the equation (here we neglect the uncer-tainty on the parameterb of the equation – see Table1), andassuming thatres andρs both carry a measurement uncer-tainty on the order of 10 % (Matzl and Schneebeli, 2006;Painter et al., 2006; Gallet et al., 2009; Conger and McClung,2009; Arnaud et al., 2011), the propagation of these relativeerrors in terms ofK adds up to about 50 %. This experimen-tal error is of the same order of magnitude as the minimum
and maximum deviation found when applying the regressioncurve to independent data (black points in Fig.5).
3.5 Comparisons of the obtained regression curve tomodels and fits
This section compares the permeability estimates providedby our regression (Eq.6) and by various classical equationsproposed in the literature. We used the following regres-sions, analytical formulas or numerical computations (notethat Figs.1 and4 show the corresponding curves in terms ofdimensionless permeability:K∗
= K/r2es ):
i. We recall the regression fit (Eq.6) proposed in this study(referred to as “Calonne” in the relevant figures):
KCal = (3.0 ± 0.3)r2esexp((−0.0130± 0.0003)ρs).
ii. The well-known Shimizu’s fit (Shimizu, 1970) is ex-pressed as
KShi = 0.077D2× exp(−0.0078ρs), with D = 2res.
www.the-cryosphere.net/6/939/2012/ The Cryosphere, 6, 939–951, 2012

946 N. Calonne et al.: 3-D image-based computations of snow permeability
Fig. 5. Overview of the relative differences between experimental or numerically computed values of the
intrinsic permeability of snow from six datasets (colors) and their estimates based on the corresponding snow
density and equivalent sphere radius using various regression or analytical curves (x-axis). Black dots refer to
individual measurements of relative residual. The mean and standard deviation of the relative differences are
indicated as symbols and error bars, respectively.
24
Fig. 5.Overview of the relative differences between experimental or numerically computed values of the intrinsic permeability of snow fromsix datasets (colors) and their estimates based on the corresponding snow density and equivalent sphere radius using various regression oranalytical curves (x-axis). Black dots refer to individual measurements of relative residual. The mean and standard deviation of the relativedifferences are indicated as symbols and error bars, respectively.
iii. The self-consistent (SC) estimate was obtained assum-ing that the porous medium consists of a bicompositespherical pattern made of an internal spherical grainand an external fluid shell that ensures fluid connectiv-ity. The porous medium is defined using the most basicinformation, i.e. the porosity and the grain size. Usingthe SC method,Boutin (2000) showed that the aboveporous medium leads to the following estimate:
KSC = [r2es/(3β2)] × [−1+ (2+ 3β5)/(β(3+ 2β5))],
whereβ = (1− φ)(1/3).
iv. In the Carman-Kozeny (CK) model, the medium istreated as a bundle of capillarity tubes of equal length.By solving the Stokes equations simultaneously forall the channels passing through a cross-section nor-mal to the flow in the porous medium, the permeabil-ity is written asK = (c ×φ3)/(SSA2
I × (1−φ)2) whereSSAI is the specific surface area per unit of ice volume(SSAI = SSA×ρi , in m−1) and c a coefficient whichcharacterizes the geometry of the channels in the model.Empirically,c is found to be equal to 0.2 for many typesof porous media (Bear, 1972). The CK equation canthus be expressed as
KCK = (4r2es× φ3)/(180(1− φ)2).
v. Numerical values of permeability (Ksphere) were com-puted using the periodic homogenization method and a
finite element software, for a simple cubic packing ofspheres (Boutin and Geindreau, 2010). Note that at highdensity, where spheres interpenetrate, the SSA is com-puted from the effective surface formed by the sphere’sassembly.
Figure5allows to investigate the performance of the aboveequations by comparing their estimates (KCal, KShi, KSC,KCK andKsphere) against the independently observed perme-ability data presented in Sect.3.4. For each expression, theresult is given in terms of average and standard deviation ofthe relative residuals (in color on Fig.5). The whole set ofthe relative residual values is also shown by the black points.Note that in the case of the simple cubic packing of spheres,the correspondingK values, normalized byres and then ex-pressed as a function of density, were interpolated to be ableto computeKsphereestimates for all values of density andres.
Figure5 shows that the Carman-Kozeny (CK) model, self-consistent (SC) model, and the numerical computations for asimple cubic packing of spheres, predict the numerical valuesobtained in this study with a relative bias of the order of 20 %maximum within a factor 2 at most (maximum relative devi-ation of 40 %). These expressions are thus consistent withour proposed regression curve. In contrast, the regression fitproposed byShimizu(1970) behaves poorly against our nu-merical values, showing a negative relative bias of−36 %within a relative deviation of 45 % (see Fig.5). This situ-ation is also true for other datasets, where the fit proposedby Shimizu(1970) underestimatesK (relative bias between
The Cryosphere, 6, 939–951, 2012 www.the-cryosphere.net/6/939/2012/
N. Calonne et al.: 3-D image-based computations of snow permeability 947
Fig. 6. Dimensionless permeability versus snow density for three snow samples. Symbols and colors correspond
to the ICSSG (Fierz et al., 2009). For a given sample, each symbol represents a particular volume from which
K, SSA and ρs were computed. The largest volume corresponds to the total volume of the sample. Analytical
models and fits are also plotted.
25
Fig. 6. Dimensionless permeability versus snow density for three snow samples. Symbols and colors correspond to the ICSSG (Fierz et al.,2009). For a given sample, each symbol represents a particular volume from whichK , SSA andρs were computed. The largest volumecorresponds to the total volume of the sample. Analytical models and fits are also plotted.
21 % (± 23 %) and−57 % (± 31 %)). As pointed out by sev-eral studies (Sommerfeld and Rocchio, 1993; Jordan et al.,1999), we believe that this is largely due to the methodused byShimizu(1970) to estimate grain size. From snowcross-sections, he computed a grain diameterD = 2res=√
6ρs/πρin, wheren, the number of ice grains appearing inthe cross section per a unit area, is estimated by a countingprocess described as “a complicated-shaped grain havingm
remarkable constrictions was counted asm+ 1 grains”. Thisvisual method is subjective and may lead to erroneous esti-mates ofn and therefore ofK∗.
Over the whole ensemble of tested datasets, Fig.5 indi-cates that the best estimates are obtained using our regression(Eq.6), showing very small average values of relative resid-uals, from +13 % for the numerical study ofCourville et al.(2010) to −19 % forZermatten et al.(2011). Moreover, theset of values of relative residuals generally does not exceed± 50 %. Again, the predicted values for the dataset reportedby Arakawa et al.(2009) do not correspond to this situation,as discussed in Sect.3.4.
The predicted values using a simple packing of spheres arealso consistent with experimental and numerical estimatesfrom snow samples. In particular, this latter model behavesbetter than the CK and SC approach for the MF samples,where these two models fail to reflect the snow microstruc-ture and overestimate the permeability, as shown in Fig.1.These results can be explained by the fact that at low densitythe airflow around a snow particle is little affected by flowaround its neighbors. In contrast, at higher density, snow par-ticles are close together and the flow around one of them dis-turbs the flow around the others. This last phenomenon is notcaptured by analytical models.
Finally, Zermatten et al.(2011) indicate significant differ-ences between the CK model and their values, while Fig.5shows an excellent agreement between both (the CK modelpredicts their observed data with a relative bias of 0.8 %within a relative deviation of 27 %): they apparently plottedan erroneous CK equation, using the specific surface area perunit of snow volume (SSAV , in m−1) in the expression ofK = φ3/(5(1− φ)2SSA2
I ) instead of SSAI .
www.the-cryosphere.net/6/939/2012/ The Cryosphere, 6, 939–951, 2012
948 N. Calonne et al.: 3-D image-based computations of snow permeability
3.6 Representative elementary volume
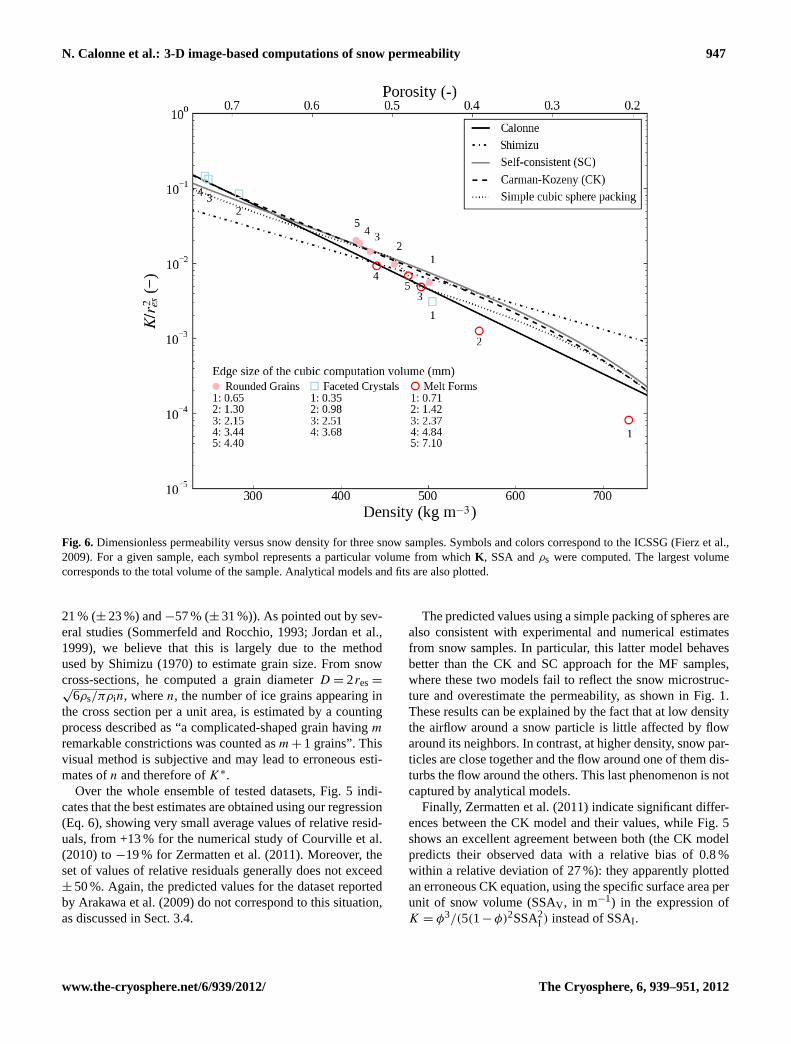
Permeability estimations of the REV were performed on onesample of each snow type and their edge size range from2.5 mm for the PP sample to 5.5 mm for the MF sample,which corresponds to volumes smaller or equal to those ofour 3-D images (see Supplement for further details).
For three snow samples (RG, FC and MF snow types),computations ofK , SSA andρs were performed on the totalavailable 3-D image and on sub-volumes of different sizes.Figure6 shows the obtained values ofK∗ as a function ofρs.By increasing the volume size of calculation (from volume1 to 4 or 5 in Fig.6), the K∗ value is closer and closer tothe result based on the previous volume, which is consistentwith the definition of a REV. We can also see that ifK , SSAand/orρs are computed on a volume smaller than their REV,the relationship betweenK∗ andρs remains consistent withthe regression curve (Eq.6) proposed in this study. This ob-servation confirms the robustness of the relationship betweenK , SSA andρs.
4 Conclusions
The intrinsic permeability tensorK was computed on 35tomographic images of various snow types by solving nu-merically a specific boundary value problem arising fromthe homogenization process on a representative elementaryvolume (REV). The equivalent sphere radius (res) was usedas a characteristic length of the microstructure to reduceKto a dimensionless tensorK∗. A regression equation usingthe 35 computed values of mean permeability (K), density(ρs) and equivalent sphere radius was proposed, such as:K = (3.0 ± 0.3)r2
esexp((−0.0130± 0.0003)ρs) and com-pared to existing literature data. Our main conclusions aresummarized below:
1. The intrinsic permeability of snow can be anisotropicdepending on the snow microstructure. The anisotropycoefficients of permeability range from 0.74 for a sam-ple of decomposing precipitation particles collected inthe field, to 1.66 for a particularly evolved depth hoarspecimen, and are consistent with the anisotropy coef-ficient of the effective thermal conductivity. It appearsthat the use of these coefficients could be helpful forthe quantitative classification of snow, as it may enableto distinguish the depth hoar and the facetted crystalsfrom other snow types.
2. Permeability, density and equivalent sphere radius, di-rectly related to the specific surface area, are stronglycorrelated. The equivalent sphere radius is thus a rele-vant characteristic length for permeability, which in ad-dition is rather easy to determine in the field or from3-D images. However, this strong correlation betweensnow permeability, density and SSA precludes consid-
ering them as independent variables for the sake of ob-jective snow classification.
3. The anisotropy of permeability does not affect the re-gression curve performed on the 35 snow samples. In-deed, very similar regression curves have been com-puted by using each diagonal component ofK as wellas the average of these three terms. Thus, the proposedregression allows estimating an average permeabilityvalue only.
4. Our numerical computations of permeability from 3-Dimages are consistent with datasets from other experi-mental and numerical studies. Moreover, our regressionsucceeds in estimating the permeability data of previousstudies with a small relative bias on the order of 20 %maximum, within a factor≈ 2 maximum relative devi-ation (40 %), except for the dataset ofArakawa et al.(2009) for which the agreement is lower (positive rela-tive bias of 71 % with a standard deviation of 85 %). Bycomparing with other equations from theoretical mod-els, fits and numerical data available in literature, ourregression appears to be the best currently available sim-ple relationship linking the average value of permeabil-ity to snow density and specific surface area. In par-ticular, the well known fit proposed byShimizu(1970)seems to significantly underestimate the permeability ofsnow for most of the tested datasets, most probably dueto an inconsistency between the equivalent sphere ra-dius derived from the specific surface area of snow andthe empirically-defined snow grain size used by this au-thor.
Supplementary material related to this article isavailable online at:http://www.the-cryosphere.net/6/939/2012/tc-6-939-2012-supplement.pdf.
Acknowledgements.Funding by Meteo-France, INSU-LEFE andDigitalSnow (ANR-11-BS02-009) is acknowledged. We thankscientists of the ESRF ID19 beamline (J. Baruchel, E. Boller,W. Ludwig, X. Thibault) and of the 3S-R laboratory (J. Desrues),where the 3-D images were obtained. We also thank CEN staff fortechnical support, F. Domine (Takuvik International Laboratory)for useful discussions and H. Arakawa (YAGAI-KAGAKU Co.,Ltd) for providing us his dataset. We thank two anonymousreviewers for useful suggestions which improved the quality of themanuscript.
Edited by: A. Nolin
The Cryosphere, 6, 939–951, 2012 www.the-cryosphere.net/6/939/2012/
N. Calonne et al.: 3-D image-based computations of snow permeability 949
The publication of this article is financed by CNRS-INSU.
References
Akitaya, E.: Studies of depth hoar, Low. Temp. Sci., Series A, 26,1–67, 1974.
Albert, M., Shuman, C., Courville, Z., Bauer, R., Fahnestock, M.,and Scambos, T.: Extreme firn metamorphism: impact of decadesof vapor transport on near-surface firn at a low-accumulationglazed site on the East Antarctic plateau, Ann. Glaciol., 39, 73–78,doi:10.3189/172756404781814041, 2004.
Albert, M. R.: Effects of snow and firn ventilationon sublimation rates, Ann. Glaciol., 35, 52–56,doi:10.3189/172756402781817194, 2002.
Albert, M. R., Shultz, E. F., and Perron, F. E.: Snow and firn per-meability at Siple Dome, Antarctica, Ann. Glaciol., 31, 353–356,doi:10.3189/172756400781820273, 2000.
Arakawa, H., Izumi, K., Kawashima, K., and Kawamura, T.: Studyon quantitative classification of seasonal snow using specific sur-face area and intrinsic permeability, Cold. Reg. Sci. Technol., 59,163–168,doi:10.1016/j.coldregions.2009.07.004, 2009.
Arakawa, H., Izumi, K., Kawashima, K., and Ishii, Y.: Relation-ship between intrinsic permeability and microstructure of sea-sonal snow cover, in: SEPPYO, Vol. 72, 311–321, Japanese So-ciety of Snow and Ice, 2010 (in Japanese with English abstract).
Arnaud, L., Picard, G., Champollion, N., Domine, F., Gallet, J.-C.,Lefebvre, E., Fily, M., and Barnola, J.-M.: Measurement of ver-tical profiles of snow specific surface area with a 1 cm resolutionusing infrared reflectance: instrument description and validation,J. Glaciol., 57, 17–29,doi:10.3189/002214311795306664, 2011.
Arns, C., Knackstedt, M., Pinczewski, W. V., and Martys, N. S.:Virtual permeametry on microtomographic images, J. Petrol. Sci.Eng., 45, 41–46,doi:10.1016/j.petrol.2004.05.001, 2004.
Arns, C. H., Knackstedt, M. A., Pinczewsk, W. V., and Lindquist,W. B.: Accurate estimation of transport properties from mi-crotomographic images, Geophys. Res. Lett., 28, 3361–3364,doi:10.1029/2001GL012987, 2001.
Auriault, J.-L.: Heterogeneous medium. Is an equivalent descriptionpossible?, Int. J. Eng. Sci., 29, 785–795, 1991.
Auriault, J.-L.: Heterogeneous periodic and random media. Are theequivalent macroscopic descriptions similar?, Int. J. Eng. Sci.,49, 806–808, 2011.
Auriault, J.-L., Boutin, C., and Geindreau., C.: Homogenization ofcoupled phenomena in heterogenous media, Wiley-ISTE, Lon-don, 2009.
Bader, H.: Mineralogische und strukturelle Charakterisierung desSchnees und seiner Metamorphose, in: Der Schnee und seineMetamorphose, edited by: Bader, H., Haefeli, R., Buchker, E.,Neher, J., Eckel, O., and Thams, C., 1–61, Kummerly & Frey,Bern, Beitrage zur Geologie der Schweiz, Geotechnische SerieHydrologie 3, 1939.
Bear, J.:Dynamics of fluids in porous media, Dover, 1972.
Bernard, D., Nielsen, O., Salvo, L., and Cloetens, P.: Permeabil-ity assessment by 3D interdendritic flow simulations on micro-tomography mappings of Al-Cu alloys, Mat. Sc. Eng. A, 392,112–120, 2005.
Boutin, C.: Study of permeability by periodic and self consistenthomogenization, Eur. J. Mech. A/Solids, 19, 603–632, 2000.
Boutin, C. and Geindreau, C.: Periodic homogenization and consis-tent estimates of transport parameters through sphere and poly-hedron packings in the whole porosity range, Phys. Rev. E, 82,036313, 1–18, 2010.
Brucker, L., Picard, G., Arnaud, L., Barnola, J.-M., Schneebeli, M.,Brunjail, H., Lefebvre, E., and Fily, M.: Modeling time series ofmicrowave brightness temperature at Dome C, Antarctica, usingvertically resolved snow temperature and microstructure mea-surements, J. Glaciol., 57, 171–182, 2011.
Brun, E. and Touvier, F.: Etude experimentale de la convection ther-mique dans la neige, J. Phys., 48, 257–262, 1987.
Brzoska, J.-B., Coleou, C., Lesaffre, B., Borel, S., Brissaud, O.,Ludwig, W., Boller, E., and Baruchel, J.: 3D visualization ofsnow samples by microtomography at low temperature, ESRFNewsletter, 32, 22–23, 1999.
Calonne, N., Flin, F., Morin, S., Lesaffre, B., du Roscoat, S. R., andGeindreau, C.: Numerical and experimental investigations of theeffective thermal conductivity of snow, Geophys. Res. Lett., 38,L23501,doi:10.1029/2011GL049234, 2011.
Chen, S. and Baker, I.: Evolution of individual snowflakesduring metamorphism, J. Geophys. Res., 115, D21114,doi:10.1029/2010JD014132, 2010.
Colbeck, S. C.: A theory for water flow through a lay-ered snowpack, Water Resour. Res., 11, 261–266,doi:10.1029/WR011i002p00261, 1975.
Colbeck, S. C.: An analysis of water flow in dry snow, Water Re-sour. Res., 12, 523–527,doi:10.1029/WR012i003p00523, 1976.
Colbeck, S. C.: Air movement in snow due to windpumping, J.Glaciol., 35, 209–213, 1989.
Colbeck, S. C.: A model of wind pumping for layered snow, J.Glaciol., 43, 60–65, 1997.
Coleou, C., Lesaffre, B., Brzoska, J.-B., Ludwig, W., and Boller,E.: Three-dimensional snow images by X-ray microtomography,Ann. Glaciol., 32, 75–81,doi:10.3189/172756401781819418,2001.
Conger, S. M. and McClung, D. M.: Comparison of density cuttersfor snow profile observations, J. Glaciol, 55, 163–169, 2009.
Courville, Z., Horhold, M., Hopkins, M., and Albert, M.: Lattice-Boltzmann modeling of the air permeability of polar firn, J. Geo-phys. Res., 115, F04032,doi:10.1029/2009JF001549, 2010.
Domine, F., Albert, M., Huthwelker, T., Jacobi, H.-W.,Kokhanovsky, A. A., Lehning, M., Picard, G., and Simp-son, W. R.: Snow physics as relevant to snow photochemistry,Atmos. Chem. Phys., 8, 171–208,doi:10.5194/acp-8-171-2008,2008.
Ene, H. and Sanchez-Palencia, E.: Equations et phenomenes desurface pour l’ecoulement dans un modele de milieu poreux, J.Mecanique, 14, 73–108, 1975.
Ferreol, B. and Rothman, D.: Lattice-Boltzmann simulations offlow through Fontainebleau sandstone, Transport Porous Med.,20, 3–20,doi:10.1007/BF00616923, 1995.
Fierz, C., Armstrong, R. L., Durand, Y., Etchevers, P., Greene, E.,McClung, D. M., Nishimura, K., Satyawali, P. K., and Sokratov,
www.the-cryosphere.net/6/939/2012/ The Cryosphere, 6, 939–951, 2012

950 N. Calonne et al.: 3-D image-based computations of snow permeability
S. A.: The international classification for seasonal snow on theground, IHP-VII Technical Documents in Hydrology no. 83,IACS Contribution no. 1, 2009.
Flin, F. and Brzoska, J.-B.: The temperature gradient meta-morphism of snow: vapour diffusion model and applica-tion to tomographic images, Ann. Glaciol., 49, 17–21,doi:10.3189/172756408787814834, 2008.
Flin, F., Brzoska, J.-B., Lesaffre, B., Coleou, C., and Pieritz, R. A.:Three-dimensional geometric measurements of snow microstruc-tural evolution under isothermal conditions, Ann. Glaciol., 38,39–44,doi:10.3189/172756404781814942, 2004.
Flin, F., Lesaffre, B., Dufour, A., Gillibert, L., Hasan, A., Rol-land du Roscoat, S., Cabanes, S., and Pugliese, P.: On the com-putations of specific surface area and specific grain contact areafrom snow 3D images, in: P. C. I., edited by: Furukawa, Y., 321–328, Hokkaido University Press, Sapporo, JP, proceedings of the12th International Conference on the Physics and Chemistry ofIce held at Sapporo, Japan on 5–10 September 2010, 2011.
Freitag, J., Dobrindt, U., and Kipfstuhl, J.: A new method forpredicting transport properties of polar firn with respect togases on the pore-space scale, Ann. Glaciol., 35, 538–544,doi:10.3189/172756402781816582, 2002.
Freitag, J., Wilhelms, F., and Kipfstuhl, S.: Microstructure-dependent densification of polar firn derived fromX-ray microtomography, J. Glaciol., 50, 243–250,doi:10.3189/172756504781830123, 2004.
Gallet, J.-C., Domine, F., Zender, C. S., and Picard, G.: Measure-ment of the specific surface area of snow using infrared re-flectance in an integrating sphere at 1310 and 1550 nm, TheCryosphere, 3, 167–182,doi:10.5194/tc-3-167-2009, 2009.
Grannas, A. M., Jones, A. E., Dibb, J., Ammann, M., Anastasio, C.,Beine, H. J., Bergin, M., Bottenheim, J., Boxe, C. S., Carver, G.,Chen, G., Crawford, J. H., Domine, F., Frey, M. M., Guzman,M. I., Heard, D. E., Helmig, D., Hoffmann, M. R., Honrath, R.E., Huey, L. G., Hutterli, M., Jacobi, H. W., Klan, P., Lefer, B.,McConnell, J., Plane, J., Sander, R., Savarino, J., Shepson, P. B.,Simpson, W. R., Sodeau, J. R., von Glasow, R., Weller, R., Wolff,E. W., and Zhu, T.: An overview of snow photochemistry: evi-dence, mechanisms and impacts, Atmos. Chem. Phys., 7, 4329–4373,doi:10.5194/acp-7-4329-2007, 2007.
Grenfell, T. and Warren, S.: Representation of a nonspherical iceparticle by a collection of independent spheres for scattering andabsorption of radiation, J. Geophys. Res., 104, 31697–31709,doi:10.1029/2000JC000414, 1999.
Horhold, M. W., Albert, M. R., and Freitag, J.: The impact ofaccumulation rate on anisotropy and air permeability of po-lar firn at a high-accumulation site, J. Glaciol., 55, 625–630,doi:10.3189/002214309789471021, 2009.
Jordan, R. E., Hardy, J. P., Perron, F. E., and Fisk, D. J.: Airpermeability and capillary rise as measures of the porestructure of snow: an experimental and theoretical study,Hydrol. Proc., 13, 1733–1753,doi:10.1002/(SICI)1099-1085(199909)13:12/13<1733::AID-HYP863>3.0.CO;2-2,1999.
Kaempfer, T. U., Schneebeli, M., and Sokratov, S. A.: A microstruc-tural approach to model heat transfer in snow, Geophys. Res.Lett., 32, L21503,doi:10.1029/2005GL023873, 2005.
Kanit, T., Forest, S., Galliet, I., Mounoury, V., and Jeulin, D.: De-termination of the size of the representative elementary volume
element for random composites: statistical and numerical ap-proach, Int. J. Solids Struct., 40 3647–3679,doi:10.1016/S0020-7683(03)00143-4, 2003.
Katsushima, T., Kumakura, T., and Takeuchi, Y.: A multiple snowlayer model including a parameterization of vertical water chan-nel process in snowpack, Cold Reg. Sci. Technol., 59, 143–151,2009.
Koivu, V., Decain, M., Geindreau, C., Mattila, K., Bloch, J.-F.,and Kataja, M.: Transport properties of heterogeneous materi-als. Combining computerised X-ray micro-tomography and di-rect numerical simulations, Int. Comput. Fluid Dyn., 10, 713–721, 2009.
Luciano, G. L. and Albert, M. R.: Bidirectional permeabil-ity measurements of polar firn, Ann. Glaciol., 35, 63–66,doi:10.3189/172756402781817095, 2002.
Marshall, H.-P. and Johnson, J. B.: Accurate inversion of high-resolution snow penetrometer signals for microstructural andmicromechanical properties, J. Geophys. Res., 114, F04016,doi:10.1029/2009JF001269, 2009.
Martys, N. and Chen, H. D.: Simulation of multicompo-nent fluids in complex three-dimensional geometries bythe lattice Boltzmann method, Phys. Rev. E, 53, 743–750,doi:10.1103/PhysRevE.53.743, 1996.
Matzl, M. and Schneebeli, M.: Measuring specific surface area ofsnow by near-infrared photography, J. Glaciol., 52, 558–564,2006.
Matzl, M. and Schneebeli, M.: Stereological measurementof the specific surface area of seasonal snow types:Comparison to other methods, and implications for mm-scale vertical profiling, Cold Reg. Sci. Technol., 64, 1–8,doi:10.1016/j.coldregions.2010.06.006, 2010.
Mei, C. C. and Auriault, J. L.: The effect of inertia on flow throughporous medium, J. Fluid. Mech., 222, 647–663, 1991.
Neumann, T. A.: Effects on firn ventilation on Geochemistry of po-lar snow, Ph.D. thesis, University of Washington, 2003.
Painter, T. H., Molotch, N. P., Cassidy, M., Flanner, M., and Stef-fen, K.: Contact spectroscopy for determination of stratigraphyof optical grain size, J. Glaciol, 53, 121–127, 2006.
Pielmeier, C. and Schneebeli, M.: Stratigraphy and changes in hard-ness of snow measured by hand, ramsonde and snow micropenetrometer: a comparison with planar sections, Cold Reg. Sci.Technol., 37, 393–405, 2003.
Powers, D., O’Neill, K., and Colbeck, S. C.: Theory of Natural Con-vection in Snow, J. Geophys. Res., 90, 10641–10649, 1985.
Raymond, C. and Tusima, K.: Grain coarsening of water-saturatedsnow, J. Glaciol., 22, 83–105, 1979.
Rolland du Roscoat, S., Decain, M., Thibault, X., Geindreau,C., and Bloch, J.-F.: Estimation of microstructural propertiesfrom synchrotron X-ray microtomography and determinationof the REV in paper materials, Acta Mater., 55, 2841–2850,doi:10.1016/j.actamat.2006.11.050, 2007.
Schneebeli, M. and Sokratov, S. A.: Tomography of tem-perature gradient metamorphism of snow and associatedchanges in heat conductivity, Hydrol. Process., 18, 3655–3665,doi:10.1002/hyp.5800, 2004.
Schneebeli, M., Pielmeier, C., and Johnson, J. B.: Measuring snowmicrostructure and hardness using a high resolution penetrom-eter, Cold Reg. Sci. Technol., 30, 101–114,doi:10.1016/S0165-232X(99)00030-0, 1999.
The Cryosphere, 6, 939–951, 2012 www.the-cryosphere.net/6/939/2012/

N. Calonne et al.: 3-D image-based computations of snow permeability 951
Shimizu, H.: Air permeability of deposited snow, Contributionsfrom the Institute of Low Temperature Science, A22, 1–32, 1970.
Sommerfeld, R. A. and Rocchio, J. E.: Permeability measurementson new and equitemperature snow, Water Resour. Res., 29, 2485–2490,doi:10.1029/93WR01071, 1993.
Spanne, P., Thovert, J. F., Jacquin, C. J., Lindquist, W. B., Jones,K. W., and Adler, P. M.: Synchrotron computed microtomogra-phy of porous media: topology and transports, Phys. Rev. Lett.,73, 2001–2004,doi:10.1103/PhysRevLett.73.2001, 1994.
Sturm, M. and Johnson, J. B.: Natural convection in thesubarctic snow cover, J. Geophys. Res., 96, 11657–11671,doi:10.1029/91JB00895, 1991.
Thoemen, H., Walther, T., and Wiegmann, A.: 3D simulation ofmacroscopic heat and mass transfer properties from the mi-crostructure of wood fibre networks, Comp. Sci. Techn., 68, 608–616,doi:10.1016/j.compscitech.2007.10.014, 2008.
Waldner, P. A., Schneebeli, M., Schultze-Zimmermann, U., andFluhler, H.: Effect of snow structure on water flow and solutetransport, Hydrol. Proc., 18, 1271–1290,doi:10.1002/hyp.1401,2004.
Wiegmann, A.: Computation of the permeability of porous materi-als from their microstructure by FFF-Stokes, Fraunhofer ITWMKaiserslautern, Technical Report 129, 2007.
Yamaguchi, S., Katsushima, T., Sato, A., and Kumakura, T.: Wa-ter retention curve of snow with different grain sizes, Cold Reg.Sci. Technol., 64, 87–93,doi:10.1016/j.coldregions.2010.05.008,2010.
Zermatten, E., Haussener, S., Schneebeli, M., and Steinfeld,A.: Tomography-based determination of permeability andDupuit-Forchheimer coefficient of characteristic snow samples,J. Glaciol., 57, 811–816,doi:10.3189/002214311798043799,2011.
www.the-cryosphere.net/6/939/2012/ The Cryosphere, 6, 939–951, 2012