Cross-sectional transmission electron microscopy study of ...
Upload
sumit-prajapatiCategory
view
19.997download
9description

Cross Sectional Study
Prof. Wei-Qing Chen MD PhDDepartment of Biostatistics and Epidemiology
School of Public Health87332199

Learning/Performance Objectives
To develop an understanding of: What cross-sectional study is
The use of this study
The basic methodology of it
Advantage and disadvantage of is

Definition
Cross-sectional studies are studies of prevalence. Proportion with an attribute or disease / Number of subjects = Prevalence. a type of observational or descriptive study the research has no control over the exposure of interest (e.q. diet).
3 important questions to consider: Definition of Case Definition of the Population Are cases and non-cases from an unbiased sample of the population?


Definition
“Snapshot Studies” (Paffenbarger, 1988) Observations at a single hypothetical point
in time Each subject assessed once at point in
time. Point Prevalence Studies

Definition
also called a Prevalence survey A study that is quick and
inexpensive to complete. Designed to determine “ what is
happening ? right now”

Basic features
“Snapshot” of a population, a “still life” Assesses both the exposure and outcome
simultaneously, at a single point in time Calculates prevalence, but not incidence A study that is quick and inexpensive to
complete. The first step in testing associations
Uses
Prevalence survey: The studies are commonly used to describe the burden of disease in the community and its distribution.
Describe population characteristics: They are also commonly used to describe population characteristics, often in terms of person (who?) and place (where?)
.e.q. The British National Diet and Nutrition Survey or Nutrition and
Health Survey in Taiwan To describe various age groups in the population in terms of
food and nutrient intake and range of other personal and lifestyle characteristics.

Uses
Prevalence used in planning Individual: Pre-treament probability for Rx and Dx Population: Health care services
Examine associations among variables Hypothesis generating for causal links Prediction rule eg, Ottawa ankle rule – XR if 3
factors present

KAP (knowledges, attitudes, and practices ) study: KAP studies are purely descriptive and help to build
up a better understanding of the behavior of the population, without necessarily relating this to any disease or health outcome.
Management tool: health service managers and planners may make use
of cross-sectional survey to assess utilization and effectiveness of service.
Uses

Uses
Identify and describe a problem Collect information for planning e.g. surveys of
immunisation, antenatal care, coverage Evaluate utilisation rates of services Monitoring health status of a community by
regular repeated surveys

Uses
Hypothesis generating for causal links
Method of Difference: If frequency of a disease is markedly different between two groups then it is likely to be caused by a particular factor that differs between them.
Method of Agreement: If a factor commonly occurs in which a disease occurs with high frequency then the factor is very likely associated with the disease.
Concomitant variation: Frequency of a factor varies in proportion to frequency of disease.

Measure: Prevalence
Measure exposure and outcome variables at one point in time.
Main outcome measure is prevalence
P = Number of people with disease x at time t
Number of people at risk for disease x at time t
Prevalence=k x Incidence x Duration

Measure: Prevalence
Example:RQ: What is the prevalence of chronic pain after hernia surgery? Exposure of interest: Hernia surgery Outcome of interest: Chronic pain (lasting for more than 3 months)Methods: questionnaire surveySample:All patients who had a hernia procedure between 1995-1997 n=350
Results: Period prevalence chronic pain = 30% (CI 95% 24 - 36%)Point prevalence chronic pain = 25% (on day of survey)
Prevalence vs. Incidence
Prevalence
The total number of cases at a point in time
Includes both new and old cases
Incidence The number of new cases over time

Interpretation
Measures prevalence – if incidence is our real interest, prevalence is often not a good surrogate measure
Studies only “survivors” and “stayers”
May be difficult to determine whether a “cause” came before an “effect” (exception: genetic factors)

Design of cross-sectional survey

Basic Design
Cross-sectional study involves no follow-up of individuals, so are often grouped together
In addition, this study depends on a full accounting or random cross-section of the population
This design is capable of measuring prevalences and open population incidence rates:
Prevalence or rate, group k
Compare prevalence or
rates
Random sample of population divided
into exposure groups
Prevalence or rate, group 1
Prevalence or rate, group 2
::

Study Design
ExposureExposure(Risk Factor)(Risk Factor)
Disease Disease (Outcome)(Outcome)
++
++
__
__

Things to consider when designing a cross-sectional study (survey)
What is your research question? Is the design appropriate for your study? Who are you going to study? How are you going to obtain your sample?
Everyone who is eligible should have an equal chance of being invited to take part
Is there a risk of ‘selection bias’? E.g. taking people attending a specialist clinic; might not be
‘representative’ of all patients with that condition Selection bias is a threat
How you will collect your exposure/outcome data Think about analysis (proportion %, denominator)

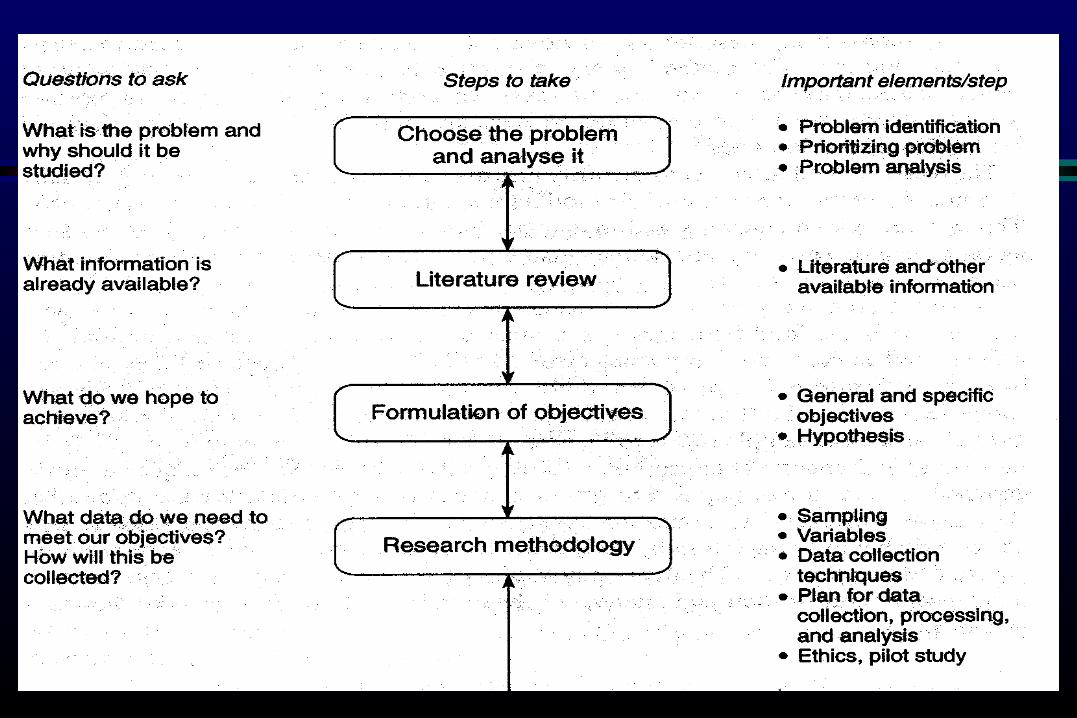
The problem to be studied must be clearly described and a thorough literature review undertaken before starting the data collection.
Specific objectives need to be formulated. The information has to be collected and data
collection techniques need to be decided. Sampling is a particularly important issue to
ensure that the objectives can be met in the most efficient way.
Things to consider when designing a cross-sectional study (survey)

In Cross-sectional studies think of: Sampling Procedures. Clear definition of Target Population. Clear definition of outcome. Clear definition of risk factors. Remember Confounders.
Things to consider when designing a cross-sectional study (survey)

Fieldwork needs planning: Who is available to collect the data ? Do they need training ? If more than one is to collect the data then it is
necessary to assess between-observer variation.
The collection, coding and entry of data need planning.
A pilot study is essential to test the proposed methods and make any alternations as necessary.
* The steps are summarized in Fig 13.5*


Sampling
Sampling A sample is a subset of the population Can be random or non-random; can be
representative or non-representative Different types of sampling This is major challenge when doing cross-
sectional studies

Sample size estimation
Purpose: adequate power of test basic formula and necessary components
alpha (one or two-sided) and beta error usually alpha = 0.05, beta = 0.2 then power = 1-beta = 0.8
effective size: mean, difference, ratio, ... standard deviation
from prior information or other related source
formula/tables/softwares

Types of sample
1) The Random Sample
2) Systematic Sampling
3) Stratified Sampling
4) Cluster and Multistage Sampling
5) Convenience Sampling

1-1) The Random Sample
A Random Sample is the most representative sample of all population. = Golden Standard= Every member of population must have an equal chance of being picked for the sample.

1-2) Systematic Sampling
800 women are all routinely tested for genital chlamydia as part of a general health check in the 5 women’s clinics for 12 months. You decide that a sample of 500 women will be big enough. Suppose you find that there are 8000 such patients' records in total, and you decide to take every sixteenth record, which will give you 500 records in total. This is a systematic sample.
Provided that a sample of 500 is big enough to detect a condition which might occur infrequently, the sample should be reasonably representative--but representative of the woman attending your five clinics, and not necessarily representative of the entire 16+ female population of the USA.
Notice that taking a systemic sample need a sampling frame.

I-3) Stratified Sampling
Suppose you have a particular interest in the occurrence of genital chlamydia in women from some ethnic minority, who you know account for only 10% of your population.
To ensure that these women are represented in adequate numbers in your sample (around 10% of the sample), you could separate out the ethnic minority women's records first and then take every sixteenth record from both groups, until you've got 50 from the minority group and 450 from the rest.
This process is known as stratified sampling. You need a sampling frame for this procedure .

I-4) Cluster and Multistage Sampling
You could expand your population to include all of the women’s clinics in your health authority; let's say there are 30 clinics.
You could take a random sample of five clinics from these 30, and your subjects would then be all of the women in these selected clinics.
This approach is known as cluster sampIing.
An alternative approach would be to take a random selection from the 30 clinics and then take a random selection of patients in those clinics. This is multistage sampling. A sampling frame is not necessary for this method of sampling .

I-5) Convenience Sampling
One approach to the sampling problem is to take as your sample those subjects who are conveniently to hand: perhaps the last 100 patients to attend a certain clinic, or all of those patients who attended during the past 12 months.
The attraction of convenience sampling is that it is just that, convenient.
One obvious problem with this approach is that it is questionable what population such a sample is representative of.
In truth, it is extremely difficult to take anything like a true random sample in the healthcare arena.
The practical and ethical difficulties associated with such a process are simply too great.

Data Collection
Ordinary data : medical records and reporting cards or tables
Advantage: Easy obtaining ; easily making dynamic analysis and
secular trend ; easily obtain lots of valuable information in short time.
Disadvantage: Poor in the whole ; criteria of diagnosis being
different at different period ; poor in reliability

Temporarily data : To reach a certain aim, a special survey will be conducted for collecting data based on study design and the aim of survey.
Data Collection

face to face interview mail questionnaire telephone interview Self-administrated questionnaire Medical examination Laboratory test
Methods for collecting data

To sure what data shall be obtained To sure which index will be used Methods for collecting data Criteria of disease diagnosis Definition of variables Training investigators
Issues in collecting data

Dietary assessment in cross-sectional studies
Some characteristics of dietary assessment methods for cross-sectional studies Measures an individual’s intake at one point in
time. Does not require long-term follow up or repeat
measures Valid Reproducible Suitable Cost within study budget

Dietary method application
Food records using household measures have been used in cross-sectional studies.
The recall method attempts to quantify diet over a defined period in the past usually 24 hours.
The most commonly used dietary assessment method which attempts to measure usual intake is the food frequency questionnaire (FFQ).


Analysis
Before starting any formal analysis, the data should be checked for any errors and outlines.
Obvious error must be corrected. The records of outliners should be examined
excluded Checking normality of data distribution.
e.q. using the Kolmogorov-Smirnov Goodness of Fit Test.

Analysis
Descriptive analyses Analysis of differences Analysis of association / relationship Multivariable analysis
Analysis
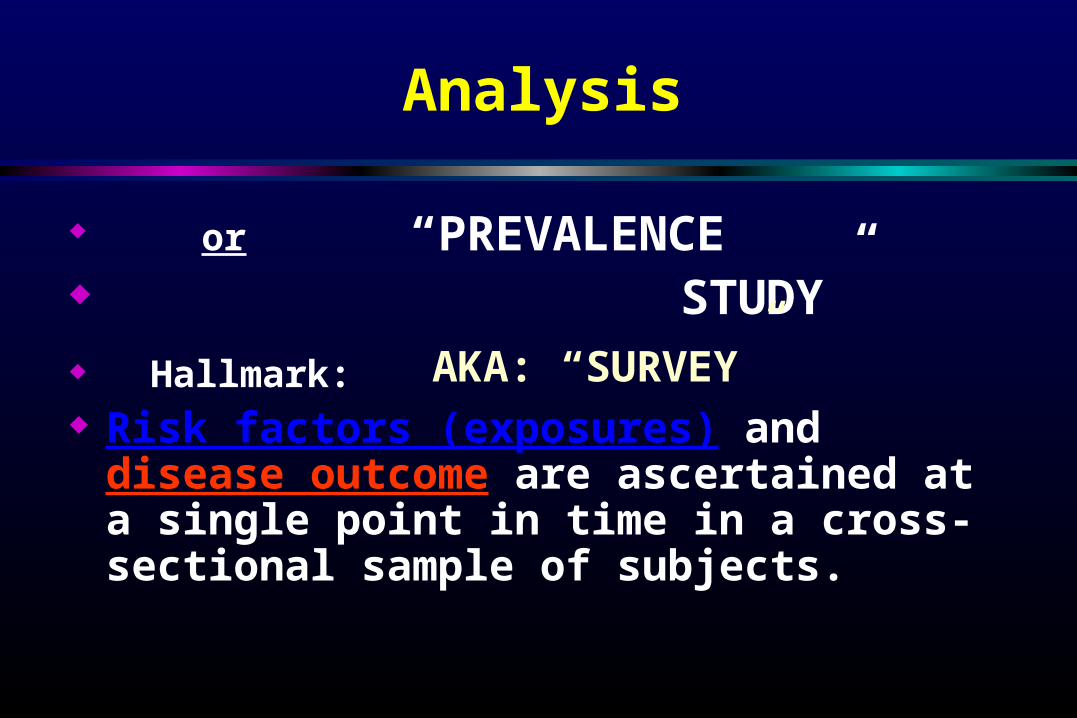
or “PREVALENCE STUDY” Hallmark: Risk factors (exposures) and disease
outcome are ascertained at a single point in time in a cross-sectional sample of subjects.
AKA: “SURVEY”
Standard descriptive statistics can then be used: mean, median, quartiles, and mode; measure of dispersion or variability such as : standard deviation; measure precision such as: standard error, and confidence intervals.
Mean can be compared using t-tests or analysis of variance (ANOVA).
More complex multivariate analysis can be carried out such as multiple and logistic regression.
Analysis

Analysis
(52%)
(19%)
GrapeGrape
TomatoTomato
Prevalence ratio = Prevalence ratio = 52%52%//19%19% = 2.6 = 2.6
(+)(+) (–)(–)DZ = RashDZ = Rash
183
43
95 88
8 35

Analysis
Instead of looking at a ratio of prevalences, we can also look at a ratio of odds.
Odds are not intuitively appealing: they are the likelihood of an event occurring divided by the likelihood of the event not occurring.

Analysis
358
8895GrapeGrape
TomatoTomato
(+)(+) --DZ = RashDZ = Rash
95/183PR= ------- =2.6
8/43
Odds of grape work in rash pts:
(95/103)/(8/103)= 95/8=11.9
Odds of grape work in healthy:
(88/123)/(35/123)= 88/35=2.5
183
43
103 123

Analysis
358
8895GrapeGrape
TomatoTomato
(+)(+) --DZ = RashDZ = Rash
95/183PR= ------- =2.6
8/43
Odds of grape work in rash pts: 95/8=11.9
Odds of grape work in healthy: 88/35=2.5
Odds ratio=(95/8)/(88/35)=11.9/2.5=4.7
183
43

Bias
Selection Bias (eg, NSSP study)Is study population representative of target population? Is there systematic increase or decrease of RF?
Measurement BiasOutcome Misclassified (dead, misdiagnosed, undiagnosed) Length-biased sampling
Cases overrepresented if illness has long duration and are underrepresented if short duration.(Prev = k x I x duration)
Risk Factor Recall bias Prevalence-incidence bias
RF affects disease duration not incidence eg, HLA-A2
Bias
The selection bias classic for cross-sectional studies is “the healthy worker effect.” I.e., only “healthy workers” are available for study, distorting your findings.
Example: Low asthma rates in animal handlers (because persons contracting asthma quit and are not available for study).

Advantages
Quick, cheap Easy to obtain prevalence
Outcome Exposure
Can adapt design Case-control study Prospective cohort
study

Disadvantages
Prone to selection bias Recall bias Cannot measure disease onset Problem of temporality (not a
problem if exposure is constant)
Not suitable for rare disease