
3-2-8 Observations of Plasma Bubbles by HF-TEP and GPS ...
1 Introduction Observing the HF trans-equatorial propa- gation (HF-TEP) of HF radio waves has long been used as a means of observing large-scale ionospheric irregularities in the equatorial region. Since radio waves travel straight, short waves often arrive in the great-circle direction relative to the radio wave source, but may sometimes come from a direction deviated from the great-circle direction. R¨ ottger [1]per- formed an experiment on sending and receiv- ing short waves between Lindau, Germany, and Tsumeb, Namibia, thereby demonstrating the existence of a large-scale corrugated struc- ture that travels eastward at nighttime, and which is accompanied by equatorial spread F. Maruyama and Kawamura [2]utilized the lat- est HF direction finding system to observe HF-TEP by using broadcast waves from Aus- tralia, and discovered a phenomenon whereby the direction of arrival emerges in the west away from the great circle direction and then gradually changes course southward. They estimated that this off-great circle propagation (OGCP) was due to the large-scale structure of an eastward traveling ionospheric substructure near the equator, and determined its typical velocity to be about 200 m s -1 . Moreover, based on the velocity characteristics and sea- sonal dependency of OGCP occurrence (including local maximums around the spring equinox and autumn equinox), and other fac- tors, they concluded that the trans-equatorial OGCP of HF radio waves at nighttime is due to plasma bubbles, and that observing HF-TEP affords a means of monitoring the generation of plasma bubbles in a wide area. However, their observations offered no direct evidence linking the OGCP of HF radio waves at night- time to plasma bubbles. Plasma bubbles contain plasma irregulari- 321 SAITO Susumu et al. 3-2-8 Observations of Plasma Bubbles by HF-TEP and GPS Scintillation SAITO Susumu, MARUYAMA Takashi, ISHII Mamoru, and KUBOTA Minoru GPS scintillations were observed at Hainan, China (19.5˚N, 109.1˚N) and Phu Thuy, Vietnam (21.0˚N, 106.0˚E) to compare with the transequatorial propagation of HF radio waves (HF-TEP) observed at Oarai, Japan (36.3˚N, 140.6˚E). The results show that the GPS scintillation occur- rences at Hainan at nighttime were well coincided with the off-great circle propagation (OGCP) occurrence in HF-TEP of Radio Australia observed at Oarai. This confirms that the OGCP at nighttime corresponds to the plasma bubble occurrence. At Hainan and Phu Thuy, respectively, three GPS scintillation receivers were installed with about 100 m separation to measure the drift velocity of small-scale ionospheric plasma irregularities associated with plasma bubbles. On the other hand, the drift velocity of large-scale bottomside ionospheric structures associated with plasma bubble can be estimated by the change in arrival angles of HF-TEP. Measured velocities by these two methods were similar to each other. Our results show that the HF-TEP measure- ments are effective in monitoring plasma bubbles in wide area and forecast their arrival. Keywords Plasma bubble, Ionospheric irregularity, HF-TEP, GPS scintillation, Monitoring and predic- tion of plasma bubble propagation
Transcript of 3-2-8 Observations of Plasma Bubbles by HF-TEP and GPS ...

1 Introduction
Observing the HF trans-equatorial propa-gation (HF-TEP) of HF radio waves has longbeen used as a means of observing large-scaleionospheric irregularities in the equatorialregion. Since radio waves travel straight, shortwaves often arrive in the great-circle directionrelative to the radio wave source, but maysometimes come from a direction deviatedfrom the great-circle direction. Rottger[1]per-formed an experiment on sending and receiv-ing short waves between Lindau, Germany,and Tsumeb, Namibia, thereby demonstratingthe existence of a large-scale corrugated struc-ture that travels eastward at nighttime, andwhich is accompanied by equatorial spread F.Maruyama and Kawamura[2]utilized the lat-est HF direction finding system to observeHF-TEP by using broadcast waves from Aus-tralia, and discovered a phenomenon whereby
the direction of arrival emerges in the westaway from the great circle direction and thengradually changes course southward. Theyestimated that this off-great circle propagation(OGCP) was due to the large-scale structure ofan eastward traveling ionospheric substructurenear the equator, and determined its typicalvelocity to be about 200 m s-1. Moreover,based on the velocity characteristics and sea-sonal dependency of OGCP occurrence(including local maximums around the springequinox and autumn equinox), and other fac-tors, they concluded that the trans-equatorialOGCP of HF radio waves at nighttime is dueto plasma bubbles, and that observing HF-TEPaffords a means of monitoring the generationof plasma bubbles in a wide area. However,their observations offered no direct evidencelinking the OGCP of HF radio waves at night-time to plasma bubbles.
Plasma bubbles contain plasma irregulari-
321SAITO Susumu et al.
3-2-8 Observations of Plasma Bubbles by HF-TEPand GPS Scintillation
SAITO Susumu, MARUYAMA Takashi, ISHII Mamoru, and KUBOTA Minoru
GPS scintillations were observed at Hainan, China (19.5˚N, 109.1˚N) and Phu Thuy, Vietnam(21.0˚N, 106.0˚E) to compare with the transequatorial propagation of HF radio waves (HF-TEP)observed at Oarai, Japan (36.3˚N, 140.6˚E). The results show that the GPS scintillation occur-rences at Hainan at nighttime were well coincided with the off-great circle propagation (OGCP)occurrence in HF-TEP of Radio Australia observed at Oarai. This confirms that the OGCP atnighttime corresponds to the plasma bubble occurrence. At Hainan and Phu Thuy, respectively,three GPS scintillation receivers were installed with about 100 m separation to measure the driftvelocity of small-scale ionospheric plasma irregularities associated with plasma bubbles. On theother hand, the drift velocity of large-scale bottomside ionospheric structures associated withplasma bubble can be estimated by the change in arrival angles of HF-TEP. Measured velocitiesby these two methods were similar to each other. Our results show that the HF-TEP measure-ments are effective in monitoring plasma bubbles in wide area and forecast their arrival.
KeywordsPlasma bubble, Ionospheric irregularity, HF-TEP, GPS scintillation, Monitoring and predic-tion of plasma bubble propagation

322 Journal of the National Institute of Information and Communications Technology Vol.56 Nos.1-4 2009
ties with various wavelengths. When a radiowave in the VHF or UHF band passes througha plasma bubble, Fresnel diffraction causes theamplitude and phase to change—observed onthe ground as scintillation. Scintillation candisrupt satellite communications and position-ing, but has also been used to detect ionos-pheric irregularities. Scintillation caused byFresnel diffraction is intensely generated whena radio wave of certain wavelength λ goesthrough a plasma irregularity having a hori-zontal scale of existing at altitude h. Inrecent years, measurement of the scintillationon GPS satellites has not only helped to detectplasma bubbles but also to measure the driftvelocity of irregularities with plasma bubblesby using multiple receivers installed spatiallyseparated (the spaced-receiver method)[3]-[7].The large electron density gradient and plasmairregularities stemming from plasma bubblespose a hazard to the more advanced use ofsatellite positioning and satellite communica-tions, which makes it very important to moni-tor the generation and movement of plasmabubbles in a wider area.
In the spaced-receiver method, when plas-ma irregularities exist at an altitude between250 and 400 km with the L1 frequency(1.57542 MHz) of GPS, becomes 300to 400 m and will be used in measuring thedrift velocities of those irregularities on a hori-zontal scale of this magnitude as contained inplasma bubbles. Here, it is not that the driftvelocity of plasma bubbles themselves is mea-sured as the region of electron density deple-tion. In fact, to clarify the relation between thedrift velocity of plasma bubbles and that ofsmall irregularities, simultaneous observa-tions[8]were conducted by taking opticalimages of plasma bubbles from an IMAGEsatellite and measuring plasma drift velocityby using the ROCSAT-1, thereby demonstrat-ing a significant difference between the two.Assuming that this result is correct, measuringthe velocity of small irregularities stemmingfrom plasma bubbles that cause scintillationwill not necessarily result in the same velocityof plasma bubbles. This will pose a major
problem when predicting the movement ofplasma bubbles by using the velocity derivedfrom observing scintillations. It is consequent-ly very important to measure the velocity ofirregularities on various spatial scales stem-ming from plasma bubbles, and determine therelation between the spatial scale of irregulari-ties and their drift velocity.
Based on the background of studiesdescribed above, this study aims to determinethe large-scale structure of the bottom sideionosphere that causes OGCP as seen in HF-TEP observations (whether consisting of plas-ma bubbles or something else), and observechanges in the arrival angle of OGCP andGPS scintillation by using the spaced-receivermethod to determine the relation between thespatial scale and drift velocity of irregularities.
This report is based on the work by Saitoet al[6]. as published by the Journal of Geo-physical Research in 2008.
2 Observation and Analysis
This study observed HF-TEP in Oarai,Japan (36.3˚N, 140.6˚E), while conductingobservations by using GPS scintillation andthe spaced-receiver method at Hainan, China(19.5˚N, 109.5˚N, magnetic latitude +13.9˚)and Phy Thuy, Vietnam (21.0˚N, 106.0˚E,magnetic latitude +15.7˚).
2.1 HF-TEP As the source of radio waves for HF-TEP,
broadcast waves emitted from Radio Australiain Shepparton, Australia (36.02˚S, 145.3˚E)were used. These waves were received byusing the HF direction finding system (Oaraidirection finder: ODF) installed in Oarai,Japan. Shepparton and Oarai are in almost thesame geographical meridian plane and a dis-tance of about 8,000 km separates both loca-tions (Fig. 1). At about 140˚E longitude, themagnetic equator is located at about 8˚N lati-tude, so that the relation between both pointsconcerns geographical south and north conju-gate points rather than magnetic conjugatepoints. The direction of Shepparton as viewed

323SAITO Susumu et al.
waves at the same time with an angular reso-lution of 1˚ and time resolution of 0.5 second.Radio Australia provides broadcasts aroundthe clock, but its transmission frequencychanges depending on the season and localtime. The observations in this project weremade by scanning all frequencies that may be
from the reception point at Oarai is 175.7˚clockwise from due north. The ODF consistsof antenna arrays composed of seven orthogo-nal loop antennas arranged on a circle with adiameter of 60 m, and the MUSIC method isemployed to determine arrival directions (i.e.,azimuth and elevation angles) of up to three
Fig.1 Composition chart of the observation. It shows Radio Australia’s point of transmission, thedirection finding system in Oarai, observation points of GPS scintillation, and location ofthe magnetic equator[9].
Fig.2 Relation between the azimuth angle on one hand and each observation point and themagnetic equator on the other as observed in Oarai per azimuthal equidistant projection.The radial lines centered on Oarai show the azimuth angle from Oarai (positive clockwiseassuming that due north is 0˚) in increments of 5˚ from 210˚ to 240[9].

324 Journal of the National Institute of Information and Communications Technology Vol.56 Nos.1-4 2009
used in broadcasts by Radio Australia. Recep-tion frequency scanning was done using thefollowing procedure: Reception at that fre-quency, measurement of the arrival directionsfor 8 seconds when the signals are found, andthen shifting to the next frequency.
In assuming that the OGCP of Radio Aus-tralia’s broadcast waves observed at Oarai isdue to a single mirror reflection attributed tothe ionospheric plasma density gradient stem-ming from plasma bubbles, since Oarai andShepparton are at the geographical south andnorth conjugate points, the reflection point canthen be assumed near the geographical equa-tor. Plasma bubbles have such a long structurein the north-south direction[10][11]that whenone plasma bubble is observed at a certainpoint, the same plasma bubble can be assumedto exist near the geographical equator at thesame longitude as that point. The geographicalequator at the longitude of Hainan with itsGPS scintillation observation equipment is ata azimuth angle of 226˚ as viewed from Oarai(Fig. 2); therefore, in assuming that the OGCPof Radio Australia’s broadcast waves stemsfrom plasma bubbles which have reached thelatitude within the field of view of Hainan’sobservation equipment, we can also expectthat scintillation can be observed at the sametime over Hainan. The OGCP of Radio Aus-tralia’s broadcast waves is not necessarilyreflected only near the geographical equator.And since the substructure of plasma bubbles
may be bent relative to the longitudinal line,the azimuth angle of OGCP will probablyhave some dispersions with regard to 226˚.
2.2 GPS scintillation Hainan and Phy Thuy—where the GPS
scintillation observation equipments utilizingthe spaced-receiver method are installed—arelocated about 330 km apart east and west(Fig. 1). Table 1 lists the specifications for theGPS scintillation equipment installed atHainan and Phu Thuy. Both points areequipped with three GPS receivers each. TwoAshtech G12 receivers and one AshtechBR2G receiver are installed at Hainan wherethe carrier-to-noise ratio (CNR) was recordedat 20 Hz. At Phu Thuy, three JAVAD LGG-100 receivers were used to record CNR at100 Hz. At both points, the three receiverswere installed at distances of 90 to 100 mapart as shown in Fig. 3. The CNR recordedwas used to derive the S4 scintillation index;the maximum value of the cross-correlationfunction between receivers, and the time lagthat gives maximum correlation were derivedat increments of 60 seconds. The S4 index is anormalized standard deviation of the varia-tions and, assuming that CNR is s, it can beexpressed by the following equation:
(1)
Table 1 Specifications of the observation systems for GSP scintillation

325SAITO Susumu et al.
Assuming a plane wave, the time lag obtainedbetween receivers allows the drift velocity(and direction) of the scintillation pattern to bederived. This method is known to cause errorsin velocity when the scintillation patternchanges in time[12], but CNR changes due toirregularities stemming from the plasmabubbles normally have a very high correlationat distances of about 100 m (meaning that,assuming movement at about 100 m s-1, thescintillation pattern hardly changes at aboutone second). This error can therefore beignored[5]. The drift velocity of irregularitiesin the ionosphere can be derived from that ofthe scintillation pattern on the ground, andfrom GPS satellite location and velocity. Inthis study, the drift velocities of irregularitieswere derived by using the method of Ledvinaet al.[6]. The scintillation pattern on the groundis determined by the mutual relationship of thereceiver, plasma irregularities, and GPSsatellite location and velocity. Theirregularities are believed to be elongatedalong the magnetic lines, so that the shape andmovement of the scintillation patterngenerated on the ground can be understood asbeing analogous with the shades ofirregularities generated on the groundilluminated by light from the satellites. Thereader should understand that the aboveground
movement of shades is determined bysynthesis of the movement of irregularitiesthat constitute shades in the directionperpendicular to the magnetic field lines andwith satellite movement serving as a lightsource. The irregularities can be considered tobe elongated very long along the magneticfield line, so that the scintillation pattern onthe ground can be considered to constitute aplane wave. At that time, the only observablequantity is the component perpendicular to thewave front, and any existing componentparallel to the wave front cannot be observed.In other words, attention must be paid to thefact that velocity measured by movement ofthe scintillation pattern on the ground is not atwo-dimensional vector but a scalar.Moreover, plasma bubbles develop in thedirection of altitude, while scintillationintensity is proportional with the absoluteamplitude of the irregularities, so that theeffect is considered most intense near the peakof the ionospheric F region. From this, we canassume that irregularities exist at a certainrange of altitude. This study assumed thatirregularities exist at an altitude of 300 km.The point at which the line of sight betweensatellite and receiver crosses this altitude iscalled the ionospheric piece point (IPP). Here,in assuming zsat to denote satellite altitude, zion
Fig.3 (a) Layout of the GPS receiver antennas in Hainan, China; (b) Layout in Phu Thuy, VietnamThe angles in the figures represent the relative locations between receiver antennas as mea-sured clockwise from magnetic north[9].

326 Journal of the National Institute of Information and Communications Technology Vol.56 Nos.1-4 2009
the ionospheric altitude (= 300 km), vion thevelocity of irregularities in the stationaryorthogonal coordinate system (a left-handsystem with y in magnetic north and z invertically up), and vsat the satellite velocity, theeastward velocity of the scintillation patternon the ground can be expressed as:
(2)
Let the velocity of irregularities in thecoordinate system orthogonal with themagnetic field line at IPP (a left-hand systemwith x eastward and z upward andperpendicular to the magnetic field line) bevipp, which can be expressed using a 3×3transform matrix R as:
(3)
The matrix R is determined by the receiv-er’s location, direction of the magnetic fieldline, and IPP location (satellite location). Fordetails, refer to Equations 4 to 8 in Ledvina etal.[6]. The eastward velocity of irregularitiesat IPP and the velocity upward and perpendic-ular to the magnetic field line can beexpressed by using the [i,j] component Rij ofthe matrix R as follows:
(4)
Here, defining matrix S as follows:
(5)
where, []-1 denotes matrix inversion,Equation (1) can be rewritten as follows:
(6)
In Equation (6), vippx and vippz are theunknown quantities. Both cannot be deter-mined at the same time. In this analysis, wetherefore assume vippz as 0. This assumptionholds when the contribution of vippz is suffi-ciently smaller than that of vippx, but is inap-propriate in case the velocity of irregularitieshas a upward component perpendicular to themagnetic field line that cannot be ignored.However, after the plasma bubbles have beendeveloped, the upward component perpendic-ular to the magnetic field line is generallysmall. Fejer et al.[13]. reported that the upwardvelocity perpendicular to the magnetic fieldline following the prereversal enhancementperiod after sunset is about one-fifth of theeast-west component. From this we decided,for this study, to only analyze cases where thecoefficient of vippz is not more than half thecoefficient of vippx, so that the contribution ofvippz can be suppressed to no more than one-tenth of the contribution of vippx.
3 Results
Figure 4 shows the arrival azimuth angle(positive clockwise with due north set to 0˚) ofRadio Australia as observed by ODF onMarch 29, 2007. The data near the azimuthangle of 176˚ stem from great-circle propaga-tion, and this is called the “main trace”[2]. Incontrast, the group of data seen to the west ofthe main trace between 12:00 and 19:00 UTdue to OGCP is called a “satellite trace”. Thedata near 260˚ at 10:30 to 12:00 UT, near 260˚at 14:00 to 16:00 UT, or near 260˚ at 17:00 to

327SAITO Susumu et al.
18:00 UT are known to be due to sources ofradio waves other than Radio Australia. Thearrival direction of data belonging to a satellitetrace changes southward with time, and thereflection point is considered to have movedeastward. Maruyama and Kawamura[2]thought that this might correspond to the east-ward movement of the large-scale structure of
the bottom side ionosphere stemming fromplasma bubbles. By using the methodemployed by Maruyama and Kawamura[2]and based on temporal changes in the arrivalangle, we estimated the velocity of the reflec-tion point as being 93 m s-1 eastward. As isevident from Fig. 4, however, the satellitetrace is obscure and the slope as a source in
Fig.4 Arrival angle of broadcast waves from Radio Australia observed in Oarai on March 29, 2007The arrival angle was taken with geographical north at 0˚ and positive clockwise[9].
Fig.5 S4 indices of GPS scintillation observed at Hainan on March 29, 2007The S4 indexes of different satellites are color-coded to match the color of the satellite num-ber (PRN) shown in the topmost figure[9].

328 Journal of the National Institute of Information and Communications Technology Vol.56 Nos.1-4 2009
estimating velocity has a certain degree ofrange. Even with the slope being clearlydetermined, this method entails error of 7 to8 m s-1; therefore, note that the estimationerror in actual velocity will be even larger.
On the same day the satellite trace wasobserved in Oarai, Hainan observed intenseGPS signal scintillation. Figure 5 shows the
S4 index of GPS L1 signal intensity observedat Hainan on March 29, 2007. In response tothe GPS L1 signals of PRN 16 and 22, a largeS4 index was observed between 12:40 and13:15 UT and between 13:15 and 13:45 UT,respectively. At that time, no scintillation wasobserved at Phu Thuy. Figure 6 shows themaximum correlation values between the three
Fig.6 Correlation coefficients of changes in received intensity between antennas observed atHainan on March 29, 2007The figure only shows cases with S4 indexes of 0.3 or more. The blue line shows data regard-ing the PTN 16 satellite; the red line shows data regarding the PRN 22 satellite[9].
Fig.7 Time lags of changes in received intensity between antennas observed at Hainan on March29, 2007The figure only shows cases with S4 indexes of 0.3 or more. The blue line shows data regardingthe PRN 16 satellite; the red line shows data regarding the PRN 22 satellite[9].

329SAITO Susumu et al.
receivers regarding the temporal variation ofCNR of the PRN 16 and 22 satellites inHainan; Figure 7 shows the time lags corre-sponding to the maximum correlation valuesshown in Fig. 6. In these figures, data with anS4 index of 0.3 or more are plotted. There mayseem to be no continuity between PTN 16 and22 data. However, as discussed above, move-ment of the scintillation pattern on the groundis determined by the mutual relationshipbetween the receiver, plasma irregularities,and satellite location and velocity; therefore,scintillations due to irregularities stemmingfrom the same plasma bubble can be reason-ably expected to cause discontinuity in tempo-ral differences between receivers locatedbetween different satellites. These time lagswere used to measure drift velocity of thescintillation pattern on the ground and esti-mate the drift velocities of plasma irregulari-ties by using Equation (6). Figure 8 shows theresults. Here, the data of PRN 16 were notused to estimate velocities due to the condi-tions for estimating velocities obtained fromEquation (6) (where the coefficient of vippz is
not more than half of the coefficient of vippx).From Fig. 8, the drift velocity of plasma irreg-ularities estimated at that time was about 130m s-1 eastward. It can be seen that the driftvelocity of these plasma irregularities estimat-ed based on GPS scintillation is in reasonableagreement with the drift velocity of the large-scale structure of the bottom side ionosphereestimated based on HF-TEP.
During the period from March to October2007, OGCP was observed by ODF near 226˚on March 26, 29 and 31, September 18 and22, and October 22 (six nights). GPS scintilla-tion presumably stemming from plasma bub-bles over Hainan was observed on March 26,29 and 31, on April 1 and 15, September 18,and October 22, 2007. The observation systemin Phu Thuy was regrettably in poor condition,and therefore a significant conclusion couldnot be reached except on March 29, 2007.Table 2 summarizes the dates of OGCP occur-rence as observed by ODF and the dates ofGPS scintillation over Hainan and Phu Thuy.Table 3 lists the periods of OGCP occurrencenear the azimuth angle of 226˚ at ODF and theperiods of GPS scintillation over Hainan.However, since the poor condition of ODFresulted in a lack of HF-TEP data on April 15,2007, the data were excluded from Table 3.From these results, it can be seen that OGCPnear the azimuth angle of 226˚ at ODF andGPS scintillation over Hainan agree very well.Moreover, the OGCP generally occurred earli-er at ODF and ended later than GPS scintilla-tion at Hainan. This suggests that the large-scale structure of the bottom side ionospherethat presumably causes OGCP in HF-TEP isgenerated before plasma bubbles form andlasts longer than plasma irregularities with ascale size of a few hundred meters that causeGPS scintillation, and that observations byusing GPS scintillation are conducted at thepoint where the line of sight between satellitereceivers crosses the ionosphere, while HF-TEP is a two-dimensional observation thatcovers a wider range than the GPS receiver ata time.
Fig.8 Drift velocity of irregularities asderived by using the correlation intemporal variation of CNR betweenantennas observed at Hainan onMarch 29, 2007The figure only shows cases wherethe S4 index was 0.3 or more andthe condition regarding Equation(6) was satisfied. The blue lineshows data regarding the PRN 16satellite; the red line shows dataregarding the PRN 22 satellite[9].

330 Journal of the National Institute of Information and Communications Technology Vol.56 Nos.1-4 2009
4 Discussion
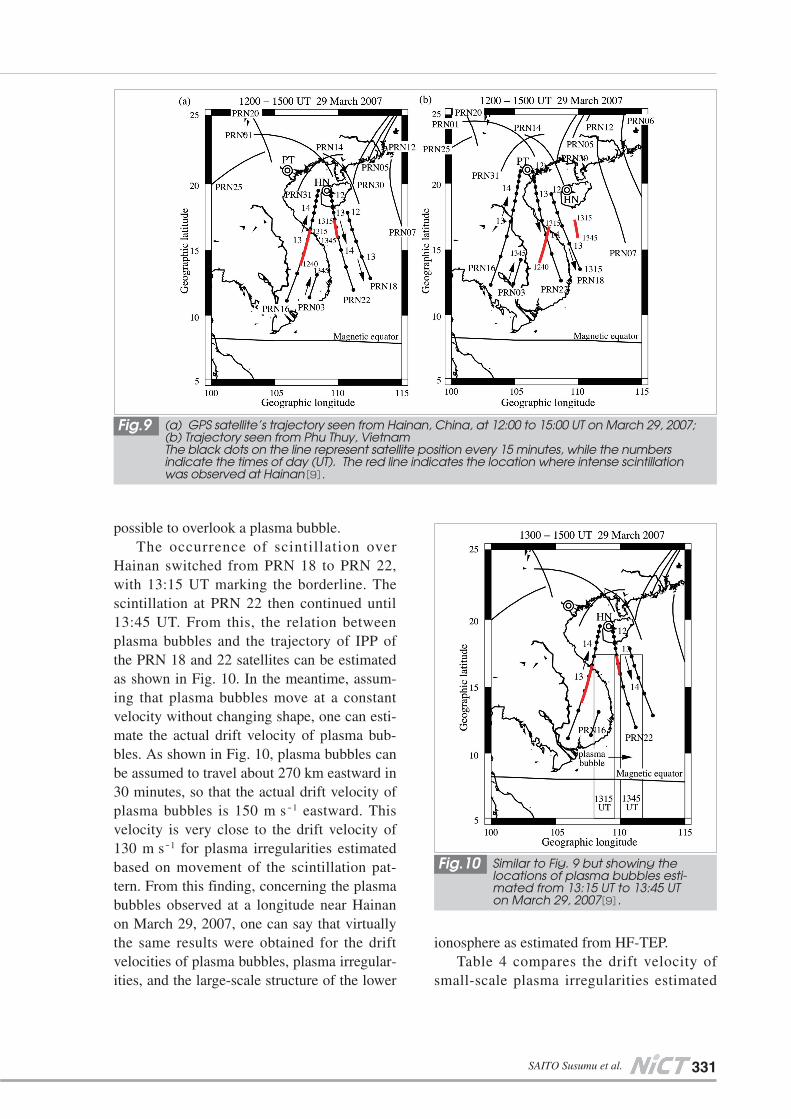
Figure 9 (a) shows the GPS satellite’s tra-jectory of IPP at an altitude of 300 km seenfrom Hainan. The red lines indicate the inter-val where scintillation was observed. Figure 9(b) shows the GPS satellite’s trajectory of IPPat an altitude of 300 km seen from Phu Thuy;the red lines indicate the location where scin-tillation was observed at Hainan, similarly toFig. 9 (a). From this, it is evident that the tra-jectory of IPP over Phu Thuy deviates fromthe red lines. The trajectory of IPP for thePRN 18 satellite seen from Phu Thuy appearsto be near the location where scintillation of
the PRN 22 satellite signal was observed atHainan. However, the time of day when thePRN 18 satellite’s trajectory over Phu Thuyintersected with the location indicated by thered lines differs from the time of day whenscintillation was observed by the PRN 22satellite signal, and the PRN 18 satellitepassed over Phu Thuy toward the southeastwithout encountering the plasma bubble. Fromthese findings, one can understand why noscintillation was observed at Phu Thuy eventhough it was observed at Hainan. Moreover,the observation of plasma bubbles by usingGPS scintillation is essentially on a point basisand, unless satellite density is sufficient, it is
Note that O, NO and ND denote occurrence, non-occurrence, and lack of measurement, respectively. On September 18,2007, faint OGCP was observed, thereby being expressed as F.
Table 2 Dates of OGCP of HF-TEP and GPS scintillation occurrence
Table 3 Times (UT) of OGCP occurrence at Oarai and GPS scintillation at Hainan
331SAITO Susumu et al.
possible to overlook a plasma bubble.The occurrence of scintillation over
Hainan switched from PRN 18 to PRN 22,with 13:15 UT marking the borderline. Thescintillation at PRN 22 then continued until13:45 UT. From this, the relation betweenplasma bubbles and the trajectory of IPP ofthe PRN 18 and 22 satellites can be estimatedas shown in Fig. 10. In the meantime, assum-ing that plasma bubbles move at a constantvelocity without changing shape, one can esti-mate the actual drift velocity of plasma bub-bles. As shown in Fig. 10, plasma bubbles canbe assumed to travel about 270 km eastward in30 minutes, so that the actual drift velocity ofplasma bubbles is 150 m s-1 eastward. Thisvelocity is very close to the drift velocity of130 m s-1 for plasma irregularities estimatedbased on movement of the scintillation pat-tern. From this finding, concerning the plasmabubbles observed at a longitude near Hainanon March 29, 2007, one can say that virtuallythe same results were obtained for the driftvelocities of plasma bubbles, plasma irregular-ities, and the large-scale structure of the lower
ionosphere as estimated from HF-TEP. Table 4 compares the drift velocity of
small-scale plasma irregularities estimated
Fig.9 (a) GPS satellite’s trajectory seen from Hainan, China, at 12:00 to 15:00 UT on March 29, 2007;(b) Trajectory seen from Phu Thuy, VietnamThe black dots on the line represent satellite position every 15 minutes, while the numbersindicate the times of day (UT). The red line indicates the location where intense scintillationwas observed at Hainan[9].
Fig.10 Similar to Fig. 9 but showing thelocations of plasma bubbles esti-mated from 13:15 UT to 13:45 UTon March 29, 2007[9].

332 Journal of the National Institute of Information and Communications Technology Vol.56 Nos.1-4 2009
based on GPS scintillation observed at Hainanwith the drift velocity of the large-scale struc-ture of the bottom side ionosphere estimatedbased on HF-TEP observed at Oarai. Fromthis comparison, one can see that these groupsof velocities almost agree with each other. OnSeptember 18, 2007, the HF-TEP signals wereso weak that we were unable to estimatevelocity. Moreover, on October 22, 2007, theelevation angle of the GPS satellite for whichscintillation was observed at Hainan was toolow, also resulting in failure to estimate veloc-ity there as well. Huba et al.[14]. conducted astudy based on numerical simulation todemonstrate that the E×B drift velocity insidea plasma bubble can differ from the plasmabubble’s upper development velocity. Thismeans that the velocity of plasma does notnecessarily agree with the velocity of the plas-ma bubble itself. The difference in velocitybetween small-scale plasma irregularities andthe large-scale ionospheric structure obtainedin this study was within the range of error inthe observation method employed by thisstudy. In this way, it is difficult to derive aclear conclusion from this study concerningthe issue presented by Lin et al.[8]. regardingthe difference in velocity between small-scaleplasma irregularities and the large-scale iono-spheric structure. Although HF-TEP and GPSscintillation were simultaneously observed
during low solar activity period, resulting infew observation findings, this simultaneousobservation of OGCP and scintillation pro-duced results where the velocities estimatedby using both virtually agree with each other,demonstrating that OGCP seen in HF-TEP atnighttime stemmed from plasma bubbles.Therefore, this finding marks an importantdiscovery.
HF radio waves propagated across theequator are presumably reflected on the bor-ders of plasma bubbles below the peak in theionospheric F region. Scintillation intensity isproportional to the absolute value of change inionospheric plasma density, so that plasmairregularities near the peak of the ionosphericF region are considered to affect scintillationmost intensely. In fact, in observations madeat Hainan on March 29, 2007 (Fig. 10), thedrift velocity in the scintillation region almostagreed with the drift velocity of plasma irregu-larities. From these findings, both methods(HF-TEP and GPS scintillation) were presum-ably sensitive in the same altitude region ofthe ionosphere, since the two methods yieldedvery similar values in estimated velocities.
5 Conclusion
This study presented the results of simulta-neously observing HF-TEP and GPS scintilla-
“-” indicates lack of measurement or failure to estimate velocity.
Table 4 East-west drift velocities (m s-1, positive eastward) estimated in HF-TEP and GPS scintillation

333SAITO Susumu et al.
tion for the first time in the world. HF-TEPwas observed by measuring the arrival angleof Radio Australia’s broadcast waves transmit-ted from Shepparton, Australia, by using thedirection exploratory equipment in Oarai,Japan. GPS scintillation was observed atHainan, China, and at Phu Thuy, Vietnam.Observations at Phu Thuy obtained little datadue to the poor condition of the equipmentthere, but GPS scintillation generated overHainan agreed well with HF-TEP OGCP gen-erated near a azimuth angle of 226˚ in Oarai.Moreover, the drift velocity of small-scale(300– 400 m) plasma irregularities stemmingfrom plasma bubbles estimated based onmovement of the GPS scintillation pattern onthe ground agreed well with the drift velocityof the large-scale structure of the bottom sideionosphere, as estimated based on changes inthe arrival angle of HF-TEP. These findingsproved that nighttime OGCP seen in HF-TEPis associated with plasma bubbles, and thatHF-TEP is quite effective in the wide-rangemonitoring of plasma bubbles. The arrivalangle of OGCP in HF-TEP is obscure andleaves errors in estimating location and veloci-ty. For monitoring the generation and move-ment of plasma bubbles, it is very important tomore precisely estimate the location andvelocity of plasma bubbles. The scatteredarrival angle is presumably due to the fact thatHF broadcast waves take several differentpropagation paths; therefore, it is more effec-tive to measure the propagation path length,thereby distinguishing the propagation paths.An effective method of measuring propagationpath length is passive radar whereby receptionis observed simultaneously at two locations(near the radio source and at a remote loca-tion) and propagation time is determinedbased on the resulting lags in waveform. As of2009, with the grant-in-aid for young scien-tists (B) provided by the Ministry of Educa-tion, Culture, Sports, Science and Technologyof Japan (MEXT), a system for wide-rangemonitoring of the generation and movement of
plasma bubbles by using passive radar is beingdeveloped. In the future, TEP observationswith VHF radio waves that travel morestraightly should be conducted with a special-ly prepared transmitter.
Large safety margins to cover the possibil-ity of overlooking the presence of plasma bub-bles have been considered for the MTSATsatellite-based augmentation system (MSAS),ground-based augmentation system (GBAS),and other advanced uses of satellite naviga-tion. Such an approach would pose an obstacleto more advanced use of such technologies.However, when it becomes possible to unfail-ingly monitor plasma bubbles and predict theirmovement, it will also become possible toreduce unnecessary safety margins, therebypaving the way to more advanced use of satel-lite navigation. Monitoring the generation andmovement of plasma bubbles by observing theOGCP of HF-TEP is a promising method thatwill enable the more advanced use of satellitenavigation, which must be actively promotednot only for scientific purposes but also forsocial benefit.
Acknowledgments
Observations at Hainan and Phu Thuywere made according to the research agree-ments established between the National Insti-tute of Information and CommunicationsTechnology (Japan), the Chinese Academy ofSciences, and the Vietnam Academy of Sci-ence and Technology, respectively. Theauthors wish to thank Dr. Ma and Ms. Li ofthe National Astronomical Observatories, Chi-nese Academy of Sciences, Ms. Chen of theCenter for Space Science and AppliedResearch, Chinese Academy of Sciences, andDr. Ha Duyen and Mr. Le Truong of the Viet-nam Academy of Science and Technology.The authors also wish to thank Mr. MasabumiKawamura for acquiring data with the Oaraidirection finder, as well as all members of theSEALION Project.

334 Journal of the National Institute of Information and Communications Technology Vol.56 Nos.1-4 2009
References01 Rottger, J., “Wave-like structures of large-scale equatorial spread-F irregularities,” J. Atmos. Terr. Phys.,
Vol. 35, pp. 1195–1206, 1973.
02 Maruyama, T. and M. Kawamura, “Equatorial ionospheric disturbance observed through a transequator-
ial HF propagation experiment,” Ann. Geophys., Vol. 24, pp. 1401–1409, 2006.
03 Valladares, C. E., R. Sheehan, S. Basu, H. Kuenzler, and J. Espinoza, “The multi-instrumented studies of
equatorial thermosphere aeronomy scintillation system: Climatology of zonal drifts,” J. Geophys. Res.,
Vol. 101, pp. 26839–26850, 1996.
04 Kil, H., P. M. Kintner, E. R. de Paula, and I. J. Kantor, “Global Positioning System measurements of the
ionospheric zonal apparent velocity at Cachoeira Paulista in Brazil,” J. Geophys. Res., Vol. 105, pp.
5317–5327, 2000.
05 Kintner, P. M., B. M. Ledvina, E. R. de Paula, and I. J. Kantor, “The size, shape, orientation, speed, and
duration of GPS equatorial anomaly scinti l lations,” Radio Sci., Vol. 39, pp. RS2012, doi:
10.1029/2003RS002878, 2004.
06 Ledvina, B. M., P. M. Kintner, and E. R. de Paula, “Understanding spaced-receiver zonal velocity esti-
mation,” J. Geophys. Res., Vol. 109, pp. A10306, doi: 10.1029/2004JA010489, 2004.
07 Otsuka, Y., K. Shiokawa, and T. Ogawa, “Equatorial ionospheric scintillations and zonal irregularity drifts
observed with closely-spaced GPS receivers in Indonesia,” J. Meteor. Soc. Japan, Vol. 84A, pp.
343–351, 2006.
08 Lin, C. S., T. J. Immel, H. -C. Yeh, S. B. Mende, and J. L. Burch, “Simultaneous observations of equatori-
al plasma depletion by IMAGE and ROCSAT-1 satellites,” J. Geophys. Res., Vol. 110, pp. A06304, doi:
10.1029/2004JA010774, 2005.
09 Saito, S., T. Maruyama, M. Ishii, M. Kubota, G. Ma, Y. Chen, J. Li, C. Ha Duyen, and T. Le Thurong,
“Observations of small- to large-scale ionospheric irregularities associated with plasma bubbles with a
transequatorial HF propagation experiment and spaced GPS receivers,” J. Geophys. Res., Vol. 113,
A12313, doi: 10.1029/2008JA013149, 2008.
10 Kelley, M. C., J. J. Makela, L. J. Paxton, F. Kamalabadi, J. M. Comberiate, and H. Kil, “The first coordi-
nated ground- and space-based optical observations of equatorial plasma bubbles,” Geophys. Res.
Lett., 30, Vol. 1766, 10. 1029/2003GL017301, 2003.
11 Keskinen, M. J., S. L. Ossakow, and B. G. Fejer, “Three-dimensional nonlinear evolution of equatorial
spread-F bubbles,” Geophys. Res. Lett., Vol. 30, pp. 1855, doi: 1029/2003GL017418, 2003.
12 Briggs, B. H., G. J. Philips, and D. H. Shinn, “The analysis of observations on spaced receivers of the
fading of radio signals,” Proc. Phys. Soc. Sec. B, Vol. 63, pp. 106–121, 1950.
13 Fejer, B. G., E. R. de Paula, S. A. Gonzarez, and R. F. Woodman, “Average vertical and zonal F region
plasma drifts over Jicamarca,” J. Geophys. Res., Vol. 96, pp. 13901–13908, 1991.
14 Huba, J. D., G. Joyce, and J. Krall, “Three-dimensional equatorial spread F modelling,” Geophys. Res.
Lett., Vol. 35, pp. L10102, 10.1029/2008GL033509, 2008.

335SAITO Susumu et al.
SAITO Susumu, Ph.D.
Senior Researcher, Communication,Navigation, and Surveillance Department, Electronic NavigationResearch Institute
Aeronomy, Satellite Navigation
MARUYAMA Takashi, Ph.D. (Eng.) Executive Researcher
Upper Atmospheric Physics
ISHII Mamoru, Dr. Sci.
Director, Project Promotion Office,Applied Electromagnetic ResearchCenter
Upper Atmospheric Physics
KUBOTA Minoru, Ph.D.
Senior Researcher, Space EnvironmentGroup, Applied ElectromagneticResearch Center
Aeronomy