3 - 1 Copyright (C) 2000 by Harcourt, Inc. All rights reserved. Chapter 3 Analysis of Financial...
42
3 - 1 Copyright (C) 2000 by Harcourt, Inc. All rights reserved. Chapter 3 Analysis of Financial Statements: Financial Statements and Reports Ratio Analysis Copyright © 2000 by Harcourt, Inc. All rights reserved. Requests for permission to make copies of any part of the work should be mailed to the following address: Permissions Department, Harcourt, Inc., 6277 Sea Harbor Drive, Orlando, Florida 32887-6777
-
date post
20-Dec-2015 -
Category
Documents
-
view
221 -
download
3
Transcript of 3 - 1 Copyright (C) 2000 by Harcourt, Inc. All rights reserved. Chapter 3 Analysis of Financial...

3 - 1
Copyright (C) 2000 by Harcourt, Inc. All rights reserved.
Chapter 3
Analysis of Financial Statements:
Financial Statements and Reports
Ratio AnalysisCopyright © 2000 by Harcourt, Inc.
All rights reserved. Requests for permission to make copies of any part of the work should be mailed to the following address: Permissions Department, Harcourt, Inc., 6277 Sea Harbor Drive, Orlando, Florida 32887-6777

3 - 2
Copyright (C) 2000 by Harcourt, Inc. All rights reserved.
Financial Statements and Reports
The Income Statement
The Balance Sheet
Statement of Cash Flows
Statement of Retained Earnings

3 - 3
Copyright (C) 2000 by Harcourt, Inc. All rights reserved.
Computron: Income Statement
2000 1999Sales $ 3,850,000 $ 3,432,000COGS (3,250,000) (2,864,000)Other expenses (430,300) (340,000)Deprec. (20,000) (18,900) Tot. op. costs ($3,700,300) ($3,222,900)
EBIT $ 149,000 $ 209,100Interest exp. (76,000) (62,500) EBT $ 73,700 $ 146,600Taxes (40%) (29,480) (58,640)Net income $ 44,220 $ 87,960

3 - 4
Copyright (C) 2000 by Harcourt, Inc. All rights reserved.
Computron:Balance Sheet: Assets
2000 1999Cash $ 52,000 $ 57,600AR 402,000 351,200Inventories 836,000 715,200 Total CA $1,290,000 $1,124,000Gross FA $ 527,000 491,000Less: Deprec. 166,200 $ 146,200 Net FA $ 360,000 $ 344,800Total Assets $1,650,000 $1,468,800

3 - 5
Copyright (C) 2000 by Harcourt, Inc. All rights reserved.
Computron:Liabilities and Equity
2000 1999Accts payable $ 175,200 $ 145,600Notes payable 225,000 200,000Accruals 140,000 136,000 Total CL $ 540,200 $ 481,600Long-term debt 424,612 323,432Common stock 460,000 460,000Retained earnings 225,988 $ 203,768 Total equity $ 685,988 $ 663,768Total L&E $1,650,800 $1,468,800

3 - 6
Copyright (C) 2000 by Harcourt, Inc. All rights reserved.
Cash from OperationsOperating Activities Net income $ 44,220Add (sources of cash): Depreciation 20,000 Increase in A/P 29,600 Increase in accruals 4,000Subtract (uses of cash): Increase in A/R (50,800) Increase in inventories (120,800)
Net cash provided by operations ($ 73,780)
Computron: Statement of Cash Flows (2000)

3 - 7
Copyright (C) 2000 by Harcourt, Inc. All rights reserved.
Cash from Investing Investment in fixed assets (36,000)Cash from Financing Increase in notes payable $ 25,000 Increase in long-term debt 101,180 Payment of cash dividends (22,000) Net cash from financing $ 104,180Net Change in Cash ($ 5,600)Plus: Cash at beginning of year 57,600Cash at end of year $ 52,000
Computron: Statement of Cash Flows (continued)

3 - 8
Copyright (C) 2000 by Harcourt, Inc. All rights reserved.
What Can You Conclude about Computron’s Financial Condition from its Statement of Cash Flows?
Net operating cash flow is ($73,780) – Operations are draining cash
Had to borrow $126,180 in long- and short-term debt to cover cash outlays, pay for fixed asset additions, and to pay dividends
Despite borrowing, cash account still fell $5,600 in 2000

3 - 9
Copyright (C) 2000 by Harcourt, Inc. All rights reserved.
Statement of Retained Earnings
Balance of retained earnings Dec. 31, 1999 $203,786
2000 Net Income 44,220
2000 dividends to stockholders (22,000)
Balance of retained earnings Dec. 31, 2000 $225,988

3 - 10
Copyright (C) 2000 by Harcourt, Inc. All rights reserved.
Computron: Additional Data
2000 1999
Dec. 31 stock price $6.00 $8.50
Number of shares 100,000 100,000
Dividends per share $ 0.22 $ 0.22
Lease payments $40,000 $40,000

3 - 11
Copyright (C) 2000 by Harcourt, Inc. All rights reserved.
Ratio Analysis
An analysis of a firm’s ratios is generally the first step in financial analysis
The ratios are designed to show relationships between financial statement accounts within firms and between firms

3 - 12
Copyright (C) 2000 by Harcourt, Inc. All rights reserved.
What is the Purpose of Ratio Analysis?
Give idea of how well the company is doing
Standardize numbers; facilitate comparisons
Used to highlight weaknesses and strengths

3 - 13
Copyright (C) 2000 by Harcourt, Inc. All rights reserved.
Liquidity:Liquidity: Can we make required payments?
Asset mgt.:Asset mgt.: Right amount of assets vs. sales?
Debt mgt.:Debt mgt.: Right mix of debt and equity?
Profitability:Profitability: Do sales prices exceed unit costs, and are sales high enough as reflected in PM, ROE, and ROA?
Market values:Market values: Do investors like what they see as reflected in P/E and M/B ratios?
What Are the Five Major Categories of Ratios?What Questions Do They Answer?

3 - 14
Copyright (C) 2000 by Harcourt, Inc. All rights reserved.
Industry Average Data (2000)
RATIOCurrent 2.7xQuick 1.0xInventory turnover 6.0xDays sales outstanding (DSO) 32.0 daysFixed asset turnover 10.7xTotal asset turnover 2.6xDebt ratio 50.0%TIE 2.5xFixed charge coverage 2.1xProfit margin 3.5%ROA 9.1%ROE 18.2%Price/earnings 14.2xMarket/book 1.4x

3 - 15
Copyright (C) 2000 by Harcourt, Inc. All rights reserved.
Current ra xtio =Current assets
Current liabilities $1,$540.
.2902
239
Quick ratio =Current asset - Inventories
Current liabilities
What are Computron’s Current and Quick ratios?
$1, $836
$540..
290
20 84x
3 - 16
Copyright (C) 2000 by Harcourt, Inc. All rights reserved.
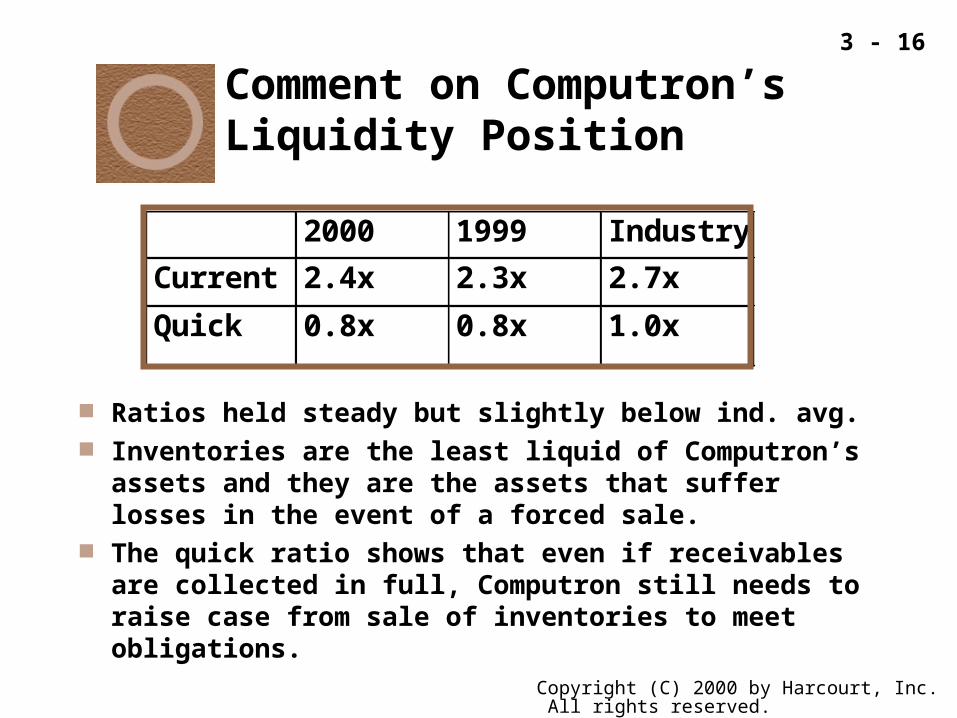
Comment on Computron’s Liquidity Position
2000 1999 Industry
Current 2.4x 2.3x 2.7x
Quick 0.8x 0.8x 1.0x
Ratios held steady but slightly below ind. avg. Inventories are the least liquid of Computron’s
assets and they are the assets that suffer losses in the event of a forced sale.
The quick ratio shows that even if receivables are collected in full, Computron still needs to raise case from sale of inventories to meet obligations.

3 - 17
Copyright (C) 2000 by Harcourt, Inc. All rights reserved.
Note that the $1,290,000 in current assets is made up of...
$ 52,000 in cash
$402,000 in accts rec
$836,000 in inventories
$1,290,000 total
Cur Lia - Cash - Acc Rec = Inventory needed to be liquidated to meet current liabilities
Thus, cur. lia minus cash = $540,200 - $52,000 = $488,200
and
$488,200 - accts rec = $488,200 - $402,000 = $86,200 in inventory…
That would have to be liquidated in order to meet current liabilities

3 - 18
Copyright (C) 2000 by Harcourt, Inc. All rights reserved.
=$3,250
$83639. x
What is Computron’s Inventory Turnover Ratio?
Inventory turnover =Cost of good sold
Inventories
2000 1999 Industry
P.M. 1.1% 2.6% 3.5%
3 - 19
Copyright (C) 2000 by Harcourt, Inc. All rights reserved.
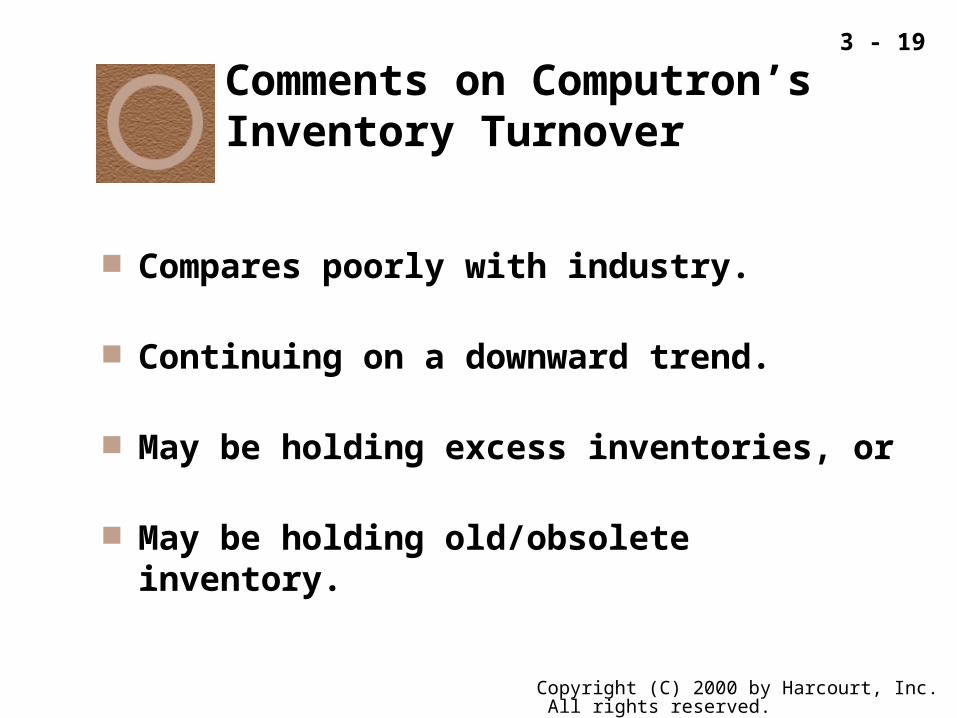
Comments on Computron’s Inventory Turnover
Compares poorly with industry.
Continuing on a downward trend.
May be holding excess inventories, or
May be holding old/obsolete inventory.

3 - 20
Copyright (C) 2000 by Harcourt, Inc. All rights reserved.
What is Computron’s Days Sales Outstanding Ratio?
dayper sales AveragesReceivableDSO
Re $402
$3,.
ceivables
Sales 360 850 36037 6 days
2000 1999 Industry
DSO 37.6 days 36.8 days 32.0 days

3 - 21
Copyright (C) 2000 by Harcourt, Inc. All rights reserved.
Comments on Computron’s Days Sales Outstanding Ratio
Looks bad.
Higher than industry average.
Getting higher!!

3 - 22
Copyright (C) 2000 by Harcourt, Inc. All rights reserved.
What is Computron’s Fixed Assets and Total Assets Turnover Ratios?
Fixed assets turnover =Sales
Net fixed assets
=$3,850$360.8
1067. x
Total asse ts turnover =Sales
Total asse ts
=$3,850
$1,650.8233. x

3 - 23
Copyright (C) 2000 by Harcourt, Inc. All rights reserved.
Comments on Computron’sFixed Assets Turnover and Total Assets Turnover
Fixed assets turnover has improved. However, total asset turnover remains the same
and below industry average. As we saw before, Computron may have excess
inventories and receivables.
2000 1999 Industry
Fix. assets 10.7x 10.0x 10.7x
Tot. assets 2.3x 2.3x 2.6x

3 - 24
Copyright (C) 2000 by Harcourt, Inc. All rights reserved.
Calculate the Debt, TIE, and Fixed Charge Coverage Ratios.
Debt Ratio = Total debt Total assets
TIE = EBIT Int. expense
$540. $424.
$1, ..
2 6
650 858 4%
1.97x$76
$149.7

3 - 25
Copyright (C) 2000 by Harcourt, Inc. All rights reserved.
FCC = EBIT + Lease payments + S.F. Pmts. Interest + Lease + Sinking fund pmt. expense pmt. (1-T)
All three ratios reflect use of debt,but focus on different aspects.
$149. $40
$76 $40.
71 6 x
Fixed Charge Coverage Ratio

3 - 26
Copyright (C) 2000 by Harcourt, Inc. All rights reserved.
Comments on Computron’sDebt Management
2000 1999 Industry
Debt ratio 58.4% 54.8% 50.0%
TIE 2.0x 3.3x 2.5x
FCC 1.6x 2.4x 2.1x
Debt ratio is above industry and going higher.
Computron would find it difficult to borrow.
TIE and FCC below industry average and falling--indicates Computron has high use of debt.

3 - 27
Copyright (C) 2000 by Harcourt, Inc. All rights reserved.
If you are in the 30% tax bracket, you have to earn $1.43 before tax in order to put $1.00 into your pocket
$1.43 – 30%($1.43) = $1.00
Or
$1.00/(1-Tax Rate) = $1.00/(1-.30) = $1.43
“Amount/(1-T) “ is frequently used in Finance

3 - 28
Copyright (C) 2000 by Harcourt, Inc. All rights reserved.
$44.$3,
.22
850115%
Calculate Computron’s Profitability Ratios--Profit Margin, ROA, and ROE
Profit margin = Net income
Sales
2000 1999 Industry
P.M. 1.1% 2.6% 3.5%
Low and Falling!Low and Falling!

3 - 29
Copyright (C) 2000 by Harcourt, Inc. All rights reserved.
$44.$686.
.22
06 44%
$44.
$1, ..
22650 8
2 68%
ROA = Net income
Total assets
ROENet income
=Common equity
Computron’s ROA, and ROE

3 - 30
Copyright (C) 2000 by Harcourt, Inc. All rights reserved.
Comments on Computron’s ROA and ROE
Both ROA and ROE substantially belowindustry average.
Company stock probably not doing well.
2000 1999 Industry
ROA 2.7% 6.0% 9.1%
ROE 6.4% 13.3% 18.2%

3 - 31
Copyright (C) 2000 by Harcourt, Inc. All rights reserved.
13.57x $0.442$6.00
Calculate Computron’s Market Value Ratios - - Price/Earnings Ratio and Market/Book Value Ratio
Price / earnings ratio =Price per share
Earnings per share
EPS = Net Income / Shares Outstanding

3 - 32
Copyright (C) 2000 by Harcourt, Inc. All rights reserved.
$6.
$6..
00
860 87x
Market / Book ratio = Market price per share
Book value per share
2000 1999 Industry
P/E 13.6x 9.7x 14.2x
M/B 0.9x 1.3x 1.4x
Computron’s Market/Book Value Ratio

3 - 33
Copyright (C) 2000 by Harcourt, Inc. All rights reserved.
Book Value = Common Equity / shares outstanding

3 - 34
Copyright (C) 2000 by Harcourt, Inc. All rights reserved.
Comments on Computron’s Market Value Ratios
P/E rose from 1999 to 2000--good?
NO! because earnings dropped!
M/B well below industry average.
Investors view Computron as riskier than other companies in the industry.

3 - 35
Copyright (C) 2000 by Harcourt, Inc. All rights reserved.
$44.
$3,
$3,
$1, ..
22
850
850
650 82 7%
Summary of Ratio Analysis:The Du Pont Equation
ROA =Net income
Sales Total assets
Sales

3 - 36
Copyright (C) 2000 by Harcourt, Inc. All rights reserved.
DU PONT Equation Provides Overview of:
Firm’s profitabilityprofitability (measured by ROA)
Firm’s expense controlexpense control (measured by profit margin)
Firm’s asset utilizationasset utilization (measured by total asset turnover)

3 - 37
Copyright (C) 2000 by Harcourt, Inc. All rights reserved.
2000 1999 Industry
Profit margin 1.15% 2.56% 3.5%
TAT 2.33% 2.34% 2.7%
ROA(Du Pont)
2.7x 6.0x 9.1x
Expense control is poor and trending downward. Asset utilization is below average but not getting
worse. Combination = ROA that is very low and falling.
Computron’s DU PONT Equation

3 - 38
Copyright (C) 2000 by Harcourt, Inc. All rights reserved.
Sales per day amount to: $3,850,000/ 360 = $10,694
Accounts Receivable are now $402,000, or 37.6 days sales
$10,694 * 37.6 = $402,094.40
or
$402,094.40 / $10,694 = 37.6
If DSO can be reduced to 27.6 days without affecting sales…
Then accounts receivable would be: $10,694 * 27.6 = $295,154
Compared to the current accounts receivable this would mean a collection (cash inflow) of:
$402,000 - $295,154 = $106,846

3 - 39
Copyright (C) 2000 by Harcourt, Inc. All rights reserved.
What are Some PotentialProblems and Limitations ofFinancial Ratio Analysis?
Comparison with industry averages is difficult if the firm operates many different divisions.
“Average” performance not necessarily good.
Inflation distorts balance sheets.

3 - 40
Copyright (C) 2000 by Harcourt, Inc. All rights reserved.
Seasonal factors can distort ratios. Window dressing” techniques can
make statements and ratios look better. Different operating and accounting
practices distort comparisons.
What are Some PotentialProblems and Limitations ofFinancial Ratio Analysis?

3 - 41
Copyright (C) 2000 by Harcourt, Inc. All rights reserved.
Sometimes hard to tell if a ratio is “good” or “bad.”
Difficult to tell whether company is, on balance, in strong or weak position.
What are Some PotentialProblems and Limitations ofFinancial Ratio Analysis?

3 - 42
Copyright (C) 2000 by Harcourt, Inc. All rights reserved.
End of Chapter 3Analysis of Financial Statements