
2t,2015. - amadorwater.org
21
Amador Water Agency L2800 Rídge Road, Sutter Creek, Cølifornía FiscalYear 20L7-20L8 Operoting & Non Operating Budget Adopted 6-22-20L7 Years Sertting The JAarcr & Wastewø.ter Needs ofAmador Coungt .ül 1
Transcript of 2t,2015. - amadorwater.org

Amador Water AgencyL2800 Rídge Road, Sutter Creek, Cølifornía
FiscalYear 20L7-20L8
Operoting & Non Operating Budget Adopted 6-22-20L7
YearsSertting The JAarcr & Wastewø.ter
Needs ofAmador Coungt
.ül
1

5a: Ðíatinguiaftd. .It¿mßeru al úe Omodnn Watuc Aqßrcr, ßastrd o( Ði,ættßtr,t
From: Tracey Hays
Finance Manager
ln accordance with Government Code Sections 53900 - 53901, 7900 and California Constitution Article XlllB, I hereby submit the proposed
operating budget for Fiscal Year July t,2OL7 - June 30, 2018 for approval. A conservative approach was used in the development of this budget,
considering the slow rebound of water use following water conservation and an exceptionally wet winter. The Agency is currently conducting a
water rate update study and proposed water rate adjustments. The water rate adjustments are necessary for a balanced budget. The budgetedprojects are focused on regulatory needs and approved grant funding. Expenses are flat and consistent wíth the past few budget years. Staffcontinues to pursue grant funding sources from federal and state agencies for the benefit of all Agency rate payers.
The proposed budget is funded by operating (rates, grants, fees, etc.) and non operating revenues. The development of the budget is discussed on
the budget objectives and assumptions page of this document. The budget and accounting structure remains consistent with past years. Agency
Staff will continue to look for additional cost cutting opportunities throughout the fiscal year.
Agency management and staff recognize that fiscal year 2OL7 - 2OI8 presents ongoing financial challenges and are committed to continuing toprovide safe reliable water and wastewater services to our customers while meeting those challenges.
2
Budget Development (Objectives & Assumptions)
The Agency's accounting records are maintained used the accrual basis of accounting. The revenues ofthe Agency are recognized when they are earned and the expenses are recognized when they areincurred. The budget details in this document are used as a management tool for forecastíng andmonitoring revenues and expenses. The Agency's accounting system is used for recording the actual
transactions associated with these forecasts. ln recognition of the Agency's cash position, the budget is
developed as closely as possible to a cash flow projection rather than a full accrual estimate.
The objectives of the budget are to ensure that the Agency continues to provide safe, reliable water and
wastewater services to our customers, while being fiscally responsible, properly operating andmaintaining Agency facilities and adhering to all state and federal regulations.
The followíng assumpt¡ons where considered in the development of the budget which uses a
conservative yet realistic approach.
Water & Waste Water Sales Assumptions:
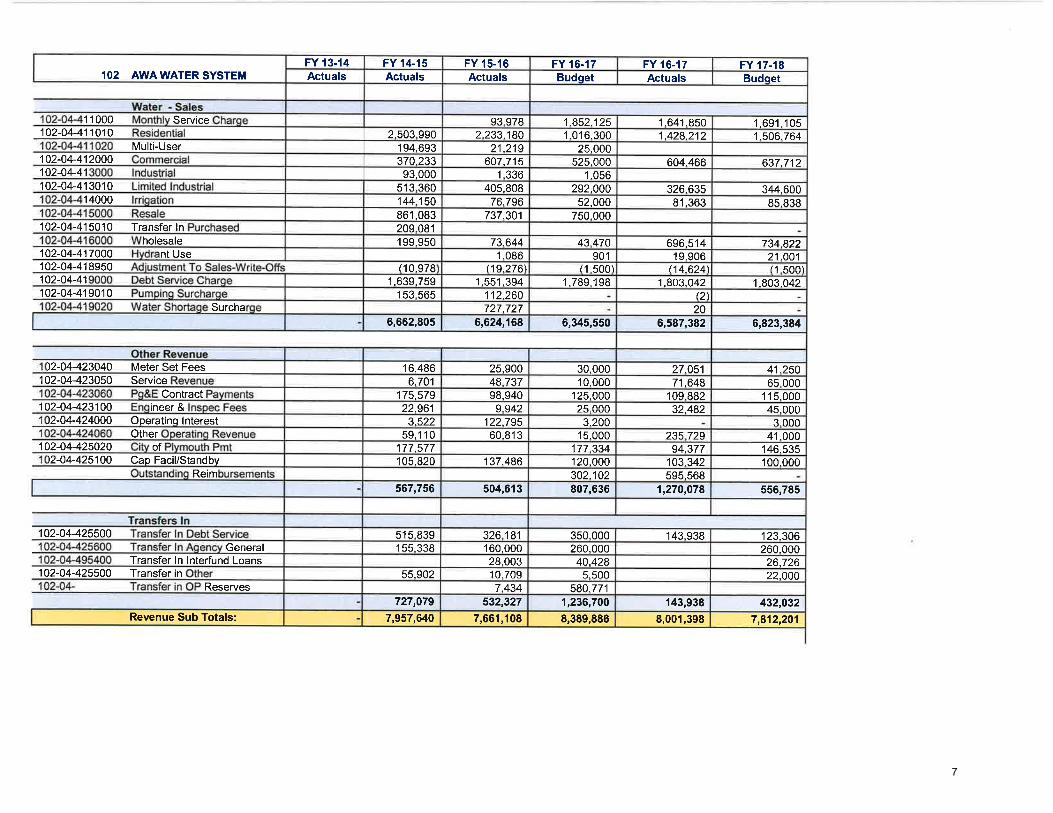
(Fund 102-04) Water Sales projections are based on projected June FY 2Ot6-L7 actual levels plus 3%
inflationary increase adopted by the Board July 2t,2015. Also included is an anticipated 25% reboundof water use expected following the lifting of water conservation mandates. The Water System fundbudget has a deficit of 5206,522. This deficit is expected to be corrected through the Water Rate UpdateStudy and proposed rate adjustments.
(Fund 102-23) CFD revenues of S3L0,200 will be used for a port¡on of debt service payments and theWaterTreatment Plant Expansion Project. CFD Reserve funds will be transferred in to support theTreatment plant project.
(Fund 103-03) Outside Services provides additional revenue to the Agency through service contractswith other utilities. This fund is budgeted with a net positive of S117.
(Fund 105-05) Agency General revenues are from property tax funds and other revenues. This fund isbudgeted w¡th net positive of 5105,797. Tax Revenues are estimated based on projected June FY 2016-2017 actuals plus 3%
(Fund 120-20) Waste Water revenues are forecast at 6% increase adopted by the Board on December'J.'J.,2OL4. Waste Water is budgeted with a net positive of 5169.00 (5298,229 is funding Waste Wateroperating projects)
Non-Operating Revenue Assumptions:
lncludes external grants for CDBG, Buckhorn DBP, Lake Camanche Tank 9, Six Tank Repl, CDAA StormRepairs, Tanner Backwash Recycling, lone Hydroelectric and Camanche Waste Water in the amount of58,202,133. (See full Capital Projects list contained in the budget) Water Participation Fee Revenue is
estimated at 5400,000 or 40 new connections. This budget amount is conservative given that two large
developer projects in lone.
3

Non-Operating Salaries and Benefits total SL,OO9.72O which are largely supported by grant fundsreceived
Operating Expenses
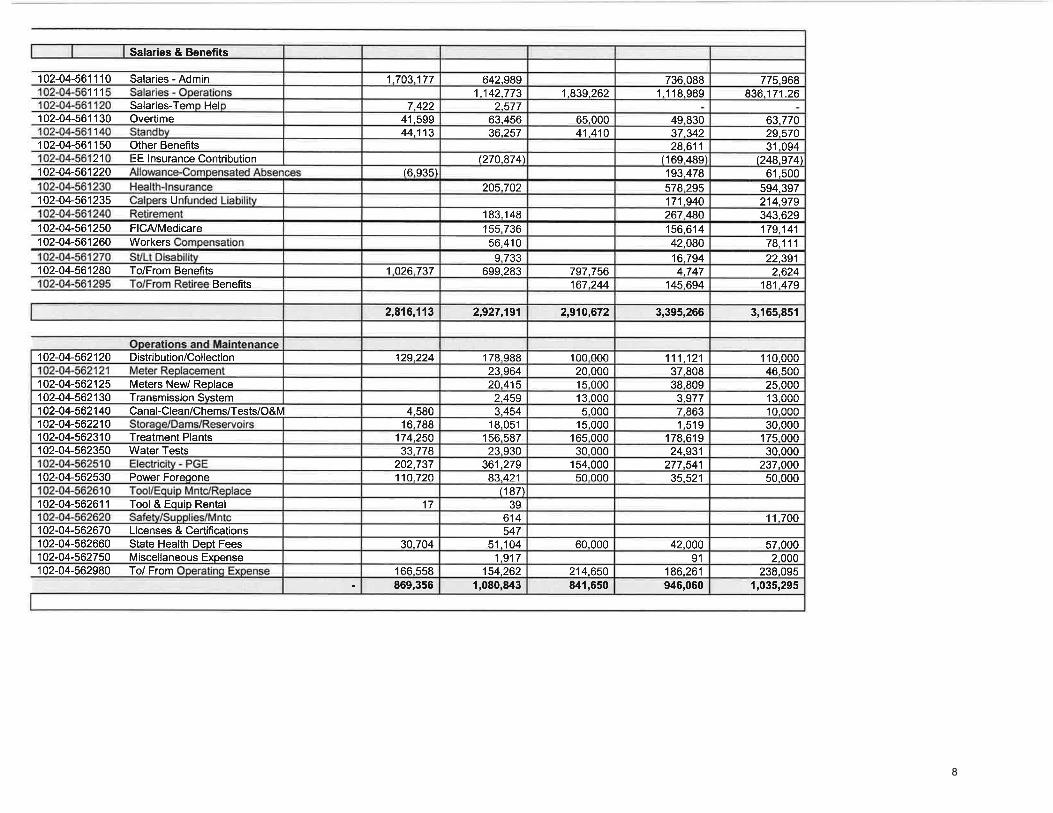
Total Salaries & Benefits Assumptions:The Agency has 41 approved positions which are considered in the budget. Benefits increase based onindividual headcount and projected percentages from JPIA for health insurance and CaIPERS forretirement expenses.
Operations and Maintenance:Slightly higher than proposed actuals, Meter replacement project, State Regulatory fee increases, 2
project related permit amendments and OSHA required ARC flash safety project are the primary drivers
AdministrationRemains at or below previous years actuals
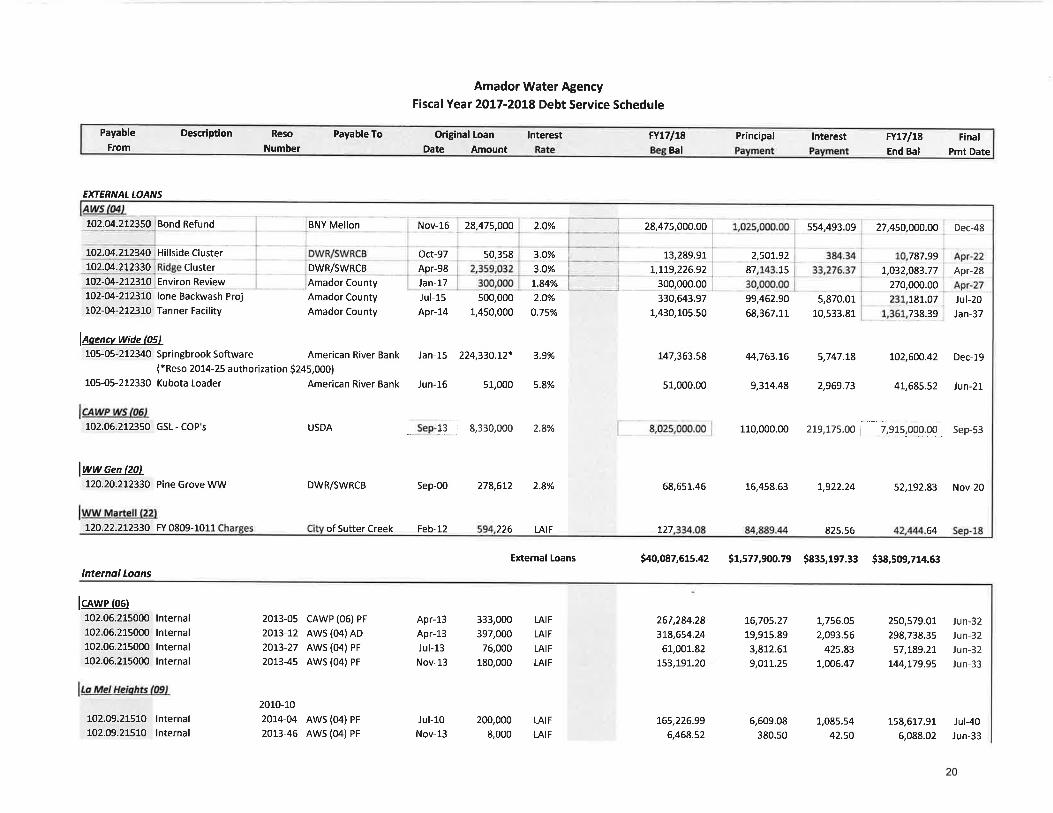
Debt Service
2016 Bond refunding has reduced total debt service payments
Fixed Assets
B ud geted Co nsistent with 2OL6-2OL7
Generator will only be purchased if grant received from Amador Air District (grant amount not reflectedin budget)
Transfers ln and Out are consistent with previous years to cover interfund loan payments, projectsupport between funds and reserlre transfers
4

Brandt Cook
Res¡dent Eng¡neer
Lucas Curthew
Ass¡stant Eng¡neer
Seth Kaßchner
lnspector
Erik Christeson
N¡ck LawsonWaterTreatment lll
George Barnes
WaterTreatment ll¡
Michael Thompson
WãterTreãtment l¡
.,oelMottishaw
WeterTreatmenlSupery¡sor
Lonnv Brewster
Wasteruater ll
Wastewater I
Jayson caspary
M¡ke Munson
Wastewater I
Jerrv Goshorn
WastewaterSupery¡so.
Damon Wvckoff
OpeGtigns Manager
lnstrument/Elec Tech
leff Rândell
Andrea H¡nton
Adm¡n Ass¡st lll
Pat Purnell
Electrical controlSuperuisor
D¡str¡but¡on lllVecãnt
Distribut¡on lll
Nick Tamantini
Martv McNew
Distribut¡on ll
Jeffery shortr¡dse
D¡str¡bution ll
Steve Hess
Distribut¡on ll
Distribut¡on I
N¡ck Pent
Aarron HauglandUt¡lity I
Kres M¡ller
Distribution/CanalSupery¡sor
Br¡an Bates
Util¡ty ll
Dustin MillerUt¡lity ll
Mitch GowanUtility I
Don Hutch¡son
ConstructionSupery¡sor
Cr¡s ThompsonAGM/ Clerk of the Board
Gene Mancebo
General Manager
Board of Directors
Paul Molinell¡ Jr.-D¡str¡ct l, Gary Thomas- D¡str¡ct 2
R¡ch Farr¡ngton-D¡str¡ct 3, Robert Manassero-D¡str¡ct 4,
Art Toy-D¡strict 5
Rvan TeschPurchãsing Ageht
C¡ndv Hansen
Accounting Clerk lll
Deborah Vôn Loehr
Account¡ng Clerk ll
TGcev Havs
Finance Manager
El¡zabeth EdEman
Customer Seru¡ce Repil
Rep
Linda Nafus
Meter Reader
Susan Schafer
N¡ck Ya.dlevMeter Reeder
Andrea Petretti
Customea Sewice¡t
Karen Gish
HR/Off¡ce Manager
5

OperatinÊ Revenues
Operatinq Expenses
Non Operating Revenue
Non Operating Expenses
Water Sales
Wastewater Sales
Other Revenues
Transfers lnTotal Operating Revenues
Salaries
Benefits
Calpers Reduced Discount Rate
Operations and Maintenance
Administration
Debt Service
Fixed Assets
Transfers OutTotal Operating Expenses
Net Operating lncome
Participation Fees , CFD , lnterest etcTransfers lnTotal Non Operating Revenue
Salaries (Projects)Benefits (Projects)Other Direct Costs (Projects)Transfers OutTotal Non Operating Expense
FY 13-14Actuals
FY t4-15Actuals
1,778,029
1,194,355
2,621,236
121,518
1,411,235
9,551,5351,095,153
10,646,688
9,921,871206,117
'10,986,968
FY 15-16Actuals
6,624,168
1,420,900
1,515,857
1,172,974
3,071,084
1,928
738,995
4,923,98134,435
4,958,416
3,397,68427,OOO
3,998,44r
FY 16-17Budget
FY t6-17Actuals
6,587,382
1,397,310
FY 17-18
6,823,384
1,699,156
2,334,084
1,459,195
262J691,570,154
1,052,719
2,532,846
83,000
990,810
9,062,0512,068,202
11,130,252
789,008220,712
9,272,006847,579
11,129,306
947
6,345,550
1,609,1701,385,121
3,848,220 3,616,075 3,561,731
11,85410,974,594 10,116,913 10,282,055 9,175,820 10,284,977
1233,3M1 (580,742) 130,683 332,502 (94,2721
1,335,001
1,088,080
3,504,088
83,000
710,155
6,625,9272,146,0389,771,964
7,639,150327,000
8,544,874
2,604,161
1,309,762
205,049
1,418,623
1,142,639
2,483,732
621,358
621,358
210,152
1,070,341
1,280,493
(659,135)
(326,634)
858,980 573,757 578,724
(340,280) 959,975 227,090
6,682,606
Net Non Operating lncome
(573,62¿l) 379,233 357,774 (93,326)
6
102-04-411010Multi-User
102-04-412000102-04-41102-04-413010
14000
102-04-415010 Transferlnholesale
102-04-417000 nt Use102-04-4't8950102-04-411 02-04-41 901 0
102-04-423050 ServiceContract
102-04-423100 ineer &
Other102-04-425020 of
11000
102-04-425500
Service
Surcha
Reim
GeneralTransfer ln lnterfund Loans
Reserves102-04-425500 Transferin
FY 17-18Budqet
1.691.1051.506.764
637.712
344,60085.838
734.82221.OO111.500)
1.803.042
6,823,394
41.25065.000
115,00045.000
3.00041.000
146.535100.000
556,785
123.306260.000
26.72622.OOO
432,032
7,812,20'l
FY 16-17Actuals
'1 .641 .8501.428.212
604.466
326.63581.363
696,51419.906
(14.624\1,803,042
(2\20
6,587,382
27.O5171.648
109.88232.482
235.72994.377
103.342595,568
1,270,078
143.938
143,938g,00l,39g
FY 16-17Budoet
1.852.1251 .016.300
25,000525.000
1.056292.OOO
52,000750.000
43.470901
(1.500)1 .789.198
6,345,550
30.00010,000
125.00025.000
3.20015.000
177.334120.000302.102807,636
350,000260.000
40.4285.500
580.7711,236,700
8,389,886
FY 15-16Actuals
93 9782.233.180
21 .219607.7't5
'1.336
405,80876.796
737.301
73.6441.086
(19 276\1.551.394
112.260727.727
6,624,'t6g
25.9004A.73798.940
9.942122.79560.813
137.486
504,613
3261A1160,00028.00310.70s7.434
532,327
7,661,108
FY 14-15Actuals
2.503 990194.693370.23393,000
513.360144.150861,083209.081199.950
110.9781.639.759
153.565
6,662,805
16,4866.701
175.57922.961
3.52259,1 10
177.577105.820
567,756
515.839155.338
55.902
727,079
7,957,640
FY 13-14Actuals
)2-04-424OOO Operatinq lnterest
)2-04-425100 Cap Facil/Standbv
)2-04-423040 Meter Set Fees
,IO2 AWAWATER SYSTEM
Revenue Sub Totals:
7
102-04-561 't 10 Salaries - Admin
Salaries-Tem Hel102-04-56't 'l 30 Overtime
102-04-561 150 Other Benefits21
102-04-561220
102-04-561235 U
102-04-561250 FICA,/Medicare102-04-561260 Workers
102-04-561280 To/FromBenefits
102-04-562980 To/ From
775.968836j71 26
63.77029.57031.094
Q48.974)61.500
594.397214.979343.629179.14178.11122.3912.624
181 .479
3,165,851
I 10,00046.50025,000l3_000lo 00030.000
175_000
30.000237.O00
50,000
't1.700
57.0002.000
238.0951,035,295
736.0881 .l I 8.96S
49.83037.34228.611
fi69_4891193.478574.295171.940267,480
3,395,266
I 56.61442.08016.7944.747
145.694
111.12137.80838 809
3.9777.8631.519
1 78.61924.931
277.54135.521
42,0009l
186.261946,060
1_839.262
65.00041 .410
797.756167.244
2,910,672
100.00020.00015.00013.000s.000
15.000165,00030 000
154.00050.000
60,000
214,650841,650
642,9891.142.773
2.57763.45636.257
(270.874]'
205-702
183,148
155,73656,410
9.733699.283
2,927,191
178.98823.96420.4152.4593.454
18,051156.58723.930
361.27943.421
1187)39
614547
51 1041.917
154.2621,080,843
1.703.177
7.42241,59944.113
16.935)
't.026.737
2,816,113
't29.224
4.580l6 788
174.25033.774
202.737110.720
17
30.704
166 558869,356
:E lnsurance Contribution
111
1
Salaries & Benefits
Benefits
102-04-562120 Distribution/Collection
102-04-562125 Meters New/ Reolace102-04-562130 Transmission Svstem102-04-562140 Canal-Clean/Chems/Tests/O&M102-04-562210102-04-562310 TreatmentPlants102-04-562350 WaterTests
102-04-562530 PowerForeoone
102-04-5626'l'l Tool & Eouio Rental
102-04-562670 Licenses&Certifications102-04-562660 State Health Deot Fees102-04-562750 Miscellaneous Expense
8

102-04-572550
1 02-04-569350
102-04-5691 10
1 02-04-569500
istration
Transfer outs
36,0002.880
95.000635.40097,66780.000
1
832.38(
33.06979.016
2.419.970
74,700
74,700
231,337
144,623
375,960
8,019,723
7,812,201
8,018,723(206.5221
16.70893.897
747.44282.95771.184
'l
932.227
63.2262.394.110
62,786
62,786
7,910,410
8,001,398
7,810,410
190.988
61 36290.000
638.91070.000
1 12,500
772
11
2.229.689(90.000)124.OOO
27.0003-397.946
74,700
74,700
64,000
138,995
202,995
8,400,734
8,389,886
8,400,734
{10.849t
31 .97192.442
671.81379.72976.129
1.586
276,|
1.632.577
84.00021.783
2,963.636
6,332
6,332
153,022
7,925,340
7,661,108
7,925,340
1264.2321
29.14177 .171
515.62863.44690.813
823
1.208.325
17.2171.969.036
94,785
94,785
66,391
88,040
139,634
294,065
6,920,377
Director CompensationTo/From Director ExoenseCustomer BillinqTo/ From Office ExoenseI nsurance (Prooertv/Liabilitv)Leoal FeesWater Riqhts
Water Debt ServiceWater Debt Service lnterest2006 Series A RefundinqReserve ReouirementsTo/From Equip Lease
To/ From Fixed Assets
Transfer out Operating
Transfer Out Debt Service
Transfer Out lnterfund Loans
Expense Subtotal
Net Ooeratino
801 02-04-5661 1 0
102-04-566270102-04-566490102-04-5672901 02-04-5675001 02-04-567600
9

FY 17-18Budget310,000
200310,200510,379
820,579
805,579
5l
15
FY 16-17Actuals
FY l6-17Budget
FY 15-16Actuals
FY 14-15Actuals
1361
978318
14,306
FY l3-14102-23 CFD #1
310,847
310,847
11
319,922
142,442 579
3
1
Actuals
081 1
935 310,200
944
85411
Total Non Operating Revenue
Transfer in from Reserve
285,000
300,00015
285,000
296,854
Revenu
Tra
200310,200
308,975960
Transfer Out CFD #1 ATL, WTPAdmin Feeïotal Non Op Transfer Out, Fees
CFD # 1 Revenueslnterest (Restricted)
102-23-493070102-23-493050
1 02-23-5691 60102-23-571150
CFD Tax WTP @ 6130117 653,522
10

FY 17-18Budget
74,050
40,000114,050
57.0004.000
9,5708,5504.6672.599
547
37,805 18,737 36,500 43,837 86,933
1,004 1,000 1,296 3,000I,004 1,000 1,296 3,000
2,0007,533 5,000 938 2,000
22,000
22,000
42,012 27,274 42,500 46,071 113,933
114,050I f 3,933
117
FY 16-17Actuals Actuals Actuals Budqet Actuals
4,230
39,53443,764
62928.302
3,1 89
7,1401,7181.798
859202
938
43,76446.071(.23071
FY 13-14 FY 14-15 FY 15-16 FY t6-17
3,000
45,00048,000
18,3003,000
15,200
5,000
48,00042.500
5.500
1,994
44.10046,094
13.683
2,669
(1,937)
8908ô384751250
I ,160
7,533
46.09427.27418.820
43,607
43,607
23,500
2,673
11,632
4,207
43.60742.0121.595
103 OUTSIDE SERVICES
1 03-03-424060
1 03-03-4231 50
RevenueOther Operating Revenue
Outside Service ContractsRevenue Subtotal
103-03-561110103-03-5611151 03-03-561 1 301 03-03-561 1 401 03-03-561 21 01 03-03-561 2301 03-03-561 2401 03-03-561 250103-03-5612601 03-03-561 270I 03-03-561 280
SalariesSalaries AdminSalaries OpsOvertimeStandbyEE lnsurance ContributionHealth-lnsuranceRetirementFICA/MedicareWorkers CompensationSVLI DisabilityTo/From BenefitsSalaries and Benefits Sub total
1 03-03-562350Operations and MaintenanceWater TestsSub Totals
AdministrationMiscellaneous ExpenseSub Totals:
103-03-562750
Transfer Out to Water
Sub Totals:
Expense Subtotal
REVENUEEXPENSE
Net Operatinq
11

Accou 105 AGENCYGENERAL
105-05-561280 To/FromBenefits
Revenueslnterest - OperatingTax RevenueOther Operating RevenueSub Totals:
Transfer From Other FundsTransfer ln Debt ServiceTransfer ln OtherTransfer From ReservesTransfer ln lnterfund Loans
Sub Totals:
Revenue Sub Totals:
Salaries & BenefitsSalariesSalaries - Temp HelpOvertimeStandbyUnemployment lnsuranceAllowance-Compensated AbsencesHealth-lnsuranceEmployee lns/Pers ContributionCalpers Unfunded LiabilityRetirementGASB 68Fica/MedicareWorkers CompST/LT Disability
Retiree Health BenefitsRetiree Portion of Health lns.To/ From Retiree BenefitsSub Total
105-05-424000105-05-4240501 05-05-424060
105-05-4255001 05-05-425600105-05-495030105-05-495400
1 05-05-561290105-05-561300105-05-561295
105-05-5611101 05-05-561 I 20105-05-561 130105-05-561 1401 05-05-561200105-05-561220105-05-561230105-05-561210105-05-561235r05-05-561240105-05-561245105-05-561250105-05-561260105-05-561270
FY 17-18Budqet
350270,457
75,000345.807
19.990
19.990
365.797
1,000
1,9503,200
6,150t6 150ì
230,830(29.187\
Q01.643\l0ì
FY 16-17Actuals
3,765262.58083,987
350.331
350-331
(691
(3,199)
1,9502,854
793203
2.53215.730)
180,544(18.662)
(146,590)
12.093
FY 16-17Budqet
500250,000
15,000265-500
18,682
18.682
284.182
10,00030,000
751.504(267.854\
465,000
216.703104.67818.979
1.329.010t1.329.0r0)
202.292(16,465)
n85.827\
FY r5-16Actuals
7.O78239,887
62,115309.080
19,890
19.890
328.970
74.984
2,1336.656
674 241
446,8891.950
13j2340,660
5261,190,218
11.190.131)
186.712(3,483)
n52.435\74,984
FY l¡l-15Actuals
754105.440255.040361.234
18.757
151,639
170.396
531.630
86.424777.223
446,583
218,413107.229
14,456
I 648 30s
170.700
(175.463)(2.7101
FY t3-14Actuals
12

105-05-562405105-05-562410105-05-562420105-05-562540105-05-5625411 05-05-56261 0105-05-562620105-05-562630105-05-562650105-05-562670105-05-562680
105-0s-562980
105-05-5661 10105-05-5661201 05-05-5661 40105-05-566150
1 05-05-5661 80105-05-566210105-05-566220105-0s-566230105-05-5662401 05-05-5662501 05-05-566251'105-05-566252
105-05-566260105-05-566280105-05-5663001 05-05-56631 0105-05-566320105-05-566340105-05-566350105-05-566360105-05-566370105-05-566380105-05-5663901 05-05-s66400105-05-566420105-05-567300105-05-567350105-05-567500105-05-567600
Operations and MaintenanceVehicle Fleet ManagementVehicle Maintenance/RepairGas & OilRadiosAlarmsTool/Equip Mntc/ReplaceSafety/Supplies/MntcUniformsAir District PermitsLicenses & CertificationsMileageÆravel/MealsSub totalTo/From OperatingSub Total
AdministrationDirector CompensationDirector Travel/Confernc/M ealsDirector lnsuranceElection ExpenseSub TotalTo /From Director ExpenseOffice SuppliesPublications/AdvertisingPostagePrintingOffice Equip M ntc/SoftwarelT Contract ServicesServer Replacementsïraining/ConferencesMileage/Travel/MealsHR ActivitiesMembership DuesCounty Admin FeesMerchanUCredit Card FeesProperty Tax Admin CostEmployee RelationsManager's ExpensePublic RelationsLobbying ActivityOffice Bldg & Grnds Mntc/UtilTelephone/Ans Svc - OfficeConsultants Acct and FinancialConsultants (Grants /Studies)Legal FeesWater Rights
SubtotalTo/From Office ExpenseSub Totals:
105-05-566490
10,000
75,00059,80081,200
2,5002,500
17.750
18,0002,8004,0001,000
264,5501264.550)
3,000200
3,200(3.200)8,0003,0008,2504,000
75,000125.00040,00020,000
5005,000
34.000
32,500R 5005,000
6.0003,000
111.50041.75055,00020,000
100,000
706,000(706.000)
43,43251,65673,1 00
7,7246.136
16,5562,4432.154
203.202( 187.368)
15,834
16.0532,355
156
18,564118.3561
6,3543,1405.077
651
58.079104.42028,13418,098
3407.570
42.364688
32.433I 3001,696
525,048
97181.23042,54564.136
185,001124,243
820.777ß20.7771
50,00057,00080.000
2,5002,500
15.0008,000
15,0002.5005,0001.000
238,500(238,500)
40,0003,000
18020,00063.180
(63.180)r4.000
7005,0007.000
75.000125,00040,00015.000
1,5003.000
70.000
21.OOO
8.2003.500
5,0003.000
36.00065,00057,00030.000
125,000
709,900f699,900t
61.89084,189
2,271
10,3739,541
1 5,1 092,5503.515
264193,048
n71.40321.646
33,8072.382
158
36.347(35.629)14,0161,0482.4458.297
71,020114.86244.78712.7892,5532,405
69.694365
21.927R 2AÂ
1,400
7.42129,98780.83768.813
140,400159,993188,954
89s
1 ,053,1 75(988.831)
52,903102,209
2,163
17,81513,08316,5682,7092.820
210.270Q10.270)
31.3704.922
18675
36,553137.360113,913
6775,9957,007
1 58,1 79
18,087590
15,58344,O17
20,5007 5765,236
2722.570
71,30193,93055.141
324.090
82,792
928.700(928,700)
13

Debt ServicesPrincipal American River BankDebt Service lnterest PaymentOffice Equipment Lease/RentalSubtotal
105-05-569270 To/ From Office Equipment Lease/RentalSub Totals:
1 05-05-5691 30105-05-5691401 05-05-569220
105-05-572250105-05-572260105-05-572270105-05-572280105-05-5722901 05-05-572550
105-05-569300105-05-5691 10
Fixed AssetsOffice EquipmentShop EquipmentTools & lnstrumentsConstruction EquipmentEquipmenUVehicle PurchasesTo/From Fixed Asset ExpenseSub Totals:
Tranfers OutTransfers OutTransfer Out Debt ServiceSub Totals:
Ëxpense Subtotal
Revenue
54.0788,717
25,00087.795
(87.795)(0)
15,00018,00050.000
(83,000)
260,000
260.000
259.999
365,79725q 999105,797
(70,251\
53,4088.271
24,14585,824
15.573
39,467
30.296
(69,763)
143.937
143,937
187.437
350.331187.4?7162,895
83.000)
29.4725,747
25,00060,219
(65.219)
{5.000)
45,0008,000
30.000
260,000
260-000
265.000
284.182265.000
19,182
43,2476,460
26,1 s975,866
(73,910)
1.956
1.928
5,1 08(7,036)
t0t
160.000
160.000
322.930
328.970322.930
19,006)
22,0722,529
22.073
21.601
21.93916,22618.555
64,798(121.518\
27.668
155,338
155.338
531,63020LAA7
Net Operating 326,763 6,040
14

120 AWAWASTEWATER
Waste Water - Sales120-20-418000 Ww Service Charges1 20-20-41 8950 Adj ustm ent To Sales-W rite-Offs120-20-419000 Debt Service Charge
Actuals
120-20-423050120-20-423100120-20-423130102-20-424000120-20-424060120-20-425100
Sub TotalOther Operating RevenueService RevenueEngineer & lnspec FeesBad Debt RecoverylnterestOther Operating RevenueCap FaciliStandbyLazy Creek Payment ScheduleSub Total
Salaries & BenefitsSalaries - AdminSalaries - OperatingSalaries-Temp HelpOvertimeStandbyOther BenefitsEE lnsurance ContributionAl lowa n ce-CompensatedHealth-lnsuranceCalpers Unfunded LiabilityRetirementGASB 68Fica/MedicareWorkers CompensationSlLt DisabilityTo/From Benefitsïo/From Retiree HealthSub Totals:
Transfer From Other Funds120-20-495400 Transfer ln lnterfunds Loans120-20-495500 Transfer ln Partic Fee Fund
Sub Totals
Revenue Sub Totals:
120-20-561110120-20-561115120-20-561120120-20-561130120-20-561140120-20-561150120-20-561210120-20-561220120-20-561230120-20-561235120-20-561240120-20-561245120-20-561250120-20-561260120-20-561270120-20-561280120-20-561295
FY 17-18Budqet
1.589.7s6
109.400
1.699.1s6
20,0002.500
5.00045.000
100.000172,500
27.OOO
27,000
1,898,656
170 334288.272
13.99820.000
6.826154.653)13.500
139.89647.19075.431
39.32417.1464.91s
32020 164
802,665
FY 16-17Actuals
1.301.612(12.802
108.500
I _397-310
20.3461 400
213
4.34039.550
65,849
1,463,159
75.131284.504
12.55318.9884 779
137 135ì37.1 59
130.20633. I 0953.910
32 03312.0563.636
98414.659
684,570
FY 16-17Budoet
1,499.770
109.400
't.609.170
5.000
50049.000
54,500
27.000
27,000
1,690,670
478.497
12.00016.840
88.64018.583
614,559
FY't5-16Actuals
I .319.955
100.944
1.420.900
2.780
0192
49.127
52,099
27.OOO
27,000
1,499,999
426.177
27712 79521.649
119 02215.244
595,r 63
FY 14-15Actuals
1.365.425(2.44519.659
I _382_639
20,616
1,73016.25747.839
86,442
27.000
27,000
1,496,081
381.979
97612.5s2
5 534
8.039
227.19417 546
653,820
FY 13.14
15

120-20-562120120-20-562210120-20-562220120-20-562310120-20-562350120-20-562420120-20-562510120-20-562530
120-20-562610120-20-562611120-20-562620120-20-562660120-20-562670120-20-562750120-20-562980
1 20-20-5661 1 0120-20-566180120-20-566270120-20-566490120-20-567290120-20-567350120-20-567500
120-20-569140120-20-565250120-20-569260120-20-569270
Operations and MaintenanceDistribution/CollectionStora g e/Damsi Reservoi rsDisposalTreatment PlantsWater TestsGas & OilPlants/PumpsOther UtilitiesiPower LossAlarm MonitoringTool/Equip Mntc/Replaceïool & Equip RentalSafetyiSupplies/MntcState Health Dept FeesLicenses & CertificationsMiscellaneous ExpenseTo/From Operating ExpensesSub Totals:
AdministrationD¡rector CompensationTo/From Director ExpenseCustomer BillingTo/From Office Expenselnsurance (Property/Liability)Consultants Grants / StudiesLegal FeesSub Totals:
Debt ServicesDebt Service lnterest PaymentPrincipal Pinegrove WWPrincipal Sutter Creek AgreeTo/From Capital/Equip LeaseSub Totals:
120-20-572550 To/ From Fixed AssetsTransfers Out To Other Funds
1 20-20-569350 Transfer out Operating120-20-569110 ïransfer Out Debt Service120-20-569500 Transfer Out lnterfund Loans
Sub Totals:
Expense Sub Totals:
40 000900
22.OOO
36.00021 000
82.00024s,OOO
s0042.OOO
17026.455
516,025
4.000320
8.00070.60010.852
10.000103,772
2.74816 45984.889
8.780112,875
8.300
294299
56.551354.850
t -898.¿871_898-656
1.898.487169
31.3464
25.81518.5s819.A52
7
71.413245.468
1241.182
170
18.737472,563
1.8065.819
743209.218
35.288130,451
2.909't 6.01063.6777.025
89,622
6.976
1.384-1831.463.1591,38¿ 183
7A 977
40.000900
22.00036.00021.OOO
74.363231.178
40.860
100
25.950492,351
6.81810.00070.s9010 000
12.500r r 0,308
2.73316.01084.899
2 500106,142
8.300
137.747
109.413247.160
1_574.8201.690.6701.574.42î
I 11 -a50
28.437
9,91622.34820.370
70 063229.477
34.948
15019.305
435,014
3.55213.01974.646
8.80420 a?434.1 15
154,960
2.80715.57484.899
2.212105,492
511
129.119,t29 119
'1,419,7481.499.999't,4't9.744
80_251
31,538900
14 64626 2AO
24.003
76.501
215.295
43 267
21 353453,783
3 7368,660
66.1068.575
27 911114,988
2.9541 5.1 5084.88S
2.207105,200
110.628
16/1342
1,492,1731.496.0811.492.173
3.908
REVENUEEXPE
NET
16

FY 13-r4150.04 AWAWATER PROJECTS
Capital Revenues-Water150-04-493010 lnterestRestricted150-04-493030 Part¡cipationFees150-04-493050 lnterestParticipationFees150-04-424070 Loans/ Grants R150-04-494000 Loans/GrantsE150-04-494050 LoanProceeds
1 50-04-4950201 50-04-4950001 50-04-495300150-04-1 50-041 50-04
1 50-04-57001 0150-04-5700201 50-04-570040I 50-04-570050
Transfer in CFDTransfer in Participation Fee FundOperating Transfer ln for ProjectsTransfer in lnterfund LoansTransfer in GSL project accountTransfer in from ReservesReimbursements
Capital Revenues
Salaries and Beneftis (Projects)Salaries RBenef¡ts RSalaries E
Benefits E
Legal FeesWater RightsConsultants RConsultants E
Plants RPumps RTransmission RDistribution RPlants E- needs deletePlants E
Transmission E
Distribution E
Storage E
Expenses (Projects)Projects- Water ReplacementProjects - Water Expansion
Gapital Expense
Cap¡tal RevenuesCapital Expenses
10,735,935 3,937,304 7,569,14
1 50-04-567500I 50-04-5676001 s0-04-5700301 50-04-5700351 50-04-571 01 01 50-04-571 020I 50-04-571 0301 50-04-571 040150-04-571 1 101 50-04-57201 01 50-04-572030150-04-572040150-04-572060
10,183,53910,735,935
4,666,3103,937,304
805 579
231.337
FY 17.18Budoef
I 500400.000
't ,500
7.853.814116 618
8-373-432
129 987
38 6201.205.5239.578.95s
732.859188 708
921.566
1.373.889
7.283.499
8.657.388
9.578.955
262,024
FY IG17Actuals
168.499
190.83s
62't.3s8
145 465s6.097
201.562
20.8521?A 737
34.206
339.713
102.850344 732
3.623
971 .0893623
2
1.176.274
FY 16-17Budoet
1.500450 000
1.5005.050.560
300.0005-803 560
384.91s916,668
75.000107.446450.000
1_934_0297 747 5âA
311 534175.2533't 38517 889
536.061
5 880 081
1 .1 53.002
7.569.144
1.600.000
FY 15.16Actuals
384.O27
1 899 358775.490
7 435
4_666_3lO
4s6.96s96,6916 2603.100
563 017
3.316 90357.384
337¿247
3.402.760
FY 14.15Actuals
1 505120.358
2 1505.688.505
968.261
10.183-539
349.060348 0366s.85276.322
839_270
6.553.2133.343.4529.896_66s
1,1 9,578,955
17

FY 17-18Budqet
30,000100
348,319378.41954,000
298,299
and Benefits1 50-20-57001 0 Salaries 11 756 27 174 761 149
32,005
88,154
P Wastewater ent 95 614 18
614.618
27,000
730,718729.772
946
FY 16-17
Actuals
137.979137.979
137,979
1,829
8.590
95.629
104.219
137,979104,21933.760
FY 16-UBudget
30,000100
482,067512,16727,000
137,74747,262
212.OO9
724.176
15,489
42.663
606.067
27,000
648.730
724,176648,73075.M6
FY 1s-16
Actuals
265,1 05
27.000
292,105
2,300
10,740
23,39723,397
27.000
34,137
Net Revenue
FY 14-15
Actuals
15,432903
126,892
143,227
7,954
19.710
53,754
19,710
FY 13-14
ActualsAWA WASTEWATER PROJECTSGapitalRevenueslnterest RestrictedParticipation Feeslnterest Participation FeesLoans/ Grants RLoans/Grants E
Transfer in Participation Fee FundOperatinq Transfer ln proiectsTranfer in lnternal Loans
Gapital Revenues
BenefitsSalariesBenefits
Projects- Wastewater Expansion
Transfer Out Participation Fee Fund
Gapital Expenses
150-20
r 50-20-49301 01 50-20-4930201 50-20-493050150-20-4240701 50-20-494000
I 50-20-4950001 50-20-49s3001 50-20-
150-20-5700201 50-20-5700401 50-20-570050
I 50-20-569400
718
772
Gapital RevenuesCapital Expenses
18

Priority W/WW Cap¡tal? JIC Project
Subtotal Work Hours Ava¡lable For Capital Projects
Buckhorn Ridge/Carson CDBGBadger Street Bridge Construction - SC Liablelone WTP Expansion Design & Construct¡onNY Ranch Road Realignment - AWA LiableBuckhorn DBP/BW Compliance Construct¡onSix Tank Replacement - Hazard M¡tigat¡on GrantLake Camanche Tank I & lntertie
NY Ranch Road Realignment - County LiableCDAA Storm Repairs - Preston PS lmprovementsCDAA Storm Repairs - Amador CanalCDAA Storm Repa¡rs - Eggeman LaneTanner Backwash Rec¡rcling Grant App / DesignCamanche Serv¡ce Lateral ReplecementCAWP Water Rightslone Hydroelectric - Design & 25% ConstSDP Phase A - Lower Canal Pipinglone Canal Abandonment - Design/Easements
Funding Source AWA Labor Sub AWA Labor OH Materials Consultants Contractors Project Total
YESYESYESYESYESYESYES
YESYESYESYESYESYESNO
YESYESYES
YES
YESYËSYESYESYES
14017040'49404050904051 70600810601 020
1 300320404860 &
405200
GranVOper RatesReimbursed
Part. Fees / CFDOperating Rates
GrantGranvoper Rates
Grant
ReimbursedGranvoper RatesGranVOper RatesGranUOper Rates
GrantOperating Rates
LoanGranl/Loan
Operating RatesOperating Rates
$ 52,9,{4.00 $$ 1,566.08 $$ 13,878.80 $$ r 3,672.80 $g 7,270.48 $$ 55,088.40 $$ 87,949.90 $
$ 16,663.36 $$ 260,192.99 $$ 100,000.00 $$ 41,600.00 $$ 11,605.76 $$ 18,134.40 $$ 4,034.96 $$ 11,913.60 $$ 23,800.00 $
21,761
1 20,000
122,58058,416¿15,000
-$3s,000 $30,000 $
-$56s,000 $
-$110,283 $238,350 $
-$
$ 893,813 $$-$$ 642,000 $$-$$ 2,071,330 $$ 1,081,951 $$ 1,450,050 $
283,0141 70,000
60, r 80
10,000
472,375
998,6952,459
805,57924,966
2,205,325't,226,8561,652,723
30,1 78893
7,9117,7934,144
31,¿100
50,131
9,498
6,615r 0,3372,3006,791
13,566
$-$-$$ 3,500$-$-$ 19,592
10,000
3,820
¿o,eso
36,161578,207200,000
64,000583,22185,321
1 16,618729,429
37,366
$$$$$$$
$$$$$$$
$$
$$$$$$$$
$$ 9,750.56$ 5,558$ - $ 5,000$ - $ 20,308$ 730,066 $ 187,116 $ 83,762 $ 1,351,389 $ 7,134,713 $ 9,367,235
1ffi NO 500700 CDAA Tree MortalityHighway 88 Overlay
Granvoper RatesOperating Rates
1,607 $161 $
$$
$$
2,819.84 $282.88 $
$ 3,103 $ 1,769 $
2s,000 $ 56,250 $- $ 16.000 $
3,366 $1,507 $366 $
7,606 $18,982 $
20,000 60,0008,000
1 00,000
85,67716.444
351,16584,1529,009
120,950't27,285
$ 25,000 $ 72,250 $ 102,121
1
1
1
1
2
Camanche Wastewater Design/CEQÁ,/NEPAPine Grove Monitoring Well ReplacementH¡ghway 49 OverlayH¡ghway 49 / Ridge Road Manhole ReplacementMartell Force Ma¡n Relocation
GrantOperating RatesOperating RatesOperating RatesOperating Rates
$ 5,905.60 $$ 2,644.32 $$ 642.88 $$ 13,343.68 $$ 33,302.40 $
,89334 $$$$$75,000
$ 5s,839 $ 31,828 $ 75,000 $ 361,893 $ 168,000 $ 692,561
$ 789,007.69 $ 220,712.40 $ 10,161,917
19
Amador Water AgencyFiscalYear 2OL7-2Ot8 Debt Serv¡ce Schedule
Payable
FÍomDescriptíon Reso
NumberPayable To Original Loan
Date Amountlnterest xt7lt$ Principal lnterest Fft7ltB
End Bal
Final
Pmt DateBal
EXIERNAL LOANS
t02.o4.212350 Bond Refund
LO2.O4.212340 Hillside Cluster
ro2.M.272330 Cluster
LO2-04-2r23r0 Environ Review
LO2-04-2I2310 lone Backwash Proj
1O2-04-21.23tO Ta n ner Faci l¡ty
lnternal Loans
lcnwp toelL02.06.215000 lnternal102.06.215000 lnternal102.06.215000 lnternal102.06.215000 lnternal
Ita met ne¡ohts læ)
102.09.21510 lnternal102.09.21510 lnternal
Apr-13Apr-13
Jul-13
Nov-13
Jul-10
Nov-13
333,000
397,000
76,000
180,000
200,000
8,000
2.O/o
2.O%
0.75%
3.9%
s.8%
LAIF
LAIF
LAIF
LAIF
LAIF
LAIF
Jun-32
Jun-32
Jun-32
Jun-33
27,450,000.00 Dec-48
787.99
r,o32,083.77 Apr-28270,000.00
L8r.O7 Jul-20
Jan-37738.39
lAaencv w¡de ,/05)
105-05-212340 Springbrook Software Amer¡can River Bank
(+Reso 2014-25 authorizat¡on S245,000)105-05-212330 Kubota Loader American River Bank
lcewpwsøatLO2.06.2r2350 GSL - COP',s USDA
lww oen lzolL20.2O.2L233O Pine crove WW DWR/SWRCB
lww ul"rtetl (zz)
t20.22.2L2330 FY 0809- 101 1
t_sép:r¡ j s,33o,ooo 2.8Yo
Sep-00 278,612 2.8%
ofSutter Creek Feb-12 226 LAIF
External Loans
110,000.00 2ls,t7s.ooi z,s1s,ooo.oo] sep-s3
68,651.46 16,458.63 L,922.24 52,t92.83 Nov-20
825.56 64
$40,087,6ts.42 çt,s77,9oo.79 9835,197.33 g3&509,714.63
Amador County
Amador County
Amador County
500,000
1,450,000
224,330.L2*
51,000
Jul-15
Apr-14
Jan-15
Jun-16
330,il3.971,430,105.50
r47,363.58
51,000.00
267,2U.28318,654.24
61,001.82
153,191.20
165,226.99
6,468.52
99,462.90
68,367.tt
44,763.16
9,3r4.48
t6,70s.2719,915.89
3,8t2.6t9,OLr.25
6,609.08
380.50
5,870.01
L0,533.81
5,747.L8
2,969.73
1,756.05
2,O93.56
425.83
t,006.47
1,085.54
ro2,600.42
4L,685.52
250,579.0t298,738.35
57,r89.2Lt44,L79.9s
158,617.91
6,088.02
Dec-19
Jun-21
!27
2013-05 CAWP (06) PF
20r3-t2 AWS (04) AD
2Or3-27 AWS (04) PF
20r3-4s AWS (04) PF
2010-L0
20].4-04 AWS (04) PF
2Ot3-46 AWS (04) PF
Jul-40
Jun-33
554,493.09
3U:3433!2!6:371587
2,507.92
28,475,000.00
-- - Fr?q9:e11,LI9,226.92
300,000.00
3.O%
3.0%
r.84%
28î7ïq9:9
50,358
Nov-16
Oct-97
Apr-98
Jan-17
BNY Mellon
DWR/SWRCB
42.50
20

lComanche fi3)
102.13.215000 lnternel
102.13.215000 lnternal102.13.215000 lnternal102.13.215000 lnternal
LO2.L4.2t50t0
702.L4.215010 lnternal
120.20.215000
120.20.215000
t20.20.2Ls0L0
120.20.215010
t20.20.2L50I0 lnternal
120.20.215010
120.20.215010
lWw Comonche (27)
t20.21.2L50n lnternal
120.2L215OI0 I nterna I
2010-06
2014-ro ln
20L0-06
2014-L0
2004-39 AWS OP
AWS PF
AWS PF
(04) Repl
Reserves
Part¡cipation Fees
WW Martell (22) PF
ww Martell (22) PF
20r0-o72014-07
201.3-06
2013-09
2013-47
AWS (04) PF
Caman (13) PF
AGen (05) OP
AWS (04) PF
Jul-10
Apr-13
Apr-13
Nov-13
Jul-L0 Part
Jul-10
Jul-10
LAIF
LAIF
LAIF
LAIF
LAIF
LAIF
lnternal Loans
Total Loans
64L,O29.O7
56,185.88
2LL,90L.04
68,936.05
447,898.92
644,783.33
5s,ozt,t6o.7z
$45,108,776.14
780,000
70,000
264,OOO
81,000
545,000
760,000
26,709.54
3,5L1.62
L3,243.82
4,055.06
\8,662.45
25,79r.33
4,2LL.56
369.L4
L,392.r9452.9r
4æs4j
2,942.70
4,236.23
614,319.53
52,674.26
L98,657.22
64,880.99
429,236.47
618,992.00
Jul-40
Jun-32
Jun-32
Jun-33
Jul-40
Jul-41
LAIF
LAIF
lul-40
387,199.20 Jul42
18 Jun-21
68,872.67 )u1424t7 97r.3r Jul42
Jul-40
687.L6
71,511.05 r0,2r5.87.51 754.90
16,7L8.85
t26.63
2010-08
20L4-O3
2010-22
2014-05
$23s,463.06 $33,014.07 9428s,697.66
$r,813,363.95 Ss68,211.40 S43,29s,4Lz.zg
855,185Jul-10(04) Repl
Reserves
lnternal
Jul-40
Jul-41
Jun-33
29r,726.L3
3!g!6!9:!L
110,3s9.88
26,433.OO
t,999.97
469.83
2,855.91
470.59
755.28
2,L8/.55
L8r'..52
12,683.74
L3,854.32
4,598.33
L,652.06
304,409.87
332,503.73
LL4,958.2L
28,085.06
LAIF
LAIF
LAIF
LAIF
LAIF
LAIF
LAIF
,500,ooq
265,4Ls
404,585
135,s00
lul-10
Jun-04
Nov-05
Nov-05
Jul-10
Nov-10
Nov-13
w
R¡dge Cluster
AGen (05) OP
AWS (04) PF
2012-14
200s-642010-09
2014-08
2010-09
20L4-O9
20LO-23
20L4-O6
20L3-48
lnternal
lnternal
lnternal
lnternal
lnternallnterna I
21


