2Q11 LDK Investor Presentation FINAL
25
2Q 2011 Update September 2011
-
Upload
ana-syarif -
Category
Documents
-
view
218 -
download
0
Transcript of 2Q11 LDK Investor Presentation FINAL

8/10/2019 2Q11 LDK Investor Presentation FINAL
http://slidepdf.com/reader/full/2q11-ldk-investor-presentation-final 1/25
2Q 2011 Update
September 2011

8/10/2019 2Q11 LDK Investor Presentation FINAL
http://slidepdf.com/reader/full/2q11-ldk-investor-presentation-final 2/25
2
Disclaimer
The presentation is prepared by LDK Solar Co., Ltd. (“LDK" or the “Company”) and is being
presented solely for the purp ose of corpor ate communicat ion and g eneral reference. The
presentation is not intended as an offer to sel l , or to sol ic i t an offer to bu y or form any basis of
investment decis ion for any class of securi t ies of the Company in any jur isdict ion. Al l such
informat ion should n ot be u sed or rel ied on withou t professional advice. The presentat ion is a
brief summary in nature and do es not purpo rt to be a comp lete descript ion of the Company, its
business, i ts current or histor ical operat ing resul ts or i ts future prospects.
This presentat ion c ontains forw ard-looking statements that involve risks and un certaint ies. Al l
s tatements o ther than statements of histor ical facts are forw ard-looking statements. Thesestatements involve know n and u nknow n risks, uncertaint ies and o ther factors that may cause our
actual resul ts , performance or achievements to be materially di f ferent from those expressed or
impl ied by the forw ard-looking statements.
This presentat ion is pro vided withou t any warranty or representat ion of any kind, ei ther
expressed or im pl ied. The Company speci f ically disc laims al l responsibi l i t ies in respect of any
use or rel iance of any informat ion, whether f inancial or otherwise, contained in this presentat ion.
8/10/2019 2Q11 LDK Investor Presentation FINAL
http://slidepdf.com/reader/full/2q11-ldk-investor-presentation-final 3/25
3
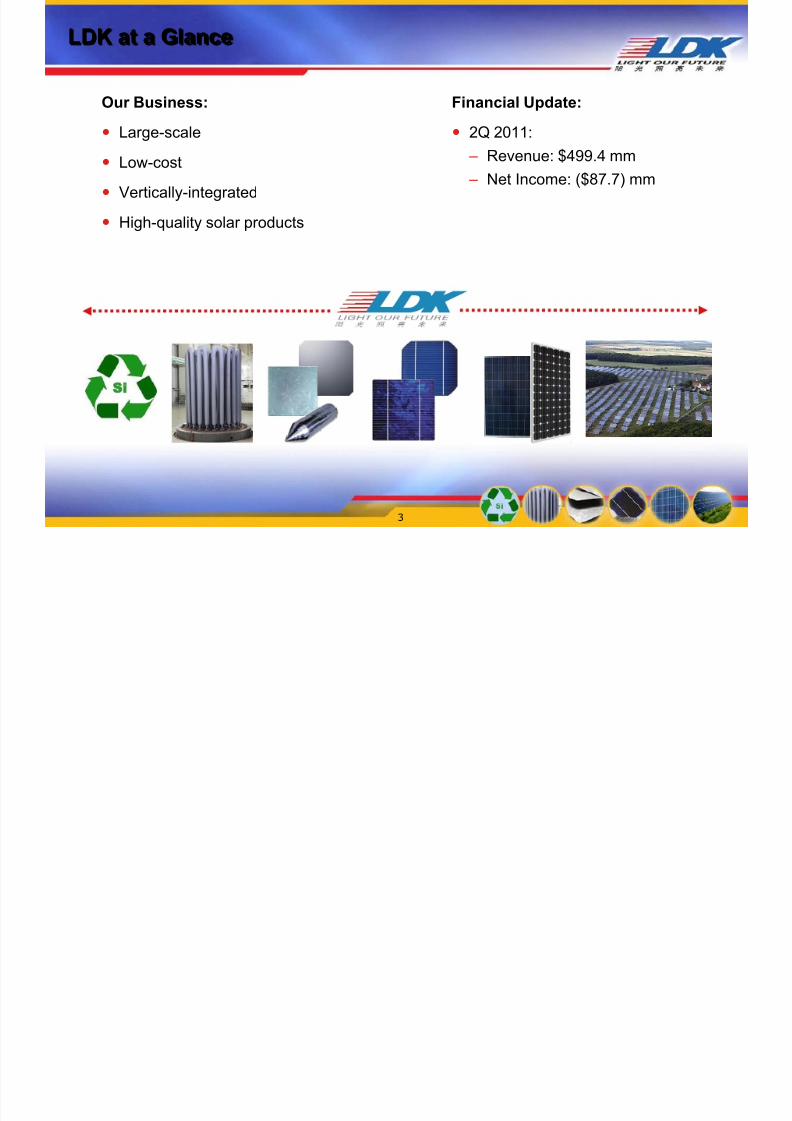
LDK at a Glance
Our Business:
Large-scale
Low-cost
Vertically-integrated
High-quality solar products
Financial Update:
2Q 2011:
– Revenue: $499.4 mm
– Net Income: ($87.7) mm

8/10/2019 2Q11 LDK Investor Presentation FINAL
http://slidepdf.com/reader/full/2q11-ldk-investor-presentation-final 4/25
$7,057
$5,435$4,939
$4,385
$3,329
$2,639 $2,316$1,874
$1,553 $1,478
Suntech First Solar Yingli SunPower Trina Solar JA Solar Renesola Jinko Solar Hanwha
SolarOne
US$ MM
Top US-Listed Solar Company Globally by Assets
4
#1 by Assets, 1H 2011

8/10/2019 2Q11 LDK Investor Presentation FINAL
http://slidepdf.com/reader/full/2q11-ldk-investor-presentation-final 5/25
$571
$470
$421
$375
$271$241
$239
$137
$79
$42
First Solar Yingli Trina Solar Renesola JA Solar Jinko Solar Hanwha
SolarOne
Suntech Sunpower
Top 2 US-Listed Solar Company by Operating Income
#2by Operating Income, Last Twelve Months
5
US$ MM

8/10/2019 2Q11 LDK Investor Presentation FINAL
http://slidepdf.com/reader/full/2q11-ldk-investor-presentation-final 6/25
Key Growth Strategies
6
Large-Scale Vertical Integration Across Solar
Value Chain
1
Continue Cost Reductions To Achieve GridParity
2
A Long-TermWinner
in Solar & LED
Industry
Capture Growing Opportunities in LED Industry6
Maintain Premium-to-Market ASP by OfferingHigh Quality Products and Services3
Penetrate & Expand PV Projects Business withFinancing Solutions from China-Based Banks
4
Diversify and Grow Customer Base5

8/10/2019 2Q11 LDK Investor Presentation FINAL
http://slidepdf.com/reader/full/2q11-ldk-investor-presentation-final 7/257
Strong Growth in Solar DemandTo Continue in 2011 and 2012
5.0 5.9
6.4 7.5
13.1
18.2
0
5
10
15
20
25
30
35
40
45
50
2008 2009 2010
(GW)
14.8
26.3
15.7
31.2
18.2
38.2
21.9
47.2
2011 2012 2013 2014
Forecast Actual Forecast Range
Source: Marketbuzz 2Q 2011.

8/10/2019 2Q11 LDK Investor Presentation FINAL
http://slidepdf.com/reader/full/2q11-ldk-investor-presentation-final 8/258
Truly Vertically Integrated Leader in the Solar Industry
Polysilicon
In-House &Third Party
Ingot / Wafer
In-House
Cell
In-House &Third Party
Module
In-House
System / Project
In-House &Third Party
C a p a c i t y
SiliconRecycling
In-House
6,000 – 8,000MT per year
Current:12,000 MT
1H 2012:25,000MT
Current:3.7 GW
2011:4.0 GW
Current:1.3 GW
2011:2.0 GW
Current:1.6 GW
2011:3.0 GW
>500 MWpipelines inEurope, US,Asia andChina
L e a d e r s h i p
Largestrecyclingcapacityglobally
Expect to bea topproducer bycapacityglobally
#1 in wafershipmentsglobally
#2 in capacityglobally by endof 2011
Expect to betop 5 incapacityglobally by endof 2011
Expect to be#1 in c-Sicapacityglobally byend of 2011
Globalpresence
U.S. SPI, LDKEurope & SGT,China EPCProjects

8/10/2019 2Q11 LDK Investor Presentation FINAL
http://slidepdf.com/reader/full/2q11-ldk-investor-presentation-final 9/259
Benefits of Vertical Integration
CustomerDiversification
Capture HigherMargins Across
Value Chain
Expand
AddressableMarket
Stability of Supply
Increase DemandVisibility
Reduce Volatility ofAny SingleBusiness
Quality Control
Less Than 300 Miles From Silicon to Module

8/10/2019 2Q11 LDK Investor Presentation FINAL
http://slidepdf.com/reader/full/2q11-ldk-investor-presentation-final 10/25
7031,196 1,228
1,925
2,479 2,774
1Q10 2Q10 3Q10 4Q10 1Q11 2Q11
10
Polysilicon Capacity and Production Scale-Up
Polysilicon Production (MT)Polysilicon Capacity (MT)
10,000
22,000
4Q10 1H12
Ma Hong Plant
1,000
3,000
4Q10 1H12
Xia Cun Plant
Total
11,000
25,000
4Q10 1H12
463
951 1,049
1,626
2,172 2,487
1Q10 2Q10 3Q10 4Q10 1Q11 2Q11
Ma Hong Plant
Xia Cun Plant
Total
+ 5,000 (Line 3)
+ 7,000(Debottlenecking)
+ 2,000 (Line 2& Debottlenecking)
240 245179
299 307287
1Q10 2Q10 3Q10 4Q10 1Q11 2Q11

8/10/2019 2Q11 LDK Investor Presentation FINAL
http://slidepdf.com/reader/full/2q11-ldk-investor-presentation-final 11/2511
Processing Cost Reduction – Polysilicon
Polysilicon Production Cost
(approximate % from 4Q10)Measures
A. Use of natural gas
B. Scale up to reduce depreciation and power
consumption
C. De-bottlenecking
D. Yield improvement
E. Localize consumables
F. Co-gen to supply steam
G. Others
Q4
2010
A B C D E F G Q4
2011E

8/10/2019 2Q11 LDK Investor Presentation FINAL
http://slidepdf.com/reader/full/2q11-ldk-investor-presentation-final 12/2512
Wafer Capacity and Production Scale-Up
Wafer Capacity (MW)
1,400
1,800
3,000
4,000
2008 2009 2010 2011E
Historical conventions for watt per piece:
2008: 3.7w / piece2009 & 2010: 3.8w / piece2011: 4.1w / piece
Note: For 6-inch wafer
Increase in Conversion Rate
Effective Jan 1st, 2011, LDK has adjusted itsefficiency calculation to reflect currentindustry wafer/cell conversion efficiencies
We now assume an average conversion
efficiency of 16.9% for mono/multi-crystallinewafer/cell (up from 15.6%), or 4.1w / piece
We are using this new conversion conventionbeginning 2011

8/10/2019 2Q11 LDK Investor Presentation FINAL
http://slidepdf.com/reader/full/2q11-ldk-investor-presentation-final 13/25
0.31
0.41
0.31
0.39
0.33
0.31
0.31
0.30
0.26
0.27
0.26
0.34
0.26
0.28
0.25
0.27
1Q10 2Q10 3Q10 4Q10 1Q11 2Q11 3Q11E 4Q11E
Processing Costs Polysilicon Cost
Processing Cost Reduction – Wafer
Target $0.02/Watt/Quarter
in Wafer Production Cost Through 2011
Target Wafer Production Cost ($/Watt)
$0.72
$0.64
$0.61 $0.53 $0.60$0.54
$0.52
$0.70
(1) Increase in 3Q10 processing cost is due to a one-time expenditureon spare parts and maintenance to equipment to improve future yield.
Measures
Thinner wafer for in-house cell use
Reduce kerf loss
Larger ingot sizes
Optimizing polysilicon mix through partial use
of in-house polysilicon production
Proprietary equipment upgrades to increase
capacity
Improvements in wafer quality
Greater manufacturing and purchasing
economies of scale
Increased consumables and polysilicon
recycling
Slurry recovery
13
Based on 3.8w / pc Based on 4.1w / pc

8/10/2019 2Q11 LDK Investor Presentation FINAL
http://slidepdf.com/reader/full/2q11-ldk-investor-presentation-final 14/25
$0.27
$0.21 $0.21
$0.23
$0.19$0.18
3Q10 4Q10 1Q11 2Q11 3Q11E 4Q11E
Processing Cost Reduction – Cell
Target $0.01/Watt Reduction in CellProcessing Costs from 4Q10 to the end of 2011
Cell Capacity Scale Up (MW) Target Cell Processing Cost ($/Watt)
Measures
Increase economy of scale
Lower usages of paste
Improve overall yield
Improve cell efficiency
120 180
570
1,260
3Q10 4Q10 1Q11 2Q11
14
(1)
(1) 2Q 11 cell processing cost increased due to initial ramp upof Hefei facilities

8/10/2019 2Q11 LDK Investor Presentation FINAL
http://slidepdf.com/reader/full/2q11-ldk-investor-presentation-final 15/25
25%
75%
20%
80%
Dec-10 Poly Ingot &
Wafer
Cell Module Q4 2011
Target
15
Fast Track to Achieve Grid Parity
In-House Silicon-To-Module R&D Production Program:
Already Succeeded At Below $1.00/Watt In Dec 2010
Non-silicon Cost
Silicon Cost
< $1.00
< $0.90
($/Watt)
Cost Reduction Roadmap:<$0.90/Watt in 2011

8/10/2019 2Q11 LDK Investor Presentation FINAL
http://slidepdf.com/reader/full/2q11-ldk-investor-presentation-final 16/2516
Fast Track to Achieve Grid Parity (Con’t)
China US
$0.04
$0.05
$0.06
$0.07
$0.08
$0.09
$0.10
$0.11
$0.12
2010 2011 2012 2013
($/KWh) ($/KWh)
$0.04
$0.05
$0.06
$0.07
$0.08
$0.09
$0.10
$0.11
$0.12
2010 2011 2012 2013
Source: Company estimates, EIA, Xinhua News
LCOE stands for Levelized Cost of Electricity. Calculated by using current LDK system cost, divided by the present value ofelectricity produced by the PV system during its entire usage life. LCOE calculations assume: (1) Module and BOS costdecrease 5% per year from 2010; (2) Sunlight condition of 1500 kwh/kwp for China and USA; (3) Discount rate at 5%; (4)System usage life of 20 years; (5) Before LDK’s margin
Current RetailElectricity Price
LDK’s LCOE
Current RetailElectricity Price
LDK’s LCOE

8/10/2019 2Q11 LDK Investor Presentation FINAL
http://slidepdf.com/reader/full/2q11-ldk-investor-presentation-final 17/2517
Update on System / Project Pipelines
SPI
209 MW
U.S.
Solar GreenTechnology
19 MW
Europe
96 MW
China
LDK Europe
Italy: 50MW
Bulgaria:15 MW
Germany:20 MW
Projects under development and pipel ine
Thailand:9 MW
India: 5 MW
Asia

8/10/2019 2Q11 LDK Investor Presentation FINAL
http://slidepdf.com/reader/full/2q11-ldk-investor-presentation-final 18/2518
Diversified and High-Quality Customer Base
LDK su ppl ies leading solar companies wi th PV products aroun d the world!
Canada
Czech Republic
HHI-
KOMAX
Japan
India
Taiwan
France
U.S.
Belgium
Greece
Big Solar
Italy
Australia
KOMEX
Korea
Netherlands Germany
Portugal
Spain
China
“Golden Sun” Projects
Wafer Customers
Module Customers
Polysilicon Customers

8/10/2019 2Q11 LDK Investor Presentation FINAL
http://slidepdf.com/reader/full/2q11-ldk-investor-presentation-final 19/25
Revenue by Geography
China
44.4%
Asia
Pacific,
others30.7%
Europe
24.7%
America
0.2%
2Q11 Sales 1Q11 Sales
19
China39.6%
AsiaPacific,others25.4%
Europe27.6%
America7.4%

8/10/2019 2Q11 LDK Investor Presentation FINAL
http://slidepdf.com/reader/full/2q11-ldk-investor-presentation-final 20/25
Continue to Enhance Balance Sheet
20
Focus on strong operating cash flow and capex efficiency
Capital markets strategies:
January 2011: Follow-on offering of US$164 million
Convert short-term maturities into long-term maturities
February 2011: Bond offering of RMB1.2 billion
Polysilicon fundraising strategies
June 2011 closed CDB investment of US$240 million
Monetizing PV project assets

8/10/2019 2Q11 LDK Investor Presentation FINAL
http://slidepdf.com/reader/full/2q11-ldk-investor-presentation-final 21/25
23
23
31
31
74
74
88
6
94
153
4
157
103
16119
65
14
79
0
50
100
150
200
250
4Q'09 1Q'10 2Q'10 3Q'10 4Q'10 1Q11 2Q'11
288
52
340
257
170
427
378
133
511
487
83
570
596
32
628
624
8
632
428
1
429
0
200
400
600
800
1,000
4Q'09 1Q'10 2Q'10 3Q'10 4Q'10 1Q'11 2Q'11
21
Strong Sales Track Record
Wafer Shipments
(MW)
Module Shipments
(MW)
Own Sales
OEM
ASP
$/w(own
sales)
$0.83 $0.83 $0.85 $0.87 $0.94 $0.84 $0.66
ASP
$/w(own
sales)
$1.64 $1.74 $1.77 $1.88 $1.86 $1.79 1.56
Own SalesOEM

8/10/2019 2Q11 LDK Investor Presentation FINAL
http://slidepdf.com/reader/full/2q11-ldk-investor-presentation-final 22/25
Strong Operating Performance
Revenue Gross Profit
Operating Income Net Income
(US$ MM) (US$ MM)
(US$ MM)(US$ MM)
$304.6 $347.6
$565.3$675.6
$920.9
$766.3
$499.4
0
300
600
900
1,200
4Q'09 1Q'10 2Q'10 3Q'10 4Q'10 1Q'11 2Q'11
$30.2$54.5
$101.8
$150.0
$251.4$241.6
$11.0
0
100
200
300
4Q'09 1Q'10 2Q'10 3Q'10 4Q'10 1Q'11 2Q'11
-$16.1 $33.0
$78.6 $119.5
$203.8$196.1
($47.9)(100)
(50)
0
50
100150
200
250
4Q'09 1Q'10 2Q'10 3Q'10 4Q'10 1Q'11 2Q'11
($24.3) $7.2 $45.0
$93.4
$145.2 $135.4
($87.7)(150)
(100)
(50)
0
50100
150
200
4Q'09 1Q'10 2Q'10 3Q'10 4Q'10 1Q'11 2Q'11
Gross
Margin 9.9% 15.7% 18.0% 22.2% 27.3%
Operat ing
Margin NM 9.5% 13.9% 17.7% 22.1%
Net Income
Margin NM 2.1% 8.0% 13.8% 15.8%
22
31.5%
25.6% NMNM
2.2%
17.7%

8/10/2019 2Q11 LDK Investor Presentation FINAL
http://slidepdf.com/reader/full/2q11-ldk-investor-presentation-final 23/25
23
3Q 2011 and FY 2011 Outlook
3Q 2011 Guidance FY 2011 Guidance
Revenues $630mm – $680mm $2.5bn – $2.7bn
Gross Margin 11.0% – 16.0% 15.0% – 20.0%
Wafer Shipments 350MW – 400MW 1.8GW – 2.0GW
ModuleShipments
250MW – 300MW 750MW – 800MW
In-house PolysiliconProduction
2,600MT – 2,700MT 10,000MT – 11,000MT
In-house Cell Production 200MW – 220MW 600MW – 700MW

8/10/2019 2Q11 LDK Investor Presentation FINAL
http://slidepdf.com/reader/full/2q11-ldk-investor-presentation-final 24/25
24
Unaudited Condensed Financial Information
Balance Sheet Summary
2Q 2011
Cash and Cash Equivalents 636.4
Restricted Cash 515.3
Short-term borrowings and current installments of long-term borrowings 2,214.0
Convertible senior notes, less debt discount (current portion) 0.0Long-term borrowings, excluding current installments 804.4
Convertible senior notes, and senior RMB-denominated notes, less debt discount (long-term) 297.0
Total LDK Solar Co., Ltd. shareholders’ equity 1,347.8
Non-controlling interests 13.5
Total equity 1,361.3
As of June 30, 2011
(US$ MM)
(US$ MM, except per ADS data)
2Q 2011 1Q 2011
Net sales 499.4 766.3
Gross profit 11.0 241.6
Income from operations (47.9) 196.1
Net income attributable to LDK Solar shareholders (87.7) 135.4
Net income per ADS, Diluted ($0.62) $0.95
Income Statement Summary

8/10/2019 2Q11 LDK Investor Presentation FINAL
http://slidepdf.com/reader/full/2q11-ldk-investor-presentation-final 25/25
Thank You
www.ldksolar.com