2Q / 1H 2019 IFRS Results · 2 Disclaimer No representation or warranty (express or implied) is...
19
August 16, 2019 Financial Presentation 2Q / 1H 2019 IFRS Results
Transcript of 2Q / 1H 2019 IFRS Results · 2 Disclaimer No representation or warranty (express or implied) is...
August 16, 2019
Financial Presentation2Q / 1H 2019 IFRS Results
2
Disclaimer
No representation or warranty (express or implied) is made as to, and no reliance should be placed on, the
fairness, accuracy or completeness of the information contained herein and, accordingly, none of the
Company, or any of its shareholders or subsidiaries or any of such person's officers or employees accepts
any liability whatsoever arising directly or indirectly from the use of this presentation.
This presentation contains certain forward-looking statements that involve known and unknown risks,
uncertainties and other factors which may cause the Company's actual results, performance or
achievements to be materially different from any future results, performance or achievements expressed or
implied by such forward-looking statements. PAO TMK does not undertake any responsibility to update
these forward-looking statements, whether as a result of new information, future events or otherwise.
This presentation contains statistics and other data on PAO TMK’s industry, including market share
information, that have been derived from both third party sources and from internal sources. Market statistics
and industry data are subject to uncertainty and are not necessarily reflective of market conditions. Market
statistics and industry data that are derived from third party sources have not been independently verified by
PAO TMK. Market statistics and industry data that have been derived in whole or in part from internal
sources have not been verified by third party sources and PAO TMK cannot guarantee that a third party
would obtain or generate the same results.

2Q / 1H 2019 Summary Financial Results and Market Update
3

2Q 2019 vs. 1Q 2019 Summary Financial Highlights
4
Sales were up QoQ, mainly due to higher sales at the Russian
division
Revenue was higher QoQ, mainly due to a stronger
performance at the Russian division
+5% QoQ +4% QoQ
Adjusted EBITDA was up QoQ, mainly due to stronger EBITDA
at the Russian division Net profit was up QoQ
+11% QoQ
175195
14%15%
0%
3%
6%
9%
12%
15%
18%
0
50
100
150
200
1Q2019 2Q2019
EB
ITD
A m
arg
in,
%
US
$ m
ln
Source: TMK data
4759
0
20
40
60
80
1Q2019 2Q2019
US
$ m
ln
+26% QoQ
978 1,031
0
300
600
900
1,200
1Q2019 2Q2019
Thousand t
onnes
1,257 1,307
0
500
1,000
1,500
1Q2019 2Q2019
US
$ m
ln
1H 2019 vs. 1H 2018 Summary Financial Highlights
5
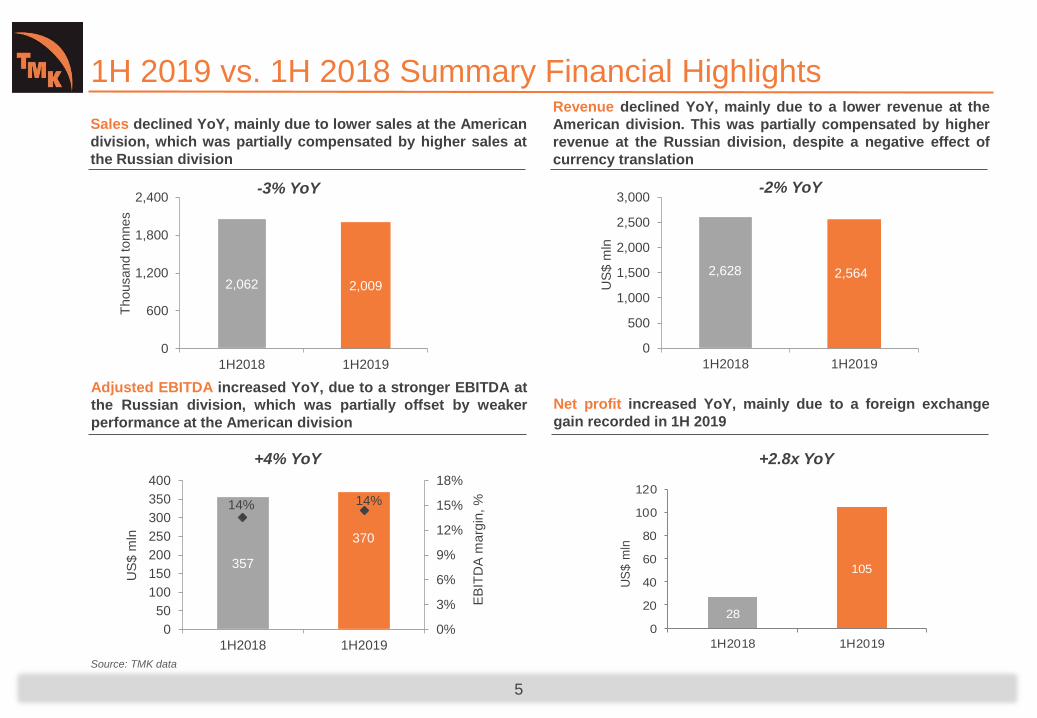
Sales declined YoY, mainly due to lower sales at the American
division, which was partially compensated by higher sales at
the Russian division
Revenue declined YoY, mainly due to a lower revenue at the
American division. This was partially compensated by higher
revenue at the Russian division, despite a negative effect of
currency translation
-3% YoY -2% YoY
Adjusted EBITDA increased YoY, due to a stronger EBITDA at
the Russian division, which was partially offset by weaker
performance at the American division
Net profit increased YoY, mainly due to a foreign exchange
gain recorded in 1H 2019
+4% YoY +2.8x YoY
28
105
0
20
40
60
80
100
120
1H2018 1H2019
US
$ m
ln
Source: TMK data
357
370
14% 14%
0%
3%
6%
9%
12%
15%
18%
0
50
100
150
200
250
300
350
400
1H2018 1H2019
EB
ITD
A m
arg
in, %
US
$ m
ln
2,062 2,009
0
600
1,200
1,800
2,400
1H2018 1H2019
Thousand t
onnes
2,628 2,564
0
500
1,000
1,500
2,000
2,500
3,000
1H2018 1H2019
US
$ m
ln
Russian Market Overview
6
Source: TMK estimates
Source: CDU TEK
Non
-En
erg
yE
ne
rgy
Key considerationsPipe market in Russia
Russian drilling activity remains robust
0
2
4
6
8
10
12
20
07
20
08
20
09
20
10
20
11
20
12
20
13
20
14
20
15
20
16
20
17
20
18
20
19E
20
20E
20
21E
20
22E
Mln
to
nn
es
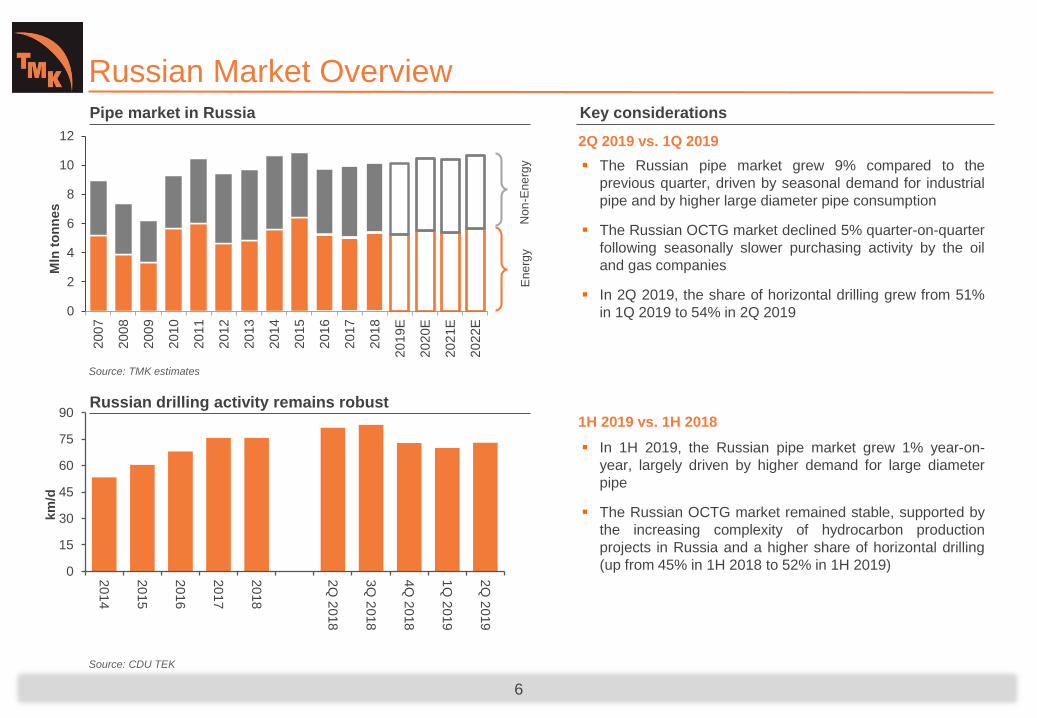
In 1H 2019, the Russian pipe market grew 1% year-on-
year, largely driven by higher demand for large diameter
pipe
The Russian OCTG market remained stable, supported by
the increasing complexity of hydrocarbon production
projects in Russia and a higher share of horizontal drilling
(up from 45% in 1H 2018 to 52% in 1H 2019)
The Russian pipe market grew 9% compared to the
previous quarter, driven by seasonal demand for industrial
pipe and by higher large diameter pipe consumption
The Russian OCTG market declined 5% quarter-on-quarter
following seasonally slower purchasing activity by the oil
and gas companies
In 2Q 2019, the share of horizontal drilling grew from 51%
in 1Q 2019 to 54% in 2Q 2019
2Q 2019 vs. 1Q 2019
1H 2019 vs. 1H 2018
0
15
30
45
60
75
90
20
14
20
15
20
16
20
17
20
18
2Q
2018
3Q
2018
4Q
2018
1Q
2019
2Q
2019
km
/d
U.S. Market Overview
7
Source: Baker Hughes, EIA
Source: Preston Pipe & Tube Report, Company data
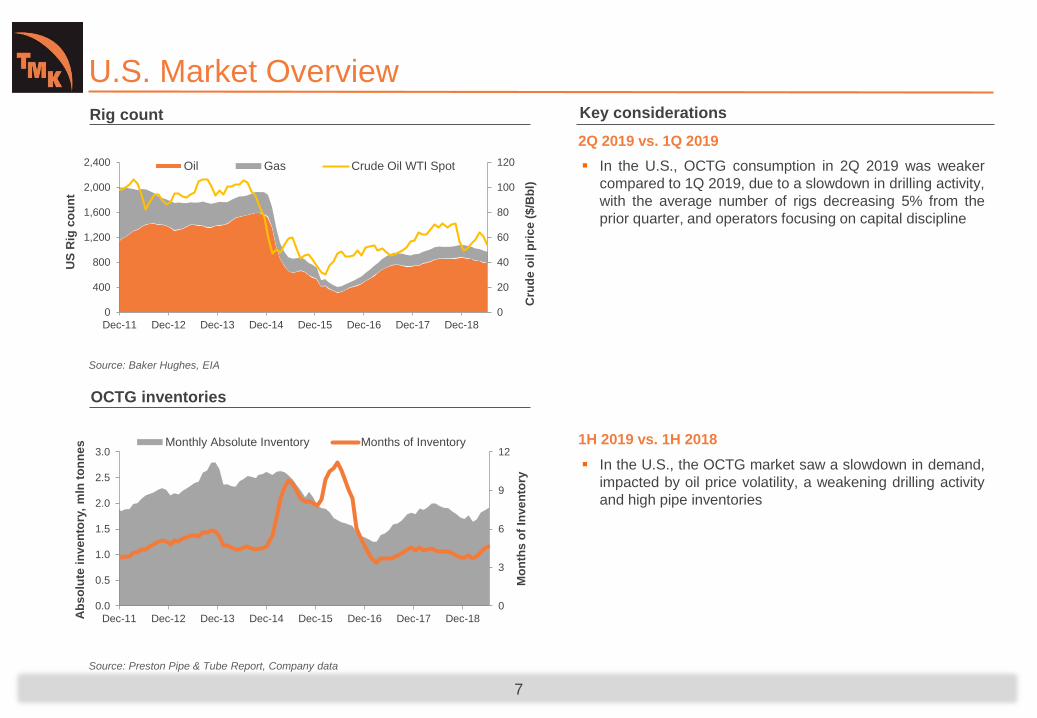
Rig count
OCTG inventories
In the U.S., the OCTG market saw a slowdown in demand,
impacted by oil price volatility, a weakening drilling activity
and high pipe inventories
In the U.S., OCTG consumption in 2Q 2019 was weaker
compared to 1Q 2019, due to a slowdown in drilling activity,
with the average number of rigs decreasing 5% from the
prior quarter, and operators focusing on capital discipline
2Q 2019 vs. 1Q 2019
1H 2019 vs. 1H 2018
Key considerations
0
20
40
60
80
100
120
0
400
800
1,200
1,600
2,000
2,400
Dec-11 Dec-12 Dec-13 Dec-14 Dec-15 Dec-16 Dec-17 Dec-18
Cru
de
oil
pri
ce
($
/Bb
l)
US
Rig
co
un
t
Oil Gas Crude Oil WTI Spot
0
3
6
9
12
0.0
0.5
1.0
1.5
2.0
2.5
3.0
Dec-11 Dec-12 Dec-13 Dec-14 Dec-15 Dec-16 Dec-17 Dec-18
Mo
nth
s o
f In
ve
nto
ry
Ab
so
lute
in
ve
nto
ry,
mln
to
nn
es Monthly Absolute Inventory Months of Inventory

2Q 2019 vs. 1Q 2019 Results
8
685
293
690
341
0
200
400
600
800
Seamless Welded
Thousand to
nnes
1Q2019 2Q2019
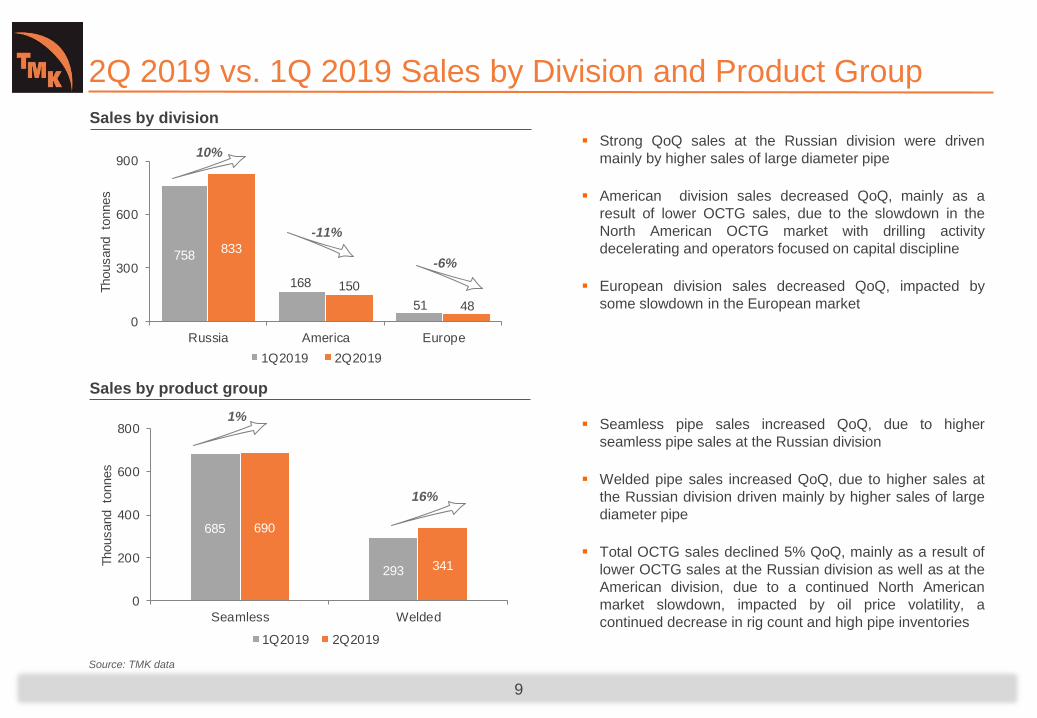
2Q 2019 vs. 1Q 2019 Sales by Division and Product Group
9
Seamless pipe sales increased QoQ, due to higher
seamless pipe sales at the Russian division
Welded pipe sales increased QoQ, due to higher sales at
the Russian division driven mainly by higher sales of large
diameter pipe
Total OCTG sales declined 5% QoQ, mainly as a result of
lower OCTG sales at the Russian division as well as at the
American division, due to a continued North American
market slowdown, impacted by oil price volatility, a
continued decrease in rig count and high pipe inventories
Strong QoQ sales at the Russian division were driven
mainly by higher sales of large diameter pipe
American division sales decreased QoQ, mainly as a
result of lower OCTG sales, due to the slowdown in the
North American OCTG market with drilling activity
decelerating and operators focused on capital discipline
European division sales decreased QoQ, impacted by
some slowdown in the European market
Source: TMK data
Sales by division
Sales by product group
758
168
51
833
150
48
0
300
600
900
Russia America Europe
Thousand to
nnes
1Q2019 2Q2019
1%
-11%
10%
-6%
16%

2Q 2019 vs. 1Q 2019 Revenue by Division
10
Revenue Revenue per tonne*
Source: Consolidated IFRS financial statements, TMK data
Revenue at the Russian division grew QoQ, driven by higher
welded pipe sales and a positive effect of currency translation
Revenue at the American division was affected by weaker
welded pipe sales, mainly due to OCTG pipe
Revenue at the European division decreased QoQ, mainly due
to lower sales and unfavorable pricing environment
Russian division revenue per tonne was flat QoQ
American division revenue per tonne was higher QoQ, due to a
change in the product mix with a higher share of seamless pipe
European division revenue per tonne decreased QoQ, due to
pricing pressure
Note: Certain monetary amounts, percentages and other figures included in this presentation are subject to rounding adjustments. Totals therefore do not always add up to exact arithmetic sums.
1,167
1,794
1,3611,165
1,830
1,265
0
500
1,000
1,500
2,000
Russia America Europe
US
$/t
onne
1Q2019 2Q2019
885
30270
970
27463
0
200
400
600
800
1,000
Russia America Europe
US
$ m
ln
1Q2019 2Q2019* Revenue /tonne for the Russian and American divisions is calculated as total revenue divided by pipe
sales. Revenue for the European division is calculated as total revenue divided by pipe+billets sales
0%
-9%
-11%
2%
-7%
10%

137
30
8
166
21
8
0
30
60
90
120
150
Russia America Europe
US
$ m
ln
1Q2019 2Q2019
2Q 2019 vs. 1Q 2019 Adjusted EBITDA by Division
11
Adjusted EBITDA Adjusted EBITDA margin
Source: Consolidated IFRS financial statements, TMK data
Russian division Adjusted EBITDA increased QoQ, supported
by a better sales mix, as well as lower scrap prices
American division Adjusted EBITDA decreased QoQ
European division Adjusted EBITDA was almost flat QoQ
Russian division Adjusted EBITDA margin increased by 1 p.p.
QoQ, reflecting a better product mix with a higher share of large
diameter pipe in the welded segments, as well as lower raw
material prices
American division Adjusted EBITDA margin declined QoQ
European division Adjusted EBITDA margin increased QoQ
Note: Certain monetary amounts, percentages and other figures included in this presentation are subject to rounding adjustments. Totals therefore do not always add up to exact arithmetic sums.
16%
10%
12%
17%
8%
13%
0%
5%
10%
15%
20%
Russia America Europe
%
1Q2019 2Q2019
21%
-31%
-1%
1H 2019 vs. 1H 2018 Results
12

1,399
662
1,375
634
0
400
800
1,200
1,600
Seamless Welded
Thousand to
nnes
1H2018 1H2019
1H 2019 vs. 1H 2018 Sales by Division and Product Group
13
Seamless pipe volumes declined YoY, as higher sales at
the Russian division were offset by weaker sales at the
American division
Welded pipe sales decreased YoY, as higher sales at the
Russian division were offset by weaker sales at the
American division
Total OCTG sales increased 2% YoY, driven by stronger
seamless OCTG sales at the Russian division
Russian division sales increased YoY, driven mainly by
higher sales of large diameter pipe and seamless OCTG
pipe
Sales volumes at the American division decreased YoY
due to the lower OCTG sales, impacted by slowdown in the
North American OCTG market with drilling activity
decelerating and operators focused on capital discipline
European division sales was almost flat YoY
Source: TMK data
Sales by division
Sales by product group
1,553
409
100
1,591
318
99
0
400
800
1,200
1,600
2,000
Russia America Europe
Thousand to
nnes
1H2018 1H2019
2%
-4%
-22%
-1%
-2%
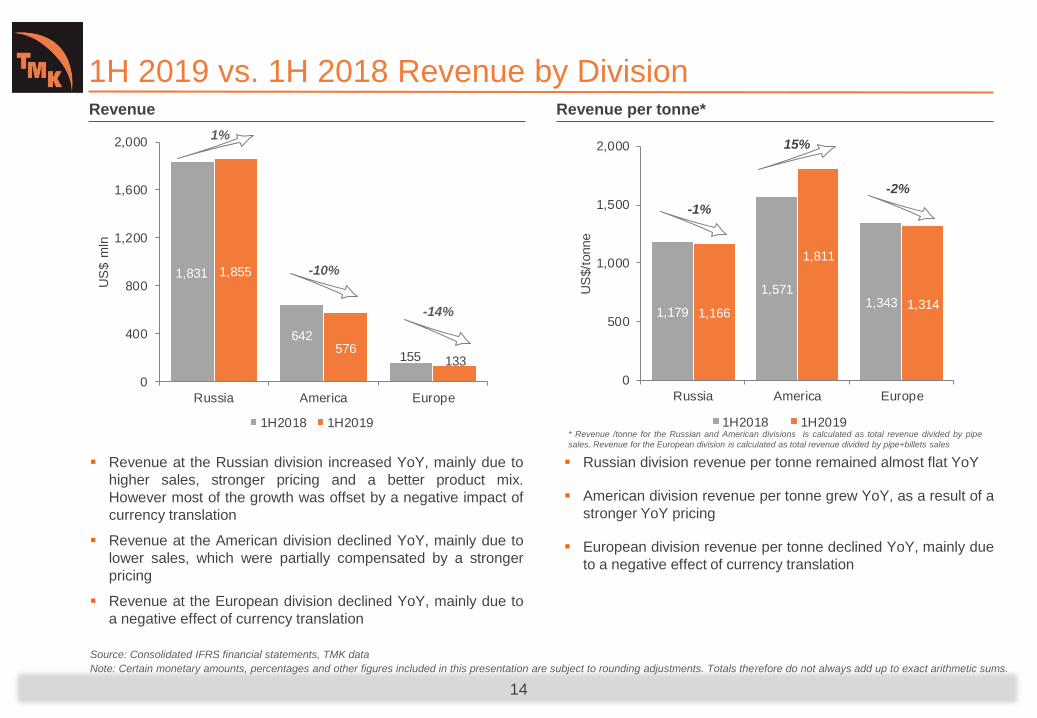
1H 2019 vs. 1H 2018 Revenue by Division
14
Revenue Revenue per tonne*
Source: Consolidated IFRS financial statements, TMK data
Revenue at the Russian division increased YoY, mainly due to
higher sales, stronger pricing and a better product mix.
However most of the growth was offset by a negative impact of
currency translation
Revenue at the American division declined YoY, mainly due to
lower sales, which were partially compensated by a stronger
pricing
Revenue at the European division declined YoY, mainly due to
a negative effect of currency translation
Russian division revenue per tonne remained almost flat YoY
American division revenue per tonne grew YoY, as a result of a
stronger YoY pricing
European division revenue per tonne declined YoY, mainly due
to a negative effect of currency translation
Note: Certain monetary amounts, percentages and other figures included in this presentation are subject to rounding adjustments. Totals therefore do not always add up to exact arithmetic sums.
* Revenue /tonne for the Russian and American divisions is calculated as total revenue divided by pipe
sales. Revenue for the European division is calculated as total revenue divided by pipe+billets sales
1,179
1,5711,343
1,166
1,811
1,314
0
500
1,000
1,500
2,000
Russia America Europe
US
$/t
onne
1H2018 1H2019
1,831
642
155
1,855
576133
0
400
800
1,200
1,600
2,000
Russia America Europe
US
$ m
ln
1H2018 1H2019
-2%
1%
-10%
-14%
-1%
15%

1H 2019 vs. 1H 2018 Adjusted EBITDA by Division
15
Adjusted EBITDA Adjusted EBITDA margin
Source: Consolidated IFRS financial statements, TMK data
Adjusted EBITDA in the Russian division increased YoY, driven
by an improved sales mix towards a higher share of OCTG and
large diameter pipe
American division Adjusted EBITDA declined YoY, due to lower
sales in both seamless and welded segments
European division Adjusted EBITDA declined YoY, impacted by
higher selling and administrative expenses and by a negative
effect of currency translation
Russian division Adjusted EBITDA margin increased YoY, as a
result of an improved sales mix towards a higher share of
OCTG and large diameter pipe
American division Adjusted EBITDA margin was down YoY,
due to weaker product mix
European division Adjusted EBITDA margin declined YoY,
impacted by higher selling and administrative expenses
Note: Certain monetary amounts, percentages and other figures included in this presentation are subject to rounding adjustments. Totals therefore do not always add up to exact arithmetic sums.
14%
12%
17%16%
9%
12%
0%
5%
10%
15%
20%
Russia America Europe
%
1H2018 1H2019
256
75
26
303
50
16
0
50
100
150
200
250
300
350
Russia America Europe
US
$ m
ln
1H2018 1H2019
18%
-36%
-33%

Seamless – Core to Profitability
16
1H 2019 gross profit breakdown
Source: Consolidated IFRS financial statements, TMK data
Note: Certain monetary amounts, percentages and other figures included in this presentation are subject to rounding adjustments. Totals therefore do not always add up to exact arithmetic sums.
US$ mln(unless stated otherwise)
2Q2019QoQ,
%1H2019
YoY,
%
Sales - Pipes, kt 690 1% 1,375 -2%
Revenue 906 1% 1,804 0%
Gross profit 217 2% 429 5%
Margin, % 24% 24%
Avg revenue/tonne (US$) 1,314 0% 1,313 2%
Avg gross profit/tonne (US$) 314 1% 312 6%
Sales - Pipes, kt 341 16% 634 -4%
Revenue 350 14% 657 -5%
Gross profit 31 36% 54 24%
Margin, % 9% 8%
Avg revenue/tonne (US$) 1,026 -2% 1,036 0%
Avg gross profit/tonne (US$) 92 17% 86 30%
SE
AM
LE
SS
WE
LD
ED
Sales of seamless pipe generated 70% of total
revenues in 1H 2019
Gross profit from seamless pipe sales represented
89% of 1H 2019 total gross profit
Gross profit margin from seamless pipe sales
amounted to 24% in 1H 2019
Seamless89%
Welded11%
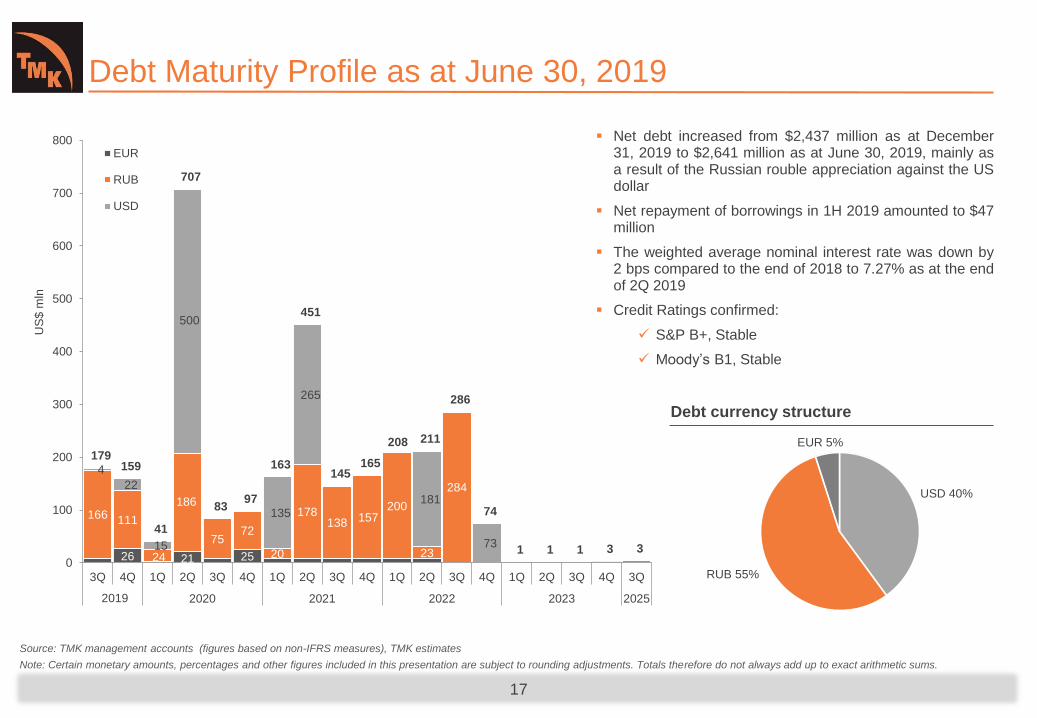
Debt Maturity Profile as at June 30, 2019
17
Debt currency structure
Source: TMK management accounts (figures based on non-IFRS measures), TMK estimates
Note: Certain monetary amounts, percentages and other figures included in this presentation are subject to rounding adjustments. Totals therefore do not always add up to exact arithmetic sums.
Net debt increased from $2,437 million as at December31, 2019 to $2,641 million as at June 30, 2019, mainly asa result of the Russian rouble appreciation against the USdollar
Net repayment of borrowings in 1H 2019 amounted to $47million
The weighted average nominal interest rate was down by2 bps compared to the end of 2018 to 7.27% as at the endof 2Q 2019
Credit Ratings confirmed:
S&P B+, Stable
Moody’s B1, Stable
26 21 25
166 111
24
186
7572
20
178138 157
200
23
284
4
22
15
500
135
265
181
73
179 159
41
707
83 97
163
451
145 165
208 211
286
74
1 1 1 3 3
0
100
200
300
400
500
600
700
800
3Q 4Q 1Q 2Q 3Q 4Q 1Q 2Q 3Q 4Q 1Q 2Q 3Q 4Q 1Q 2Q 3Q 4Q 3Q
2020 2021 2022 2023 2025
US
$ m
ln
EUR
RUB
USD
USD 40%
RUB 55%
EUR 5%
2019

18
Outlook and Trends
In Russia, TMK expects pipe consumption by domestic oil and gas companies to remainstable in 2019. The increased complexity of hydrocarbon production projects in Russia isexpected to result in higher demand for high tech products. TMK anticipates EBITDA at theRussian division to increase for the full-year 2019, supported by an increase in pipeshipments, with the EBITDA margin to be slightly above the level of full-year 2018.
In North America, the market situation is most likely to remain challenging with oil and steelprice volatility, a slowdown in drilling activity and operators focusing on capital discipline, allresulting in lower pipe demand and pressure on prices.
In Europe, a challenging market environment and pricing pressure, coupled with a seasonalslowdown in activities in the European market in the third quarter might impact theEuropean division’s financial performance for the full-year 2019. However, overall TMKexpects to see sustained demand for seamless industrial pipe in full-year 2019 with thesales mix for the European division comprising a higher share of high value-addedproducts.

TMK Investor Relations
40/2a, Pokrovka Street, Moscow, 105062, Russia
+7 (495) 775-7600