
2nd Quarter 2009 Results - Axiataaxiata.listedcompany.com/misc/axiata_presentation_2Q2009.pdf ·...
40
2 nd Quarter 2009 Results Analyst and Investor Briefing 27 August 2009 company confidential
Transcript of 2nd Quarter 2009 Results - Axiataaxiata.listedcompany.com/misc/axiata_presentation_2Q2009.pdf ·...

2nd Quarter 2009 ResultsAnalyst and Investor Briefing27 August 2009
company confidential

AGENDA
Results Highlights
Malaysia – Celcom
Indonesia – Excelcomindo
company confidential2
Sri Lanka – Dialog
Bangladesh – AxB
Other Regional mobile assets
Moving Forward

Group Performance Highlights
Group’s operational focus saw continued improvement s. Deleveraging strengthens Group’s position
• Group Revenue improved 10% Q o Q with revenue grow th in all key operating companies amidst competitive environment
• Cost management and EBITDA focus saw EBITDA grew 19 % and an increased margin by 2.9 percentage points to 39.3% in 2Q 09
• EBITDA and PATAMI growth in Celcom, XL and Axiata B angladesh (AxB) and favourable forex gains resulted higher actual 2 nd Quarter Group PATAMI of RM527 million or a seven -fold increase
Group
2nd Quarter 2009 3company confidential
seven -fold increase
• Excluding the impact of forex gains, one-off accele rated depreciation charge at Dialog and finance costs related to Idea acquisition, norm alised PATAMI grew 23% Q o Q
• Deleveraging of balance sheet from proceeds of Righ ts Issue to a Gross Debt / equity of 0.85x from 1.71x further strengthens the Group’s f inancial position
• Regional subscribers almost doubled to 100 million from a year ago

Group Performance Highlights
Opcos
• Segment focus, improved basic operations and contin ued cost management delivered further revenue growth and profitability at Celcom – one of its best quarters
• Strategy to focus on quality subscribers and improv ing customer experience helped XL to deliver revenue and margin improvements – sign ificant revenue and profit rebound
• Overall improvement in Axiata Bangladesh from conti nued efforts in turnaround plan – one of its best quarters ever
Excellent execution of strategies as planned delive red better results : All key opco’s
improved Q o Q on almost all key metrics
2nd Quarter 2009 4company confidential
– one of its best quarters ever
• One-off accelerated depreciation due to network mod ernisation impacted Dialog’s bottom line though 2Q 09 saw revenue, EBITDA and no rmalised PATAMI improvements
• Idea continued its growth momentum expanding its Pa n Indian operations. On a proforma basis Idea could have added RM34 million t o Group PATAMI in 2Q 09

Group Financial Performance
Revenue (RM mn)
+8%• Q o Q revenue increased by 10% mainly
contributed by continued operational improvements in Celcom, XL and AxB. 1H 09 Group revenue increased 7% Y o Y
• In constant currency terms- Q o Q, Group revenue improved 8%
+7%
Revenue growth through further operational improvem ents especially at XL, Celcom and AxB
+10%
2nd Quarter 2009 5company confidential
- Q o Q, Group revenue improved 8%- 1H08 vs. 1H09, Group revenue improved 8%

EBITDA (RM mn) & Margins (%)
• EBITDA improved significantly 19% Q o Q with stable margins at Celcom and improved margins at XL, Dialog and AxB. 1H 09 EBITDA was down 2%
Group Financial PerformanceTop line growth with cost management delivered stro ng EBITDA growth; All major subsidiaries showed significant EBITDA growth
+2%-2%
+19%
2nd Quarter 2009 6company confidential
39.3%41.5% 38.3% 31.7%
• In constant currency terms- Q o Q, Group EBITDA improved 17%- 1H08 vs. 1H09, Group EBITDA was basically flat
(declined marginally by 0.3%)36.4% 41.3% 37.9%

PATAMI (RM mn) - Actual
Group Financial PerformanceSignificant PATAMI increase through better operatio nal contribution and favourable forex gains; XL and AxB performed exceptionally well
PATAMI (RM mn) - Adjusted
+ 44%
>+100%-23%
+3 %
+ 23%
-4%
2nd Quarter 2009 7company confidential
• PATAMI improved Q o Q with improved PATAMI in Celcom, XL and AxB; Y o Y declined 23%
• 2Q 09 PATAMI of RM422m adjusted for interest charges on TM/bridging loan (RM23m), Idea financing costs (RM56m), Accelerated Depreciation at Dialog (RM159m) and Forex Gain (RM343m)

52780
343 15979
Normalised Group PATAMI: 1Q 2009 → 2Q 2009 (Actual)
Normalised 1Q 09 PATAMI Normalised 2Q 09 PATAMIOperational Contribution
RM Million Normalised Growth: 23%
QoQ Growth >100%
After normalisation for like-for-like comparison, t here was a clear indication of operational improvem ent
2nd Quarter 2009 8company confidential
422
64
527
342
112
80166
Q1
09
Fin
ance
Cos
ts
For
ex L
oss
Nor
mal
ised
Q1
09
Ope
ratio
ns
Nor
mal
ised
Q2'
09
FO
RE
X G
ain
Acc
eler
ated
Dep
reci
atio
n
Fin
ance
Cos
ts
Q2
09
Note : 2Q 09 Finance costs inclusive of interest ch arges from TM/bridging loan (RM23mn) and Idea finan cing costs (RM56mn) ,1Q 09 Finance costs inclusive of interest charges f rom TM loan (RM60mn) and Idea financing costs (RM52 mn)

764769
591
7971733 176 159
19145
Normalised Group PATAMI: YTD 2008 → YTD 2009 (Actual)
Normalised YTD 2008 PATAMI Normalised YTD 2009 PATAMI
RM Million Normalised Growth: -4%
YoY Growth -23%
Operational Contribution
Normalised net reduction in PATAMI as Dialog record ed loss while all other key opcos showed improvemen ts
2nd Quarter 2009 9company confidential
YT
D J
une
2008
FO
RE
X G
ain
Fin
ance
Cos
ts
Nor
mal
ised
YT
D J
une
08
Ope
ratio
ns
Nor
mal
ised
YT
D J
une
09
FO
RE
X G
ain
Acc
eler
ated
Dep
reci
atio
n
Fin
ance
Cos
ts
YT
D J
une
2009
Note : YTD ’09 finance costs inclusive of interest charges from TM/bridging loan (RM83mn) and Idea fin ancing costs (RM108mn), YTD ’08 total finance costs was from TM loan.

Net Subscribers Addition
Subscribers (million)
• Regional mobile subscribers grew almost doubled to 99 million subscribers (including Idea Cellular subscribers of 42.8 million)
+98%
50.0M 82.7M 89.3M 94.4M 99.2M
Regional Subscribers reaching close to 100 million mark
2nd Quarter 2009 10company confidential
subscribers of 42.8 million)

Group Revenue and EBITDA Composition
YTD JUN 09 REVENUE & EBITDA Breakdown (%)YTD JUN 08 REVENUE & EBITDA Breakdown (%)
REVENUE REVENUE
Celcom and XL contributes 82% of Revenue and 87% of EBITDA
2nd Quarter 2009 11company confidential
REVENUE
EBITDA
REVENUE
EBITDA

Group Capex and Financial Leverage
RM Million 31 Dec 08 30 Jun 09
Cash & Bank 3,331 3,341
Gross Debt 20,023 14,914
Net Debt 16,692 11,573
Net Assets 11,698 17,496
Capex YTD Jun 08 YTD Jun 09 Y o Y
RM Million 2,972 1,740 -41%
YTD Jun 08 (%) YTD Jun 09 (%)
Reduced capex in line with capex management focus. Deleveraging through rights proceed
2nd Quarter 2009 12company confidential
Net Assets 11,698 17,496
Gross debt / equity (x) 1.71 0.85
Gross debt / EBITDA (x) 4.60 3.26
Net debt / EBITDA (x) 3.83 2.53
Net assets per share (RM) 2.99 2.01

AGENDA
Results Highlights
Malaysia – Celcom
Indonesia – Excelcomindo
company confidential13
Sri Lanka – Dialog
Bangladesh – AxB
Other Regional mobile assets
Moving Forward

+ 12%
+ 5% + 11%
Revenue* (RM mn)
+ 10%
+ 3% + 9%
EBITDA (RM mn) & Margins (%)
44.6%45.5%44.2%45.0%45.1%45.3%
Segment focus continued to deliver revenue growth and profitability
Celcom : Financial Performance
45.3%
2nd Quarter 2009 14company confidential
+ 14%
+ 3%+ 15%
PATAMI (RM mn)
• Recorded highest quarterly growth for the past 2 ye ars from increased efforts in segment focus in prepaid, postpaid
• Mobile broadband acquisition drive has delivered increased contribution to revenue, 5% of 2Q 09
*2008 - Fibercomm excluded due to demerger (for comp arison purpose)

% of Revenue 2Q 08 1Q 09 2Q 09 YTD Jun 08 YTD Jun 09
Direct Expenses 21.7% 23.3% 23.5% 21.8% 23.4%
Sales & Marketing 10.7% 10.5% 11.3% 10.3% 10.9%
Network Costs 10.7% 11.7% 10.5% 11.9% 11.1%
Staff Costs 7.0% 5.4% 6.1% 6.4% 5.7%
Bad Debts 0.6% 0.8% 1.4% 0.6% 1.1%
Others 3.9% 3.4% 3.1% 3.8% 3.2%
Total Expenses 54.7% 55.0% 55.8% 54.8% 55.4%
EBITDA Margin 45.3% 45.0% 44.2% 45.2% 44.6%
100.0% 100.0% 100.0% 100.0% 100.0%
Operating Expenses
Celcom : Financial Performance
Q o Q
• Efforts in managing network costs showed positive results
• Higher sales and marketing expenses in 2Q09 in line with higher acquisition and aggressive marketing programs
• Increase in staff costs due
Delivered network costs savings ahead of plan but offset by higher staff costs, bad debts and marketing expenses from acquisition and retention focus
2nd Quarter 2009 15company confidential
30 Jun 08 30 Jun 09 Y o Y
Capex 362.8 441.5 22%
Cash & Cash Equivalents 1,830.8 1,339.2 -27%
Gross Debt - 7.0 -
Net Assets 3,559.7 2,882.5 -19%
Gross debt / equity (x) - - -
Gross debt / EBITDA* (x) - - -
100.0% 100.0% 100.0% 100.0% 100.0%
D & A 14.5% 13.6% 12.7% 14.1% 13.1%
Financial Position (RM mn)
• Increase in staff costs due to annual increment and higher ESOS charges during the quarter
• Increase in bad debts due to economic downturn. Steps taken to promote auto-debit payment
*Annualised EBITDA

Celcom : Financial Performance
EBITDA Margin Movements 1Q 2009 to 2Q 2009
- EBITDA MARGIN IMPACT (%) + EBITDA MARGIN IMPACT (%)
-0.8
-0.2Direct expenses
Sales & Marketing
1Q 09 EBITDA Margin at 45%
(Higher customer related expenses, USP provision)
(In line with higher acquisition and increased
marketing programs)
2nd Quarter 2009 16company confidential
0.3
-0.6
-0.7
1.2
Staff Related Cost
Network Costs
Others
Bad Debts
1Q 09 EBITDA Margin at 44.2%
marketing programs)
(Annual increment and ESOS charge)
(Related to economic downturn)
(Network cost savings program)

+23%
Subscribers(000’s)
+6%
ARPU(RM)
Celcom : Operational Performance
Net Adds
8,254 8,7619,698
7,894 9,176
507 415 522322 360
+234k +333k +232k +321k
Total Subs
Higher net adds from prepaid and postpaid segment w ith improved mobile broadband take up
2nd Quarter 2009 17company confidential
MOUs (min)
• Positive momentum in postpaid segment continued driven by postpaid plans and mobile broadband
• Strengthened prepaid segment with higher net adds and MOU
• Lower ARPU in postpaid segment from lower tariff based promotional packages whilst prepaid ARPU remained stable
+126k +174k +201k+183k

420 420
MOBILE BROADBAND SUBSCRIBERS * ( ‘000)
+27%
+37%
+34%
+236%
Celcom : Maintaining leadership in mobile broadbandFocus on mobile broadband delivering continued grow th momentum
2nd Quarter 2009 18company confidential
93125
179228
306
125
Q108 Q208 Q308 Q408 Q109 Q209 YTD08 YTD09
-18-
+34%
+27%
+43%
Note :Subscribers are based on monthly unlimited pl ans

AGENDA
Results Highlights
Malaysia – Celcom
Indonesia – Excelcomindo
company confidential19
Sri Lanka – Dialog
Bangladesh – AxB
Other Regional mobile assets
Moving Forward

1,472 1,505 1,021 1,113 1,454 2,606 2,568
41%45%44%
38%34%
45%46%
2Q08 3Q08 4Q08 1Q09 2Q09 YTD08 YTD09
3,182 3,342 2,978 2,926
3,328
5,836 6,254
2Q08 3Q08 4Q08 1Q09 2Q09 YTD08 YTD09
XL : Financial Performance
Revenue before disc (Rp bn) EBITDA (Rp bn) & Margins (%)
+ 5%
+ 7%
+ 14%
Focus on Quality Subscribers delivered improved rev enue and profitability
- 1% (Normalised : 4%)+31 % (Normalised : 29%)
- 1% % (Normalised : +3%)
2nd Quarter 2009 20company confidential
2Q08 3Q08 4Q08 1Q09 2Q09 YTD08 YTD09
EBITDA EBITDA Margin
2Q08 3Q08 4Q08 1Q09 2Q09 YTD08 YTD09
PATAMI (Rp bn)
• Revenue increased 14% QoQ and 7% YoY, mainly due to the 113%increase in total outgoing minutes and improvement focus on quality ofsubscriber base
• EBITDA increased 31% QoQ with improved margin but decreased 1% YoYto Rp 2.6 trillion due to policy shift of new sites from 100% self-build topartial lease. Without this policy, EBITDA would have grown 4% YoY.
• Profit after tax improved 12% YoY from Rp 631 billion in 1H08 to Rp 706 billion in 1H09.
• Excluding the unrealized forex impact, XL recorded a normalized net income of Rp 207 billion.
311
(906)
(306)
1,012
631 706
260
2Q08 3Q08 4Q08 1Q09 2Q09 YTD08 YTD09
PATAMI
>+100% (Normalised : - 36%)
> +100% (Normalised : >+100%)
+12% (Normalised : - 55%)

XL : Financial PerformanceHigher opex as a consequence of leasing most of the new sites and towers
Operating Expenses
% of Revenue 2Q 08 1Q 09 2Q 09 YTD 08 YTD 09
Direct Expenses 18.6% 17.0% 14.5% 19.6% 15.7%
Sales & Marketing 11.1% 7.9% 7.7% 11.1% 7.9%
Network Costs 14.5% 25.3% 22.9% 14.1% 24.0%
Staff Costs 5.1% 6.1% 6.4% 5.6% 6.2%
Bad Debts 0.5% 0.4% 0.5% 0.6% 0.4%
Others 3.4% 4.4% 3.7% 3.5% 3.9%
Total Expenses 53.2% 61.1% 55.7% 54.5% 58.2%
• 1H 09 Direct expenses decreased 14% partly due to lower SIM card costs that resulted from SIM supply reduction initiative.
• Sales & marketing expenses decreased due to reduction in A&P expenses from optimization initiatives and sales commission reduction with commission scheme transformation.
2nd Quarter 2009 21company confidential
Financial Position (Rp bn)
EBITDA Margin 46.3% 38.1% 43.7% 44.7% 41.1%
D & A 21.6% 30.4% 28.0% 22.7% 29.1%
30 Jun 08 30 Jun 09 YoY
Capex 5,284 2,871 -46%
Cash and Cash Equivalents 382 972 154%
Net Debts 11,719 17,927 53%
Net Assets 4,954 5,014 1%
Debt / Equity (x) 2.4 3.8 -
Debt / EBITDA (x) 2.7 3.7 -
scheme transformation.
• Network costs increased mainly due to higher frequency fee, network utilities, maintenance as well as rental sites and leased expenses associated with 35% annual increase in our number of BTS.

216
259 233
260 277
169
268
2Q08 3Q08 4Q08 1Q09 2Q09 YTD08 YTD09
XL: Operational PerformanceARPU rebound due to improved revenue generating sub scriber base
Subscribers (000’s)
+8%-1%
OG MoU/subs/month (min)
475 465 417 392 372 475 372
22,423 24,622 25,599 24,501 24,323 22,423 24,323
19,889 21,474 20,863 21,317 21,757
19,889 21,757
26,01625,087 24,892 24,69422,899
24,69422,899
2nd Quarter 2009 22company confidential
2Q08 3Q08 4Q08 1Q09 2Q09 YTD08 YTD09
154 143
151 148 165
157 156
38 35 29 27 33 38 30
2Q08 3Q08 4Q08 1Q09 2Q09 YTD08 YTD09Postpaid Prepaid
ARPU (Rp)
2Q08 3Q08 4Q08 1Q09 2Q09 YTD08 YTD09
Postpaid Prepaid Prepaid RGB • Prepaid RGB (Revenue Generating Base), which is the number of
unique subscribers during a month creating one or more revenue
generating events, increased 9% YoY and 2% QoQ in line with our
focus to improve the quality of our subscriber base.
• Ending subscriber number slightly decreased QoQ due to a
reduction in grace period from 30 days to 25 days
• Efforts in improving RGB saw Prepaid ARPU increased 19% QoQ to
Rp 33 thousand while Postpaid ARPU increased by 11% QoQ to Rp
165 thousand in 2Q 09
• The outgoing MoU/subs/month rose 58% YoY and 6% QoQ. Total
outgoing MoU saw a 113% increase from 19.3 billion in 1H08 to 41
billion in 1H09.

Growing high quality subscriber base
1. Monitoring quality of subs and taking proactive action in specific regions
2. Tighter supply of starter packs to better match supply to demand
+13%
Daily Prepaid Subs with events
High quality subscriber base is being built...
High quality subscriber base is being built... ...due to specific actions taken...due to specific actions taken
+3%
Daily revenue per sub
(Prepaid)
2nd Quarter 2009 23company confidential
match supply to demand
3. End-to-end management of stock level in the channel
4. Enforcing channel discipline in cross area shipment
5. Greater focus on reload pattern and denomination
Mar 09 Jun 09
+17%
Mar 09 Jun 09
Daily Outgoing Revenue
(Prepaid)
Source: Company data
Mar 09 Jun 09

AGENDA
Results Highlights
Malaysia – Celcom
Indonesia – Excelcomindo
company confidential2424
Sri Lanka – Dialog
Bangladesh – AxB
Other Regional mobile assets
Moving Forward

-5%
+4% -5%
Revenue (SLR mn) EBITDA (SLR mn) & margins (%)
Dialog Group : Financial Performance
+58% (Normalised: +25%)
28% 23%4% 13%
20%
29%
17%
-31% (Normalised: -21%) -46% (Normalised: -30%)
Improved operational performance especially EBITDA and cost management . Higher non operating cost due to accelerated deprec iation
2nd Quarter 2009 25company confidential
PATAMI* (SLR mn)
>-100% (Normalised: +56%)
>-100% (Normalised: >-100%) >-100% (Normalised: >-100%)• Revenue Q o Q grew 4% mainly from improvements in mobile
business. However, aggressive price competition rem ains a key challenge to overcome .
• Normalised EBITDA improved for the second consecuti ve quarter, reflecting Normalised EBITDA margin of 24% in 2Q 09 .
• 2Q 09 PATAMI affected by one off provision for acce lerated depreciation (SLR6bn). Excluding non-recurring item s, Q o Q PAT improved 56% primarily driven by implementation of operational cost rescaling initiatives.

Operating Expenses
Dialog Group : Financial Performance
• Direct Costs lower due to cheaper SIM cards & starter packs (15% Q o Q) and phone accessories (13% Q o Q) resulting from renegotiating with suppliers.
• Lower sales commission and focused advertising approach saw improvement in Sales & Marketing Costs
• Staff Costs dropped significantly Q o Q due to rescaling of human resource cost. 1Q 09 includes a one-off VRS cost of SLR278mn
% of Revenue 2Q 08 1Q 09 2Q 09 YTD Jun 08 YTD Jun 09
Direct Expenses 6.4% 8.0% 7.5% 6.2% 7.7%
Sales & Marketing 16.4% 15.6% 14.7% 17.2% 15.2%
Network Costs 27.5% 33.9% 33.8% 27.5% 33.9%
Staff Costs 11.1% 14.9% 9.0% 10.6% 11.9%
Bad Debts 2.1% 4.4% 2.6% 0.2% 3.5%
Others 9.0% 10.1% 12.4% 9.3% 11.2%
Total Expenses 72.5% 86.9% 80.0% 71.0% 83.4%
EBITDA Margin 27.5% 13.1% 20.0% 29.0% 16.6%
100.0% 100.0% 100.0% 100.0% 100.0%
D & A 20.0% 25.7% 103.7% 19.6% 65.4%
Cost rescaling initiatives gaining momentum
2nd Quarter 2009 26company confidential
* Capex includes CWIP additions + direct additions
** Annualised EBITDA
Financial Position (SLR mn)
30 Jun 08 30 Jun 09 Y o Y
Capex* 12,373 5,284 -57.3%
Cash & Cash Equivalents 2,807 5,612 +100%
Gross Debt 21,651 33,829 +56%
Net Assets 46,802 30,884 -34%
Gross debt / equity (x) 0.46 1.10 -
Gross debt / EBITDA** (x) 2.78 5.935 -
of SLR278mn
• Others higher in 2Q 09 due to one-off charge of SLR 257mn on cost relating to project financing cost pertaining to Fibre Optic Network Project.
D & A 20.0% 25.7% 103.7% 19.6% 65.4%

Dialog: Focus on continued improvement achieve enco uraging resultsCost rescaling initiatives gaining momentum in Dial og Telekom
Network related cost 6%
- lower maintenance & BTS site expenses
• Reduction in key cost areas:
2%Lower Direct Cost : 2Q 09 vs. 1Q 09
Customer related cost 7%
- cheaper SIM cards, starter packs, phone accessories negotiated with suppliers
Future Cost Saving through Network Modernisation
• Efforts to de-scale cost and improve margins through network modernisation.
• Opportunity to reduce future operating costs. Expected EBIT improvement moving forward :
SLR 1.5 bn. per annum
- lower maintenance charges
2nd Quarter 2009 27company confidential
Advertising expenses 22%
- more focused advertising
Manpower cost 11%
- lower pay roll and other savings resulting from rightsizing
Energy related cost 6%
Office rent 3%
• Reduction in key cost areas:
- lower electricity cost
- lower annual depreciation charges
• Impact in 2Q09 :
- One-off provision for Accelerated Depreciation of SLR6bn
3%Lower Operating Cost : 2Q 09 vs. 1Q 09

Dialog: Operational Performance
Subscribers(000’s)
+2%
+25%
ARPU (SLR)
590 621 648 671 699
4,216 4,357 4,861 5,176 5,294
2Q 08 3Q 08 4Q 08 1Q 09 2Q 09Postpaid Prepaid
5,8474,806 4,978
5,5095,993
Continued mobile subscribers growth amidst competit ive environment with ARPU stabilising
2nd Quarter 2009 28company confidential
MOUs (min)*
• Mobile subscribers increased by 25% Y o Y, and 2% Q o Q despite heightened price competition across the sector.
• Aggressive pricing strategies directed at market capturehas resulted in lower ARPUs.
* MoUs are based on outgoing min
Postpaid Prepaid

AGENDA
Results Highlights
Malaysia – Celcom
Indonesia – Excelcomindo
company confidential2929
Sri Lanka – Dialog
Bangladesh – AxB
Other Regional mobile assets
Moving Forward

AXB : Financial Performance
Revenue (BDT mn) EBITDA (BDT mn) & Margins (%)
24%29% 47%
Overall improvement continues, following successful turnaround to date
25%
864
32%
+24%
+4%
+26%
39%25%
+44%
+53%
+101%
2nd Quarter 2009 30company confidential
PATAMI (BDT mn)
- 495
Adjusting for Govt Compensation
Adjusting for Govt Compensation
>+100%
>+100%
>+100%• Revenue improvements driven by increased prepaid usage
at higher effective rates (ARPM). Introduction of attracti veproduct pricing plans supports growth in active and revenuegenerating subscriber base.
• EBITDA improved significantly mainly from lower subscribe racquisition and related costs, and reduction in interconne cttariff by regulators. EBITDA expected to be lower goingforward in anticipation of more aggressive customeracquisition plans.
• PATAMI improved significantly following improved EBITDAand lower finance costs.

% of Revenue 2Q 08 1Q 09 2Q 09 YTD Jun 08 YTD Jun 09
Direct Expenses 44.7% 44.8% 31.1% 42.1% 37.8%
Sales & Marketing 4.0% 2.8% 2.4% 3.0% 2.6%
Network Costs 10.6% 11.3% 11.3% 9.9% 11.3%
Staff Costs 6.2% 5.4% 4.6% 6.2% 5.0%
Bad Debts 0.1% 0.1% 0.2% 0.2% 0.1%
Others 5.0% 3.7% 3.7% 4.6% 3.7%
Total Expenses 70.7% 68.1% 53.3% 66.0% 60.6%
EBITDA Margin 29.3% 31.9% 46.7% 34.0% 39.4%
100.0% 100.0% 100.0% 100.0% 100.0%
D & A 25.3% 22.0% 22.9% 24.9% 22.4%
Operating Expenses
• Overall costs controlled due to prudent spending and cost management
• Direct expenses improved due to lower subscriber acquisition related costs and reduction in interconnect tariff
• Efforts to improve coverage has resulted in
AXB : Financial PerformanceContinued cost optimisation efforts and reduced sub sidy of SIM tax
2nd Quarter 2009 31company confidential
D & A 25.3% 22.0% 22.9% 24.9% 22.4%
Financial Position (BDT mn)
30 Jun 08 30 Jun 09 Y on Y
Capex 1,951 4,276 >+100%
Cash & Cash Equivalents 223 9 -96%
Gross Debt 18,063 18,249 +1%
Net Assets (Equity) 10,268 14,934 +45%
Gross debt / equity (x) 1.76 1.22 -
Gross debt / EBITDA (x) 3.67 3.40 -
coverage has resulted in higher Capex in 1H 09 compared to 1H 08.

+20%
Subscribers(000’s)
+1%
ARPU(BDT)
8,7217,816 9,3688,177
AXB : Financial Performance9.3 million total subscriber numbers reflecting Y o Y growth of 20%
9,284
2nd Quarter 2009 32company confidential
• Continuous growth in subscriber base despite slowerindustry growth due to elimination of SIM tax subsidy byoperators
• Q o Q Prepaid MOU/sub declined marginally but ARPUimproved following enhanced ARPM, which is likely toremain stable
• Q o Q Postpaid MOU/sub and ARPU also increased due togreater usage, which is likely to continue as new offers andpromotions introduced in future
MOU/sub (min)

AGENDA
Results Highlights
Malaysia – Celcom
Indonesia – Excelcomindo
company confidential33
Sri Lanka – Dialog
Bangladesh – AxB
Other Regional mobile assets
Moving Forward

HIGHLIGHTSCOMPANY
Regional Mobile : Performance Highlights
QUARTER on QUARTER PERFORMANCE OVERVIEW
4%Revenue Subs EBITDA
6%Continued growth momentum despite competitive pricing pressure from new entrants. Changes in Interconnect Usage charges on 1 April 09
Revenue* Subs EBITDA*10%
PAT
PAT*
Stiff price competition from new entrants affecting the industry 3%
7% 11%
33% 77%
2nd Quarter 2009 34company confidential
Revenue Subs EBITDA PAT
^ Idea and wholly owned subsidiaries on a consolida ted basis* Idea Financials are pro-forma adjusted for impact of changes of interconnection usage charges. Inclu ding the impact, Reported Revenue growth was 1% , E BITDA growth was 6% and PAT growth was 8%
Stable performance amidst challenging operating environment 2% 11%3%2%
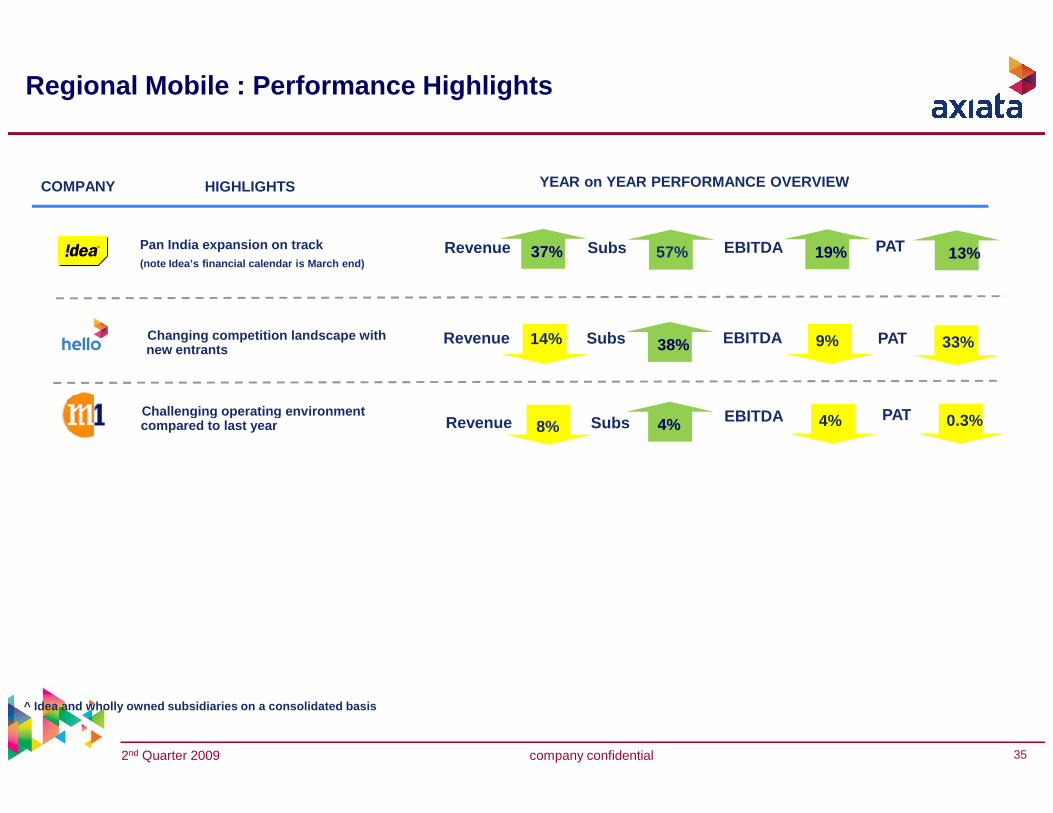
Regional Mobile : Performance Highlights
YEAR on YEAR PERFORMANCE OVERVIEW
EBITDA
38%Revenue Subs EBITDA
PAT
PAT14% 9% 33%
37%Revenue Subs EBITDA57% PAT19% 13%
Challenging operating environment
Changing competition landscape with new entrants
Pan India expansion on track (note Idea’s financial calendar is March end)
HIGHLIGHTSCOMPANY
2nd Quarter 2009 35company confidential
^ Idea and wholly owned subsidiaries on a consolida ted basis
Revenue Subs EBITDA PAT 0.3%4%8% 4%Challenging operating environment compared to last year

AGENDA
Results Highlights
Malaysia – Celcom
Indonesia – Excelcomindo
company confidential36
Sri Lanka – Dialog
Bangladesh – AxB
Other Regional mobile assets
Moving Forward

Moving Forward
• Continued focus on quality revenue generating subsc ribers and improving customer experience
• Focus on improving network utilization and monetizing traffic
• Next phase of transformation will focus on customer touch points and human capital – work in progress
• Accelerated broadband push and continued cost manag ement (network and recently bad debts). Enhanced segment focus through micro segmentation
• Continued focus on profitability, cash through conc erted efforts on cost management and capex efficien cy/reduction
• Group wide cost management programs to focus more o n structural changes but with long term benefits
• Refocus on major revenue growth opportunities
2nd Quarter 2009 37company confidential
OTHERS
• Driving aggressive retention programmes aimed at ge nerating more revenue from customer base
• Continued focus on distribution and services; incre asing brand presence
• Focus on improving network utilization and monetizing traffic
• Targeted network expansion and capex management
• Further Cost rescaling program with focus on effici ency and optimisation
• A structural relook and revamp required: line of bu siness, cost structure and organisation with refocu s on mobile (still work in progress)
• Completion of merger of Idea Cellular and Spice pen ding court approval expected in 3Q 2009

FY 2009 Guidance
2009 Headline KPIs KPIs Guidance
Revenue growth 6-11% Higher end of range
EBITDA growth 4-6% Higher end of range
2nd Quarter 2009 38company confidential
ROE (%) 4% Moderately above
Capex* RM4.2bn In-line
* Capex is not a Headline KPI
This guidance is subject to foreign exchange rates fluctuation or other external factors that could materially affect our second half year performance

Disclaimer
No representation or warranty, express or implied, is made as to the fairness, accuracy, completeness or correctness of the information, opinions and conclusions contained in this presentation. Axiata Group Berhad (the “Com pany”), it subsidiaries, affiliates and related bodies corpora te (the “Axiata Group”), and their respective officers, directors, employees and agents disclaim any liability (including, without limitation, any l iability arising from fault or negligence and consequential damages) for any loss arising from any use of this presentation or its contents or otherwise arising in connection with it.
This presentation contains projections and “forward- looking statements” relating to the Company’s busine sses and the sectors in which the Company operates. These forwar d-looking statements include statements relating to the Axiata Group’s performance. These statements reflect the c urrent views of the Company with respect to future events and are subject to certain risks, uncertainties and assumpt ions. It is important to note that actual results c ould differ materially from those anticipated in these forward looking sta tements. The Company does not undertake to inform y ou of any
2nd Quarter 2009 39company confidential
from those anticipated in these forward looking sta tements. The Company does not undertake to inform y ou of any matters or information which may come to light or b e brought to the Company’s attention after the date hereof.
The forecasts and other forward-looking statements set out in this presentation are based on a number of estimates and assumptions that are subject to business, econo mic and competitive uncertainties and contingencies , with respect to future business decisions, which are subject to change, known and unknown risks and in many cases o utside the control of the Company or the Axiata Group. The dir ectors and officers of the Company believe that the y have prepared the forecasts with due care and attention and consi der all best estimates and assumptions when taken a s a whole to be reasonable at the time of preparing the presentatio n. However, the Company’s forecasts presented in th is presentation may vary from actual financial results, and these v ariations may be material and, accordingly, neither the Company, any member of the Axiata Group nor its directors or off icers can give any assurance that the forecast perf ormance in the forecasts or any forward-looking statement containe d in this presentation will be achieved. Details of the forecasts and the assumptions on which they are based are set out in the presentation.

Thank You
company confidential40
Thank You
www.axiata.com
Axiata Group BerhadFormerly known as TM International Bhd


![[11] Pension Security · (The figures are as of the end of FY2010) 4.47 million subscribers 7.27 million subscribers 1.26 million subscribers Employees' ... Old agriculture and forestry](https://static.fdocuments.in/doc/165x107/5f8c0a946fff8828693e5f09/11-pension-security-the-figures-are-as-of-the-end-of-fy2010-447-million-subscribers.jpg)