2nd International Workshop on Automated Forensic Handwriting ...
55
2nd International Workshop on Automated Forensic Handwriting Analysis (AFHA) 2013 22-23 August 2013, Washington DC, USA ONLINE PROCEEDINGS AFHA 2013
Transcript of 2nd International Workshop on Automated Forensic Handwriting ...

2nd International Workshop on
Automated Forensic Handwriting
Analysis (AFHA) 2013
22-23 August 2013, Washington DC, USA
ONLINE PROCEEDINGS
AFHA 2013

Proceedings of the 2nd International Workshop on Automated Forensic Handwriting Analysis (AFHA) 2013
PREFACE
Handwriting is considered as a representative of human behavior and characteristics for
centuries. With the evolution of modern computing technologies, researchers have moved
towards the automated analysis of handwriting. This shift has been reinforced by the interest
various industries have in this field. One of the most important applications of automated
handwriting analysis systems is in forensic environments. Until now, most of the forensic
handwriting analysis cases are solved without actual application of automated systems. This is
because there is an ever increasing gap between the demands of Forensic Handwriting
Experts (FHEs) and the computer science community. Actually the underlying issue is the
incapability of most of the state-of-the-art automatic handwriting examination systems to be
directly applicable to the forensic cases. This is because the computer science community in
general has moved by considering the cases which are either trivial w.r.t. forensic situations
or not considered the needs of FHEs. Thus, there is a great demand to bring the forensic
experts and the computer science experts under one roof. The 2nd
International Workshop and
Tutorial on Automated Forensic Handwriting Analysis (AFHA) 2013, like its predecessor
AFHA 2011, serves this purpose.
The AFHA 2013 takes place on 22-23 August 2013, in Washington DC, USA, and is
organized as a two-day combined workshop and tutorial covering a diverse range of topics
influencing handwriting analysis in the forensic science and in computer science (particularly,
in pattern recognition).
On the first day, an introductory tutorial on forensic handwriting examination and automatic
handwriting/signature analysis is given. This includes a description of the forensics point of
view and examples of real casework as well as a summary of important approaches in the area
of automated handwriting examination. The major topics include: how forensic experts make
comparisons (similarities versus differences, subjectivity, and bias), natural variation, line
quality, quality versus quantity; what forensic experts need from the document analysis
community; what the document analysis community needs to understand about FHEs work;
existing systems and system problems; application of the Bayesian approach to forensic
evidence evaluation (i.e. using the Likelihood Ratios a measure of the strength of evidence),
and reporting by means of a verbal conclusion scale. The state-of-the-art of automatic
handwriting/signature analysis systems is also focused where the emphasis is on the internal
working of these systems along with the future directions in this regard. The purpose is to
familiarize the forensic experts about working of automatic systems.
On the second day, the workshop is organized where researchers from handwriting
examination and pattern recognition communities present their novel researches. This volume
contains the proceedings of the AFHA 2013 workshop. Thirteen submissions were received
and after a single-blind-peer review process, ten papers were accepted for this volume.
The first paper, ‘Some Observations on Handwriting from a Motor Learning Perspective’ discusses the dynamics of signatures in the light of recent findings in motor learning, according to
which a signature is a highly automated motor task and, as such, it is stored in the brain as both a
trajectory plan and a motor plan. It conjectures that such a stored representation does not necessarily
include the entire signature, but can be limited to only parts of it, those that have been learned better
and therefore are executed more automatically than others.
The second paper, ‘Offline Handwriting Acquisition under Controlled and Uncontrolled
Conditions’ discusses the offline handwriting acquisition under controlled and uncontrolled
conditions for research purposes. The paper emphasizes that for forensic purposes, it is preferred to
start building databases with forensically relevant data. This is because handwriting samples that make
2

Proceedings of the 2nd International Workshop on Automated Forensic Handwriting Analysis (AFHA) 2013
up the current publicly available databases have all been collected under controlled conditions.
The third paper ‘Oriented Local Binary Patterns for Writer Identification’ presents an oriented
texture feature set, based on local binary patterns (LBP), and apply it to the problem of offline writer
identification using the ICDAR 2011 and ICHFR 2012 writer identification contest datasets.
The fourth paper ‘Chinese Handwritten Writer Identification based on Structure Features and
Extreme Learning Machine’ proposes an approach for writer identification of Chinese handwriting
using Chinese character structure features (CSF) and extreme learning machine (ELM). To extract the
features embedded in Chinese handwriting characters, special structures have been explored according
to the trait of Chinese language.
The fifth paper ‘Dissimilarity Representation for Handwritten Signature Verification’
discusses the dissimilarity representation (DR) approach where proximity among patterns constitute
the classification space. The paper provide various scenarios where similar concept has been applied
by forensic Questioned Document Examination (QDE) experts, when proximity between questioned
signatures and a set of templates lead to the authentication decision.
The sixth paper ‘Multi-script Off-line Signature Verification: A Two Stage Approach’
presents a technique for off-line English, Hindi (Devnagari), and Bangla (Bengali) signature
verification by initially identifying the script type and then applying verification. This paper
highlights that better results could be achieved when the script is identified in advance.
The seventh paper ‘Off-Line Signature Verification based on Ordered Grid Features: An
Evaluation’ presents and evaluates an offline signature modeling which attempts to advance a grid
based feature extraction method uniting it with the use of an ordered power set. More specifically, this
work represents the pixel distribution of the signature trace by modeling specific predetermined paths
having Chebyshev distance of the two, as being members of alphabet subsets-events.
The eighth paper ‘Towards Automated Hyper-spectral Document Image Analysis’ provides an
overview of the applications of hyper-spectral imaging with focus on solving pattern recognition
problems, especially handwriting analysis and signature verification.
The ninth paper ‘Fusing Modalities in Forensic Identification with Score Discretization’ proposes a method of score fusion based on discretization. It is evaluated considering the signatures
and fingerprints.
The tenth paper ‘Joint Glossary of Forensic Document Examination and Pattern Recognition’ introduces an open scientific glossary, based on the MediaWiki engine, to the forensic examination
and pattern recognition communities. The purpose is to enable the development of a shared
conceptualization among the two communities.
We would like to thank the authors for their paper submission, our program committee
members for their reviews and active participation in various activities concerning tutorial and
workshop, and the AFHA 2013 workshop chairs for their advice and guidance throughout the
endeavor.
The AFHA 2013 PC-chairs,
August 2013.
3

Proceedings of the 2nd International Workshop on Automated Forensic Handwriting Analysis (AFHA) 2013
Committees
Program and Organization Chairs
Muhammad Imran Malik,
German Research Center for Artificial Intelligence, Kaiserslautern, Germany
Marcus Liwicki,
German Research Center for Artificial Intelligence, Kaiserslautern, Germany
University of Fribourg, Switzerland
Linda Alewijnse,
Netherlands Forensic Institute, The Hague, the Netherlands
Michael Blumenstein,
Professor, Griffith University, Southport QLD 4215, Australia
Charles E.H. Berger,
Netherlands Forensic Institute, The Hague, the Netherlands
Reinoud D. Stoel,
Netherlands Forensic Institute, The Hague, the Netherlands
Bryan Found,
Chief Forensic Officer, Victoria Police Forensic Services Department, Australia
Program Committee
Angelo Marcelli, U Salerno
Giuseppe Pirlo, U Bari
Javier Ortega-Garcia, U A Madrid
Julian Fierrez, U A Madrid
Katrin Franke, NIS Labs
Loris Nanni, U Bologna
Miguel Ferrer, ULPGC
Réjean Plamondon, E P Montreal
Sargur N. Srihari, U Buffalo
Takashi Matsumoto, Waseda U
Wataru Ohyama, Mie U Japan
Xiaohong Chen, China
Zeno Geradts, NFI
4

Proceedings of the 2nd International Workshop on Automated Forensic Handwriting Analysis (AFHA) 2013
TABLE OF CONTENTS
Some Observations on Handwriting from a Motor Learning Perspective... 6 Angelo Marcelli, Antonio Parziale and Rosa Senatore
Offline Handwriting Acquisition under Controlled and Uncontrolled
Conditions.................................................................................................. 11 Linda Alewijnse
Oriented Local Binary Patterns for Writer Identification.......................... 15 Anguelos Nicolaou, Marcus Liwicki and Rolf Ingolf
Chinese Handwritten Writer Identification based on Structure Features and
Extreme Learning Machine........................................................................ 21 Jun Tan, Jianhuang Lai, Wei-Shi Zheng and Ming Zhong
Dissimilarity Representation for Handwritten Signature Verification....... 26 George Eskander, Robert Sabourin and Eric Granger
Multi-script Off-line Signature Verification: A Two Stage Approach...... 31 Srikanta Pal, Umapada Pal and Michael Blumenstein
Off-Line Signature Verification based on Ordered Grid Features: An
Evaluation …………………………………………….............................. 36 Konstantina Barkoula, Elias Zois, Evangelos Zervas and George Economou
Towards Automated Hyper-spectral Document Image Analysis…........... 41 Zohaib Khan, Faisal Shafait and Ajmal Mian
Fusing Modalities in Forensic Identification with Score Discretization.... 46 Wong Yee Leng, Siti Mariyam Shamsuddin and Sargur N. Srihari
Joint Glossary of Forensic Document Examination and Pattern
Recognition............................................................................................... 51 Inés Baldatti and Erika Griechisch
5

Some Observations on Handwritingfrom a Motor Learning Perspective
Angelo Marcelli, Antonio Parziale, Rosa SenatoreNatural Computation Laboratory, DIEM
University of SalernoFisciano (Sa), Italy
{amarcelli, anparziale, rsenatore}@unisa.it
Abstract—We discuss the dynamics of signatures in the lightof recent findings in motor learning, according to which asignature is a highly automated motor task and, as such, itis stored in the brain as both a trajectory plan and a motorplan. We then conjecture that such a stored representation doesnot necessarily include the entire signature, but can be limitedto only parts of it, those that have been learned better andtherefore are executed more automatically than others. Becausethese regions are executed more automatically than others, theyare less prone to significant variations depending on the actualwriting conditions, and therefore should represent better thanother regions the distinctive features of signatures. To supportour conjecture, we report and discuss the results of experimentsconducted by using an algorithm for finding those regions in thesignature ink and eventually using them for automatic signatureverification.
Index Terms—motor learning and execution; stability region;signature verification;
I. INTRODUCTION
According to the daily experience, a coordinated sequenceof ”elementary” movements is acquired and executed fasterand more accurately the more it is practiced. Early in lear-ning, actions are attention demanding, slow and less accurate,whereas after long-term practice performance becomes quick,movements are smooth, automatic, and can be performedeffortlessly, using minimal cognitive resources.
Studies on motor control have shown that selection, exe-cution and learning of the movements needed to perform amotor task involve several brain areas and motor subsystems,but their activation and cooperation depend on the kind ofmovements that are being made and on the effector that isbeing used [1].
Indeed, when a child starts learning handwriting by copyingletters or words, he attempts several trajectory patterns inorder to replicate the same shape of the letters, selecting thepoints to reach through the visual system, and performingthe appropriate sequence of movements through the motorsystem. During the initial phase of learning, the movementsare quite straight and aimed to reach a sequence of points (asin Figure 1a). The executed motor plan is corrected accordingto the information provided by the visual and proprioceptivefeedback, so that the actual trajectory corresponds to thedesired one, and the lowest energy is spent by the muscularsubsystem involved. As learning proceed, simple point-to-point movements become continuous, curved and smoother,
(a)
(b)
Fig. 1. Handwriting samples, written by a child (a) and a skilled writer (b).
the motor sequence comes to be executed as a single beha-vior and is performed automatically, using minimal cognitiveresources (as in Figure 1b).
There is also strong evidence, supported by the results ofseveral experimental studies on motor learning, that a givensequence of actions is learned from different perspectives. Ithas been observed, first by Lashley [2] and then by Hebb[3], that a generic movement, learned with one extremity,can be executed by different effectors. Furthermore, otherstudies have shown that writing movements learned throughthe dominant hand could be repeated using different bodyparts, such as non-dominant hand, the mouth (with the pengripped by teeth) and foot (with the pen attached to it), even ifthe subject had essentially no previous experience writing withany of this body parts [4], [5]. Despite the different muscularand skeletal systems used and, even though the movementsare not smooth, it can be observed that the writing productionfollows the same trajectory in all conditions [4] (see Figure 2).The ability to perform the same movement pattern by differentmuscular systems is called ”motor equivalence”. It suggeststhat movements directed to perform a task are stored in thebrain in two ways: in an abstract form (effector-independent)related to the spatial sequence of points representing the tra-jectory plan, and as a sequence of motor commands (effector-dependent) directed to obtain particular muscular contractionsand articulatory movements.
Other studies on motor learning have shown that when theuntrained hand is used to perform a given sequence, learnedwith long-term practice with the other hand, performances arepoor, but this is not true for a newly learned sequence [6],
6

supporting the hypothesis that early in learning the executionof the motor task is more based upon the trajectory plan(effector independent), whereas late in learning upon thesequence of motor commands (effector-dependent).
Execution of voluntary movements requires the interactionbetween nervous and musculoskeletal systems, involving seve-ral areas, from the higher cortical centers to the motor circuitsin the spinal cord [7].
In seeking to understand all the breadth and facets of motorlearning, many researchers have used different approaches andmethods, such as genetic analysis, neuroimaging techniques(such as fMRI, PET and EEG), animal models and clinicaltreatments (e.g. drugs administration and brain stimulation).These studies have provided a large body of knowledgethat has led to several theories related to the role of thecentral nervous system in controlling and learning simpleand complex movements. According to the results reportedby neuroimaging and experimental studies on motor learning,several cortical and subcortical structures, including the basalganglia, cerebellum, and motor cortical regions, are thoughtto be critical in different stages and aspects in the acquisitionand/or retention of skilled motor behaviors.
In order to locate which brain area, or areas, underlieeffector-independent representation of handwriting, Rijntjesand colleagues [8] carried out an fMRI study to examinepatterns of brain activation associated with signing, usingeither the hand or the big toe. Their results showed theinvolvement of the parietal cortex in general, and posteriorparietal cortex and occipitotemporal junction in particular, inthe representation of written letter forms.
More recently, other neuroimaging studies have investigatedthe dynamics and functional connectivity of brain networksassociated with learning a novel sequence of hand strokemovements to write ideomotor character [9]. Their resultsalso suggest that a novel sequence of movements is initiallymapped to form an internal representation of the sequence thatis progressively encoded and refined subcortically (in the basalganglia and in the cerebellum) as performance improves.
The imaging data reported by other studies on motorlearning support the notion that distinct regions of the basalganglia participate in different stages of learning. These studiesreport increased activity within the striatum (the input nucleusof the basal ganglia), in particular within the associativestriatum and sensorimotor striatum early and late in learning,respectively. However, although there is solid evidence thatthe initial learning of many skills depends on the striatum,there are contrasting results in the literature regarding to therole of the sensorimotor striatum in automatic responding. Forexample, whereas some fMRI studies reported increased acti-vity in the sensorimotor striatum with extended training, othersreported decreased activity. Moreover, Turner and colleagues[10] reported that temporary inactivations of sensorimotorregions of the internal segment of the globus pallidus (a basalganglia nucleus whose activity depends on the sensorimotorstriatum) did not impair the ability of monkeys to producepreviously learned motor sequences. Therefore, these results
Fig. 2. A sentence written by the same writer using different body parts.Reproduced from [4].
Fig. 3. Neural scheme of the model for procedural motor learning.
sustain the hypothesis that the basal ganglia play an importantrole in the initial stage of learning, whereas it is not well-established their importance in the final stage of learning.
With regard to the cerebellum, many studies report increasedactivity within the cerebellar cortex during learning, andincreased activity within the dentate nucleus (an output nucleusof the cerebellar circuitry) until automaticity is achieved. Adetailed review of the imaging studies whose results are herecited can be found in [11].
According to these results, we have proposed a neuralscheme, based on the hypothesis that acquiring new motorskills requires two phases, in which two different processesoccur:
• during the early stage, humans learn the spatial sequenceassociated to the motor task in visual coordinates, i.e. thesequence of points to reach in order to generate the inktrace.
• during the late, automatic phase, the sequence of motorcommands in motor coordinates is acquired and comesto be executed as a single behavior.
The neural scheme for motor learning is shown in Figure 3and incorporates the parietal and motor cortex, basal gangliaand cerebellum [12].
Sensory information is provided by an input module (sen-sory input in the figure) to the cerebral cortex, basal gangliaand cerebellum. The parietal association cortex releases signalsthat specify the position of targets in extrapersonal space(according to the studies conducted by Andersen and Zipser[13] and Rijntjes [8]). Therefore, the basal ganglia, interacting
7

with the parietal cortex, select the next target point in thesequence. In turn, parietal cortex sends this information to thecerebellum that, interacting with the motor cortex, selects theappropriate motor command.
This model fits with the our hypothesis that motor learningfollows two distinct phases. During the early phase of learning,the model learns the spatial sequence in visual coordinates (i.e.the sequence of points to reach in order to realize the motortask) through the interactions between the basal ganglia andthe parietal cortex. The spatial sequence is then converted intomotor commands through the interactions of the cerebellumand the motor cortex. Therefore the cerebral cortex, basalganglia and cerebellum initially would work in parallel. Thebasal ganglia, through the associative striatum, are involvedin the acquisition of the spatial sequence and the cerebellarcortex starts working to acquire the motor sequence. Aslearning proceeds, the sequence of motor commands in motorcoordinates is acquired and stored in the dentate nucleus.
II. SIGNATURES AND MOTOR LEARNING
The neural scheme illustrated in the previous section sug-gests that after the learning, i.e. when the movement is execu-ted fluently, the sequence of motor command is executed as asingle movement. It suggests also that the more a movementis repeated the better is learned, i.e. the more it is automated.When applied to handwriting, the model suggests that theultimate goal of the learning is that of producing a repertoireof completely automated movements in correspondence ofthe most frequently used sequences of characters. Such arepertoire depends on the sequences of characters the writeris most familiar with, which triggers the learning, and thesequences of the corresponding motor commands. Thus, thehandwriting style emerges from both those aspects, the formerbeing mainly language and cultural dependent, the latter beingdependent on the physical and cognitive motor skills of thesubject. Accordingly, different subjects may develop diffe-rent repertoires of completely automated movements, eitherbecause the sequences of characters for which a completedautomated movement is learned are different or because adifferent sequences of motor commands are learned for agiven sequence of characters. When a completely automatedmovement has been learned for an entire message, multipleexecutions of such a movement should produce similar re-sults, the difference between them being mainly influencedby the effector-dependent encoding of the learned sequencerather than from the effector-independent one. On the otherhand, when more than one completely automated movementneeds to be used for encoding the entire message, furthervariability may be observed in multiple execution of the samemovements because the movements introduced for smoothingthe transition between two successive completely automatedmovements are planned on the fly during the execution, andtherefore may vary in both the effector-independent and theeffector-dependent component.
What do these observations suggest in case of signatures?A signature is a movement the subject is very familiar with,
that has been learned through repeated practice, and thereforeit will have triggered a learning process whose final result isthe repertoire of completely automated movements used bythe subject while signing. If the entire signature is encodedin a single completely automated movement, it is expectedthat signatures produced by using the effector under the samecondition result in very similar traces. In such a condition,in fact, the effector-independent part of the movement doesnot change because it has been completely learned and theeffector-dependent component is supposed to be the sameduring all the execution. On the contrary, if the signature isproduced by executing more than one completely automatedmovement, repeated execution may produce different traces,even under the assumption that the effector is used underthe same condition, because there will be differences in themovements, and therefore in the traces, for connecting twosuccessive completely automated movements. It follows fromthe observations reported above that whatever (dis)similaritymeasure is adopted for deciding whether a signature is genuineor not, it should be handled with care. In particular, it can beused successfully only after it has been decided which one arethe parts of the signature that correspond to the execution ofcompletely automated movements, and only the (dis)similaritybetween those parts of the signatures at hand should beevaluated by the adopted measure, because only those partsare expected to be ”stable” across multiple executions of thesignature. In other words, the signature verification should beconducted by weighting differently the (dis)similarity between”stable” regions and the (dis)similarity between other regionsof the signature. In the following sections, we will brieflyillustrate a procedure we have designed for finding the stabilityregions and then results obtained in a signature verificationexperiment.
III. FINDING THE STABILITY REGIONS
It follows from our definition of stability regions that theyare sequences of strokes produced as a single behavior andtherefore should be embedded into any execution of thesignature. Let us recall that a completely learned movementis stored in two forms, a sequence of target points, and asequence of motor commands, and that the former is effector-independent, while the latter is effector-dependent. When thesame effector is used in multiple executions, therefore, the onlysource of variability is the actual state of the effector, whichmay give raise to local variations in the shape of the ink traces.These traces, however, are composed of the same number ofstrokes and aimed at reaching the same sequence of targetpoints. Assuming such a perspective, the stability regions arethe longest common sequences of similar strokes found in twosignatures, where similar means that they are aimed at reachingthe same sequence of target points by following the same path.The method we have developed for finding the stability regionsassumes that the signature signal has been segmented into asequence of strokes, and the detection of the stability regionsis achieved by an ink matcher that finds the longest commonsequences of strokes with similar shapes between the inks of
8

(a) Genuine n. 16 (b) Genuine n. 19
Fig. 4. Genuine signatures produced by the user n. 22. The stability regionis in red.
a pair of signatures [14]. For deciding when two sequencesare similar enough, i.e. when they match, the method exploitsthe concept of saliency that has been proposed to accountfor attentional gaze shift in primate visual system [15]. Therationale behind this choice is that, by evaluating the similarityat different scales and then combining this information acrossthe scales, sequence of strokes that are globally more similarthan other will stand out in the saliency map. The global natureof the saliency guarantees that its map provides more reliableestimation of trace similarity with respect to that providedby local criteria, as it is usually proposed in the literature[16]. According to the definition of stability regions, onewould expect that the sequences of similar strokes providedby the ink matching appear in all the signatures. In practice,however, both the stroke segmentation and the ink matchingmay introduce errors, in locating the segmentation points (i.e.estimating the trajectory) and/or deciding when a sequence ofstrokes is similar to another (i.e. estimating the motor plan),that may produce different stability regions for the set of signa-tures. To decide which sequences correspond to the stabilityregions, we consider that longer stability region correspondto longer sequence of elementary movements executed in ahighly automated fashion. Because the level of automation isthe result of the learning process described above, and becausethe learning is an individual feature, long stability regions aremore subject specific than short ones. Accordingly, we removethe stability regions that are subsequences of longer ones.
IV. EXPERIMENTAL RESULTS
We have two experimental results to support our conjec-ture about the role of stability regions in signature learningand execution and their effectiveness in signature verifica-tion. In both cases, the experiments were conducted on theSVC2004 dataset, adopted in the literature for writer verifica-tion/identification [17].
The first one was carried on by 3 subjects independently.They were provided with a written definition of stabilityregions in terms of sequence of strokes and asked to findthem between 100 pairs of genuine signatures previouslysegmented by our algorithm. We then compared their outputsand removed 13 pairs for which there was some disagreementamong them. This 87 pairs were then processed as above andthe provided output compared with the one provided by theexperts. In all the cases we have found a perfect correspon-
(a) Genuine n. 8 (b) Genuine n. 10
Fig. 5. Genuine signatures produced by the user n. 40. The stability regionis in red.
(a) Genuine n. 14
(b) Genuine n. 18
Fig. 6. Genuine signatures produced by the user n. 6. The stability region isin red, the pen-up in magenta.
dence between the machine and the expert. As an illustrationof the results, the figures 4-6 show the stability regions foundby the algorithm in case of signatures of different complexity.Figure 4 shows two signatures produced without any pen-upand pen-down occurring between the beginning and the end ofthe signature. The two traces are divided into the same numberof strokes, and the stroke segmentation points, represented infigure as black dot, are located on the shape so as to roughlypreserve their relative positions. According to our model, thus,the subjects concluded that the two shapes have been generatedby the same motor plan, because it aims at reaching the samesequence of target points (estimated by the relative positionof the segmentation points, as described in [18]) by means ofthe same sequence of elementary movements with the sametime superimposition between successive ones (as estimatedby the similarity between sequence of strokes). In this case,one would expect the algorithm to find just one stabilityregion covering the whole signature, as it happens. Figure5 shows two signatures produced by another writer withoutlifting the pen, as in the previous case, but with the end-effector in a different initial condition. Again, by looking atthe segmentation points and at the similarity between sequenceof strokes, the experts (and the machine as well) concludedthat there was a difference in the initial parts of the signature(depicted in blue in the figure) and therefore they were notinclude in the stability region. Eventually, figure 6 depictstwo long and complex signatures produced by a third writer.
9

Because of the pen-up within the trace, depicted in magenta,and according to our conjecture, we expect that this signatureis less automated and that stability regions may be foundonly during pen-down, as it happens. When requested toexplain why they did not include the beginning of the inktrace (in blue) in the stability regions, the experts told us thatthe movement at the beginning of the sequence were verydifferent, since in the first case the first stroke was directedtop left, while in the second it was directed to left, showingalso a sign of hesitation at the very beginning, as the subjectstarted a movement directed down-left and suddenly correctedit. Similarly, in the first case it appears to be a stop-and-goor an hesitation while drawing the letters. In both cases, theywere interpreted as sign of difference between the sequenceof strokes constituting the motor plan.
The second result comes from a signature verificationexperiment we have designed and performed on the samedataset [14]. In such an experiment, we have used the stabilityregions provided by our algorithm for both selecting thegenuine signatures to be used as reference and classifyingthe questioned signatures as both genuine or forged. Eachquestioned signatures was compared with the stability regionsof the references. If a match was found, the similarity betweenthe sequence(s) of strokes of the stability region(s) in thereference and the matching sequences of strokes in the que-stioned was compared with two thresholds, to decide whetherthe questioned was genuine or not. Despite this very simpledecision criteria, and the exploitation of shape informationonly for measuring the similarity between sequence of strokes,the experimental results showed that our method was the5th among the 15 methods considered in the final ranking,but also that it exhibited the lowest standard deviation ofthe performance. This latter finding suggests that the methodcaptures the common aspects of signatures as they derive fromthe model, and therefore is quite robust in providing similarperformance independently of the distinctive signing habit ofeach subject. Even more interesting, most of the errors arefound in case of signatures with many pen-up and pen-down,and whose stability regions are made of a few strokes, furthersupporting our claim that the more the signature is automatedthe longer are the stability regions.
All together, those results show that stability regions, as wehave defined and implemented them, do seems to exist and thatthey can represent a promising way to root signature verifica-tion within the framework of motor learning and execution.
V. CONCLUSIONS AND FUTURE DIRECTIONS
We have discussed some recent findings in neurocomputa-tional modeling of motor learning and execution and suggestedthat they may provide a new perspective for handwriting ana-lysis. Under such a perspective, we have conjectured that si-gnatures are represented as a motor plan, stored in a distributedfashion between the basal ganglia and the cerebellum, whichencodes both the target points to be reached and the motorprogram to execute for producing the desired handwriting.From this conjecture we have derived a definition of stability
regions by globally evaluating the traces shape similarity bymeans of a saliency map.
Our conjecture is supported by two experiments showingthat: human subjects may actually find stability regions that fitswith our definition and that such regions provide a plausibleestimate of the motor plans used to produce the observedtraces; the proposed algorithm finds the same stability regionsas the human subjects; the stability regions may be used forboth selecting the reference signature and performing signatureverification, providing very promising results even when avery simple criterion is used to decide whether a questionedsignature is genuine or not.
In the future we will investigate to which extent our modelcan deal with disguising writers. We would also like tounderstand whether there is any relation between legibility andlearning of signatures.
REFERENCES
[1] M. Kawato, “Internal models for motor control and trajectory planning,”Current Opinion in Neurobiology, vol. 9, pp. 718–727, 1999.
[2] K. Lashley, “Basic neural mechanisms in behavior,” PsychologicalReview, vol. 37, pp. 1–24, 1930.
[3] D. O. Hebb, The organization of behavior: a neuropsychological theory.New York: Wiley, 1949.
[4] M. H. Raibert, Motor control and learning by the state space model.Cambridge: Artificial Intelligence Laboratory, MIT, 1977.
[5] A. M. Wing, “Motor control: mechanisms of motor equivalence inhandwriting,” Current Biology, vol. 10, pp. 245–248, 2000.
[6] M. K. Rand, O. Hikosaka, S. Miyachi, X. Lu, and K. Miyashita, “Cha-racteristic of a long-term procedural skill in the monkey,” ExperimentalBrain Research, vol. 118, pp. 293–297, 1998.
[7] E. R. Kandel, J. H. Schwartz, and T. M. Jessel, Principles of NeuralScience. McGraw-Hill, 2000.
[8] M. Rijntjes, C. Dettmers, C. Buchel, S. Kiebel, R. Frackowiak, andW. C., “A blueprint for movement: functional and anatomical represen-tations in the human motor system,” Journal of Neuroscience, vol. 19,no. 18, pp. 8043–8048, 1999.
[9] B. A. Sweet, J. L. Contreras-Vidal, B. Rasmus, and A. Braun, “Neuralsubstrates of graphomotor sequence learning: A combined fMRI andkinematic study,” Journal of Neurophysiology, vol. 103, no. 6, pp. 3366–3377, 2010.
[10] R. S. Turner, K. McCairn, D. Simmons, and I. Bar-Gad, The basalganglia VIII (Advances in behavioral biology, vol. 56). Springer, 2005,ch. Sequential motor behavior and the basal ganglia, pp. 563–574.
[11] R. Senatore, The role of Basal Ganglia and Cerebellum in MotorLearning: A computational model. University of Salerno: PhD Thesis,2012.
[12] R. Senatore and A. Marcelli, “A neural scheme for procedural motorlearning of handwriting,” in Frontiers in Handwriting Recognition(ICFHR), 2012 International Conference on, 2012, pp. 659–664.
[13] R. A. Andersen and D. Zipser, “The role of the posterior parietal cortexin coordinate transformations for visual-motor integration,” CanadianJournal of Physiology and Pharmacology, vol. 66, pp. 488–501, 1988.
[14] A. Marcelli, S. Fuschetto, and A. Parziale, “Modeling stability in on-linesignatures,” in International Graphonomics Society (IGS), 2013, 2013,pp. 135–138.
[15] L. Itti, C. Koch, and E. Niebur, “A model of saliency-based visual atten-tion for rapid scene analysis,” Pattern Analysis and Machine Intelligence,IEEE Transactions on, vol. 20, no. 11, pp. 1254–1259, 1998.
[16] D. Impedovo and G. Pirlo, “Automatic signature verification: The stateof the art,” Systems, Man, and Cybernetics, Part C: Applications andReviews, IEEE Transactions on, vol. 38, no. 5, pp. 609–635, 2008.
[17] D.-Y. Yeung, H. Chang, Y. Xiong, S. George, R. Kashi, T. Matsumoto,and G. Rigoll, “Svc2004: First international signature verification com-petition,” in Biometric Authentication. Springer, 2004, pp. 16–22.
[18] A. Marcelli, A. Parziale, and A. Santoro, “Modeling handwriting style:a preliminary investigation,” in Frontiers in Handwriting Recognition(ICFHR), 2012 International Conference on. IEEE, 2012, pp. 411–416.
10

Offline Handwriting Acquisition under Controlled and Uncontrolled Conditions
Linda Alewijnse Netherlands Forensic Institute
Department of Digital Technology and Biometrics The Hague, The Netherlands [email protected]
Abstract—This paper gives a description of offline handwriting acquisition under controlled and uncontrolled conditions for research purposes. The data collection task is an underestimated part in the process of developing signature verification or handwriting identification systems. There is a continuous need for new, unpublished data to train and evaluate new algorithms. Handwriting samples that make up the current publicly available databases have all been collected under controlled conditions. However, good quality data is still limited.
On the contrary, research databases constituted of case related biometric data in general are scarce. To suit forensic purposes, it is preferred to start building databases with forensically relevant data. When verification and identification systems are trained on this type of material, the output will be more suited for forensic examination purposes. The challenges in this area are considered.
Keywords—offline data, data collection, signature verification, forensic handwriting examiner
I. INTRODUCTION
Signature verification is a biometric technique with promising results for the near future for implementation within the forensic handwriting examination. In the past 10 years rapid developments are made within the pattern recognition discipline [1]. Implementing analysis tools in the forensic practice is the next challenge. Before an automated signature verification or handwriting identification system can be implemented, the forensic community must be ascertained that the systems are trained, evaluated and validated by correct environmental conditions.
Collecting and selecting handwriting samples for research purposes is often an underestimated task. The number of publicly available databases with handwriting is limited, so new data must be collected regularly. Data are primarily collected to provide information regarding a specific topic. Therefore, data must be in accordance with the objective of the study. The overall performance of a biometric technology is eventually influenced by the quality of the input data.
A. Learning from the past
The following example illustrates the importance of sample design and sample selection to suit the purpose of the study. In 2002, Srihari and colleagues [2] conducted a study to test the principle of individuality of handwriting. Handwriting samples were collected from 1500 individuals. The dataset was representative for the US population with respect to gender, age, ethnicity, handedness, etc. The automated system CEDAR-FOX was used to evaluate the handwriting, and could identify the writer of a particular sample with 98 percent confidence. Inferring these statistics over the entire U.S. population, writer identification can be established with 96 percent confidence.
Saks [3] commented on this study by arguing that to test individuality, a better sampling design would have been to gather a representative sample of clusters of writers, with each cluster composed of highly similar writers. Only then, the data would have been discriminative of highly similar handwriting. And it would have been repeatable if the same effect was observed between the clusters. The choice of data by Srihari and colleagues was not adequate for testing the hypothesis that handwriting is individual.
In a response to this, Durina and colleagues [4] conducted a study in which samples of writing were obtained from 52 writers and their teachers who were taught the same copybook style at the same Catholic elementary school approximately 4 decades ago. The research addressed the criticisms that earlier studies on the individuality of handwriting did not include populations from homogeneous writing communities. It demonstrated that there is a high degree of inter-writer variation among writers, even in populations where the driving forces for variation are low. In spite of the size of the dataset, it was better fit for purpose to investigate the uniqueness of handwriting.
B. Learning from each other
In the past years, from 2009 until 2013, different datasets with signatures as well as handwriting are collected by the Netherlands Forensic Institute for the Signature Competition (SigComp) [5]. This competition allows researchers and
11
practitioners from academia and industries to compare performance on signature verification on new and unpublished datasets. Because all participating parties in the competition are provided with the same data, results are comparable. While the competition provides an overview of involved parties and shows the performance of the available systems to the forensic community, the pattern recognition researchers are more concerned about which features are most discriminative. The SigComp provides a platform to bridge the gap between the two communities.
Two years ago, in 2011, a group of researchers from different fields of expertise started the discussion about how to bridge the gap between the two communities and to signal the challenges. Computer programmers learned how a forensic handwriting examination is carried out and examples of real casework are described. Forensic scientists got an overview of state-of-the-art automatic verification systems. Recent advances are comparing the performance with Minimum Cost of Log Likelihood Ratios [6], the task of reporting a probabilistic output score, and the addition of disguised signatures in new datasets. Nevertheless, much work needs still to be done in order of bringing together researchers in the field of automated handwriting analysis and signature verification and experts from the forensic handwriting examination community.
The scope of the competition changes each year. In the end, when automated systems are meant to aid the FHE in the examination or as an objective tool. The first competition was focused on skilled forgeries. After that, disguised signatures were added to the questioned signatures. Last year we’ve provided different scripts, i.e. Dutch and Chinese signatures. The consequence of the changing focus of the competition allows the developers to improve their algorithms and benefit from new and unpublished handwriting data.
II. OBJECTIVE
Three scenarios for handwriting data collection can be distinguished: 1) The samples are collected under controlled conditions, e.g. let the participants write on the same make of paper, with the same writing instrument, in similar writing position, etc., 2) spontaneous writings are collected from participants by gathering their writings from the past, and 3) forensic handwriting samples from casework are shared, either anonymously or by an online evaluation platform. Topics that are covered in this paper are:
• offline and online data • requirements of the dataset • controlled versus uncontrolled conditions • research data versus forensic data
The first part of the paper describes the most favorable and
pragmatic approach for offline handwriting sample collection. The second part stresses the importance of data collection under uncontrolled conditions. Furthermore, this paper calls
for exploring the possibilities of using forensic datasets to further develop automated systems.
III. METHOD
Two categories capturing a person’s handwriting can be distinguished, namely, offline and online. The online modality is discussed here very shortly, because this data is not available to the forensic handwriting examiner. It is useful for biometric identification and finding the new features or feature combinations that are most discriminative. Handwriting examiners will in particular be interest in offline systems and therefore offline data acquisition is described more in detail.
A. Online data
Online data collection requires an electronic writing tablet and recording software. Most often WACOM tablets are used to collect handwriting samples, but since pen-input devices getting more widespread this might change on short term. The online handwriting is captured with an electronic writing tablet and stored digitally in x, y, and z-positions as a function of time.
B. Offline data
Offline handwriting data is a representation of the handwriting in as a scanned image. It has been demonstrated [7] the FHE’s can infer dynamic information, such as writing velocity and pen pressure, from the static trace. Writing velocity is reflected in line quality, pen pressure differences and blunt beginnings and endings of stroke. The pen pressure is not useful for the examiner as an absolute measure, since it is not only writer specific but strongly depends on extrinsic factors. It is only writer specific if other conditions such as writing surface and writer instrument are constant. The indentation of the paper shows the handwriting examiner if the ink was deposited by a natural course of writing or by forced writing.
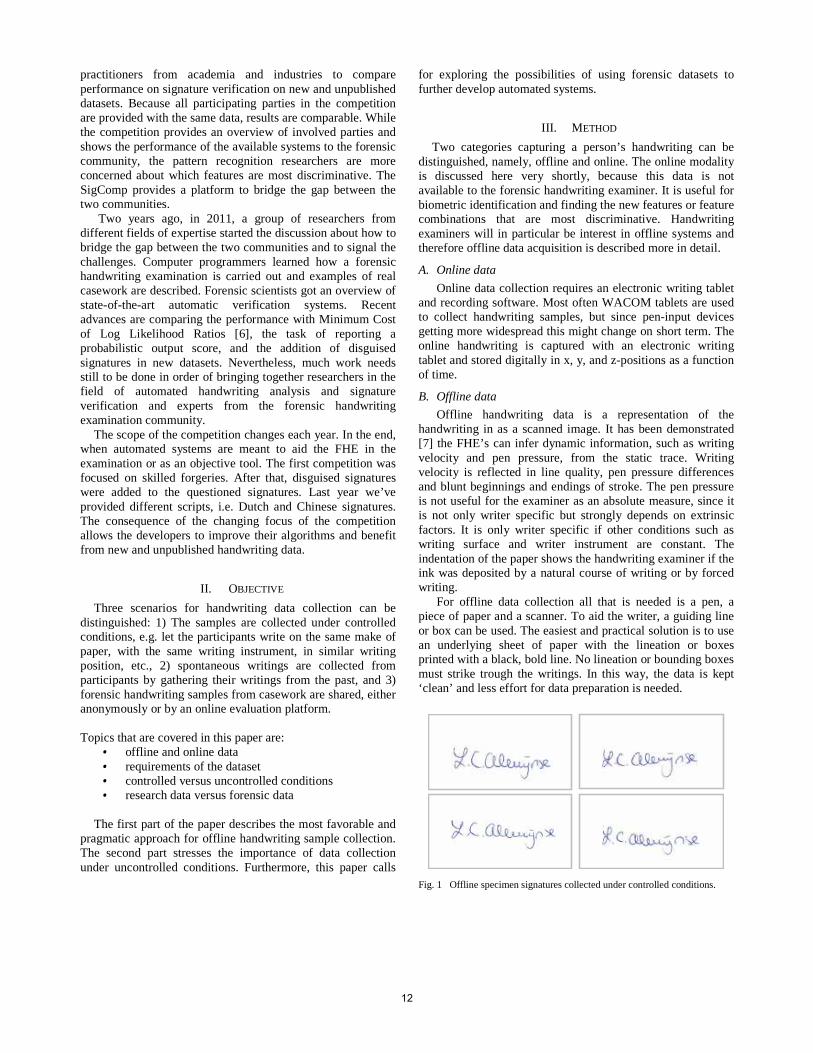
For offline data collection all that is needed is a pen, a piece of paper and a scanner. To aid the writer, a guiding line or box can be used. The easiest and practical solution is to use an underlying sheet of paper with the lineation or boxes printed with a black, bold line. No lineation or bounding boxes must strike trough the writings. In this way, the data is kept ‘clean’ and less effort for data preparation is needed.
Fig. 1 Offline specimen signatures collected under controlled conditions.
12

C. Data requirements
The requirements for a high-quality offline dataset of handwritten samples are summed up below. A formal data collection process is necessary as it ensures that gathered data are both defined and accurate and that decisions based on arguments embodied in the findings are valid [7].
The first list proposed shows which requirements of the dataset are advised for training and evaluating automated systems. Additionally there is a list of extra requirements which are important for forensic handwriting researchers. The summed information is necessary for forensic handwriting examiners to get a better understanding of the data used in experiments. In general, the data must reflect the variation of handwriting in the relevant population, and intra-writer variation must represent reality. Pattern recognition data requirements:
• Substantial number of specimen writers • Substantial number of simulators • High resolution scans of the written samples,
preferably 400 dpi. • Suitable format (PNG format would be preferable.
This lossless format will retain information from images when re-opened and re-saved. The PNG format also creates smaller file size but without the quality loss of a GIF-file)
• Cropping of the image • Assign an identification code as filename • Compatibility with earlier collections
Additional forensic requirements:
• Writer sex, age, handedness, level of education, and profession
• Cultural origin (for signatures) or copybook system (for handwritten text)
• Substantial amount of questioned writing (e.g. half a page of text)
• Substantial amount of reference writing (number of reference signatures or number of lines of text)
• Specification of conditions of forgery and/or disguised
• Time span over which the data was collected
IV. FORENSIC HANDWRITING DATA
A. Collecting existing specimens
One way of acquiring relevant data is to collect existing writings. Such handwriting can consist signatures on agreements, receipts, cheques, passports, etcetera. In short, it can comprise handwriting, which is comparable to the reference material in casework. All factors that are considered by forensic handwriting examiners are in the dataset: natural variation in the writings, different surfaces, different writing instruments, different time period and the samples are written under different mental circumstances. Both intrinsic and extrinsic factors are represented. Participants are not
approached to write something, but provide the researcher with their previously written material.
Fig. 2 Examples of collected specimen signatures written under uncontrolled conditions: a) A signature that was written under a declaration form, b) two overlapping signatures with restricted space for signing, c) signature on a receipt that was written in a standing writing position, and d) signature on an ID-document, dating from 5 years ago.
B. Case related data
The best would be using forensic casework data to evaluate and validate automated systems, but legal aspects regarding privacy form an obstacle. One possible solution for sharing forensic samples is to facilitate access at an online evaluation platform. BEAT [8] is a project that is funded by the European Commission, under the Seventh Framework Programme and is offering such an approach. The goal of the project is to propose a framework of standard operational evaluations for biometric technologies. Unfortunately, it is not available for forensic biometrics yet.
Simulated data can be used in the training phase of system development, because the ground truth of the origin is known. The evaluation phase should at least contain case related data. However, the validation of the system should completely be performed with real casework samples.
V. CONCLUSION AND DISCUSSION
Where biometric systems usually have access to high quality and uniform data, in forensic practice the trace under investigation is often characterized by poor quality. This is not represented by the currently existing handwriting databases.
Since input data determines the overall performance of the automated system, a next step in bridging the gap between the pattern recognition community and forensic handwriting examiners should logically involve the use of samples that
a)
b)
c)
d)
13

were written under uncontrolled circumstances. The condition of the dataset has its effect on the systems’ performance on that trace and accordingly influences the strength of the evidence.
REFERENCES
[1] M. Caligiuri and L. Mohammed, “The Neuroscience of Handwriting:
Applications for Forensic Document Examination,” CRC Press, 2012.
[2] S.N. Srihari, S-H Cha, H. Arora, and S. Lee, “Individuality of handwriting”, J Forensic Sci, vol. 47(4), pp. 856—872, 2002.
[3] M. Saks, Authors’ Response in the J Forensic Sci, vol. 48(4), July 2003.
[4] M.E. Durina and M.P. Caligiuri, “The Determination of Authorship from a Homogenous Group of Writers,” Journal of ASUDE, vol. 12, nr. 2, 2010.
[5] M.I. Malik, M. Liwicki, L. Alewijnse, and W. Ohyama, “ICDAR2013 Competitions on Signature Verification and Writer Identification for On- and Offline Skilled Forgeries (SigWiComp2013),” in press.
[6] M. Liwicki et al., “Signature Verification Competition for Online and Offline Skilled Forgeries (SigComp2011),” in Document Analysis and Recognition (ICDAR), 2011 International Conference on, pp. 1480-1484, 2011.
[7] D. Meuwly and R.N.J. Veldhuis, “Forensic biometrics: From two communities to one discipline,” IEEE Conference publications BIOSIG 2012, Darmstadt Germany, pp. 1-12, Sep 2012.
[8] Information available at www.beat-eu.org
14
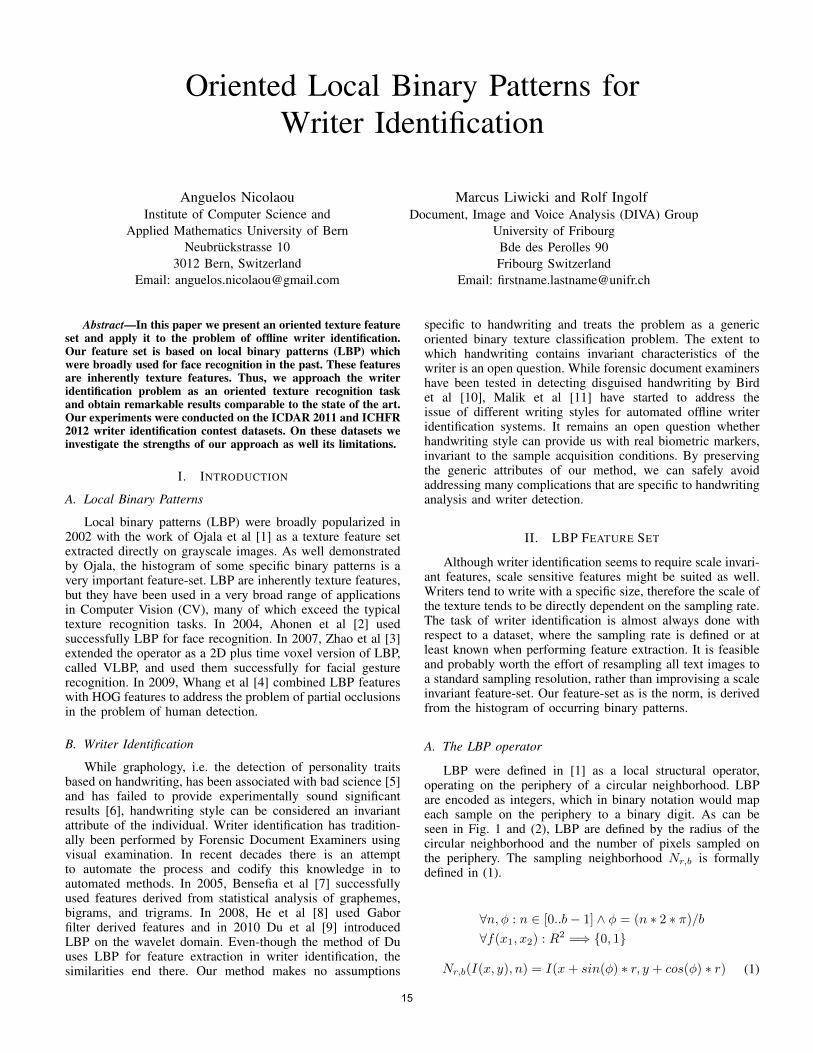
Oriented Local Binary Patterns forWriter Identification
Anguelos NicolaouInstitute of Computer Science and
Applied Mathematics University of BernNeubruckstrasse 10
3012 Bern, SwitzerlandEmail: [email protected]
Marcus Liwicki and Rolf IngolfDocument, Image and Voice Analysis (DIVA) Group
University of FribourgBde des Perolles 90Fribourg Switzerland
Email: [email protected]
Abstract—In this paper we present an oriented texture featureset and apply it to the problem of offline writer identification.Our feature set is based on local binary patterns (LBP) whichwere broadly used for face recognition in the past. These featuresare inherently texture features. Thus, we approach the writeridentification problem as an oriented texture recognition taskand obtain remarkable results comparable to the state of the art.Our experiments were conducted on the ICDAR 2011 and ICHFR2012 writer identification contest datasets. On these datasets weinvestigate the strengths of our approach as well its limitations.
I. INTRODUCTION
A. Local Binary Patterns
Local binary patterns (LBP) were broadly popularized in2002 with the work of Ojala et al [1] as a texture feature setextracted directly on grayscale images. As well demonstratedby Ojala, the histogram of some specific binary patterns is avery important feature-set. LBP are inherently texture features,but they have been used in a very broad range of applicationsin Computer Vision (CV), many of which exceed the typicaltexture recognition tasks. In 2004, Ahonen et al [2] usedsuccessfully LBP for face recognition. In 2007, Zhao et al [3]extended the operator as a 2D plus time voxel version of LBP,called VLBP, and used them successfully for facial gesturerecognition. In 2009, Whang et al [4] combined LBP featureswith HOG features to address the problem of partial occlusionsin the problem of human detection.
B. Writer Identification
While graphology, i.e. the detection of personality traitsbased on handwriting, has been associated with bad science [5]and has failed to provide experimentally sound significantresults [6], handwriting style can be considered an invariantattribute of the individual. Writer identification has tradition-ally been performed by Forensic Document Examiners usingvisual examination. In recent decades there is an attemptto automate the process and codify this knowledge in toautomated methods. In 2005, Bensefia et al [7] successfullyused features derived from statistical analysis of graphemes,bigrams, and trigrams. In 2008, He et al [8] used Gaborfilter derived features and in 2010 Du et al [9] introducedLBP on the wavelet domain. Even-though the method of Duuses LBP for feature extraction in writer identification, thesimilarities end there. Our method makes no assumptions
specific to handwriting and treats the problem as a genericoriented binary texture classification problem. The extent towhich handwriting contains invariant characteristics of thewriter is an open question. While forensic document examinershave been tested in detecting disguised handwriting by Birdet al [10], Malik et al [11] have started to address theissue of different writing styles for automated offline writeridentification systems. It remains an open question whetherhandwriting style can provide us with real biometric markers,invariant to the sample acquisition conditions. By preservingthe generic attributes of our method, we can safely avoidaddressing many complications that are specific to handwritinganalysis and writer detection.
II. LBP FEATURE SET
Although writer identification seems to require scale invari-ant features, scale sensitive features might be suited as well.Writers tend to write with a specific size, therefore the scale ofthe texture tends to be directly dependent on the sampling rate.The task of writer identification is almost always done withrespect to a dataset, where the sampling rate is defined or atleast known when performing feature extraction. It is feasibleand probably worth the effort of resampling all text images toa standard sampling resolution, rather than improvising a scaleinvariant feature-set. Our feature-set as is the norm, is derivedfrom the histogram of occurring binary patterns.
A. The LBP operator
LBP were defined in [1] as a local structural operator,operating on the periphery of a circular neighborhood. LBPare encoded as integers, which in binary notation would mapeach sample on the periphery to a binary digit. As can beseen in Fig. 1 and (2), LBP are defined by the radius of thecircular neighborhood and the number of pixels sampled onthe periphery. The sampling neighborhood Nr,b is formallydefined in (1).
∀n, φ : n ∈ [0..b− 1] ∧ φ = (n ∗ 2 ∗ π)/b∀f(x1, x2) : R2 =⇒ {0, 1}
Nr,b(I(x, y), n) = I(x+ sin(φ) ∗ r, y + cos(φ) ∗ r) (1)
15

(a) (b) (c) (d)
(e) (f) (g) (h)
Fig. 1: Indicative LBP operators: LBP1,4 (a), LBP1,8 (b),LBP1.5,8 (c), LBP2,8(d),LBP2,12 (e), LBP2,16 (f),LBP3,8 (g), LBP3,16 (e). Dark green represents pixelswith 100% contribution, green represents pixels with 50%,light green pixels with 25%, and black is the reference pixel.
LBPr,b,f (x, y) = f(Nr,b(I(x, y), n) ∗ 2n, I(x, y))+f(Nr,b(I(x, y), n− 1) ∗ 2n−1), I(x, y)) + ...
...+ f(Nr,b(I(x, y), 0) ∗ 20, I(x, y))(2)
When defined on grayscale images, LBP are obtained bythresholding each pixel on the periphery by the central pixel.Because we worked on binary images as input, a lot moreoperations than greater or equal (thresholding) were possibleas a binary operation. We generalized our definition of the LBPin (2), to consider the boolean operator marked as f a thirddefining characteristic of the LBP operator LBPr,b,f alongwith the radius r and the number of samples b.
We took into account several factors for selecting theappropriate LBP binary operator. In what concerns the bitcount, a bit-count of 8 presents us with many benefits. Im-plementation wise, the LBP transform is an image that usesone byte per pixel. Its histogram has 256 bins providinga high feature-vector dimentionality and good discriminativeproperties. Additionally, containing the distinct LBP count to256, guaranties highly representative sampling in relativelysmall surfaces of text.
B. The LBP function
While LBP are traditionally derived from grayscale images,when dealing with text, its better to use binarized text imagesas input, thus avoiding all information coming from the textbackground. We considered many different binary operationsand chose the binary operator ”equals” (3) as f() in (2 ).
f(xceter, xperiphery) =
{1 : xceter = xperiphery0 : xceter 6= xperiphery
(3)
”Equals” as a boolean function on an image means true for anybackground pixel in the peripheral neighborhood of a back-ground pixel, true for any foreground pixel in the peripheralneighborhood of a foreground pixel, and false for everythingelse. When using the ”equals” function as the binary functionin a 8 bit-count LBP, all pixels with only foreground and
(a)
(b)
Fig. 2: LBP edge patterns. In (a) the top-edge contributingpatterns and in (b) the top-left edge contributing patterns canbe seen. Contribution: black 100%, dark gray 50%, gray 25%,and light gray 12.5%
only background have an LBP value of 255. By suppressing(ignoring) the 255 bin, we make the LBP histogram surfaceinvariant. All occurrences left in the histogram represent thepixels in the border between foreground and background. Thecore of the feature set comprises of the 255 histogram binsnormalized to a sum of 1. This normalization renders thefeatures derived from the histogram invariant to the numberof signal pixels in the image.
C. Redundant Features
Having the normalized 255 bins from the histogram asthe core of the feature set, we calculate some redundantfeatures that will amplify some aspects of the LBP we considersignificant in the writer identification task. Our goal is to havea feature-set discriminative enough to work well with naiveclassifiers such as nearest neighbor or, even more, classifywriters by clustering the samples without any training.
The first redundant feature group we use, is edge participa-tion. We consider each pattern to have a specific probability ofbelonging to an edge of a specific orientation; from now on wecall that contribution. The sum of the number of occurrencesof each pattern, multiplied by its contribution factor makes upthe oriented edge occurrences. In Fig. 2a all top-edge patternscan be seen along with their probability, in 2b we can see thepatterns of the top-left-edge patterns and their probabilitieswhich are derived from the top-edge patterns by rotating themcounter-clock-wise. By rotating the contributing patterns ofthe top-edge, we can obtain the contributing patterns of alleight edge-orientations. We also add the more general edge-orientations: horizontal, vertical, ascending, and descending asseparate features which are calculated as the sum of the respec-tive pair of edge-orientations. In the end we calculate the twofinal aggregations of perpendicular and diagonal, which are thesum of horizontal and vertical and respectively ascending anddescending. In total we obtain 14 edge-features, which we thennormalize to a sum of 1. One of our aims when introducingthese redundant features is to enhance characteristics that havebeen associated with writer identification such as text slant.
The second redundant feature-group we implemented arethe rotation invariant hashes. We grouped all patterns, sothat each pattern in a group can be transformed in to anyother pattern in that group by rotating. When having an 8sample LBP, the distinct rotation invariant patterns are 36in total [1]. Some pattern groups contain only one patterneg. pattern 0, while other groups contain up to 8 patterns,such as all one bit true patterns 1,2,4,8,16,32,64,128. We
16

took the number of occurrences for each group in the inputimage and normalized them to a sum of 1, thus providing36 rotation invariant features. A complementary feature-groupto the rotation invariant patterns is what we named rotationphase. For each group of rotation invariant features, we tookthe minimum, with respect to the numeric value, pattern inthe group and designated it as group-hash. The number ofclockwise rotations each pattern needs to become its groups-hash, is what we call the rotation phase. By definition, thedistinct phases in an LBP image, are as many as the numberof samples of the LBP. The frequency of all phases normalizedto the sum of 1, provides us with 8 more redundant featuresthat are complementary to the rotation invariant hashes.
A third group of redundant features we introduced to ourfeature-set is what we called beta-function as defined in (4)along with the bit-count of every pattern.
∀n ∈ [1..bitcount]
∀lbp ∈ [0..2bitcount−1]
d(lbp, n) =
{1 : bit n is set in lbp∧
bit n− 1 is not set in lbp0 : otherwise
β(lbp) =∑n
d(lbp, n)
(4)
When the sample count is 8, the β function, has up to 5 distinctvalues. The histogram of the β function (5 bins) normalized toa sum of 1 and the histogram of the bit-count of every patternnormalized to 1 as well, are the last redundant feature-groupwe defined. The β function becomes an important feature whenthe LBP radius is greater than pen stroke thickness. In thosesituations, e.g. a β count of one, would indicate the endingof a line, and a β count of three or four would indicate linescrossing.
If we put it all together, we have 255 bins of the histogram,plus 36 rotation invariant features, plus 8 rotation phasefeatures, plus 14 edge-features, plus 5 β function features, plus9 sample-count features, makes a total of 327 features; theseare the proposed feature-set. The redundant features make thefeatures well suited for naive classifiers. By setting the 255histogram bin to 0, the feature set ignores all non signal areasin the image. The normalization of all bins to a sum of 1, aswell as the nullification of the last bin, renders our feature setinvariant with respect to non signal areas (white).
D. The Classifier
Once we transform a given set of images into featurevectors, we can either use them as a nearest neighbor classifieror perform clustering on them. While clustering seems to bea more generic approach, it is constrained by the need toprocess all samples at the same time. Such a constraint makesthe clustering approach very well suited for research purposesbut hard to match any real world scenarios. The constructionof the classifier consists of four steps. In the first step, weextract the image features. In the second step, we rebase thefeatures along the principal components of a given dataset byperforming principal components analysis. This step might, ina very broad sense of the term, be considered training becauseour method acquires information from a given dataset. In thethird step we scale the rebased features by a scaling vector
which was defined by evolutionary optimization on the train-set. The optimization process is also performed on a givendataset and should also be considered as a training stage. Whileit is not required, it makes more sense that both training stepsare performed on the same dataset. The fourth and last stepis to calculate the L1 norm on the scaled and rebased featurevectors. Steps two and three can be combined in to a linearoperation on the feature space and in many aspects should beviewed as a statistically derived heuristic matrix. Our classifier,as was implemented, has two inputs, a subject dataset and areference dataset. The output consists of a table where eachrow refers to a sample in the subject dataset and contains allsamples in the reference dataset ranked by similarity to thespecific sample. When benchmarking classification rates of ourmethod, we can simply run our classifier with an annotateddataset as both object dataset and reference dataset. In thiscase, the first column contains the object sample and thesecond column contains the most similar sample in the datasetother than its self. The rate at which the classes in the firstcolumn agree to the classes in second column, is the nearestneighbor classification rate.
E. Scale Vector Optimisation
Describing in detail the optimization process of the scalingvector would go beyond the scope of this paper. In briefwe optimized using an evolutionary algorithm. We used asinput the 125 most prominent components of the featuresand the id of the writer of each sample. We optimized usingthe ICHFR 2012 writer identification competition dataset [13]which contains 100 writers contributing 4 writing sampleseach. Individuals of the algorithm were modeled as vectorof continuous scaling factors for each feature in the featurespace. The fitness function was based on the classification ratea nearest neighbor classifier obtains when the feature spaceis scaled by each individual. The stoping criteria was set to2000 generations, and each generation had 20 individuals.Suitable parents were determined by the rank they obtainedin the generation.
III. EXPERIMENTAL PROCEDURE
In order to have a proper understanding of our methodsperformance, its robustness, and its limitations, we conducteda series of experiments. We used two datasets for our experi-ments: the dataset from the ICDAR 2011 writer identificationcontest [12], hereafter 2011 dataset and the dataset from theICHFR 2012 writer identification challenge [13], hereafter2012 dataset. The 2011 dataset has 26 writers contributingsamples in Greek, English, German, and French with 8 samplesper writer. The 2012 dataset has 100 writers, contributingsamples in Greek and English with 4 samples per writer.While the 2011 dataset was given as the train set for the 2012contest, we used them in the opposite manner. In order toavoid overfitting during the optimization step, we deemed the”harder” dataset, containing more classes and less samples perclass, was better suited for training.
A. Performance
As previously described, our method consist of four stages:feature extraction, principal components analysis, scaling vec-tor optimization, and L1 distance estimation. Steps two and
17
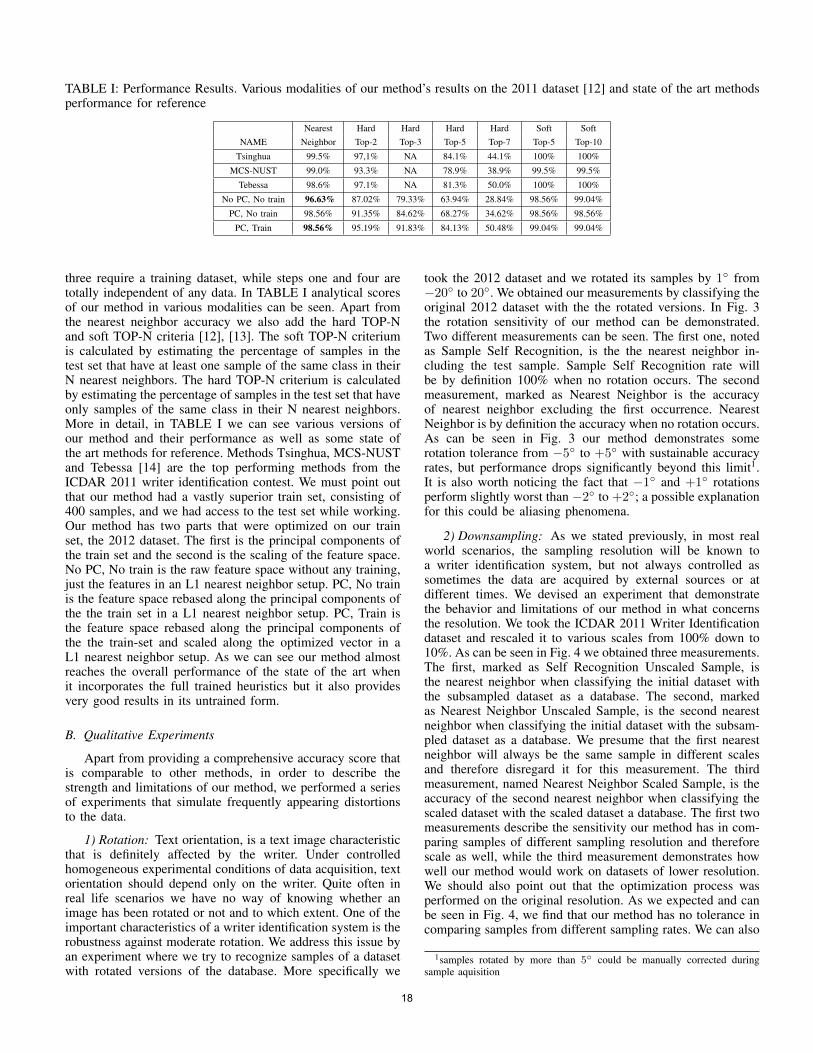
TABLE I: Performance Results. Various modalities of our method’s results on the 2011 dataset [12] and state of the art methodsperformance for reference
Nearest Hard Hard Hard Hard Soft SoftNAME Neighbor Top-2 Top-3 Top-5 Top-7 Top-5 Top-10
Tsinghua 99.5% 97,1% NA 84.1% 44.1% 100% 100%
MCS-NUST 99.0% 93.3% NA 78.9% 38.9% 99.5% 99.5%
Tebessa 98.6% 97.1% NA 81.3% 50.0% 100% 100%
No PC, No train 96.63% 87.02% 79.33% 63.94% 28.84% 98.56% 99.04%
PC, No train 98.56% 91.35% 84.62% 68.27% 34.62% 98.56% 98.56%
PC, Train 98.56% 95.19% 91.83% 84.13% 50.48% 99.04% 99.04%
three require a training dataset, while steps one and four aretotally independent of any data. In TABLE I analytical scoresof our method in various modalities can be seen. Apart fromthe nearest neighbor accuracy we also add the hard TOP-Nand soft TOP-N criteria [12], [13]. The soft TOP-N criteriumis calculated by estimating the percentage of samples in thetest set that have at least one sample of the same class in theirN nearest neighbors. The hard TOP-N criterium is calculatedby estimating the percentage of samples in the test set that haveonly samples of the same class in their N nearest neighbors.More in detail, in TABLE I we can see various versions ofour method and their performance as well as some state ofthe art methods for reference. Methods Tsinghua, MCS-NUSTand Tebessa [14] are the top performing methods from theICDAR 2011 writer identification contest. We must point outthat our method had a vastly superior train set, consisting of400 samples, and we had access to the test set while working.Our method has two parts that were optimized on our trainset, the 2012 dataset. The first is the principal components ofthe train set and the second is the scaling of the feature space.No PC, No train is the raw feature space without any training,just the features in an L1 nearest neighbor setup. PC, No trainis the feature space rebased along the principal components ofthe the train set in a L1 nearest neighbor setup. PC, Train isthe feature space rebased along the principal components ofthe the train-set and scaled along the optimized vector in aL1 nearest neighbor setup. As we can see our method almostreaches the overall performance of the state of the art whenit incorporates the full trained heuristics but it also providesvery good results in its untrained form.
B. Qualitative Experiments
Apart from providing a comprehensive accuracy score thatis comparable to other methods, in order to describe thestrength and limitations of our method, we performed a seriesof experiments that simulate frequently appearing distortionsto the data.
1) Rotation: Text orientation, is a text image characteristicthat is definitely affected by the writer. Under controlledhomogeneous experimental conditions of data acquisition, textorientation should depend only on the writer. Quite often inreal life scenarios we have no way of knowing whether animage has been rotated or not and to which extent. One of theimportant characteristics of a writer identification system is therobustness against moderate rotation. We address this issue byan experiment where we try to recognize samples of a datasetwith rotated versions of the database. More specifically we
took the 2012 dataset and we rotated its samples by 1◦ from−20◦ to 20◦. We obtained our measurements by classifying theoriginal 2012 dataset with the the rotated versions. In Fig. 3the rotation sensitivity of our method can be demonstrated.Two different measurements can be seen. The first one, notedas Sample Self Recognition, is the the nearest neighbor in-cluding the test sample. Sample Self Recognition rate willbe by definition 100% when no rotation occurs. The secondmeasurement, marked as Nearest Neighbor is the accuracyof nearest neighbor excluding the first occurrence. NearestNeighbor is by definition the accuracy when no rotation occurs.As can be seen in Fig. 3 our method demonstrates somerotation tolerance from −5◦ to +5◦ with sustainable accuracyrates, but performance drops significantly beyond this limit1.It is also worth noticing the fact that −1◦ and +1◦ rotationsperform slightly worst than −2◦ to +2◦; a possible explanationfor this could be aliasing phenomena.
2) Downsampling: As we stated previously, in most realworld scenarios, the sampling resolution will be known toa writer identification system, but not always controlled assometimes the data are acquired by external sources or atdifferent times. We devised an experiment that demonstratethe behavior and limitations of our method in what concernsthe resolution. We took the ICDAR 2011 Writer Identificationdataset and rescaled it to various scales from 100% down to10%. As can be seen in Fig. 4 we obtained three measurements.The first, marked as Self Recognition Unscaled Sample, isthe nearest neighbor when classifying the initial dataset withthe subsampled dataset as a database. The second, markedas Nearest Neighbor Unscaled Sample, is the second nearestneighbor when classifying the initial dataset with the subsam-pled dataset as a database. We presume that the first nearestneighbor will always be the same sample in different scalesand therefore disregard it for this measurement. The thirdmeasurement, named Nearest Neighbor Scaled Sample, is theaccuracy of the second nearest neighbor when classifying thescaled dataset with the scaled dataset a database. The first twomeasurements describe the sensitivity our method has in com-paring samples of different sampling resolution and thereforescale as well, while the third measurement demonstrates howwell our method would work on datasets of lower resolution.We should also point out that the optimization process wasperformed on the original resolution. As we expected and canbe seen in Fig. 4, we find that our method has no tolerance incomparing samples from different sampling rates. We can also
1samples rotated by more than 5◦ could be manually corrected duringsample aquisition
18
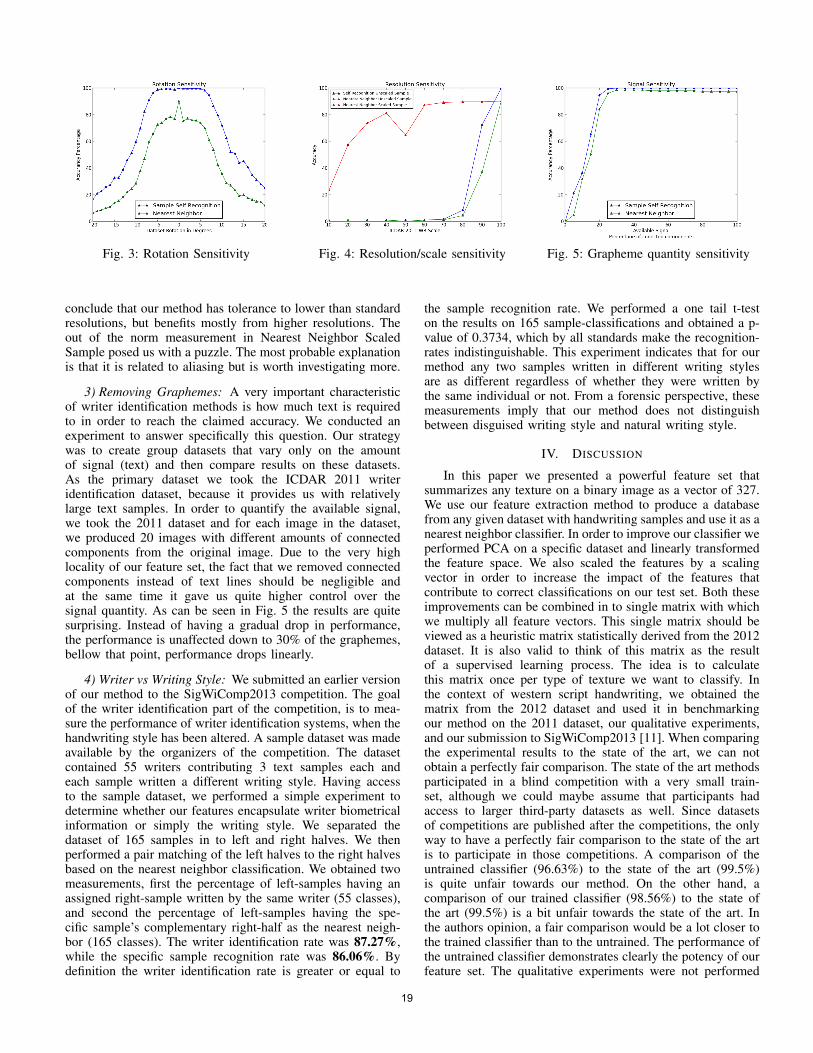
Fig. 3: Rotation Sensitivity Fig. 4: Resolution/scale sensitivity Fig. 5: Grapheme quantity sensitivity
conclude that our method has tolerance to lower than standardresolutions, but benefits mostly from higher resolutions. Theout of the norm measurement in Nearest Neighbor ScaledSample posed us with a puzzle. The most probable explanationis that it is related to aliasing but is worth investigating more.
3) Removing Graphemes: A very important characteristicof writer identification methods is how much text is requiredto in order to reach the claimed accuracy. We conducted anexperiment to answer specifically this question. Our strategywas to create group datasets that vary only on the amountof signal (text) and then compare results on these datasets.As the primary dataset we took the ICDAR 2011 writeridentification dataset, because it provides us with relativelylarge text samples. In order to quantify the available signal,we took the 2011 dataset and for each image in the dataset,we produced 20 images with different amounts of connectedcomponents from the original image. Due to the very highlocality of our feature set, the fact that we removed connectedcomponents instead of text lines should be negligible andat the same time it gave us quite higher control over thesignal quantity. As can be seen in Fig. 5 the results are quitesurprising. Instead of having a gradual drop in performance,the performance is unaffected down to 30% of the graphemes,bellow that point, performance drops linearly.
4) Writer vs Writing Style: We submitted an earlier versionof our method to the SigWiComp2013 competition. The goalof the writer identification part of the competition, is to mea-sure the performance of writer identification systems, when thehandwriting style has been altered. A sample dataset was madeavailable by the organizers of the competition. The datasetcontained 55 writers contributing 3 text samples each andeach sample written a different writing style. Having accessto the sample dataset, we performed a simple experiment todetermine whether our features encapsulate writer biometricalinformation or simply the writing style. We separated thedataset of 165 samples in to left and right halves. We thenperformed a pair matching of the left halves to the right halvesbased on the nearest neighbor classification. We obtained twomeasurements, first the percentage of left-samples having anassigned right-sample written by the same writer (55 classes),and second the percentage of left-samples having the spe-cific sample’s complementary right-half as the nearest neigh-bor (165 classes). The writer identification rate was 87.27%,while the specific sample recognition rate was 86.06%. Bydefinition the writer identification rate is greater or equal to
the sample recognition rate. We performed a one tail t-teston the results on 165 sample-classifications and obtained a p-value of 0.3734, which by all standards make the recognition-rates indistinguishable. This experiment indicates that for ourmethod any two samples written in different writing stylesare as different regardless of whether they were written bythe same individual or not. From a forensic perspective, thesemeasurements imply that our method does not distinguishbetween disguised writing style and natural writing style.
IV. DISCUSSION
In this paper we presented a powerful feature set thatsummarizes any texture on a binary image as a vector of 327.We use our feature extraction method to produce a databasefrom any given dataset with handwriting samples and use it as anearest neighbor classifier. In order to improve our classifier weperformed PCA on a specific dataset and linearly transformedthe feature space. We also scaled the features by a scalingvector in order to increase the impact of the features thatcontribute to correct classifications on our test set. Both theseimprovements can be combined in to single matrix with whichwe multiply all feature vectors. This single matrix should beviewed as a heuristic matrix statistically derived from the 2012dataset. It is also valid to think of this matrix as the resultof a supervised learning process. The idea is to calculatethis matrix once per type of texture we want to classify. Inthe context of western script handwriting, we obtained thematrix from the 2012 dataset and used it in benchmarkingour method on the 2011 dataset, our qualitative experiments,and our submission to SigWiComp2013 [11]. When comparingthe experimental results to the state of the art, we can notobtain a perfectly fair comparison. The state of the art methodsparticipated in a blind competition with a very small train-set, although we could maybe assume that participants hadaccess to larger third-party datasets as well. Since datasetsof competitions are published after the competitions, the onlyway to have a perfectly fair comparison to the state of the artis to participate in those competitions. A comparison of theuntrained classifier (96.63%) to the state of the art (99.5%)is quite unfair towards our method. On the other hand, acomparison of our trained classifier (98.56%) to the state ofthe art (99.5%) is a bit unfair towards the state of the art. Inthe authors opinion, a fair comparison would be a lot closer tothe trained classifier than to the untrained. The performance ofthe untrained classifier demonstrates clearly the potency of ourfeature set. The qualitative experiments were not performed
19

with forensics in mind, except for the last one, writer vswriting style. In writer vs writing style we tried to determinethe extent to which our feature set can deal with disguisingwriters; the quick answer is, no our method can not deal withdisguising writers. There are many subtleties in the conclusionsthat can be drawn from the writer vs writing style experimentabout what phenomena is that our features model. One couldeven say that our method is more about texture similarity thanabout writer similarity; assuming there are biometric featuresin handwriting, the proposed feature set does not seem toencapsulate them. From a software engineering perspective theapproach of treating writer identification as a distance metricinstead of a classifier [12] seems more efficient and modular, itallows for simplification and standardization of benchmarking.The fact that the proposed features encapsulate no structuralinformation what so ever, makes them a very good candidatefor fusion with other feature sets.
ACKNOWLEDGMENT
The first author of this paper would like to thank GeorgiosLouloudis for his precious insights on the subject of writeridentification and performance evaluation. The first authorwould also like to thank Muhammad Imran Malik for hiseffort and assistance in the participation of this method onthe SigWiComp2013 competition.
REFERENCES
[1] T. Ojala, M. Pietikainen, and T. Maenpaa, “Multiresolution gray-scaleand rotation invariant texture classification with local binary patterns,”Pattern Analysis and Machine Intelligence, IEEE Transactions on,vol. 24, no. 7, pp. 971–987, 2002.
[2] T. Ahonen, A. Hadid, and M. Pietikainen, “Face recognition with localbinary patterns,” in Computer Vision-ECCV 2004. Springer, 2004, pp.469–481.
[3] G. Zhao and M. Pietikainen, “Dynamic texture recognition using localbinary patterns with an application to facial expressions,” PatternAnalysis and Machine Intelligence, IEEE Transactions on, vol. 29, no. 6,pp. 915–928, 2007.
[4] X. Wang, T. X. Han, and S. Yan, “An hog-lbp human detector withpartial occlusion handling,” in Computer Vision, 2009 IEEE 12thInternational Conference on. IEEE, 2009, pp. 32–39.
[5] G. A. Dean, I. W. Kelly, D. H. Saklofske, and A. Furnham, “Graphologyand human judgment.” 1992.
[6] A. Furnham, “Write and wrong: The validity of graphological analysis,”The Hundreth Monkey and Other Paradigms of the Paranormal, pp.200–205, 1991.
[7] A. Bensefia, T. Paquet, and L. Heutte, “Handwritten document analysisfor automatic writer recognition,” Electronic letters on computer visionand image analysis, vol. 5, no. 2, pp. 72–86, 2005.
[8] Z. He, X. You, and Y. Y. Tang, “Writer identification of chinesehandwriting documents using hidden markov tree model,” PatternRecognition, vol. 41, no. 4, pp. 1295 – 1307, 2008. [Online]. Available:http://www.sciencedirect.com/science/article/pii/S0031320307004037
[9] L. Du, X. You, H. Xu, Z. Gao, and Y. Tang, “Wavelet domain localbinary pattern features for writer identification,” in Pattern Recognition(ICPR), 2010 20th International Conference on. IEEE, 2010, pp. 3691–3694.
[10] C. Bird, B. Found, and D. Rogers, “Forensic document examiners skillin distinguishing between natural and disguised handwriting behaviors,”Journal of forensic sciences, vol. 55, no. 5, pp. 1291–1295, 2010.
[11] M. I. Malik, M. Liwicki, L. Alewijnse, W. Ohyama, M. Blumenstein,and B. Found, “Signature verification and writer identification competi-tions for on- and offline skilled forgeries (sigwicomp2013),” in 12th Int.Conf. on Document Analysis and Recognition, Washigton, DC, USA,2013, p. n.A.
[12] G. Louloudis, N. Stamatopoulos, and B. Gatos, “Icdar 2011 writeridentification contest,” in Document Analysis and Recognition (ICDAR),2011 International Conference on. IEEE, 2011, pp. 1475–1479.
[13] G. Louloudis, B. Gatos, and N. Stamatopoulos, “Icfhr 2012 com-petition on writer identification challenge 1: Latin/greek documents,”in Frontiers in Handwriting Recognition (ICFHR), 2012 InternationalConference on. IEEE, 2012, pp. 829–834.
[14] D. Chawki and S.-M. Labiba, “A texture based approach for arabicwriter identification and verification,” in Machine and Web Intelligence(ICMWI), 2010 International Conference on. IEEE, 2010, pp. 115–120.
20

Chinese Handwritten writer identification based onStructure Features and extreme learning machine
Jun TanGuangdong Province Key Laboratory of
Computational ScienceSun Yat-Sen University
GuangZhou,PR China 510275Email: [email protected]
JianHuang LaiSchool of Information andScience and TechnologySun Yat-Sen University
GuangZhou,PR China 510275Email: [email protected]
Wei-Shi ZhengSchool of Information andScience and TechnologySun Yat-Sen University
GuangZhou,PR China 510275Email: [email protected]
Abstract—In this paper,we propose a new approach for writeridentification of Chinese handwritten.In our method, we dealwith writer identification of Chinese handwritten using Chi-nese character structure features(CSF) and extreme learningmachine(ELM).To extract the features embedded in Chinesehandwriting characters, special structures have been exploredaccording to the trait of Chinese handwriting characters,where20 features are extracted from the structures, these featuresconstitute patterns of writer handwriting. We also combinestructure features with extreme learning machine (ELM) as anew scheme for writer recognition, ELM is single hidden layerfeed forward networks (SLFN), which randomly chooses theinput weights and analytically determines the output weightsof SLFN. This algorithm learns much faster than traditionalpopular learning algorithms. Experimental results demonstrateCSF/ELM method can achieve better performance than othertraditional schemes for writer identification.
I. INTRODUCTION
As one of the most important methods in the biometricindividual identification, writer identification has been widelyused in the fields of bank check, forensic, historic docu-ment analysis, archaeology, identifying personality [1], manyapproaches have been developed [2], [3]. According to thedifferent input methods, writer identification is commonlyclassified into on-line and off-line.
Compared with its on-line counterpart, off-line writer identi-fication is a rather challenging problem. Chinese characters areideo graphic in nature[4], Chinese characters can be expressedin at least two common styles, such as in block or in cursive.Inblock style, there is an average of 810 strokes. Meanwhilethere are more strokes in cursive style. According to [5],in Chinese characters, the complication structures are mostlyaffected by multi stokes of each character. Additionally, asshown in Fig.1, the stroke shapes and structures of Chinesecharacters are quite different from those of other languagessuch as English, which makes it more difficult to identifyChinese handwriting [2]. The approaches proposed for Englishhandwriting writer identification is no longer suitable forthe case of Chinese handwritings [6], [7]. In this paper, wepropose Chinese structure feature(CSF) as algorithm of featureextraction and combine CSF with extreme learning machine(ELM) as a new scheme for writer identification.
Fig. 1: Samples of the Chinese and English handwritings
A. Related Work
The process of writer identification consists of three mainparts: preprocessing, feature extraction and identification (ormatching). The feature extraction and matching are the twomajor topics in the literature of writer identification.
Given a free style handwritten document, a preprocessingis often required. Segmentation is an indispensable step inpreprocessing. Some methods have been proposed to segmentcharacters recently [8], we proposed a method for Chinesecharacter segmentation based on nonlinear clustering[9].
Handwriting features except CSF feature[10] others such astexture, edge, contour and character shape have been widelystudied recently. Several researchers [11], [12] proposed totake the handwriting as an image containing special texture,and therefore regarded writer identification as the texture iden-tification. Among them, Zhu [11] adopted 2-D Gabor filteringto extract the texture features, while Chen et al. [12] used theFourier transform. Xu and Ding[13] proposed a histogram-based feature to identify writer, called grid microstructurefeature which is extracted from the edge image of the scannedimages.
In [10], we propose a method for extracting Chinese struc-ture features(CSF). Despite good performance, one seriousdrawback is that, it only compare one by one sample usingalgorithm of Similarity Matching, and it cannot classify multi-samples to different writer class. Several classifier methodshave been developed to overcome the problem.
21

Once discriminant features have been extracted, they aresubmitted to a classifier whose task is to identify writer thatthey represent. The widely used classifiers at least includeWeighted Euclidean Distance(WED) classifier [2], [11], [12],Bayesian model,BP neural networks [3], likelihood ranking[14], SVM[15]. For matching singleton non-sequential fea-tures such as texture, edge and contour, Weighted EuclideanDistance (WED) has been shown to be effective by the exper-iments. In [3], both Bayesian classifiers and neural networkswere used as the classifiers. Imdad [15] use Steered HermiteFeatures to identify writer from a written document, andthe algorithm takes Support Vector Machine for training andtesting.
The traditional algorithms for this issue such as back-propagation (BP) need many iterative steps to calculate theoptimal values of the input weights and the output weights, sotheir speeds are very slow in general. ELM [16] is an efficientand practical learning mechanism for the single-hidden-layerfeed-forward neural networks. ELM[17] can learn the inputweights and the output weights by directly calculating theMoore−Penrose generalized inverse matrix of the hidden layeroutput matrix of the neural network instead of using theiterative steps. So, it is necessary to perform efficient featuresextraction on the one hand, and to take steps to reduce thetraining/testing time on the other hand[18]. ELM is an efficientalgorithm which tends to reach the smallest training error,obtain smallest norm of weights, produce best generalizationperformance, and runs faster than the iterative algorithms[19].
The rest of the paper is organized as follows. In Sect. II,we first briefly review algorithms of CSF feature extraction,ELM is briefly explained in Sect.III. Our proposed scheme inSect.IV. We analyze the experimental results in Sect.V. Finally,the conclusion is given in Sect. VI.
II. CHINESE STRUCTURE FEATURES(CSF)
Features are directly extracted from each single character.Since the stroke shapes and structures of Chinese charactersare quite different from those of other languages such asEnglish, where the handwriting characteristics are embedded,we propose to utilize the stroke shapes and structures forhandwriting identification.
Through a number of experiments, we discover that thediscriminatory handwriting characteristics lie in the twostructures[10]. They are the bounding rectangle and a specialquadrilateral which we call TBLR quadrilateral, as shown inFig.2(a) and Fig.2(b) respectively.
The following nine Chinese Structure features(CSF) areobtained from the bounding rectangle as shown in Table I. F1:The ratio of the width to the height of the bounding rectangleA; F2, F3: The relative horizontal and vertical positions of thegravity center; F4, F5: The relative horizontal and verticalgravity centers; F6, F7 : The distance between the gravitycenter G1(x1, y1)and the geometric centerG2(x2, y2), and theslope of the line connecting them; F8: The ratio of theforeground pixel number to the area of the bounding rectangle;F9: The stroke width property,where Pt is the binary pixel
Fig. 2: Two special structures of Chinese handwritingcharacter. (a) Bounding rectangle. (b) TBLR quadrilateral.
TABLE I: CSF feature from the bounding rectangleith Eqs. Comments1 Aw/Ah Aw andAh are the width and height of A.
2∑Aw
i=1 i×Px(i)∑Awi=1 Px(i)
Foreground pixel number i−th verticalPx(i)
3∑Ah
j=1 j×Py(j)∑Ahj=1 Py(j)
Foreground pixel number j−th horizontalPy(i)
4 F2/Aw F2 is 2th CSF feature5 F3/Ah F3 is 3th CSF feature6 ∥G1−G2∥ Gravity center G1(x1, y1)7 (y2 − y1)/(x2 − x1) Geometric centerG2(x2, y2)
8∑Aw
i=1
∑Ahj=1 ×P (i,j)
Aw×AhForeground pixel number P (i, j)
9∑Aw
i=1
∑Ahj=1 ×P (i,j)∑Aw
i=1
∑Ahj=1 ×Pt(i,j)
Binary pixel after refiningPt(i, j)
after refining the preprocessed image A. Given a structuringelement B = {C,D} consisting of two elements C and D, therefining operation keeps repeating the hit-or-miss operation,
A~B = (AΘC)− (A⊕ D) (1)
until convergence, i.e., the change stops.Similarly, from the TBLR quadrilateral, we can obtain the
following seven CSF features as shown in Table II. F10 : Theratio of the area of the top half part Supto the area of thewhole quadrilateral S ; F11 : The ratio of the area of theleft half part Sleft to S ; F12 : The cosine of the angle ofthe two diagonal lines,wherea and b are the direction vectorsof the two diagonal lines respectively. TheF10, F11, F12measure the global spatial structure of the character. F13 : Theratio of foreground pixel number Pinner within the TBLRquadrilateral to the total foreground pixel number Ptotal . It
TABLE II: CSF features from the TBLR quadrilateralith Eqs. Comments10 Sup/S Sup is the area of the top half part.11 Sleft/S Sleft is the area of left half part.12 cos(a, b) a and b are the direction vectors of diagonal13 Pinner/Ptotal Foreground pixel number Pinner
14 Pinner/STBLR Area of the TBLR quadrilateral STBLR
15 Pleft/Ptotal Foreground pixel number of left half part Pleft
16 Ptop/Ptotal Foreground pixel number of top half part Ptop
22

measures the global degree of stroke aggregation. F14 : Theratio of the Pinner to the area of the TBLR quadrilateralSTBLR; F15: The ratio of foreground pixel number of theleft half part Pleft within the TBLR quadrilateral to Ptotal;F16 : The ratio of foreground pixel number of the top halfpart Ptop within the TBLR quadrilateral to Ptotal.
Apart from the above sixteen features, we obtain anotherfour CSF features as follows:F17 : The number of connected components. This feature
measures the joined-up writing habit. F18 : The numberof hole within the character. F19 : The number of strokesegments. It can be obtained by deleting all crossing point of acharacter, and the number is the total segment number. F20 :The ratio of the longest stroke segment to the second longeststroke segment, where the stroke segments are obtained thesame as that of F19 .
III. EXTREME LEARNING MACHINE(ELM)For N arbitrary distinct samples (Xi, Ti), where Xi =
[xi1, xi2, . . . , xin]T ∈ Rnand Ti = [ti1, ti2, . . . , tim]T ∈ Rm,
standard SLFN withN hidden neurons and activation functiong(x) are mathematically modeled as follow:
N∑i=1
βig(Wi ·Xj + bi) = Oj , j = 1, 2, ..., N (2)
where Wi = [wi1, wi2, ..., win]T is the weight vector con-
necting the ith hidden neuron and the input neurons, βi =[βi1, βi2, ..., βim]T is the weight vector connecting the ithhidden neuron and the output neurons, and bi is the thresholdof the ith hidden neuron. The numbers of input and outputneurons are represented using n and m respectively. Wi ·Xj
denotes the inner product of Wi and Xj . The output neuronsare chosen linear in this experiment.
The architecture of ELM classifier is shown in Fig.3. In thetraining procedure, the SLFN with N hidden neurons withactivation function g(x) can approximate these N sampleswith zero error means that
∑Ni=1 ∥oj − tj∥ = 0 i.e., there
existβi,Wiand bi such thatN∑i=1
βig(Wi ·Xj + bi) = tj , j = 1, 2, ..., N (3)
The above N equations can be written compactly as:
Hβ = T (4)
where
H(W1, ...,WN , b1, ..., bN , X1, ..., XN )
=
g(W1 ·X1 + b1) ... g(WN ·X1 + bN )...
......
g(W1 ·XN + b1) ... g(WN ·XN + bN )
N×N
(5)
β =
βT1...
βTN
N×m
and T =
tT1...tTN
N×m
(6)
Fig. 3: The structure of Extreme Learning Machine classifier.
H is called the hidden layer output matrix of the neuralnetwork; the ith column of H is the ith hidden neuron’s outputvector with respect to inputs X1, X2, . . . , XN [16].
If the number of hidden neurons is equal to the number ofdistinct training samples,i.e.N = N , matrix H is square andinvertible, and SLFN can approximate these training sampleswith zero error. However, in most cases the number of hiddenneurons is much less than the number of distinct trainingsamples, N ≪ N , so H is a non square matrix and theremay not exist Wi, bi, βi(i = 1, . . . , N) such that Hβ = T .Thus, one may need to find specific Wi, bi, βi(i = 1, . . . , N)such that
∥H(W1, . . . , WN , b1, . . . , bN )β − T∥= min
Wi,bi,βi
∥H(W1, . . . ,WN , b1, . . . , bN )β − T∥ (7)
the smallest norm least squares solution of the above linearsystem is:
β = H†T (8)
Algorithm ELM: Given a training set ℵ =(xi, ti)|xi ∈ Rn, ti ∈ Rm, i = 1, . . . , N, activation functiong(x) and hidden neuron number N ,
Step 1: Assign arbitrary input weight wi and bias bi, i =1, . . . , N
Step 2: Calculate the hidden layer output matrix H.Step 3: Calculate the output weight β by Eqs.(8),where H and T are defined as Eqs. (5) and (6).
IV. OUR SCHEME
Some of the results in this paper were first presentedin [10]. In this paper, we present more technique detailseffectiveness of CSF/ELM approach. Fig.4 demonstrate theflowchart of the proposed approach. There are three main stepsfor Chinese handwritten writer identification. The first step ishandwritten image preprocessing, which removes noises andnormalizes the images into the same size. The second step isfeature extraction, which finds effective representation of thedifference of writers in handwritten. Instead of using complexfeature extraction methods, we propose Chinese structurefeatures(CSF) for feature extraction. The last step is to applyELM learning method to classify different writers.
23

Fig. 4: The flowchart of the proposed approach.
For example, the entire process of CSF/ELM-based hand-written writer recognition is as follows:
• Step 1: The appropriate training strategy based on theselected training set, we randomly selected from a hand-written database as part of the training set TrainSet =Si, i = 1, ..., N, where N is the total of training samples,and the remaining samples as the test set;
• Step 2: Image pre-processing for training set, through thenoise removal and standardization;
• Step 3: CSF feature extraction method to extract theoptimal recognition feature vector, 20 features are ex-tracted from structures of Bounding Box and TBLRquadrilateral;
• Step 4: ELM train phase, using Algorithm ELM and Eqs.(5)(6)(9), set the input weight parameters arbitrary wi
and bias bi,i = 1, . . . , N randomly, get the hidden layeroutput matrix H and the output weight β, the model oftraining has been trained, the training process is complete;
• Step 5: ELM test phase. Testing the model parametersobtained from the training model, and then we can obtainthe actual output through the test image by the Eqs. (3),to identify the writer.
V. EXPERIMENTS AND ANALYSIS
A. Handwritten Database
To test the performance of the proposed method in thewriter identification, we do some experiments over 2 Chinesehandwritten databases: SYSU [10] and KAIST Hanja1 [20].Among them, SYSU database which was generated and col-lected by ourselves as follows, 245 volunteers were asked tosign his (or her) name and one of the others names twice,and a correction of 950 Chinese characters are obtained. TheKAIST Hanja1 database contains 783 frequently used Chinesecharacters, where each character consisting of 200 samples
written by 200 writers respectively. Fig.5 and Fig.6 showssome samples of the databases.
Fig. 5: Examples of the HanjaDB1 database.
Fig. 6: Examples of the SYSU database.
B. Comparative results
In experiment, because the features may have large differ-ences in value, in order to avoid large values of features tosubmerge the contributions of the small value of features, allsamples were normalized between 0 and 1 before sending tothe learning algorithms as input.
We compare the proposed method with three well-knownmethods including the methods in[11], [12], [13]. Each of thecompared methods is well-adjusted/trained to generate the bestresults. Both the recognition accuracy of writer identificationand average time cost are reported and compared.
Furthermore, learning method is also an important problem.We used learning methods(ELM,BP[3],SVM[15]) for testing,and the average training time and the average test time iscalculated. The cost time of the experiments is shown in tableIII. From the table, we can see that SVM[15] and BP[3]training times are relative much more than the ELM trainingtime,the average total time of ELM, SVM, BP are 1.3001,31.395, 34.801 seconds respectively. Therefore, the method ofELM has the highest speed.
24

TABLE III: Time cost (seconds) of different learningmethods
Average Average AverageMethod training time test time total timeELM 1.412 0.0312 1.3001SVM[15] 32.05 0.063 31.395BP[3] 36.37 0.382 34.801
Finally, we compare our scheme with approaches [11],[12], [13]in the Chinese handwritten database Hanja andSYSU. These approaches use different features and classifiers.method[11] using Gabor feature and WED classifier, GMSFmethod[13] using GMSF feature and Weighted Chi-square,and Fourier feature and Mathematical expectations classifierare for method[12]. In the comparison, Table IV gives theTop-1, Top-5, Top-10 and Top-20 recognition accuracies ofthe four methods. We show the recognition accuracies of thealgorithms on the handwritten database in Table IV. From thetable, we can see the accuracies of our method are higherthan the others. The lowest accuracy of method[12] is 42.7%,and our method has the similar accuracy of method[13]. Itis obvious that our method is more effective for identifyingwriter in Chinese handwriting.
VI. CONCLUSION
In this paper, we list some results of the literatures. Gaborand wavelet features[11] used in the traditional methods ofChinese writer identification are affected greatly by the nor-malization and the arrangement of characters in texture blocks.Differently, CSF feature uses original handwriting images andtries to find out the writing structure of the writer in localregions. The ELM is a classifier used to train a single hiddenlayer neural network. From the experimental results. We cansee that, Table IV includes the performance of our methodand some other methods for Chinese writer identification.The recognition accuracy of our method using the CSF/ELMseems better than the existing methods for Chinese writeridentification. compared with traditional learning algorithm,ELM has faster speed, better generalization performances. Theeffectiveness of CSF/ELM for Chinese writer identification isproved by the experiments.
It is expectable that our approach can be used for multilin-gual handwriting including western handwritings and arabicnumber.
ACKNOWLEDGMENT
This work was supported by Guangdong Provincial Govern-ment of China through the ”Computational Science InnovativeResearch Team” program and Guangdong Province Key Labo-ratory of Computational Science at the Sun Yat-sen University,the Technology Program of GuangDong (2011B061300081).
REFERENCES
[1] S. Impedovo and G. Pirlo. Verification of handwritten signatures: anoverview. In Image Analysis and Processing, 2007. ICIAP 2007. 14thInternational Conference on, pages 191–196. IEEE, 2007.
TABLE IV: Recognition accuracies of different methodsTop1 Top5 Top10 Top20
Method Hanja Sysu Hanja Sysu Hanja Sysu Hanja SysuGabor[11] 54.3 53.2 61.3 64.2 67.2 68.8 72.2 73.9Fourier[12] 42.7 52.3 54.5 61.7 64.8 70.2 72.3 74.5GMSF[13] 74.5 75.4 82.7 83.2 85.6 88.4 87.2 91.4Our 81.3 82.6 86.3 87.5 91.2 92.2 95.4 98.5
[2] Z. He, Y.Y. Tang, and X. You. A contourlet-based method for writeridentification. In Systems, Man and Cybernetics, 2005 IEEE Interna-tional Conference on, volume 1, pages 364–368. IEEE, 2005.
[3] M. Bulacu, L. Schomaker, and L. Vuurpijl. Writer identification usingedge-based directional features. writer, 1:1, 2003.
[4] L. Shan. Passport to chinese: 100 most commonly used chinesecharacters, book 1, 1995.
[5] F.H. Cheng. Multi-stroke relaxation matching method for handwrittenchinese character recognition. Pattern recognition, 31(4):401–410, 1998.
[6] A. Schlapbach and H. Bunke. Off-line handwriting identification usinghmm based recognizers. In Pattern Recognition, 2004. ICPR 2004.Proceedings of the 17th International Conference on, volume 2, pages654–658. IEEE, 2004.
[7] L. Schomaker and L. Vuurpijl. Forensic writer identification: A bench-mark data set and a comparison of two systems [internal report for the{Netherlands Forensic Institute}]. 2000.
[8] L.Y. Tseng and R.C. Chen. Segmenting handwritten chinese charactersbased on heuristic merging of stroke bounding boxes and dynamicprogramming1. Pattern Recognition Letters, 19(10):963–973, 1998.
[9] J. Tan, J.H. Lai, and C.D.; Wang. A new handwritten character segmen-tation method based on nonlinear clustering. NEUROCOMPUTING,89(8):213–219, 2012.
[10] J. Tan, J.H. Lai, C.D. Wang, and M.S. Feng. A stroke shape andstructure based approach for off-line chinese handwriting identification.International Journal of Intelligent Systems and Applications (IJISA),3(2):1, 2011.
[11] Y. Zhu, T. Tan, and Y. Wang. Biometric personal identification basedon handwriting. In Pattern Recognition, 2000. Proceedings. 15thInternational Conference on, volume 2, pages 797–800. IEEE, 2000.
[12] Q. Chen, Y. Yan, W. Deng, and F. Yuan. Handwriting identificationbased on constructing texture. In Intelligent Networks and IntelligentSystems, 2008. ICINIS’08. First International Conference on, pages 523–526. IEEE, 2008.
[13] Lu Xu, Xiaoqing Ding, Liangrui Peng, and Xin Li. An improved methodbased on weighted grid micro-structure feature for text-independentwriter recognition. In Document Analysis and Recognition (ICDAR),2011 International Conference on, pages 638–642. IEEE, 2011.
[14] G. Zhu, Y. Zheng, D. Doermann, and S. Jaeger. Signature detection andmatching for document image retrieval. Pattern Analysis and MachineIntelligence, IEEE Transactions on, 31(11):2015–2031, 2009.
[15] A. Imdad, S. Bres, V. Eglin, H. Emptoz, and C. Rivero-Moreno. Writeridentification using steered hermite features and svm. In DocumentAnalysis and Recognition, 2007. ICDAR 2007. Ninth InternationalConference on, volume 2, pages 839–843. IEEE, 2007.
[16] G.B. Huang, Q.Y. Zhu, and C.K. Siew. Extreme learning machine:theory and applications. Neurocomputing, 70(1):489–501, 2006.
[17] N.Y. Liang, G.B. Huang, P. Saratchandran, and N. Sundararajan. Afast and accurate online sequential learning algorithm for feedforwardnetworks. Neural Networks, IEEE Transactions on, 17(6):1411–1423,2006.
[18] X.Z. Wang and C.R. Dong. Improving generalization of fuzzy if–thenrules by maximizing fuzzy entropy. Fuzzy Systems, IEEE Transactionson, 17(3):556–567, 2009.
[19] G.B. Huang, D.H. Wang, and Y. Lan. Extreme learning machines: asurvey. International Journal of Machine Learning and Cybernetics,2(2):107–122, 2011.
[20] I.J. Kim and J.H. Kim. Statistical character structure modeling andits application to handwritten chinese character recognition. PatternAnalysis and Machine Intelligence, IEEE Transactions on, 25(11):1422–1436, 2003.
25

Dissimilarity Representation for HandwrittenSignature Verification
George S. Eskander, Robert Sabourin, and Eric GrangerLaboratoire d’imagerie, de vision et d’intelligence artificielle
Ecole de technologie superieure, Universite du QuebecMontreal, QC, Canada
Email: [email protected], [email protected], [email protected]
Abstract—Signature verification (SV) systems authenticate in-dividuals, based on their handwritten signatures. The standardapproach for such systems employ feature representations (FR),where features are extracted from the signature signals andclassifiers are designed in the feature space. Performance ofFR-based systems is limited by the quality of employed featurerepresentations and the quantity of training data. The dissim-ilarity representation (DR) approach is recently introduced topattern recognition community, where proximity among patternsconstitute the classification space. Similar concept has beenapplied by forensic Questioned Document Examination (QDE)experts, where proximity between questioned signatures and aset of templates lead to the authentication decision. Recently,few automatic SV systems are proposed to simulate the QDEapproach, by employing DR-based pattern recognition methods.In this paper, we explore different scenarios for employingthe DR approach for replacing and/or enhancing the standardSV systems. A general framework for designing FR/DR basedsystems is proposed, that might guide the signature processingresearch direction to new areas.
I. INTRODUCTION
Signature Verification (SV) systems verify that a signaturesample belongs to a specific writer. Signature signals can beacquired either online or offline. For online systems, signaturedynamics such as velocity, pressure, stroke order, etc., areacquired during the signing process. Special pens and tabletsare employed for the online acquisition task. On the otherhand, for offline systems, signature images are scanned, afterthe signing process. Only static information are extracted fromthe signature images, producing a harder pattern recognitionproblem [1].
Standard SV systems employ feature-based pattern recog-nition approaches. Discriminative features are extracted fromthe signature signals, so that each signature is representedas a vector in the Feature Representation (FR) space. Theclassifiers are then designed in the feature space. Simply,accuracy of such systems relies on to which extend theemployed feature representation is discriminative and stable.Signature representations of different users may have highsimilarities, when features are not discriminative enough. Also,representations of the same writer may differ significantly,when features are not stable. Besides quality of features,enough training data is required to design reliable classifiersin the feature space. The training samples should represent awide range of genuine signatures and possible forgeries, for
all system users. For real world applications, e.g., bankingsystems, the number of users could be very high and thereis a high risk of forgery. The enrolling signature samples,available for designing such systems, are mostly few and nosamples of forgeries are available. With these limitations, itis a challenge to extract informative feature representationsand to design feature-based classifiers, that absorb the intra-personal variabilities while detecting both the forgeries andthe inter-personal similarities.
The Dissimilarity Representation (DR) approach for patternrecognition is recently introduced, by Elzbieta Pekalska andRobert P.W. Duin., [2]. The rational behind this concept is thatmodeling the proximity between objects may be more tractablethan modeling the objects themselves. To this end, dissimi-larity measures are computed and considered as features forclassification. The dissimilarity measures can be derived inmany ways, e.g. from raw (sensor) measurements, histograms,strings or graphs. However, it can also be build on top of afeature representation [3].
In the field of forensic science, similar concept has beenapplied by the Questioned Document Examination (QDE)experts. A questioned handwritten sample is associated to aspecific writer, if it is similar to a set of reference templatesof his handwritings. Degree of similarity is determined bycomparing a set of graphonomic features, extracted from boththe questioned and template samples.
Recently, some automatic SV systems are proposed tosimulate the QDE approach [4]-[7]. Distances between intra-personal training samples are computed and used as intra-classsamples. Similarly, distances between inter-personal trainingsamples are computed and used as inter-class samples. Theproduced distance samples are used to train a single two-classclassifier, that distinguishes between intra-class and inter-classdistances.
The DR approach, besides it enabled automating the foren-sic expert manual tasks, it alleviates some of the limitationsof the FR-based design approach. First, a distance sampleis generated for every pair of the original training samples,so it results in a much higher number of samples. Thisproperty alleviates the shortage of training data required tomodel the signatures. Second, dissimilarities between signa-ture signals maybe more discriminative and stable than thefeature representations. This is why the QDE experts build
26
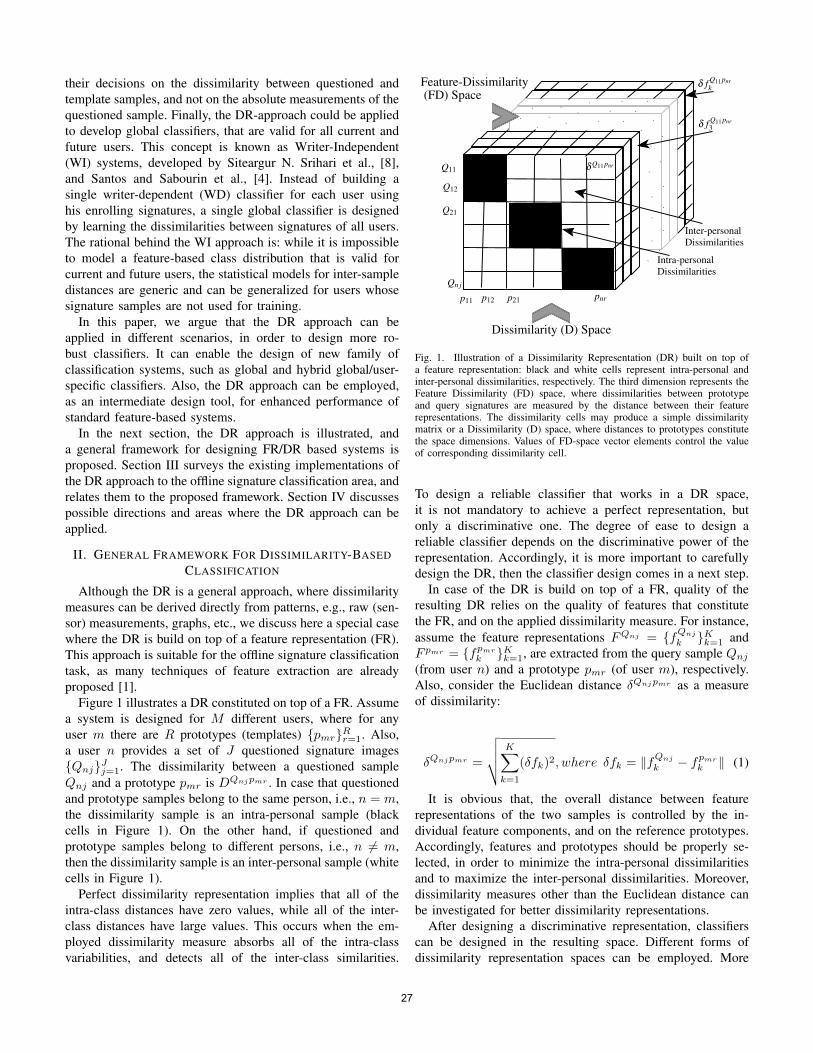
their decisions on the dissimilarity between questioned andtemplate samples, and not on the absolute measurements of thequestioned sample. Finally, the DR-approach could be appliedto develop global classifiers, that are valid for all current andfuture users. This concept is known as Writer-Independent(WI) systems, developed by Siteargur N. Srihari et al., [8],and Santos and Sabourin et al., [4]. Instead of building asingle writer-dependent (WD) classifier for each user usinghis enrolling signatures, a single global classifier is designedby learning the dissimilarities between signatures of all users.The rational behind the WI approach is: while it is impossibleto model a feature-based class distribution that is valid forcurrent and future users, the statistical models for inter-sampledistances are generic and can be generalized for users whosesignature samples are not used for training.
In this paper, we argue that the DR approach can beapplied in different scenarios, in order to design more ro-bust classifiers. It can enable the design of new family ofclassification systems, such as global and hybrid global/user-specific classifiers. Also, the DR approach can be employed,as an intermediate design tool, for enhanced performance ofstandard feature-based systems.
In the next section, the DR approach is illustrated, anda general framework for designing FR/DR based systems isproposed. Section III surveys the existing implementations ofthe DR approach to the offline signature classification area, andrelates them to the proposed framework. Section IV discussespossible directions and areas where the DR approach can beapplied.
II. GENERAL FRAMEWORK FOR DISSIMILARITY-BASEDCLASSIFICATION
Although the DR is a general approach, where dissimilaritymeasures can be derived directly from patterns, e.g., raw (sen-sor) measurements, graphs, etc., we discuss here a special casewhere the DR is build on top of a feature representation (FR).This approach is suitable for the offline signature classificationtask, as many techniques of feature extraction are alreadyproposed [1].
Figure 1 illustrates a DR constituted on top of a FR. Assumea system is designed for M different users, where for anyuser m there are R prototypes (templates) {pmr}Rr=1. Also,a user n provides a set of J questioned signature images{Qnj}Jj=1. The dissimilarity between a questioned sampleQnj and a prototype pmr is DQnjpmr . In case that questionedand prototype samples belong to the same person, i.e., n = m,the dissimilarity sample is an intra-personal sample (blackcells in Figure 1). On the other hand, if questioned andprototype samples belong to different persons, i.e., n 6= m,then the dissimilarity sample is an inter-personal sample (whitecells in Figure 1).
Perfect dissimilarity representation implies that all of theintra-class distances have zero values, while all of the inter-class distances have large values. This occurs when the em-ployed dissimilarity measure absorbs all of the intra-classvariabilities, and detects all of the inter-class similarities.
δ f Q11pnr3
δ Q11pnr
Inter-personalDissimilarities
Intra-personalDissimilarities
Q11
Q12
Q21
Qn j
p11 p12 p21 pnr
Dissimilarity (D) Space
Feature-Dissimilarity(FD) Space
δ f Q11pnrk
Fig. 1. Illustration of a Dissimilarity Representation (DR) built on top ofa feature representation: black and white cells represent intra-personal andinter-personal dissimilarities, respectively. The third dimension represents theFeature Dissimilarity (FD) space, where dissimilarities between prototypeand query signatures are measured by the distance between their featurerepresentations. The dissimilarity cells may produce a simple dissimilaritymatrix or a Dissimilarity (D) space, where distances to prototypes constitutethe space dimensions. Values of FD-space vector elements control the valueof corresponding dissimilarity cell.
To design a reliable classifier that works in a DR space,it is not mandatory to achieve a perfect representation, butonly a discriminative one. The degree of ease to design areliable classifier depends on the discriminative power of therepresentation. Accordingly, it is more important to carefullydesign the DR, then the classifier design comes in a next step.
In case of the DR is build on top of a FR, quality of theresulting DR relies on the quality of features that constitutethe FR, and on the applied dissimilarity measure. For instance,assume the feature representations FQnj = {fQnj
k }Kk=1 andF pmr = {fpmr
k }Kk=1, are extracted from the query sample Qnj
(from user n) and a prototype pmr (of user m), respectively.Also, consider the Euclidean distance δQnjpmr as a measureof dissimilarity:
δQnjpmr =
√√√√ K∑k=1
(δfk)2, where δfk = ‖fQnj
k − fpmr
k ‖ (1)
It is obvious that, the overall distance between featurerepresentations of the two samples is controlled by the in-dividual feature components, and on the reference prototypes.Accordingly, features and prototypes should be properly se-lected, in order to minimize the intra-personal dissimilaritiesand to maximize the inter-personal dissimilarities. Moreover,dissimilarity measures other than the Euclidean distance canbe investigated for better dissimilarity representations.
After designing a discriminative representation, classifierscan be designed in the resulting space. Different forms ofdissimilarity representation spaces can be employed. More
27

Feature Selection
Feature SelectionPrototype Selection
Prototype Selection
Dissimilarity-BasedClassifier
FeatureRepresentation
Feature-BasedClassifier
1
2
3
4
AB C
D
E
F
G
H
I
Q
PR
Fig. 2. General framework for designing classification systems based on the Dissimilarity Representation (DR) approach: Block 1–full FD-space-full D-space,Block 2–reduced FD-space-full D-space, Block 3–full FD-space-reduced D-space, Block 4–reduced FD-space-reduced D-space.
specifically, three different forms of dissimilarity representa-tions (DR) can be constituted:
• Dissimilarity matrix: the matrix of all distances, wherea row Dnj represents distances between a query j thatbelongs to a specific user n, with respect to the prototypesof all users:
Dnj = {δQnjp11 , .., δQnjpmr , .., δQnjpMR}. (2)
where m ∈ [1,M ] and r ∈ [1, R].• Dissimilarity space (D-Space): the dissimilarity matrix is
projected on a space, where each row of the matrix isrepresented as a vector Dnj in this space. By other words,each dimension of the D-space is the distance to a specificprototype.
• Feature-Dissimilarity space (FD-Space): the dissimilaritymatrix is embedded in an Euclidean space, where di-mensions of this space are the dissimilarities of featurevalues. In the FD-space, a vector dQnjpmr , has samedimensionality as that of the original feature space, wheredQnjpmr = {δfQnjpmr
k }Kk=1. The length of a vectordQnjpmr is equivalent to δQnjpmr , given by Eq. 1.
We argue that, classifiers can be designed in any of theaforementioned dissimilarity representation spaces. Moreover,the different tasks for feature selection, prototype selection,and classifiers design, can be done in different spaces, when-ever translation between spaces is possible. This strategypermits applying a massive number of pattern recognitiontechniques, with multiple combinations of space transitions.We propose that new techniques for pattern recognition might
be developed based on this strategy. In this context, the DRapproach is employed either as a tool for enhancing thestandard FR-based systems (for feature/prototype selection),or to design reliable dissimilarity-based classification systems(when classifiers are designed in a DR space).
Figure 2 illustrates a general framework for designingclassification systems based on the DR approach. The standardapproach is to extract feature representations from the trainingsamples, and design classifiers in the feature space (path A inthe Figure). However, the DR approach can be employed indifferent scenarios for either build new family of classifiers inDR-based spaces, or to enhance the performance of standardfeature-based classifiers. More specifically, dissimilarities canbe computed on top of a feature representation, and are usedto constitute different types dissimilarity representations (DR),e.g., dissimilarity matrix, D-space, or FD-space (path B). Theresulting representation could be constituted on top of a hugenumber of feature extractions, and based on large number ofprototypes. The intra-personal (black cells) and inter-personal(white cells) dissimilarities, should be discriminative enoughin order to design a DR-based classifier (path C). In case thatthe DR is not enough informative, feature selection and/orprototype selection can be applied for enhanced representation.For instance, feature selection can be employed in a FD-space(path D). In literature, there are many methodologies of featureselection that can be applied to select the most discriminativeand stable features. The resulting DR is constituted on top ofa sparser feature representation, however, redundancy in pro-totypes may exist (block 2). A classifier can be then designedin the resulting space (path E), or a prototype selection step is
28

done (path F) producing a more compact representation (block4). Surely, classifiers designed in the sparse and compact repre-sentation, are lighter and more accurate (path G). Also, orderof the feature/prototype selection processes can be reversed(see the bottom part of the Figure). It is obvious that, it is morelogical to run the feature selection process in the FD-space,however, the D-space is more suitable for prototype selectiontask. The classifier design process can be implemented basedon different DR (dissimilarity matrix, D-space, or FD-space).
Besides that the DR approach can be employed to designdissimilarity-based classifiers, it can be considered as anintermediate tool for building reliable feature-based classi-fiers. Good features and/or prototypes can be selected in adissimilarity-based space, then the representation is translatedback to a sparser and more informative feature space (dottedpaths, like path H-I). On contrary, FR-based classifiers canbe designed and they are considered as an intermediate tool,to design reliable DR-based classifiers. In such case, multi-classifier systems can be designed, where FR-based classifiersare used to produce the dissimilarity measures, that are neededto build the DR (path P).
III. CURRENT IMPLEMENTATIONS TO OFFLINE SIGNATURESYSTEMS
The first application of the dissimilarity learning to bio-metrics, and more specifically, to the behavioral handwrit-ten biometrics is proposed by Jain, A.K. et al., [10]. Thedissimilarity between handwritten digits is measured by theamount of deformation required to restore a query sample toits stored prototype. This approach is extended to the authoridentification problem by Cha and Srihari [11], where distancestatistics are used for classification. Later, similar concept isapplied to the handwritten signature images. Here we list andcategorize some of these implementations, and relate them tothe proposed framework for DR-based classification shown inFigure 2.
A. Writer-Dependent Systems
The Writer-Dependent (WD) approach seeks to build asingle classifier for each user based on his enrolling signatures.The DR concept is first introduced to design WD-SV systems,by Siteargur N. Srihari et al., [8]. Correlation between highdimensional (1024-bits) binary feature vectors, is employed asa dissimilarity measure. For a specific user, distances amongevery pair of his training samples, are determined to representthe intra-class samples. Also, distances between samples of thespecific user and some forgeries are computed to represent theinter-class samples. The authors tried different classificationstrategies: one-class, two-class, discriminative, and generativeclassifiers. This implementation is a realization of the pathB-C in Figure 2, where classifiers are designed based on thestatistics of the dissimilarity matrix.
Later, Batista et al., [13] applied the dissimilarity learn-ing concept to produce reliable WD-SV systems. A feature-based one-class classifier is built by producing user-specificgenerative models using Hidden Markov models (HMMs).
To increase the system accuracy, a two-class discriminativemodel is build in DR space. The HMMs models are consideredas prototypes, and samples are projected to a D-space byconsidering the likehood to each HMM generative model asa similarity measure. SVM classifies are then designed inthe produced D-space. This implementation is a realizationof the path APC in Figure 2. Also, the authors employedthe AdaBoost method for classifier design in the D-space.This later implementation achieves prototype selection, whilebuilding the classifier, which is a realization of the path APQRin the Figure.
B. Writer-Independent Systems
Instead of building a single writer-dependent (WD) clas-sifier for each user using his enrolling signatures, a singlewriter-independent (WI) classifier is designed by learning thedissimilarities between signatures of all users. This concept isimpossible to realize by means of the standard FR approach.However, it is possible to model the class distributions ofintra-class and inter-class dissimilarities, by employing theDR approach. A single ”global” classifier can be designedto model, or to discriminate between, these classes. If ahuge number of samples are used to build the global DR-based classifier, it is statistically valid that the resulting modelgeneralizes for users whose samples are not included in thetraining set.
The WI concept is proposed by Siteargur N. Srihari et al.,[8], and Santos and Sabourin et al., [4]. While the first groupused the correlation between binary features as a distancemeasure, the second group employed the Euclidean distancebetween graphometric feature vectors. This implementation isa realization of the path BC in Figure 2, where the classifiersare designed in the FD-space. Improved implementation ofthis concept is proposed where different dissimilarity spacesare generated based on different feature representations, andclassification decisions taken in each space are fused to pro-duce the final decision [5], [6]. This scenario can be consideredas generation of different instances for path BC, and fusion isdone in the score or decision levels.
More recently, Rivard et al., [7] extended the idea toperform multiple feature extraction and selection. In this work,information fusion is also performed at the feature level.Multiple graphometric features are extracted based on multiplesize grids. Then, the features are fused and pairwise distancesbetween corresponding features are computed to constitutea high dimensional feature-dissimilarity space, where eachdimension represents dissimilarity of a single feature. Thiscomplex representation is then simplified by applying theboosting feature selection approach (BFS) [12]. A sparser andmore discriminative FD-space is produced by applying BFSwith multi-feature extraction. This scenario can be consideredas realization of path BDE in Figure 2. As the resulting WIclassifier recognizes all users, even the users who are enrolledafter the design phase, so the feature representation embeddedin the WI classifier is considered as a global ”population-based” representation.
29

C. Adaptation of Writer-Independent Systems
Recently, some work is done to combine advantages of bothWI and WD approaches. Eskander et al., [14] extends on thesystem in [7] by adapting the population-based representationto each specific user, with the aim of reducing the classificationcomplexity. While the first WI stage is designed in a FD-space, the following WD stage is designed in a standardfeature space. Accordingly, the final WD classifier is FR-basedclassifier, that avoids storing reference signatures for enhancedsecurity. Simulation results on two real-world offline signaturedatabases (the Brazilian DB and GPDS public DB) confirm thefeasibility and robustness of the proposed approach. Only asingle compact classifier produced similar level of accuracy(Average Error Rate of about 5.38% and 13.96% for theBrazilian and the GPDS databases, respectively) as complexWI and WD systems in literature. This scenario is a realizationof path BDHI in Figure 2.
IV. RESEARCH DIRECTIONS
The aforementioned implementations represent a subset oflarge number of possible FR/DR combinations. Future re-search may investigate the unvisited scenarios of the proposedframework. For instance, combinations of global/user-specific,generative/discriminative, one-class/two-class systems can bedesigned. Also, all of the tasks for feature selection, prototypeselection, classifier design, etc., can be employed in eitherfeature space, dissimilarity matrix, FD-space, and D-space.Selection of the working space for each step, should depend onthe specific requirements and constraints of the design problemand on the application itself. For example, in [14], features areselected in a FD-space as that provides a way to select reliablefeature representations. Then, the classifiers are designed in astandard feature space, to avoid the need for storing signaturetemplates for verification. Besides the large number of possiblecombinations and translations between the different spaces,there is also a wide range of pattern recognition techniquesand tools that can be tested with the proposed framework. Thisincludes different methods for feature extraction and selection,prototype selection, classifiers, etc.
From the application perspective, the proposed frameworkcan be utilized for other applications, rather than the standardSV systems. For example, the Signature Identification (SI)systems that identify a producer of a signature sample, can bedesigned based on the DR-approach. Prototypes of all systemusers can be considered to build a classification D-space.Another example of systems, that imply a challenging designproblem, is the signature-based bio-cryptographic systems. Inthese systems, cryptographic keys of encryption and digitalsignatures, are secured by means of handwritten signatures. Itis a challenging to select informative features, signature proto-type, and system parameters, for encoding reliable signature-based bio-cryptographic systems, based on the standard FRapproach. Instead, recently, we proposed a methodology todesign such systems, by means of the DR approach [15].Features are selected in the FD-space and prototypes areselected in the D-space. Some of the system parameters such
as length of the cryptographic key, are optimized in thedifferent spaces.
V. CONCLUSIONS
In this paper, the dissimilarity approach for pattern recog-nition is considered to design signature verification (SV)systems. A general framework is proposed, for designingclassification system based on a mixture of feature and dis-similarity representations. This framework imparts additionalflexibility to the pattern recognition (PR) area. Combinationsof transitions between different feature and dissimilarity spacesare suggested. Some of the existing implementations to the SVproblem, are surveyed and related to the proposed framework.There are, however, a wide range of methodologies andapplications that might benefit from the proposed approach,that opens a door for new research directions.
ACKNOWLEDGMENT
This work was supported by the Natural Sciences andEngineering Research Council of Canada and BancTec Inc.
REFERENCES
[1] D. Impedovo and G. Pirlo., Automatic signature verification: the state ofthe art. IEEE Transactions on SMC, Part C: Applications and Reviews,vol.38, no.5, pp.609-635,2008.
[2] Elzbieta Pekalska , Robert P.W. Duin. Dissimilarity representations allowfor building good classifiers. PR Letters, vol.23, no.8, pp.161-166, 2002.
[3] Robert P.W. Duin , Marco Loog, Elzbieta Pekalska , and David M.J.Tax. Feature-Based Dissimilarity Space Classification. Proceedings of the20th International conference on Recognizing patterns in signals, speech,images, and videos (ICPR’10), pp.46-55, 2010.
[4] C. Santos, E. Justino, F. Bortolozzi, R. Sabourin. An off-line signatureverification method based on document questioned experts approach anda neural network Proceedings of 9Th IWFHR International Workshop onFrontiers in Handwriting Recognition (IWFHR’04), pp.498502, 2004.
[5] L. Oliveira, E. Justino, R. Sabourin. Off-line signature using writer-independent approach. IJCNN, pp.25392544, 2007.
[6] D. Bertolini, L. Oliveira, E. Justino, R.Sabourin. Reducing forgeriesin writer-independent off-line signature verification through ensemble ofclassifiers. PR, vol.43, no.1, pp.387396, 2010.
[7] Rivard, D, Granger, E and Sabourin, R., Multi-Feature extraction andselection in writer-independent offline signature verification. IJDAR,vol.16, no.1, pp.83-103, 2013.
[8] Sargur N. Srihari, Aihua Xu and Meenakshi K. Kalera. LearningStrategies and Classification Methods for Off-Line Signature Verifica-tion. Proceedings of the Ninth International Workshop on Frontiers inHandwriting Recognition (IWFHR’04),
[9] Elzbieta pekalska, Robert P.W. Duin, Pavel Paclk Prototype selection fordissimilarity-based classifiers. PR, vol.39, pp.189208, 2006.
[10] Jain, A.K. and Zongker, D. Representation and recognition of hand-written digits using deformable templates. IEEE Transactions on PAMI,vol.19, no.12, pp.1386-1390, 1997.
[11] S. Cha., Use of distance measures in handwriting Analysis. PhD Thesis,State University of New York at Buffalo, USA, 2001.
[12] K. Tieu and P. Viola., Boosting image retrieval. International Journalof Computer Vision, vol.56, no.1, pp.17-36, 2004.
[13] L. Batista, E. Granger and R. Sabourin. Applying Dissimilarity Repre-sentation to Off-Line Signature Verification . International Conferenceon PR (ICPR), pp.1293-1297, 2010.
[14] Eskander, G.S., Sabourin, R. and Granger, E., Hybrid Writer-Independent–Writer-Dependent Offline Signature Verification System.IET-Biometrics Journal, Special issue on Handwriting Biometrics, doi:10.1049/iet-bmt.2013.0024, in press, 2013.
[15] Eskander, G.S., Sabourin, R. and Granger, E., On the Dissimilar-ity Representation and Prototype Selection for Signature-Based Bio-Cryptographic Systems. 2nd Intel. Workshop on Similarity-Based PatternAnalysis and Recognition (SIMBAD2013), York, UK, 3-5 July 2013,LNCS, vol.7953, pp.265-280.
30
Multi-script Off-line Signature Verification: A Two Stage Approach
Srikanta Pal School of Information and
Communication Technology,
Griffith University, Gold Coast
Australia, Email:
Umapada Pal Computer Vision and Pattern
Recognition Unit, Indian Statistical
Institute, Kolkata, India,
Email: [email protected]
Michael Blumenstein School of Information and
Communication Technology,
Griffith University, Gold Coast,
Australia, Email:
Abstract—Signature identification and verification are of great
importance in authentication systems. The purpose of this
paper is to introduce an experimental contribution in the
direction of multi-script off-line signature identification and
verification using a novel technique involving off-line English,
Hindi (Devnagari) and Bangla (Bengali) signatures. In the first
evaluation stage of the proposed signature verification
technique, the performance of a multi-script off-line signature
verification system, considering a joint dataset of English,
Hindi and Bangla signatures, was investigated. In the second
stage of experimentation, multi-script signatures were
identified based on the script type, and subsequently the
verification task was explored separately for English, Hindi
and Bangla signatures based on the identified script result. The
gradient and chain code features were employed, and Support
Vector Machines (SVMs) along with the Modified Quadratic
Discriminate Function (MQDF) were considered in this
scheme. From the experimental results achieved, it is noted
that the verification accuracy obtained in the second stage of
experiments (where a signature script identification method
was introduced) is better than the verification accuracy
produced following the first stage of experiments.
Experimental results indicated that an average error rate of
20.80% and 16.40% were obtained for two different types of
verification experiments.
Keywords—Biometrics; off-line signature verification; multi-
script signature identification.
I. INTRODUCTION
Biometrics are the most widely used approaches for
personal identification and verification. Among all of the
biometric authentication systems, handwritten signatures, a
pure behavioral biometric, have been accepted as an official
means to verify personal identity for legal purposes on such
documents as cheques, credit cards and wills [1].
In general, automated signature verification is divided into
two broad categories: static (off-line) methods and dynamic
(on-line) methods [2], depending on the mode of
handwritten signature acquisition. If both the spatial as well
as temporal information regarding signatures are available
to the systems, verification is performed using on-line [3]
data. In the case where temporal information is not available
and the system can only utilize spatial information gleaned
through scanned or even camera-captured documents,
verification is performed on off-line data [4].
Considerable research has previously been undertaken in
the area of signature verification, particularly involving
single-script signatures. On the other hand, less attention has
been devoted to the task of multi-script signature
verification. Very few published papers involving multi-
script signatures, including non-English signatures, have
been communicated in the field of signature verification.
Pal et al. [5] introduced a signature verification system
employing Hindi Signatures. The direction of the paper was
to present an investigation of the performance of a signature
verification system involving Hindi off-line signatures. In
that study, two important features such as: gradient feature,
Zernike moment feature and SVM classifiers were
employed. Encouraging results were obtained in this
investigation. In a different contribution by Pal et al. [6], a
multi-script off-line signature identification technique was
proposed. In that report, the signatures involving Bangla
(Bengali), Hindi (Devnagari) and English were considered
for the signature script identification process. A multi-script
off-line signature identification and verification approach,
involving English and Hindi signatures, was presented by
Pal et al. [7]. In that paper, the multi-script signatures were
identified first on the basis of signature script type, and
afterward, verification experiments were conducted based
on the identified script result.
Development of a general multi-script signature
verification system, which can verify signatures of all
scripts, is very complicated. The verification accuracy in
such multi-script signature environments will not be as
successful when compared to single script signature
verification [10]. To achieve the necessary accuracy for
multi-script signature verification, it is important to identify
signatures based on the type of script and then use an
individual single script signature verification system for the
identified script [10]. Based on this observation, in the
proposed system, the signatures of three different scripts are
separated to feed into the individual signature verification
system. On the other hand to get a comparative idea, multi-
script signature verification results on a joint English, Hindi
and Bangla dataset, without using any script identification,
is also investigated.
The remainder of this paper is organized as follows. The
multi-script signature verification concept is described in
Section II. Section III introduces the notable properties of
Hindi and Bangla script. The Hindi, Bangla and English
signature database used for the current research is described
in Section IV. Section V briefly presents the feature
extraction techniques employed in this work. The classifier
details are described in Section VI. The experimental
31

settings are presented in Section VII. Results and a
discussion are provided in Section VIII. Finally, conclusions
and future work are discussed in Section IX.
II. MULTI-SCRIPT SIGNATURE VERIFICATION CONCEPT
When a country deals with two or more scripts and
languages for reading and writing purposes, it is known as a
multi-script and multi-lingual country. In India, there are
officially 23 (Indian constitution accepted) languages and 11
different scripts.
In such a multi-script and multi-lingual country like
India, languages are not only used for writing/reading
purposes but also applied for reasons pertaining to signing
and signatures. In such an environment in India, the
signatures of an individual with more than one language
(regional language and international language) are
essentially needed in official transactions (e.g. in passport
application forms, examination question papers, money
order forms, bank account application forms etc.). To deal
with these situations, signature verification techniques
employing single-script signatures are not sufficient for
consideration. Therefore in a multi-script and multi-lingual
scenario, signature verification methods considering more
than one script are necessarily required.
Towards this direction of verification, the contribution of
this paper is twofold: First, multi-script signature
verification considering joint datasets as shown in Figure 1,
the second is identification of signatures based on script,
and subsequent verification for English, Hindi and Bangla
signatures based on the identified script result. A diagram of
this second verification mode is shown in Figure 2.
Figure 1. Diagram of signature verification considering a joint dataset.
Figure 2. Diagram of multi-script signature identification
and verification based on English, Hindi and Bangla signatures.
III. PROPERTIES OF HINDI AND BANGLA SCRIPT
Most of the Indian scripts including Bangla and Devanagari
have originated from ancient Brahmi script through various
transformations and evolution [8]. Bangla and Devanagari
are the two most accepted scripts in India. In both scripts,
the writing style is from left to right and there is no concept
of upper/lower case. These scripts have a complex
composition of their constituent symbols. The scripts are
recognizable by a distinctive horizontal line called the ‘head
line’ that runs along the top of full letters, and it links all the
letters together in a word. Both scripts have about fifty
basic characters including vowels and consonants.
IV. DATABASE USED FOR EXPERIMENTATION
A. Hindi and Bangla Signature Database
As there has been no public signature corpus available for Hindi and Bangla script, it was necessary to create a database of Hindi and Bangla signatures. The Hindi and Bangla signature databases used for experimentation consisted of 50 sets per script type. Each set consists of 24 genuine signatures and 30 skilled forgeries. Some genuine signature samples of Hindi and Bangla, with their corresponding forgeries, are displayed in Table 1 and Table 2.
B. GPDS English Database
Another database, consisting of 50 sets from GPDS-160 [9],
was also utilised for these experiments. Each signature set
of this corpus consists of 24 genuine signatures and 30
simple forgeries. The reason 50 sets were used from the
GPDS on this occasion, is due to the fact that the Bangla
and Hindi datasets described previously were comprised of
50 sets each, and it was considered important to have
equivalent signature numbers for experimentation.
TABLE 1. SAMPLES OF HINDI GENUINE AND FORGED SIGNATURES
Genuine Signatures Forged signatures
TABLE 2. SAMPLES OF BANGLA GENUINE AND FORGED SIGNATURES
Genuine Signatures Forged signatures
V. FEATURE EXTRACTION
Feature extraction is a crucial step in any pattern
recognition system. Two different types of feature
extraction techniques such as: gradient feature extraction
and the chain code feature are considered here.
Multi-script off-line Signatures (Signatures
of English, Hindi and Bangla)
Verification based on Multi-script Signatures
Accuracy of Verification
Multi-script Signatures
(English, Hindi and Bangla)
Signature Script Identification
Signatures of English Script
Signatures of
Bangla Script
English
Signature
Verification
Bangla
Signature
Verification
Signatures of Hindi Script
Hindi
Signature
Verification
32

A. Computation of 576-dimensional gradient Features
576-dimensional gradient features were extracted for this
research and experimentation, which are described in paper
[7].
B. 64-Dimensional Chain Code Feature Extraction
The 64-dimensional Chain Code feature is determined as
follows. In order to compute the contour points of a two-
tone image, a 3 x 3 window is considered surrounding the
object point. If any one of the four neighbouring points (as
shown in Fig. 3 (a)) is a background point, then this object
point (P) is considered as a contour point. Otherwise it is a
non-contour point.
The bounding box (minimum rectangle containing the
character) of an input character is then divided into 7 x 7
blocks. In each of these blocks, the direction chain code for
each contour point is noted and the frequency of the
direction codes is computed. Here, the chain code of four
directions only [directions 1 (horizontal), 2 (45 degree
slanted), 3 (vertical) and 4 (135 degree slanted)] is used.
Four chain code directions are shown in Fig. 3 (b). It is
assumed that the chain code of directions 1 and 5, 2 and 6, 3
and 7, 4 and 8, are the same. Thus, in each block, an array is
obtained of four integer values representing the frequencies,
and those frequency values are used as features. Thus, for 7
x 7 blocks, 7 x 7 x 4= 196 features are obtained. To reduce
the feature dimensions, after the histogram calculation into 7
x 7 blocks, the blocks are down-sampled with a Gaussian
filter into 4 x 4 blocks. As a result, 4 x 4 x 4 = 64 features
are obtained for recognition. To normalize the features, a
maximum value of the histograms from all the blocks, is
computed. Each of the above features is divided by this
maximum value to obtain the feature values between 0 and
1.
(a) (b)
Figure 3. Eight neighbours (a) For a point P and its neighbours (b) For a
point P the direction codes for its eight neighbouring points.
VI. CLASSIFIER DETAILS
Based on these features, Support Vector Machines
(SVMs) and the Modified Quadratic Discriminant Function
(MQDF) are applied as the classifiers for the experiments.
A. SVM Classifier
For this experiment, a Support Vector Machine (SVM) classifier is used. The SVM is originally defined for two-class problems and it looks for the optimal hyper plane, which maximizes the distance and the margin, between the nearest examples of both classes, named support vectors (SVs). Given a training database of M data: {xm| m=1,..., M}, the linear SVM classifier is then defined as:
bxxxf j
j
j )(
where {xj} are the set of support vectors and the parameters
j and b have been determined by solving a quadratic
problem [11]. The linear SVM can be extended to various
non-linear variants; details can be found in [11, 12]. In these
proposed experiments, the Gaussian kernel SVM
outperformed other non-linear SVM kernels, hence
identification/verification results based on the Gaussian
kernel are reported only.
B. MQDF Classifier
The Modified Quadratic Discriminant Function is defined as
follows [13].
( ) ( ) [
[‖ ‖ ∑
]]
∑ ( )
where X is the feature vector of an input character; M is a
mean vector of samples; is the i
th eigen vector of the
sample covariance matrix; is the ith
eigen value of the
sample covariance matrix; k is the number of eigen values
considered here; n is the feature size; is the initial
estimation of a variance; N is the number of learning
samples; and N0 is a confidence constant for s and N0 is
considered as 3N/7 for experimentation. All the eigen values
and their respective eigen vectors are not used for
classification. Here, the eigen values are stored in
descending order and the first 60 (k=60) eigen values and
their respective eigen vectors are used for classification.
Compromising on trade-off between accuracy and
computation time, k was determined as 60.
VII. EXPERIMENTAL SETTINGS
A. Settings for Verification used in 1st Stage of Experiments
The skilled forgeries were not considered for training
purposes. For experimentation, random signatures were
considered for training purposes. For each signature set, an
SVM was trained with 12 randomly chosen genuine
signatures. The negative samples for training (random
signatures) were the genuine signatures of 149 other
signature sets. Two signatures were taken from each set. In
total, there were 149x2=298 random signatures employed
for training. For testing, the remaining 12 genuine
signatures and 30 skilled forgeries of the signature set being
considered were employed. The number of samples for
training and testing for these experiments are shown in
Table 3. Table 3. No. of Signatures used per set in 1st Phase of Verification
Genuine
Signature
Random
Signatures
Skilled
Forgeries
Training 12 298 n/a
Testing 12 n/a 30
33
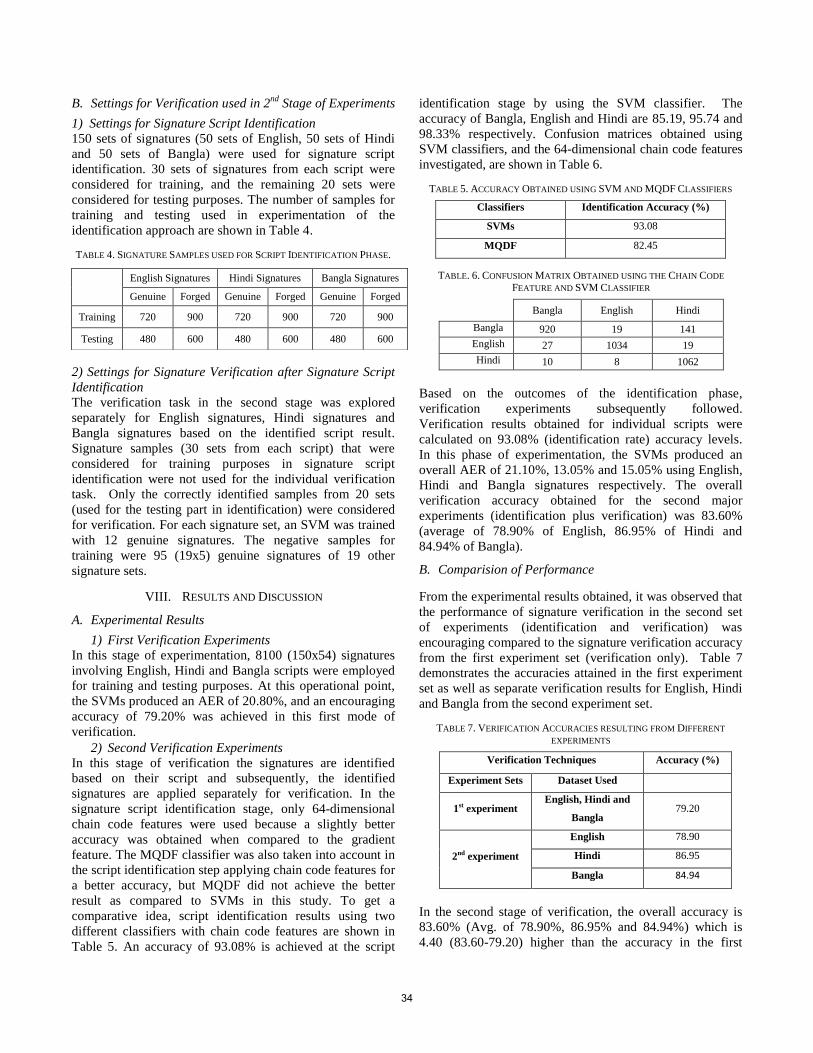
B. Settings for Verification used in 2nd
Stage of Experiments
1) Settings for Signature Script Identification
150 sets of signatures (50 sets of English, 50 sets of Hindi
and 50 sets of Bangla) were used for signature script
identification. 30 sets of signatures from each script were
considered for training, and the remaining 20 sets were
considered for testing purposes. The number of samples for
training and testing used in experimentation of the
identification approach are shown in Table 4.
TABLE 4. SIGNATURE SAMPLES USED FOR SCRIPT IDENTIFICATION PHASE.
2) Settings for Signature Verification after Signature Script
Identification
The verification task in the second stage was explored
separately for English signatures, Hindi signatures and
Bangla signatures based on the identified script result.
Signature samples (30 sets from each script) that were
considered for training purposes in signature script
identification were not used for the individual verification
task. Only the correctly identified samples from 20 sets
(used for the testing part in identification) were considered
for verification. For each signature set, an SVM was trained
with 12 genuine signatures. The negative samples for
training were 95 (19x5) genuine signatures of 19 other
signature sets.
VIII. RESULTS AND DISCUSSION
A. Experimental Results
1) First Verification Experiments
In this stage of experimentation, 8100 (150x54) signatures
involving English, Hindi and Bangla scripts were employed
for training and testing purposes. At this operational point,
the SVMs produced an AER of 20.80%, and an encouraging
accuracy of 79.20% was achieved in this first mode of
verification.
2) Second Verification Experiments
In this stage of verification the signatures are identified
based on their script and subsequently, the identified
signatures are applied separately for verification. In the
signature script identification stage, only 64-dimensional
chain code features were used because a slightly better
accuracy was obtained when compared to the gradient
feature. The MQDF classifier was also taken into account in
the script identification step applying chain code features for
a better accuracy, but MQDF did not achieve the better
result as compared to SVMs in this study. To get a
comparative idea, script identification results using two
different classifiers with chain code features are shown in
Table 5. An accuracy of 93.08% is achieved at the script
identification stage by using the SVM classifier. The
accuracy of Bangla, English and Hindi are 85.19, 95.74 and
98.33% respectively. Confusion matrices obtained using
SVM classifiers, and the 64-dimensional chain code features
investigated, are shown in Table 6.
TABLE 5. ACCURACY OBTAINED USING SVM AND MQDF CLASSIFIERS
Classifiers Identification Accuracy (%)
SVMs 93.08
MQDF 82.45
TABLE. 6. CONFUSION MATRIX OBTAINED USING THE CHAIN CODE
FEATURE AND SVM CLASSIFIER
Bangla English Hindi
Bangla 920 19 141
English 27 1034 19
Hindi 10 8 1062
Based on the outcomes of the identification phase,
verification experiments subsequently followed.
Verification results obtained for individual scripts were
calculated on 93.08% (identification rate) accuracy levels.
In this phase of experimentation, the SVMs produced an
overall AER of 21.10%, 13.05% and 15.05% using English,
Hindi and Bangla signatures respectively. The overall
verification accuracy obtained for the second major
experiments (identification plus verification) was 83.60%
(average of 78.90% of English, 86.95% of Hindi and
84.94% of Bangla).
B. Comparision of Performance
From the experimental results obtained, it was observed that
the performance of signature verification in the second set
of experiments (identification and verification) was
encouraging compared to the signature verification accuracy
from the first experiment set (verification only). Table 7
demonstrates the accuracies attained in the first experiment
set as well as separate verification results for English, Hindi
and Bangla from the second experiment set.
TABLE 7. VERIFICATION ACCURACIES RESULTING FROM DIFFERENT
EXPERIMENTS
Verification Techniques Accuracy (%)
Experiment Sets Dataset Used
1st experiment English, Hindi and
Bangla 79.20
2nd experiment
English 78.90
Hindi 86.95
Bangla 84.94
In the second stage of verification, the overall accuracy is
83.60% (Avg. of 78.90%, 86.95% and 84.94%) which is
4.40 (83.60-79.20) higher than the accuracy in the first
English Signatures Hindi Signatures Bangla Signatures
Genuine Forged Genuine Forged Genuine Forged
Training 720 900 720 900 720 900
Testing 480 600 480 600 480 600
34

stage. The comparison of these two accuracies is shown in
Table. 8.
TABLE 8. ACCURACY IN DIFFERENT PHASES OF VERIFICATION
Verification Experiment Verification Accuracy (%)
Without Script Identification 79.20
With Script Identification 83.60
From the above table it is evident that verification accuracy
with script identification is much higher than without script
identification. This increased accuracy is achieved because
of the proper application of the identification stage. This
research clearly demonstrates the importance of using
identification in multi-script signature verification
techniques.
C. Error Analysis
Most of the methods used for signature verification generate
some erroneous results. In these experiments, a few
signature samples were mis-identified in both the
identification and verification stages. Few of the confusing
signature samples obtained in the signature script
identification stage using the SVM classifier are shown in
Figures 4, 5 and 6. Three categories of confusing samples
are generated by the classifier. The first category illustrates
a Bangla signature sample treated as a Hindi signature
sample. The second one illustrates an English signature
sample treated as a Bangla signature sample and the third
one illustrates a Hindi signature sample treated as a Bangla
signature sample.
Figure 4. Bangla sample treated as Hindi
Figure 5. English treated as Bangla
Figure 6. Hindi Signature treated as Bangla
IX. CONCLUSIONS AND FUTURE WORK
This paper provides an investigation of the excellent
performance of a multi-script signature verification
technique involving English, Hindi and Bangla off-line
signatures. The novel approach used in a multi-script
signature verification environment with the combination of a
custom Hindi and Bangla off-line signature dataset provides
a substantial contribution to the field of signature
verification. In such a verification environment, the proper
utilization of a script identification technique, which
substantially affects the verification accuracy, indicates an
important step in the process. The comparatively higher
verification accuracy obtained in the second experimental
approach is likewise a substantial contribution. The gradient
feature, chain code feature as well as SVM and MQDF
classifiers were employed for experimentation. The idea of a
multi-script signature verification approach, which deals
with an identification phase, is a very important contribution
to the area of signature verification. The proposed off-line
multi-script signature verification scheme is a new
investigation in the field of off-line signature verification. In
the near future, we plan to extend our work considering
further sets of signature samples, which may include
different languages/scripts.
X. ACKNOWLEDGMENTS
Thanks to my colleague Mr. Nabin Sharma for his help
towards the preparation of this paper.
REFERENCES
[1] R. Plamondon and G. Lorette, “Automatic signature verification and writer identification - the state of the art”, Pattern Recognition, pp.107–131, 1989.
[2] S. Madabusi, V. Srinivas, S. Bhaskaran and M. Balasubramanian, “On-line and off-line signature verification using relative slope algorithm”, in proc. International Workshop on Measurement Systems for Homeland Security, pp. 11-15, 2005.
[3] D. Impedovo, G. Pirlo, “ Automatic signature verification: The state of the art”, IEEE transactions on Systems, Man, and Cybernetics part-C, vol. 38, no. 5, pp. 609–635, 2008.
[4] M. Kalera, S. Srihari and A. Xu. “Offline signature verification and identification using distance statistics”, International Journal on Pattern Recognition and Artificial Intelligence, pp.1339-1360, 2004.
[5] S. Pal, U. Pal, M. Blumenstein, “Hindi Off-line Signature Verification”, in proc. International Conference on Frontiers in Handwritten Recognition, ICFHR 2012, Bari, Italy, pp. 371-376.
[6] S. Pal, A. Alaei, U. Pal, M. Blumenstein, “Multi-Script off-line signature identification” , in proc. International Conference on Hybrid Intelligent Systems, pp. 236-240, 2012.
[7] S. Pal, U. Pal, M. Blumenstein, “Hindi and English off-line signature identification and verification”, in proc. International Conference on Advances in Computing. pp. 905–910, 2012.
[8] B. B. Chaudhuri and U. Pal, “An OCR system to read two Indian language scripts: Bangla and Devnagari (Hindi)”, in proc. International Conference on Document Analysis and Recognition, pp. 1011–1015, 1997.
[9] M. A. Ferrer, J. B. Alonso, and C. M. Travieso, “Offline geometric parameters for automatic signature verification using fixed-point arithmetic”, IEEE transactions on Pattern Analysis and Machine Intelligence, 27:993–997, 2005.
[10] S. Pal, U. Pal and M. Blumenstein, “A Two-Stage Approach for English and Hindi Off-line Signature Verification”, International workshop on Emerging Aspects in Handwritten signature processing, 2013(Acceoted).
[11] V.Vapnik, “The Nature of Statistical Learning Theory”, Springer Verlang, 1995.
[12] C. Burges, “A Tutorial on support Vector machines for pattern recognition”, Data Mining and Knowledge Discovery, pp.1-43, 1998.
[13] F. Kimura, K. Takashina, S. Tsuruoka and Y. Miyake, “Modified quadratic discriminant function and the application to Chinese character recognition”, IEEE transactions on Pattern Analysis and Machine Intelligence, Vol. 9, pp 149-153, 1987.
35

Off-Line Signature Verification based on Ordered Grid Features: An Evaluation
Konstantina Barkoula, George Economou Physics Department University of Patras
Patras, Greece email: [email protected], [email protected]
Elias N. Zois, Evangelos Zervas Electronics Engineering Department
Technological and Educational Institution of Athens Egaleo, Greece
e-mail: {ezois, ezervas}@teiath.gr
Abstract— A novel offline signature modeling is introduced and evaluated which attempts to advance a grid based feature extraction method uniting it with the use of an ordered powerset. Specifically, this work represents the pixel distribution of the signature trace by modeling specific predetermined paths having Chebyshev distance of two, as being members of alphabet subsets-events. In addition, it is proposed here that these events, partitioned in groups, are further explored and processed within an ordered set context. As a proof of concept, this study progresses by counting the events’ first order appearance (in respect to inclusion) at a specific powerset, along with their corresponding distribution. These are considered to be the features which will be employed in a signature verification problem. The verification strategy relies on a support vector machine based classifier and the equal error rate figure. Using the new scheme verification results were derived for both the GPDS300 and a proprietary data set, while the proposed technique proved quite efficient in the handling of skilled forgeries as well.
Grid Features, Power Set, Ordering, Signature Verification
I. INTRODUCTION
Automated handwritten signature verification systems (ASVS) remain up to now an accepted way for humans to declare their identity in many application areas including civilian ones [1], [2], [3], [4]. ASVS are separated into two major categories based on the method that the signature is obtained. Both online and offline ASVS must cope with the evidence that the process of creating handwritten signatures, even when they originate from a well trained genuine writer, will carry natural variations, defined as intra-writer variability [5]. It is adopted that the online ASVS are generally more efficient when compared to offline. A commonly used figure of merit which is employed in order to characterize the efficiency of ASVS is the equal error rate (EER) which is calculated from the ROC or DET plots of both types of error rates.
The goal of an offline ASVS is to efficiently transform an image into a mathematical measurable space where it will be represented by means of its corresponding features [6]. Next, the features are feeding computational intelligence techniques and pattern recognition classifiers which will decide, after appropriate training and testing procedures, if a signature under query belongs to a claimed writer [7], [8].
According to the experimental protocol followed, there are two major approaches which have been applied to off-line ASVS; writer dependent (WD) and writer-independent (WI). The WD approach uses an atomic classifier for each writer. The WI approach uses a classifier to match each input questioned signature to one or more reference signatures, and a single classifier is trained for all writers [9], [10].
Feature extraction is considered to be one of the most challenging tasks when ASVS are designed. An important feature extraction philosophy which attracts increasing interest, exploits the signature using a coarse or fine detail grid which is imposed upon the image. Among others, examples of grid based feature extraction can be found in the work provided by references [10], [11], [12], [13], [14], [15], [16], [17], [18] and [19].
In another work provided by Tselios, Zois, Nassiopoulos and Economou [20], a grid based feature extraction method was developed which represents the signature trace by taking into account the histogram of specific pixel path transitions along predefined paths within pre-confined Chebyshev distances of two (FCB2 feature). The feature extraction concepts have been advanced by describing these paths in a way in which they can be viewed as symbols transmitted by a discrete space random source. The combination of the produced FCB2 symbols defines the message or event that the random source sends out when a certain sequence of signature pixels is accounted. They are treated according to the event concept, reported in standard set and information theory and they are complemented along with their corresponding probabilistic moments [21]. In this work and in order to further increase our signature discriminating capability the potential messages-events of the FCB2 paths are organized in sub-groups of independent tetrads. Each tetrad is organized according to its ordered powerset with respect to inclusion [22]. The outcome of this procedure provides an attempt to model the handwriting process in concordance with basic elements of information and coding theory.
The distributions of the now ordered transition paths in the new feature space are used to code the signature image. In the case study presented here a WD verification scheme is followed which comprises of the training and testing phase. Verification results have been drawn with the use of two databases, the GPDS300 and a proprietary one by means of the false acceptance, false rejection and the equal error rate (EER) figure of merit. The rest of this work is organized as
36

follows: Section 2 provides the database details and the description of the feature extraction algorithm. Section 3 presents the experimental verification protocol which has been applied. Section 4 presents the comparative evaluation results while section 5 draws the conclusions.
II. DATABASE AND FEATURE EXTRACTION PROCEDURE
A. Database Description
The proposed feature extraction modeling has been studied with the use of two databases of 8-bit grey scale signatures: a Greek signers’ database (CORPUS1) [20] and GPDS-300 (CORPUS2) [12]. CORPUS1 comprises of a domestic Greek collection of 105 genuine and 21 simulated forgery signature samples for each of the 69 signers of the database. Genuine samples were acquired in a one month time frame. CORPUS2 contains 24 genuine signatures and 30 simulated forgeries for each of the 300 signers of the database and is publicly available. During the experimental process, two schemes of randomly selected training and testing samples were used for comparison with the outcomes of contemporary research in the field. In the first scheme, 12 genuine and 12 simulated-forgery reference samples per writer are used, while in the second scheme 5 genuine and 5 simulated forgery reference samples are used. The remaining samples are used for testing.
B. Preprocessing
In order to produce the binary form of the acquired signatures the following preprocessing steps have been carried out: thresholding using Otsu’s method [6], skeletonization, cropping and segmentation. This procedure is expected to reduce a number of side effects of the writing instruments variations. The result is the generation of the most informative window (MIW) of the image. The features are extracted either from the whole MIW of the signature or from segments of signature’s MIW with the use of the equimass sampling grid method [14]. Equimass sampling grid segmentation provides strips of the signature with uniform size of signature pixels instead of the trivial distance grid segmentation which provides segments of equal area. The result is depicted in Fig. 1. In this work the feature vector is generated from the ‘S2’ scheme used in [20].
C. Alphabet Description
Fig. 2 depicts the alphabet which is defined as a set of symbols, emerging from the FCB2 description according to [12]. To be more specific, FCB2 alphabet is the set of transition paths of three consecutive pixels under the constraint of having the first and third pixels restrained to a Chebyshev distance equal to two.
Figure 1. Signature image with equimass made segments
Since, in offline signatures, signature-pixel ordering is unknown, the ordered sequence of the pixels cannot be estimated. This note diminish the number of queried FCB2 transition paths, in a 5x5 pixel grid window, with center pixel each black pixel of signature’s image, to the sixteen independent transition paths presented in Fig. 2. In this case study only the FCB2 paths have been taken into account. It is advantageous in our case to explicitly treat the notion of the signature pixels indexes (i,j) as a transformation of sequences produced by the source. As a consequence, the feature extraction grid can be identified as a discrete space – discrete alphabet source.
D. Ordered Event Modeling
Let the triad ( , Β, P) indicate the probability space on which all the potential outcomes are identified. By definition is the sample space upon which a discrete digital source transmits alphabet symbols. The source may transmit either single symbols or sets of them (events) from a 16 symbol alphabet as figure 2 illustrates. Let B a sigma field (the event space) that encloses all potential occurrences of symbols combinations from the FCB2 alphabet. That is, B is the largest possible -field [23] which is the collection of all subsets of and is called the power set. Finally, let P be the corresponding distributions of the -field.
In order to evade the problem of 216 space management is grouped into T subsets 1, ,{ }t t T and we define the
sub-s-fields Bt as the power sets for each t . In this work we choose to group the 16-FCB2(i) components into ensembles of four tetrads (call it hereafter F4-collection) thus resulting to an early set of 4 24=64 possible event combinations. From the complete set of all the possible ensembles of the F4 collection only 87 orthogonal cases shall be enabled along with their corresponding probabilities. From a mathematical point of view the signature image is analyzed into four major subspaces where each of them is composed of 16 orthogonal dimensions. The term orthogonal denotes that each symbol in a sub-alphabet space of a F4 tetrad cannot be derived as any combination of the same subspace F4 symbols. This constraint provides each signature with 87 different F4 orthogonal tetrad event sets, found through exhaustive search. Fig. 3 provides the FCB2 alphabet along with a F4 orthogonal collection. As a proof of concept, the orthogonal F4 collection #44, selected randomly is illustrated in figure 3.
Figure 2. FCB2 alphabet set which forms the probability space .
37

Figure 3. One F4 collection of tetrads (#44). Each horizontal tetrad is considered to form a subspace in the original 16-dimnensional feature
space and consequently generates a powerset of events
Finally, each one of the four F4 power-sets of figure 3b is evaluated by ordering the elements of the powerset with respect to inclusion. Fig. 4 provides a graphical explanation of one powerset in line with the proposed modeling. In order to illustrate the method with clarity, figure 4 has been created which shows the powerset of the #44 F4 collection with respect to inclusion. The indexes x, y, z, w are associated with one tetrad’s elements of the F4 collection. For each arrow in figure 4 there is a corresponding probability evaluated for every segmented image. Thus, the overall dimensionality of the feature vector for one F4 collection is equal to 32 (4+12+12+4) for each image segment.
According to the exposed material, a discrete source, designated as Sn, can be defined by its transmitted set of symbols-events which are now members of an ordered F4 collection. This novel modeling of the feature generation process is an evolution of the previous method as it was described in [20]. It attempts to model the distribution of the signature pixel paths as an information source and to associate events of ordered paths (arrows as seen in fig. 4) along with their corresponding first order probabilities.
E. Creation of the ordered feature vector
To make this work robust a short description is provided for generating the ordered feature components. According to the material exposed in sections IIC, IID, each one of the preprocessed image segments is scanned top-down and left-right to identify its signature pixels. Let us denote with the labels One (O) and Two (T) a conjugated pair of 5 5 moving grids with the property that their topological centers are distant by a Euclidean distance of one. Then for each signature pixel the {O, T} grids are imposed. Next, detection of discrete events at both {O, T} grids is performed followed by the evaluation of the corresponding ordered probabilities, as described in fig. 4. In addition, fig. 5 presents in a graphical manner the generation of a feature component namely the {X, XY}. In this work the overall feature dimensionality is 128 due to the selection of the segmentation preprocessing steps.
III. CLASSIFICATION PROTOCOL
On the grounds of proofing the proposed concept and according to the discussion exposed in section II the training
Figure 4. Power set for one subspace (the first horizontal line of fig. 3) of
the #44 F4 collection ordered with respect to inclusion
phase of the WD verification scheme follows: for each writer, #nref reference samples of genuine along with an equal number of simulated-forgery signature samples are randomly chosen in order to train the classifier. The “S2” image segmentation scheme combines the features calculated on the whole signature image as well as the relevant 2x2 equimass segmentation grid [20]. These features supply the classifier training section without assuming any additional processing. The classifier used is a hard-margin two class support vector machine (SVM) classifier using radial basis kernel. Selection of the training samples for the genuine class was accomplished using randomly chosen samples according to the hold-out validation method. The remaining genuine and simulated forgery signatures feature vectors, drawn using the same F4 collection, feed the SVM classifier directly for testing. The SVM output apart from the binary class decision provides a score value which is equal to the distance of the tested sample from the SVM separating hyperplane. The operating parameters of the SVM have been determined through exhaustive search. It is noted that there is a wide area of rbf sigma values that the system has the reported results.
Evaluation of the verification efficiency of the system is accomplished with the use of a global threshold on the overall SVM output score distribution. This is achieved by providing the system’s False Acceptance Rate (FAR: samples not belonging to genuine writers, yet assigned to them) and the False Rejection Rate (FRR: samples belonging to genuine writers, yet not classified) functions. With these two rates, the receiver operator characteristics (ROC) are drawn by means of their FAR/FRR plot. Then, classification performance is measured with the utilization of the system Equal Error Rate (EER: the point which FAR equals FRR).
IV. RESULTS
According to the discussion presented above, FAR, FRR and the relevant EER rates, are evaluated for (a) CORPUS 1 and and (b) CORPUS 2 with five and twelve reference
38

Figure 5. (A) One set of the #44 F4 collection as depicted in fig. 3b. (B) left and right grids labeled as One (O) and Two (T) respectively imposed
on a signature trace (mark with green shadowed pixels) and corresponding events activated. For illustration purposes the topological grids have a
distance of 7 instead of 1 that is followed at the actual feature extraction method. (C) Ordered event detection is designated between the red circles
and feature component update along red line.
samples for both genuine and forger class. The corresponding results are presented in Table I by means of the mean FAR, FRR and EER values. The letters G and F in Table I designate the genuine and skilled forgery samples respectively. In addition, the ROC curves are presented for both databases in fig. 6 along with their corresponding EER defined as the cross section of the ROC curves and the diagonal.
Our results are compared to recently published relevant figures. The reported results for CORPUS 1 are compared with the results relevant to those reported in [12] for feature level simulated forgery verification tests using ‘S2’ scheme using (a) nref=5 and (b) the mean value of nref=10 and nref=15 tests for comparison with our test using nref=12. The comparison results are presented in Table II. Concerning CORPUS 2, we present in Table III, the results of recently reported research work using nref=5 and nref=12, along with the results of the current approach.
V. CONCLUSIONS
In this work a handwritten model based on the powerset of an ordered event topology with respect to inclusion is considered as a tool for offline signature verification. A number of verification experiments based on an SVM classifier have been carried out in two signature databases namely the GPDS and a proprietary one. Primary verification results indicate that the proposed feature extraction method has an appealing aspect; As a comment on the efficiency of the method one can state that in the case of the Corpus 1 a substantial improvement is observed while in the case of Corpus 2 the results are comparable with those of the
Figure 6. ROC curves with the corresponding EER for corpuses 1, 2.
literature. Since the approach described in this case study is preliminary it is anticipated that further exhaustive research will unveil important conclusions with respect to the modeling of handwriting. However a number of various other models and experimental setups including i.e. the dissimilarity framework [10] need to be examined in order to verify the effectiveness of the proposed approach.
TABLE I. VERIFICATION EFFICIENCY (%)
Experimental Set FAR FRR EER CORPUS 1, #nref=5 (GF) 2.18 3.29 2.79 CORPUS 2, #nref=5 (GF) 13.03 5.23 9.04 CORPUS 1, #nref=12 (GF) 1.13 1.60 1.45 CORPUS 2, #nref=12 (GF) 7.73 3.45 5.53
TABLE II. COMPARING EER WITH APPROACH [20]
Experimental Set EER (%) [20] #nref=5 (GF) 9.16 Proposed #nref=5 (GF) 2.79 [20] #nref=12 (GF) 4.65 Proposed #nref=12 (GF) 1.45
TABLE III. COMPARING EER WITH VARIOUS APPROACHES (%)
Method EER EER [20] #nref=5 (GF) 12.32 [12] GPDS-100 nref=5 (GF) 12.02 [19] #nref=13 (only G) 4.21
Proposed #nref=5
9.04
[20] for nref=12 (GF) 6.2 [12] # ref = {10G, 15F} 8.26 [13] #refn=12 (GF) 13.76 [24] #nref=12 (GF) 15.11 [25] # nref=12 (only G) 15.4
Proposed #nref=12
5.53
REFERENCES [1] R. Plamondon and S. N. Srihari, "On-line and off-line handwriting
recognition: A comprehensive survey," IEEE Transactions on Pattern Analysis and Machine Intelligence, vol. 22, pp. 63-84, 2000.
[2] F. Leclerc and R. Plamondon, "Automatic Signature verification: the state of the art-1989-1993", International Journal of Pattern Recognition and Artificial Intelligence, vol. 8, pp. 643-660, 1994.
39
[3] D. Impedovo, and G. Pirlo, "Automatic signature verification: The state of the art, "IEEE Transactions on Systems Man and Cybernetics" vol. 38, pp. 609-635, 2008.
[4] L. Batista, D. Rivard, R. Sabourin, E. Granger, and P. Maupin, "State of the art in off-line signature verification". In Verma, B., Blumenstein, M. (eds.) Pattern Recognition Technologies and Applications: Recent Advances, pp. 39–62, 2008.
[5] M. C. Fairhurst, "Signature verification revisited: promoting practical exploitation of biometric technology", Electron. Commun. Eng. J., vol. 9, pp. 273–280, 1997.
[6] R. C. Gonzalez and R. E. Woods, "Digital Image processing", Addison Wesley, Reading, 1992.
[7] S. Theodoridis and K. Koutroumbas, "Pattern Recognition", Academic Press, 2009.
[8] R. O. Duda and P. E. Hart, Pattern classification. New York: John Wiley and Sons, 2001.
[9] D. Bertolini, L. S. Oliveira, E. Justino, and R. Sabourin, "Reducing forgeries in writer-independent off-line signature verification through ensemble of classifiers". Pattern Recognition, vol. 43, pp. 387–396, 2010.
[10] D. Rivard, E. Granger and R. Sabourin, "Multi feature extraction and selection in writer independent off-line signature verification", International Journal on Document Analysis and Recognition, vol. 16, pp. 83-103, 2013.
[11] V. K. Madasu, and B. Lovell. "An Automatic Off-line Signature Verification and Forgery Detection System", in Verma, B., Blumenstein, M. (eds.) Pattern Recognition Technologies and Applications: Recent Advances, pp. 63–89, 2008.
[12] J. F. Vargas, M. A. Ferrer, C. M. Travieso and J. B. Alonso, "Off-line signature verification based on grey level information using texture features", Pattern Recognition, vol. 44, pp. 375-385, 2011.
[13] R. Kumar, J. D. Sharma, and B. Chanda, "Writer independent off-line signature verification using surroundedness feature", Pattern Recognition Letters, vol. 33, pp. 301-308, 2012.
[14] D. Impedovo, G. Pirlo, L. Sarcinella, E. Stasolla, and C. A. Trullo, "Analysis of Stability in Static Signatures using Cosine Similarity", in: Proc of International Conference on Frontiers in Handwriting Recognition, pp. 231-235, 2012.
[15] B. H. Shekar, and R. K. Bharathi, "LOG-Grid based off-line signature verification", in Fourth International Conference on signal and image processing, 2012. S. Mohan, S., Kumar, S.S. (eds), LNEE 222, pp. 321-330, 2013.
[16] J. P. Swanepoel, and J. Coester. "Off-line signature verification using flexible grid features and classifiers fusion", in International Conference on Frontiers in Handwriting Recognition, pp. 297-302. , 2012.
[17] M. K. Kalera, S. Shrihari and A. Xu, "Offine line signature verification using distance statistics", International Journal of Pattern Recognition and Artificial Intelligence, vol. 18, pp. 1339-1360, 2005.
[18] A. Gilperez, F. Alonso-Fernandez, S. Pecharroman, J. Fierrez-Aguilar, and J. Ortega-Garcia, "Off-line signature verification using contour features", in International Conference on Frontiers in Handwriting Recognition ICFHR 2008.
[19] M. Parodi, J. C. Gomez, and A. Belaid, "A circular grid-based rotation invariant feature extraction approach for off-line signature verification", in 11th International Conference on Document Analysis and Recognition, pp. 1289-1293. 2011.
[20] K. Tselios, E. N. Zois, E. Siores, A. Nassiopoulos, and G. Economou, "Grid-based feature distributions for off-line signature verification". IET Biometrics, vol. 1, pp. 72-81, 2012.
[21] T. M. Cover, and A. Y. Thomas, "Elements of information theory", 2nd ed. John Wiley and Sons (2006).
[22] P. R. Halmos, "Naive set theory". The University Series in Undergraduate Mathematics. van Nostrand Company, Princeton, 1960.
[23] Hazewinkel, M.: Encyclopedia of Mathematics, Springer, 2001.
[24] V. Nguyen, Y. Kawazoe, T. Wakabayashi, U. Pal, and M. Blumenstein, "Performance Analysis of the Gradient Feature and the Modified Direction Feature for Off-line Signature Verification", in Proc. 2010 Int Conf on Frontiers in Handwriting Recognition, pp. 303-307, 2010.
[25] M. B. Yilmaz, B. Yanikoglu, C. Tirkaz, and A. Kholmatov, "Offline signature verification using classifier combination of HOG and LBP features", in Proc. Int Joint Conf on Biometrics, pp. 1-7, 2011.
40

Towards Automated HyperspectralDocument Image Analysis
Zohaib Khan, Faisal Shafait and Ajmal MianSchool of Computer Science and Software Engineering
The University of Western Australia, 35 Stirling Highway, CRAWLEY, 6009Email: [email protected], [email protected], [email protected]
Abstract—Hyperspectral imaging and analysis refers to thecapture and understanding of image content in multiple spectralchannels. Satellite and airborne hyperspectral imaging has beenthe focus of research in remote sensing applications since nearlythe past three decades. Recent use of ground-based hyperspectralimaging has found immense interest in areas such as medicalimaging, art and archaeology, and computer vision. In this paper,we make an attempt to draw closer the forensic community andimage analysis community towards automated forensic documentexamination. We believe that it has a huge potential to solvevarious challenging document image analysis problems, especiallyin the forensic document examination domain. We present theuse of hyperspectral imaging for ink mismatch detection inhandwritten notes as a sample application. Overall, this paperprovides an overview of the applications of hyperspectral imagingwith focus on solving pattern recognition problems. We hope thatthis work will pave the way for exploring its true potential in thedocument analysis research field.
Keywords—Multispectral imaging, Hyperspectral imaging, Hy-perspectral document analysis, forensic document examination, inkmismatch detection
I. INTRODUCTION
Human eye exhibits a trichromatic vision. This is due to thepresence of three types of photo-receptors called Cones thatare sensitive to different wavelength ranges in the visible rangeof the electromagnetic spectrum [1]. Conventional imagingsensors and displays (like cameras, scanners and monitors) aredeveloped to match the response of the trichromatic humanvision so that they deliver the same perception of the imageas in a real scene. This is why an RGB image constitutesthree spectral measurements per pixel. Most of the computervision applications do not make use of the spectral informationand directly employ grayscale images for image understanding.There is evidence that machine vision tasks can take the advan-tage of image acquisition in a wider range of electromagneticspectrum capturing more information in a scene comparedto only RGB data. Hyperspectral imaging captures spectralreflectance information for each pixel in a wide spectral range.It also provides selectivity in the choice of frequency bands.Satellite based hyperspectral imaging sensors have long beenused for astronomical and remote sensing applications. Due tothe high cost and complexity of these hyperspectral imagingsensors, various techniques have been proposed in the literatureto utilize conventional imaging systems combined with a fewoff-the-shelf optical devices for hyperspectral imaging.
Strictly speaking, an RGB image is a three channel multi-
spectral image. An image acquired at more than three specificwavelengths in a band is referred to as a Multispectral Image.Generally, multispectral imaging sensors acquire more thanthree spectral bands. An image with a higher spectral resolu-tion or more number of bands is regarded as a HyperspectralImage. There is no clear demarcation with regards to thenumber of spectral bands/resolution between multispectral andhyperspectral images. However, hyperspectral sensors mayacquire a few dozen to several hundred spectral measurementsper scene point. For example, the AVIRIS (Airborne Visi-ble/Infrared Imaging Spectrometer) of NASA has 224 bandsin 400-2500nm range [2].
During the past several years hyperspectral imaging hasfound its utility in various ground-based applications. The useof hyperspectral imaging in archeological artifacts restorationhas shown promising results. It is now possible to readthe old illegible historical manuscripts by restoration usinghyperspectral imaging [3]. This was a fairly difficult task for anaked eye due to its limited capability, restricted to the visiblespectral range. Similarly, hyperspectral imaging has also beenapplied to the task of material discrimination. This is becauseof the physical property of a material to reflect a specific rangeof wavelengths giving it a spectral signature which can beused for material identification [4]. The greatest advantage ofhyperspectral imaging in such applications is that it is non-invasive and thus does not affect the material under analysiscompared to other invasive techniques which inherently affectthe material under observation.
Despite the success of hyperspectral imaging in solvingvarious challenging computer vision problems in recent years,its use in the document image analysis research has remainedlargely unexplored. In this paper, we intend to draw theattention of the document analysis and forensics communitytowards this promising technology. We believe that there isa huge potential in hyperspectral imaging to solve variouschallenging document image analysis problems, especially inthe forensic document examination domain. First, we presentin Section II a brief survey on the applications of hyperspectralimaging in the field of pattern recognition. Then, some ofour recent work on forensic document examination usinghyperspectral imaging is discussed in Section III. The paper isconcluded with some hints about directions for future researchin Section IV.
41
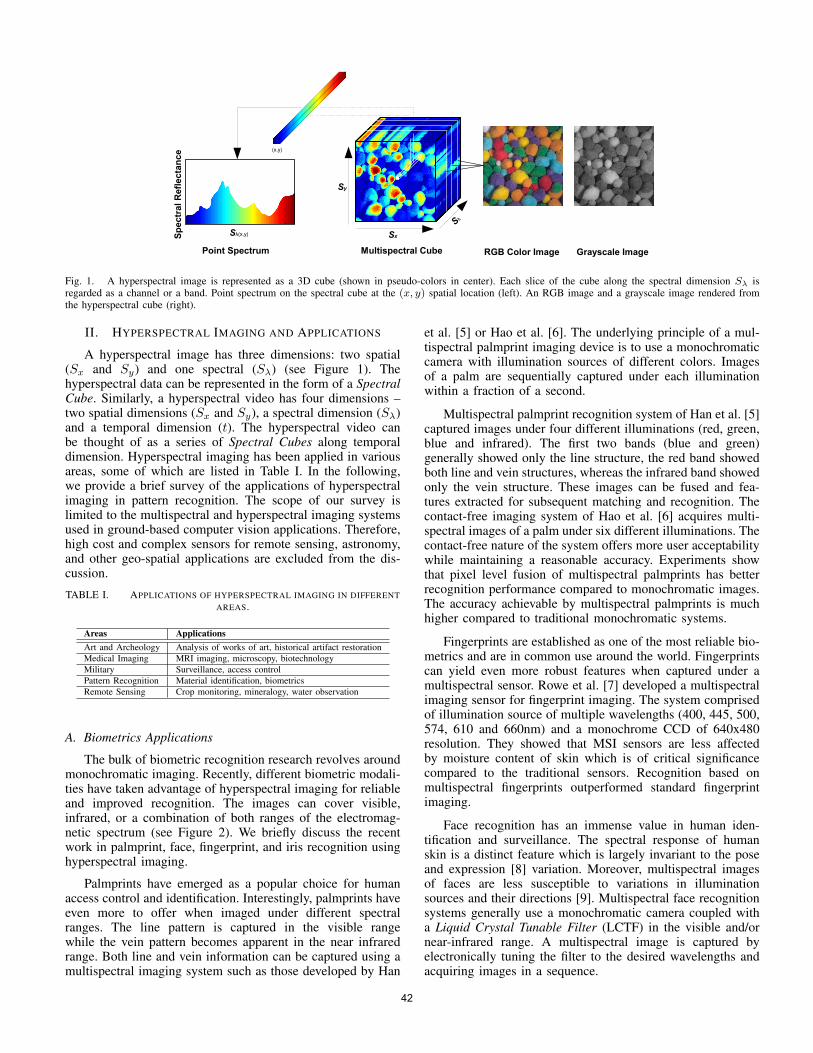
Fig. 1. A hyperspectral image is represented as a 3D cube (shown in pseudo-colors in center). Each slice of the cube along the spectral dimension Sλ isregarded as a channel or a band. Point spectrum on the spectral cube at the (x, y) spatial location (left). An RGB image and a grayscale image rendered fromthe hyperspectral cube (right).
II. HYPERSPECTRAL IMAGING AND APPLICATIONS
A hyperspectral image has three dimensions: two spatial(Sx and Sy) and one spectral (Sλ) (see Figure 1). Thehyperspectral data can be represented in the form of a SpectralCube. Similarly, a hyperspectral video has four dimensions –two spatial dimensions (Sx and Sy), a spectral dimension (Sλ)and a temporal dimension (t). The hyperspectral video canbe thought of as a series of Spectral Cubes along temporaldimension. Hyperspectral imaging has been applied in variousareas, some of which are listed in Table I. In the following,we provide a brief survey of the applications of hyperspectralimaging in pattern recognition. The scope of our survey islimited to the multispectral and hyperspectral imaging systemsused in ground-based computer vision applications. Therefore,high cost and complex sensors for remote sensing, astronomy,and other geo-spatial applications are excluded from the dis-cussion.
TABLE I. APPLICATIONS OF HYPERSPECTRAL IMAGING IN DIFFERENTAREAS.
Areas ApplicationsArt and Archeology Analysis of works of art, historical artifact restorationMedical Imaging MRI imaging, microscopy, biotechnologyMilitary Surveillance, access controlPattern Recognition Material identification, biometricsRemote Sensing Crop monitoring, mineralogy, water observation
A. Biometrics Applications
The bulk of biometric recognition research revolves aroundmonochromatic imaging. Recently, different biometric modali-ties have taken advantage of hyperspectral imaging for reliableand improved recognition. The images can cover visible,infrared, or a combination of both ranges of the electromag-netic spectrum (see Figure 2). We briefly discuss the recentwork in palmprint, face, fingerprint, and iris recognition usinghyperspectral imaging.
Palmprints have emerged as a popular choice for humanaccess control and identification. Interestingly, palmprints haveeven more to offer when imaged under different spectralranges. The line pattern is captured in the visible rangewhile the vein pattern becomes apparent in the near infraredrange. Both line and vein information can be captured using amultispectral imaging system such as those developed by Han
et al. [5] or Hao et al. [6]. The underlying principle of a mul-tispectral palmprint imaging device is to use a monochromaticcamera with illumination sources of different colors. Imagesof a palm are sequentially captured under each illuminationwithin a fraction of a second.
Multispectral palmprint recognition system of Han et al. [5]captured images under four different illuminations (red, green,blue and infrared). The first two bands (blue and green)generally showed only the line structure, the red band showedboth line and vein structures, whereas the infrared band showedonly the vein structure. These images can be fused and fea-tures extracted for subsequent matching and recognition. Thecontact-free imaging system of Hao et al. [6] acquires multi-spectral images of a palm under six different illuminations. Thecontact-free nature of the system offers more user acceptabilitywhile maintaining a reasonable accuracy. Experiments showthat pixel level fusion of multispectral palmprints has betterrecognition performance compared to monochromatic images.The accuracy achievable by multispectral palmprints is muchhigher compared to traditional monochromatic systems.
Fingerprints are established as one of the most reliable bio-metrics and are in common use around the world. Fingerprintscan yield even more robust features when captured under amultispectral sensor. Rowe et al. [7] developed a multispectralimaging sensor for fingerprint imaging. The system comprisedof illumination source of multiple wavelengths (400, 445, 500,574, 610 and 660nm) and a monochrome CCD of 640x480resolution. They showed that MSI sensors are less affectedby moisture content of skin which is of critical significancecompared to the traditional sensors. Recognition based onmultispectral fingerprints outperformed standard fingerprintimaging.
Face recognition has an immense value in human iden-tification and surveillance. The spectral response of humanskin is a distinct feature which is largely invariant to the poseand expression [8] variation. Moreover, multispectral imagesof faces are less susceptible to variations in illuminationsources and their directions [9]. Multispectral face recognitionsystems generally use a monochromatic camera coupled witha Liquid Crystal Tunable Filter (LCTF) in the visible and/ornear-infrared range. A multispectral image is captured byelectronically tuning the filter to the desired wavelengths andacquiring images in a sequence.
42

1000
nm
10 u
m
Sho
rt−W
ave
IR
100
nm
10 n
m
10 nm
Mid
dle
UV
100
um
14 u
m
7 um
5 um
3 um
1.4
um
700
nm
400
nm
300
nm
200
nm
Nea
r U
V
Nea
r IR
Mid
−Wav
e IR
Long
−Wav
e IR
Far
UV
Vis
ible
Fig. 2. The electromagnetic spectrum.
Iris is another unique biometric used for person authenti-cation. Boyce et al. [10] explored multispectral iris imagingin the visible electromagnetic spectrum and compared it tothe near-infrared in a conventional iris imaging systems. Theuse of multispectral information for iris enhancement andsegmentation resulted in improved recognition performance.
B. Material Identification
Naturally existing materials show a characteristic spectralresponse to incident light. This property of a material candistinguish it from other materials. The use of multispectraltechniques for imaging the works of arts like paintings allowssegmentation and classification of painted parts. This is basedon the pigment physical properties and their chemical com-position [3]. Pelagotti et al. [11] used multispectral imagingfor analysis of paintings. They collected multispectral imagesof a painting in UV, Visible and Near IR band. It waspossible to differentiate among different color pigments whichappear similar to the naked eye based on spectral reflectanceinformation.
Gregoris et al. [12] exploited the characteristic reflectanceof ice in the infrared band to detect ice on various surfaceswhich is difficult to inspect manually. The developed prototypecalled MD Robotics’ Spectral Camera system could determinethe type, level and location of the ice contamination on asurface. The prototype system was able to estimate thicknessof ice (<0.5mm) in relation to the measured spectral contrast.Such system may be of good utility for aircraft/space shuttleice contamination inspection and road condition monitoring insnow conditions.
Multispectral imaging has critical importance in magneticresonance imaging. Multispectral magnetic resonance imageryof brain is in wide use in medical science. Various tissuetypes of the brain are distinguishable by virtue of multispectralimaging which aids in medical diagnosis [13].
Clemmensen et al. [14] used multispectral imaging toestimate the moisture content of sand used in concrete. It is avery useful technique for non-destructive in-vivo examinationof freshly laid concrete. A total of nine spectral bands wasacquired in both visual and near infrared range. Zawada etal. [15] proposed a novel underwater multispectral imagingsystem named LUMIS (Low light level Underwater Multispec-tral Imaging System) and demonstrated its use in study ofphytoplankton and bleaching experiments.
Spectrometry techniques are also widely used to identifythe fat content in pork meat, because it has proved significantly
cheaper and more efficient than traditional analytical chemistrymethods [16]. For that purpose, near-infrared spectrometers areused that measure the spectrum of light transmitted through asample of minced pork meat.
Last but not least, multispectral imaging has also importantapplications in defense and security. For instance, Alouini [17]showed that multispectral polarimetric imaging significantlyenhances the performance of target detection and discrimina-tion.
III. FORENSIC DOCUMENT EXAMINATION USINGHYPERSPECTRAL IMAGING
Hyperspectral imaging (HSI) has recently emerged as anefficient non-destructive tool for detection, enhancement [18],comparison and identification of forensic traces [19]. Suchsystems have a huge potential for aiding forensic documentexaminers in various tasks. Brauns et al. [20] developed ahyperspectral imaging system to detect forgery in potentiallyfraudulent documents in a non-destructive manner. A more so-phisticated hyperspectral imaging system was developed at theNational Archives of Netherlands for the analysis of historicaldocuments in archives and libraries [21]. The system providedhigh spatial and spectral resolution from near-UV throughvisible to near IR range. The only limitation of the systemwas its extremely slow acquisition time (about 15 minutes)[22]. Other commercial hyperspectral imaging systems fromFoster & Freeman [23] and ChemImage [24] also allow manualcomparison of writing ink samples. Hammond [25] used visualcomparison in Lab color mode for differentiating differentblack inks. Such manual analysis of inks cannot establish thepresence of different inks with certainty, because of inherenthuman error. Here we will demonstrate a promising applicationof hyper-spectral imaging for automated writing inks mismatchdetection that we have recently proposed [26]. The work isbased on the assumption that same inks exhibit similar spectralresponses whereas different inks show dissimilarity in theirspectra. The phenomenon is illustrated in Figure 3. We assumethat the spectral responses of the inks are independent of thewriting styles of different subjects.
Using our hyperspectral imaging setup (see [26] for de-tails), a database comprising of 70 hyperspectral images ofa hand-written note in 10 different inks by 7 subjects wascollected1. All subjects were instructed to write the samesentence, once in each ink on a white paper. The pens included
1UWA Writing Ink Hyperspectral Image Databasehttp://www.csse.uwa.edu.au/%7Eajmal/databases.html
43

RGB 460nm 520nm 580nm 640nm 700nm
Fig. 3. The above images highlight the discrimination of inks offeredby hyperspectral images. We show a selected number of bands at specificwavelengths for two different blue inks (for the word ‘fox’). Notice thatonly the pixels belonging to the writing pixels are shown and the pixelsof the background are masked out. A closer look allows one to appreciatethat hyperspectral imaging captures subtle differences in the inks, which areenhanced, especially at higher wavelengths.
5 varieties of blue ink and 5 varieties of blank ink pens. It wasensured that the pens came from different manufacturers whilethe inks still appeared visually similar. Then, we producedmixed writing ink images from single ink notes by joiningequally sized image portions from two inks written by thesame subject. This made roughly the same proportion of thetwo inks under question.
The mixed-ink images were pre-processed (binariza-tion [27] followed by spectral response normalization) and thenfed to the k-means clustering algorithm with a fixed value ofk = 2. Finally, based on the output of clustering, segmentationaccuracy was computed as
Accuracy =True Positives
True Positives + False Positives + False Negatives
The segmentation accuracy is averaged over seven samples foreach ink combination Cij . It is important to note that accordingto this evaluation metric, the accuracy of a random guess (in atwo class problem) will be 1/3. This is different from commonclassification accuracy metrics where the accuracy of a randomguess is 1/2. This is because our chosen metric additionallypenalizes false negatives which are useful to quantify in asegmentation problem.
400 500 600 700
0.14
0.16
0.18
0.2
0.22
Wavelength (nm)
Mean N
orm
aliz
ed S
pectr
a
Blue Ink
Ink 1Ink 2
Ink 3
Ink 4Ink 5
400 500 600 700
0.14
0.16
0.18
0.2
0.22
Wavelength (nm)
Mean N
orm
aliz
ed S
pectr
a
Black Ink
Ink 1Ink 2
Ink 3
Ink 4Ink 5
Fig. 4. Spectra of the blue and black inks under analysis. Note that at someranges the ink spectra are more distinguished than others.
Figure 4 shows the average normalized spectra of all blueand black inks, respectively. It was achieved by computing theaverage of the spectral responses of each ink over all samplesin the database. It can be observed that the spectra of the inksare distinguished at different ranges in the visible spectrum. Aclose analysis of variability of the ink spectra in these rangesreveals that most of the differences are present in the high-visible range, followed by mid-visible and low-visible ranges.
We now inspect how hyperspectral information can bebeneficial in discrimination of inks. We compare the segmen-tation accuracy of HSI with RGB in Figure 5. As expected,
0
0.2
0.4
0.6
0.8
1
Acc
urac
y
Blue Ink
C12
C13
C14
C15
C23
C24
C25
C34
C35
C45
RGBHSI
0
0.2
0.4
0.6
0.8
1
Acc
urac
y
Black Ink
C12
C13
C14
C15
C23
C24
C25
C34
C35
C45
RGBHSI
Fig. 5. Comparison of RGB and HSI image based segmentation accuracy.
HSI significantly improves over RGB in most of the inkcombinations. This results in most accurate clustering of inkcombinations C12, C14, C12, C25, C35 and C45. In case ofblack inks, ink 1 is highly distinguished from all other inksresulting in the most accurate clustering for all combinationsC1j . However, it can be seen that for a few combinations,HSI does not show a remarkable improvement. Instead, insome cases, it is less accurate compared to RGB. These resultsencouraged us to further look at HSI in detail in order totake advantage of the most informative bands. The results ofdifferent feature (band) selection methods for this problem aredetailed in [26]. Overall, the results showed that use of a fewselected bands further improved discrimination between mostof the ink combinations.
We now present some qualitative results on segmentationof blue and black ink combinations. The original images ofa combination of two blue inks (C34) and black inks (C45)are shown are in Figure 6. RGB images are shown here forbetter visual appearance. The ground truth images are labeledin pseudo-colors, where green pixels represent the first ink andred pixels represent the second ink.
The clustering based on RGB images fails to group similarink pixels into the same clusters. A closer look reveals that allof the ink pixels are falsely grouped into one cluster, whereasmost of the boundary pixels are grouped into the other cluster.This implies that typical RGB imaging is not sufficient todiscriminate inks that appear visually similar to each other.On the other hand, segmentation based on HSI is much moreeffective compared to RGB. It can be seen that the majorityof the ink pixels are correctly grouped in HSI in accordancewith the ground truth segmentation. Note that the k-meansclustering algorithm used in this work is rather basic. Theuse of more advance clustering algorithms has the potentialof further improving the accuracy of ink segmentation.
IV. CONCLUSION AND OUTLOOK
This paper presented an overview about different appli-cations of hyperspectral imaging in pattern recognition. Wealso demonstrated a sample application of HSI in documentimage analysis, where it was possible to discriminate betweentwo visually similar inks using hyperspectral images of thedocuments. This is the first reported work on using auto-matic document image analysis methods in combination withhyperspectral imaging to address forensically relevant issuesin questioned document examination. In future, it will beinteresting to see whether spectral imaging can aid in writeridentification. Since it is possible to identify hand writings
44

Original Image
Ground Truth
Result (RGB)
Result (HSI)
Fig. 6. Example test images. For a visual comparison of RGB and HSI mismatch detection accuracy, we purposefully selected two hard cases.
by the texture [28] or ink-deposition traces [29], a promisingresearch direction would be to investigate whether these feeblevariations in ink strokes are reflected in the spectral response ofthe inks. In addition, ink or document aging is a phenomenonthat can be observed in a more effective manner using spectralimaging. During the aging process, the chemical properties ofink and paper change due to various environmental factors.Spectral imaging can potentially capture subtle differences ininks or paper due to aging. These are just a few applicationexamples where HSI can potentially provide solutions to somemajor practical problems in document analysis. We hopethat this work will open up many exciting possibilities fortackling forensic document examination problems with a newperspective.
ACKNOWLEDGMENT
This research was supported by ARC Grant DP110102399.
REFERENCES
[1] P. R. Martin, “Retinal color vision in primates,” in Encyclopedia ofNeuroscience. Springer, 2009, pp. 3497–3501.
[2] P. Shippert, “Introduction to hyperspectral image analysis,” OnlineJournal of Space Communication, vol. 3, 2003.
[3] S. Baronti, A. Casini, F. Lotti, and S. Porcinai, “Principal componentanalysis of visible and near-infrared multispectral images of works ofart,” Chemometrics and Intelligent Laboratory Systems, vol. 39, no. 1,pp. 103–114, 1997.
[4] B. Thai and G. Healey, “Invariant subpixel material detection inhyperspectral imagery,” IEEE Transactions on Geoscience and RemoteSensing, vol. 40, no. 3, pp. 599–608, 2002.
[5] D. Han, Z. Guo, and D. Zhang, “Multispectral palmprint recognitionusing wavelet-based image fusion,” in Proc. International Conferenceon Signal Processing. IEEE, 2008, pp. 2074–2077.
[6] Y. Hao, Z. Sun, T. Tan, and C. Ren, “Multispectral palm image fusionfor accurate contact-free palmprint recognition,” in Proc. InternationalConference on Image Processing. IEEE, 2008, pp. 281–284.
[7] R. K. Rowe, K. Nixon, and S. Corcoran, “Multispectral fingerprintbiometrics,” in Proc. IEEE SMC Information Assurance Workshop.IEEE, 2005, pp. 14–20.
[8] Z. Pan, G. Healey, M. Prasad, and B. Tromberg, “Face recognition inhyperspectral images,” IEEE Trans. on Pattern Analysis and MachineIntelligence, vol. 25, no. 12, pp. 1552–1560, 2003.
[9] H. Chang, A. Koschan, M. Abidi, S. G. Kong, and C.-H. Won,“Multispectral visible and infrared imaging for face recognition,” inProc. Computer Vision and Pattern Recognition Workshops. IEEE,2008, pp. 1–6.
[10] C. Boyce, A. Ross, M. Monaco, L. Hornak, and X. Li, “Multispectraliris analysis: A preliminary study,” in Proc. Computer Vision andPattern Recognition Workshops (CVPRW). IEEE, 2006.
[11] A. Pelagotti, A. Del Mastio, A. De Rosa, and A. Piva, “Multispectralimaging of paintings,” IEEE Signal Processing Magazine, vol. 25, no. 4,pp. 27–36, 2008.
[12] D. Gregoris, S. Yu, and F. Teti, “Multispectral imaging of ice,” in Proc.Canadian Conference on Electrical and Computer Engineering, vol. 4.IEEE, 2004, pp. 2051–2056.
[13] T. Taxt and A. Lundervold, “Multispectral analysis of the brain usingmagnetic resonance imaging,” IEEE Transactions on Medical Imaging,vol. 13, no. 3, pp. 470–481, 1994.
[14] L. H. Clemmensen, M. E. Hansen, and B. K. Ersbøll, “A comparison ofdimension reduction methods with application to multi-spectral imagesof sand used in concrete,” Machine Vision and Applications, vol. 21,no. 6, pp. 959–968, 2010.
[15] D. G. Zawada, “Image processing of underwater multispectral imagery,”IEEE Journal of Oceanic Engineering, vol. 28, no. 4, pp. 583–594,2003.
[16] H. H. Thodberg, “A review of bayesian neural networks with anapplication to near infrared spectroscopy,” IEEE Transactions on NeuralNetworks, vol. 7, no. 1, pp. 56–72, 1996.
[17] M. Alouini, “Target detection and discrimination through active multi-spectral polarimetric imaging,” in Computational Optical Sensing andImaging. Optical Society of America, 2005, pp. 1–8.
[18] S. Joo Kim, F. Deng, and M. S. Brown, “Visual enhancement of olddocuments with hyperspectral imaging,” Pattern Recognition, vol. 44,no. 7, pp. 1461–1469, 2011.
[19] G. Edelman, E. Gaston, T. van Leeuwen, P. Cullen, and M. Aalders,“Hyperspectral imaging for non-contact analysis of forensic traces,”Forensic Science International, vol. 223, pp. 28–39, 2012.
[20] E. B. Brauns and R. B. Dyer, “Fourier transform hyperspectral visi-ble imaging and the nondestructive analysis of potentially fraudulentdocuments,” Applied spectroscopy, vol. 60, no. 8, pp. 833–840, 2006.
[21] R. Padoan, T. A. Steemers, M. Klein, B. Aalderink, and G. de Bruin,“Quantitative hyperspectral imaging of historical documents: techniqueand applications,” ART Proceedings, 2008.
[22] M. E. Klein, B. J. Aalderink, R. Padoan, G. De Bruin, and T. A.Steemers, “Quantitative hyperspectral reflectance imaging,” Sensors,vol. 8, no. 9, pp. 5576–5618, 2008.
[23] foster + freeman, http://www.fosterfreeman.com/index.php.[24] ChemImage, http://www.chemimage.com/.[25] D. L. Hammond, “Validation of lab color mode as a nondestructive
method to differentiate black ballpoint pen inks*,” Journal of forensicsciences, vol. 52, no. 4, pp. 967–973, 2007.
[26] Z. Khan, F. Shafait, and A. Mian, “Hyperspectral imaging for inkmismatch detection,” in Proc. International Conference on DocumentAnalysis and Recognition (ICDAR), 2013.
[27] F. Shafait, D. Keysers, and T. M. Breuel, “Efficient implementation oflocal adaptive thresholding techniques using integral images,” DocumentRecognition and Retrieval XV, pp. 681 510–681 510–6, 2008.
[28] K. Franke, O. Bunnemeyer, and T. Sy, “Ink texture analysis for writeridentification,” in Proc. IEEE Workshop on Frontiers in HandwritingRecognition, 2002, pp. 268–273.
[29] K. Franke and S. Rose, “Ink-deposition model: The relation of writingand ink deposition processes,” in Proc. IEEE Workshop on Frontiers inHandwriting Recognition, 2004, pp. 173–178.
45

Fusing Modalities in Forensic Identification withScore Discretization
Y.L. Wong, S. M. Shamsuddin, S. S. YuhanizSoft Computing Research Group
Universiti Teknologi Malaysia81310 Johor, Malaysia
[email protected],[email protected],[email protected]
Sargur N. SrihariDepartment of Computer Science and Engineering
University at Buffalo,The State University of New YorkBuffalo, NY 14260 [email protected]
Abstract—The fusion of different forensic modalities for ar-riving at a decision of whether the evidence can be attributedto a known individual is considered. Since close similarity andhigh dimensionality can adversely affect the process, a method ofscore fusion based on discretization is proposed. It is evaluatedconsidering the signatures and fingerprints. Discretization isperformed as a filter to find the unique and discriminatoryfeatures of each modality in an individual class before their usein matching. Since fingerprints and signatures are not compatiblefor direct integration, the idea is to convert the features into thesame domain. The features are assigned an appropriate matchedscore, MSbp which are based to their lowest distance. The finalscores are then fed to the fusion, FSbp. The top matches withFSbp less than a predefined threshold value, η are expected tohave the true identity. Two standard fusion approaches, namelyMean and Min fusion, are used to benchmark the efficiency ofproposed method. The results of these experiments show thatthe proposed approach produces a significant improvement inthe forensic identification rate of fingerprint and signature fusionand this findings support its usefulness.
Keywords—forensic; multimodal; discretization; matchingscores; fusion; identification
I. INTRODUCTION
The goal of forensic analysis is that of determining whetherobserved evidence can be attributed to an individual. Thefinal decision of forensic analysis can take one of three val-ues: identification/no-conclusion/exclusion. Biometric systemshave a similar goal of going from input to conclusion butwith different goals and terminology: biometric identificationmeans determining the best match in a closed set of individualsand verification means whether the input and known have thesame source. While biometric systems attempt to do the en-tire process automatically, forensic systems narrow-down thepossibilities among a set of individuals with the final decisionbeing made by a human examiner. Automatic tools for forensicanalysis have been developed for several forensic modalitiesincluding signatures [1], fingerprints [2], handwriting [3], andfootwear prints or marks [4]. In both forensic analysis andbiometric analysis more than one modality of data can beused to improve accuracy [5], [6]. Examples of the need tocombine forensic evidence in forensic analysis are: signatureand fingerprints on the same questioned document, pollenfound on the clothing of an assailant together with humanDNA [7], multiple shoe-prints in a crime scene [8], etc. In
this paper we explore how evidence of different modalities canbe combined for the forensic decision. Biometric identificationsystems such as token based and password based identificationsystems, unimodal identification recognizes a user, by ”whothe person is”, using a one-to many matching process (1:M)rather than by ”what the person carries along”. Conventionalsystems suffer from numerous drawbacks such as forgottenpassword, misplaced ID card, and forgery issues. To addressthese problems, unimodal based identification was developedand has seen extensive enhancements in reliability and accu-racy of identification. However, several studies have shownthat the poor quality of image samples or the methodologyitself can lead to a significant decreasing in the performanceof a unimodal based identification system [9], [10], [11]. Thecommon issues include intra-class variability, spoof attack,non-universality, and noisy data. In order to overcome thesedifficulties in unimodal identification, multimodal based iden-tification systems (MIS) have been developed. As the namesuggests, in an MIS the identification process is based onevidence presented by multiple modality sources from anindividual. Such systems are more robust to variations in thesample quality than unimodal systems due to the presence ofmultiple (and usually independent) pieces of evidence [12].A key to successful multimodal based system developmentfor forensic identification, is an effective methodology orga-nization and fusion process, capable to integrate and handleimportant information such as distinctiveness characteristic ofan individual. Individual’s distinctive characteristics is uniqueto forensic. Therefore, in this paper, the multi-matched scoresbased discretization method is proposed for forensic identifi-cation of an individual from different modalities. Compared toprevious methods, the proposed method is unique in the sensethat the extracted features correspond to the individuality ofa particular person which are discretized and represented intostandard sizes. The method is robust and capable to overcomedimensionality issues without requiring image normalization.The low dimension and standardized features make the designof post-processing phase (classifier or decision) straightfor-ward. Moreover, the clear physical meanings of the discretizedfeatures are meaningful and distinctive, and be used in morecomplex systems (e.g., expert systems for interpretation andinference).
46

II. RELATED WORK
In identification systems, fusion takes into account a set offeatures that can reflect the individuality and characteristicsof the person under consideration. However, it is difficult toextract and select features that are discriminatory, meaningfuland important for identification. Different sets of features mayhave better performance when considering different groupsof individuals and therefore, a technique is needed to rep-resent for each sample set of features. In this paper, multi-matched scores fusion based discretization is proposed forforensic identification to represent the distinctiveness in multi-modalities of an individual.
A. Representation of individuality features
Extracting and representing relevant features which containsthe natural characteristics of an individual is essential for agood performance of the identification algorithms. Existingmultimodal based identification systems make the assumptionsthat each modality feature set from an individual is local,wide-ranging, and static. Thus, these extracted feature setsare commonly fed to individual matching or and classificationalgorithms directly.
As a result, the identification system becomes more com-plex, time consuming, and costly because a classifier is neededfor each modality. Furthermore, concatenating features fromdifferent modalities after the feature extraction method leadsto the need of comparing high dimensional, heterogeneousdata which is a nontrivial issue. However, much work hasbeen proposed to overcome the dimensional issues in extractedfeatures such as implementation of normalization techniquesafter extraction. Careful observation and experimental analysisneed to be performed in order to improve the performance ofidentification. Too much of normalization will diminish theoriginality characteristic of an individual from different modal-ity images. Thus, another process is needed to produce a morediscriminative, reliable, unique and informative feature rep-resentation to represent these inherently multiple continuousfeatures into standardized discrete features (per individual).This leads to the multi-matched score fusion discretizationapproach introduced in this paper which is explored in thecontext of forensic identification of different modalities fordistinguishing a true identity of a person.
B. The discretization algorithm
Discretization is a process whereby a continuous valuedvariable is represented by a collection of discrete values. Itattracted a lot of interest from and work in several differentdomains [13], [14], [15]. The discretization method introducedhere is based on discretization defined in [16].
Given a set of features, the discretization algorithm firstcomputes the size of interval, i.e., it determines its upperand lower bounds. The range is then divided by the numberof features which then gives each interval upper and lowerapproximation. The number of intervals generated is equalto the dimensionality of the feature vectors, maintaining theoriginal number of extracted features from different extraction
methods in this study. Subsequently, a single representationvalue for each interval, or cut, is computed by taking themidpoint of the lower approximation,Approxlower and upperapproximation, Approxupper interval. Algorithm 1 shows thediscretization steps discussed above.
Algorithm 1: Discretization AlgorithmRequire: Dataset with f continuous features, D samples and C classes;Require: Discretized features, D′ ;
for each individual doFind the Max and the Min values of D samplesnumb bin = numb extracted feature
Divide the range of Min to Max with numb bin
Compute representation values, RepV alue:
for each bin doFind the Approxlower and Approxupper
Compute the midpoints of all Approxlower and Approxupper
end for
Form a set of all discrete values, Dis Features:
for 1 to numb extracted feature dofor each bin do
if (feature in range of interval) thenDis Feature = RepV alue
end ifend for
end forend for
C. Processing and extraction of Signature and Fingerprint
For signature, the input image is first binarized by adaptivethresholding, followed by morphology operations (i.e., re-move and skel) to get the gray level of clean and universeof discourse signature image (UOD) as illustrated in Fig.1. The UOD of signature is extracted using geometrybased extraction approach [17], which is based on 3x3window concept. The process is done on individual windowinstead of the whole image to give more information ofthe signature image icludes the positions of different linestructures.
(a) (b)
(c) (d)
Original Signature Binarized Signature
Skeletonized Signature UOD
Fig. 1. Examples of preprocessed signature image (a)Original image(b)Binarized image (c)Skeletonized image (d)UOD.
For fingerprint, two types of manutia points namely termi-nation and bifurcation points are extracted using Minutiabased extraction approach. Fig. 2 shows the block diagramof minutia based extraction process. Fingerprint image arebinarized, thinned and false minutia are removed to extractthe region of interest (ROIs). Finally, the extracted ROIfor fingerprint and UOD for the signature are fed to thediscretization.
47

(a) (b)
(c) (d)
(e) (f)
1. Binarization
3. Find Minutia
5. Orientation(ROI)
Fig. 2. Examples of preprocessed fingerprint image (a)Original image(b)Binarized image (c)Thinned image (d)Minutia Points (e)False Minutiaremoved (f)ROI.
Unimodal extraction and the discretization step are illus-trated in Table I for signature data for individual 1, andTable II for the fingerprint data for the same individual.In each of these tables, the feature values are divided intopredefined number of bins, which is based on the numberof features for each modality image.In the top portion of these tables, for each bin, the lowerand upper values are recorded in columns two and threerespectively, and bin, RepV alue, the average of lower andupper values, is recorded in column four. Max and Minvalues are highlighted in bold face.In the bottom portionof the table, the discretized features for signature andfingerprint are displayed. These tables shows an example ofhow the actual feature sets from individual are discretized.As it can be seen from the Table I, the feature values,35.259 occurs for every column of the nine features for thesignature data of the same individual.This means that thefirst individual is uniquely recognized by this discriminatoryvalue. A similar discussion holds for Table II, where theset of discriminatory values for fingerprint data for firstindividual, obtained from four different images is 104.The selected features are the representation values (Dis-criminatory features, DF of an individual) that describe theunique characteristics of an individual which will be usedfor matching process. In matching module, the distancebetween the discretized values with the stored feature valuesare computed by Euclidean Distance equation as defined in(1).
EDbp =N∑i=1
(Dfbp,i −Df
(r)bp,i
)(1)
Where Dfbp,i represents ith discretized feature of newmodality image meanwhile Df
(r)bp,i defines the ith discretized
feature of reference modality image in stored templateand bp represents either behavioral or phisiological traitof the individual. The ith total number of features ex-tracted from a single modality image is denoted by N.Let Xsign = EDsign(x), where Xsign = (x1, ...xd)
denotes a distance for discretized signature features andYfinger = EDfinger(y), where Yfinger = (y1, ...yd) is adistance for the discretized fingerprint features. The lowestdistance for signature can be denoted as min[EDsign(x)]and lowest distance for fingerprint can be defined asmin[EDfinger(y)]. Then, we define the modality featureswith the lowest distance as match score-1,(MSbp = 1), thesecond modality features with the second lowest distance asMSbp = 2 and so on. bp here defines either behavioral(i.e.,signature) or phisiological(i.e., fingerprint) trait of the indi-vidual. Then, the match score, MSbp is fed to the fusionapproach.
D. Multi-modality fusion
After matching, the matched scores of signatureand fingerprint are fed to the fusion method.Let Xsign=MSsign(1),MSsign(2),...MSsign(n)denotes the computed signature match scores andY finger=MSfinger(1),MSfinger(2),...MSfinger(n)defines the computed match scores for fingerprint.In thiswork, the final fused score, FSbp of the individual arecomputed using Equation (2), where k represents thenumber of different modalities of an individual. The MSfor fingerprint and signature are combined and divided byk to generate a single score which is then compared to apredefined threshold to make the final decision.
FSbp =MSsign +MSfinger
k(2)
Fusion approaches, namely Mean, MeanFSbp and Min,MinFSbp fusion as defined in (3) and (4) are chosen forcomparisson to show the efficiency of the proposed methodon multi-modalities identification.
MeanFSbp = (xMSsign + yMSfinger)/2 (3)
MinFSbp = min(MSsign,MSfinger) (4)
Finally, the FSbp is forward to next phase for identification.In identification process of one-to-many matching (1:M),FSbp is compared with the predefined identification thresh-old, η in order to identify the individual from M individuals.In this work, the identity of a person is identified if,
FSbp ≤ η (5)
III. EXPERIMENTAL RESULTS
The performance of this work is performed using ROCcurve which consists of Genuine Acceptance Rate (GAR) ofa system mapped against the False Acceptance Rate (FAR).In this work, GAR is equal to 1-FRR. Fig. 1 shows theperformance of Unimodal identification for signature andfingerprint. Discretization is applied in this experiment. Nonormalization and fusion methods are implemented. Theperformance of the identification for both discretized signa-ture and fingerprint and non-discretized dataset is compared.
48

TABLE IEXAMPLE OF DISCRETIZATION PROCESS FOR SIGNATURE FEATURES OF FIRST INDIVIDUAL
LOW and UPPER BIN for Individual: 1MIN Value 10.8096 MAX Value 98.8273
Bin Lower Upper RepValue
0 10.8096 20.5893 15.699451 20.5893 30.3691 25.47922 30.3691 40.1488 35.2593 40.1488 49.9286 45.03874 49.9286 59.7083 54.81845 59.7083 69.4881 64.59826 69.4881 79.2678 74.37797 79.2678 89.0476 84.15778 89.0476 98.8273 93.9374
DISCRETIZED DATAf1 f2 f3 f4 f5 f6 f7 f8 f9 Class
15.69945 15.69945 35.259 35.259 15.69945 15.69945 15.69945 25.4792 25.4792 1s Discriminatory54.8184 64.5982 93.9374 35.259 15.69945 35.259 54.8184 45.0387 25.4792 1s Value is25.4792 35.259 35.259 25.4792 25.4792 54.8184 35.259 45.0387 45.0387 1s 35.25964.5982 35.259 25.4792 25.4792 35.259 74.3779 45.0387 15.69945 15.69945 1s for 1st ind.
TABLE IIEXAMPLE OF DISCRETIZATION PROCESS FOR FINGERPRINT FEATURES OF FIRST INDIVIDUAL
LOW and UPPER BIN for Individual : 1MIN Value 55 MAX Value 195Bin Lower Upper RepValue
0 55 69 621 69 83 762 83 97 903 97 111 1044 111 125 1185 125 139 1326 139 153 1467 153 167 1608 167 181 1749 181 195 188
DISCRETIZED DATAf1 f2 f3 f4 f5 f6 f7 f8 f9 f10 Class104 90 104 132 104 118 104 104 62 146 1f Discriminatory90 132 104 132 160 90 146 146 160 188 1f Value is76 90 104 132 160 62 104 104 160 181 1f 10490 104 118 132 146 132 76 62 160 160 1f for 1st ind.
From ROC graph, clearly defines that the use of discretiza-tion on the unimodal dataset enhances the overall perfor-mance of identification significantly over the performanceof identification without discretization. Due to efficiency ofthe discretization method on unimodal identification, thus,the same technique is applied to multimodal identification inorder to improve the accuracy of identification on multiplemodalities.Fig. 2 and Fig. 3 below shows the performance of ROCgraph for two different fusion methods namely Mean fu-sion rule and Min method with the implementation ofZ-Score normalization and matched scores fusion baseddiscretization approach on multiple modalities. From theROC graph depicted in Fig. 2, it can be seen that theimplementation of the proposed method based discretizationon the multi-modalities fusion of signature and fingerprintshows a better performance than the standard signature andfingerprint identification system. At FAR of 0.1%, 1.0%, and10.0%, the implementation of the proposed method whichis based on discretization has a GAR of 96.9%, 98.9%, and
Fig. 3. Performance of uni-modality identification.
99.9% respectively, where the performance is better thanthe Z-score normalization and Mean fusion on signatureand fingerprint modalities, 93.5%, 93.7%, and 96.4%. Fig.3 shows the GAR performance on Min fusion based Z-score normalization and the proposed multi-matched score
49

based discretization. Again, in Fig. 3, interestingly, theproposed method based on discretization on signature andfingerprint modalities yields the best performance over therange of FAR. At 0.1%, 1.0%, and 10.0% of FAR, the Minfusion method works the best with proposed method, 95.0%,97.99%, and 99.40% respectively. Therefore, it can be sum-marized that the used of discretization and proposed fusionof fingerprint and signature modalities generally performswell over the use of normalization and conventional fusionapproaches for personal identification.
Fig. 4. Performance of Multi-modality fusion methods for signature andfingerprint.
Fig. 5. Performance of Multi-modality fusion methods for signature andfingerprint.
IV. CONCLUSION
A key to successful multimodal based system develop-ment for forensic identification, is an effective methodologyorganization and fusion process, capable to integrate andhandle important information such as distinctiveness char-acteristic of an individual. In this paper, the match scoresdiscretization is proposed and implemented on differentmodality datasets of an individual. The experiments aredone on signature and fingerprint datasets, which consistof 156 students (both female and male) where each stu-dent contributes 4 samples of signatures and fingerprint.Ten features describing the bifurcation and terminationpoints of fingerprint, were extracted using Minutia basedextraction approach whereas signature is extracted usingGeometry based extraction approach. In matching process,each template-query pair feature sets is compared usingEuclidean distance. Two fusion approaches namely Mean
and Min fusion are performed to seek for the efficiencyof the proposed method in Multimodal identification. Theexperimental results show that the proposed multi-matchedscores discretization perform well on multiple set of in-dividual traits, consequently improving the identificationperformance.
ACKNOWLEDGMENT
This work is supported by The Ministry of Higher Education(MOHE) under Research University Grant (GUP) and My-brain15. Authors would especially like to thank UniversitiTeknologi Malaysia, Skudai Johor Bahru MALAYSIA forthe support and Soft Computing Research Group (SCRG)for their excellent cooperation and contributions to improvethis paper.
REFERENCES
[1]S. N. Srihari, “Computational methods for handwritten questioneddocument examination,” National Criminal Justice Research Report,2010.
[2]C. Su and S. Srihari, “Evaluation of rarity of fingerprints in forensics,”Advances in Neural Information Processing Systems, vol. 23, pp. 1207–1215, 2010.
[3]S. N. Srihari and K. Singer, “Role of automation in the examination ofhandwritten items,” in Frontiers in Handwriting Recognition (ICFHR),2012 International Conference on. IEEE, 2012, pp. 619–624.
[4]Y. Tang, H. Kasiviswanathan, and S. N. Srihari, “An efficientclustering–based retrieval framework for real crime scene footwearmarks,” International Journal of Granular Computing, Rough Sets andIntelligent Systems, vol. 2, no. 4, pp. 327–360, 2012.
[5]J. Gonzalez-Rodriguez, J. Ortega-Garcia, and J.-L. Sanchez-Bote,“Forensic identification reporting using automatic biometric systems,”in Biometric Solutions. Springer, 2002, pp. 169–185.
[6]J. Gonzalez-Rodriguez, J. Fierrez-Aguilar, D. Ramos-Castro, andJ. Ortega-Garcia, “Bayesian analysis of fingerprint, face and signa-ture evidences with automatic biometric systems,” Forensic scienceinternational, vol. 155, no. 2-3, pp. 126–140, 2005.
[7]K. J. Craft, J. D. Owens, and M. V. Ashley, “Application of plantdna markers in forensic botany: Genetic comparison of¡ i¿ quercus¡/i¿evidence leaves to crime scene trees using microsatellites,” Forensicscience international, vol. 165, no. 1, pp. 64–70, 2007.
[8]Y. Tang, S. N. Srihari, H. Kasiviswanathan, and J. J. Corso, “Footwearprint retrieval system for real crime scene marks,” in ComputationalForensics. Springer, 2011, pp. 88–100.
[9]A. Jain and A. Ross, “Introduction to biometrics,” Handbook ofBiometrics, pp. 1–22, 2008.
[10]A. Ross, K. Nandakumar, and A. Jain, “Introduction to multibiomet-rics,” Handbook of Biometrics, pp. 271–292, 2008.
[11]N. Solayappan and S. Latifi, “A survey of unimodal biometric meth-ods,” in Proceedings of the 2006 International Conference on Securityand Management, 2006, pp. 57–63.
[12]A. Ross and A. Jain, “Information fusion in biometrics,” Patternrecognition letters, vol. 24, no. 13, pp. 2115–2125, 2003.
[13]H. Liu, F. Hussain, C. L. Tan, and M. Dash, “Discretization: Anenabling technique,” Data mining and knowledge discovery, vol. 6,no. 4, pp. 393–423, 2002.
[14]R. Ahmad, M. Darus, S. M. H. Shamsuddin, and A. A. Bakar,“Pendiskretan set kasar menggunakan taakulan boolean terhadap pen-caman simbol matematik,” Journal Teknologi Maklumat & Multimedia,pp. 15–26, 2004.
[15]B. O. Mohammed and S. M. Shamsuddin, “Feature discretizationfor individuality representation in twins handwritten identification,”Journal of Computer Science, vol. 7, no. 7, pp. 1080–1087, 2011.
[16]A. Muda, S. Shamsuddin, and M. Darus, “Invariants discretization forindividuality representation in handwritten authorship,” ComputationalForensics, pp. 218–228, 2008.
[17]K. Huang and H. Yan, “Off-line signature verification based ongeometric feature extraction and neural network classification,” PatternRecognition, vol. 30, no. 1, pp. 9–17, 1997.
50

Joint Glossary of Forensic Document Examinationand Pattern Recognition
Ines BaldattiBanco Central de la Republica Argentina
Buenos Aires, ArgentinaEmail: [email protected]
Erika GriechischUniversity of Szeged, HungaryH-6720 Szeged, Arpad ter 2.
Email: [email protected]
Abstract—In this paper we introduce an open, scientific glos-sary which uses MediaWiki engine to the forensic examiner andpattern recognition scientific communities. Besides our aim tofind editors from these communities who contribute to extendthe glossary and make it as complete as possible, we would liketo translate the terms from English to other languages, e.g. Por-tuguese, German, Chinese, Japanese, Arabian. The contributioncan be started with translating the existing words at the glossary.The second part of our work when the glossary become be morecompleted, will consist into create the very understanding anduseful glossary.
I. INTRODUCTION
In the last few years there were more and more communi-cation and joint research between the forensic examiners andpattern recognition scientists. These two communities can ef-ficiently work together, if they understand the terms from bothsciences. We have seen and heard on meetings, conferences,workshops, and during discussions it is a necessity to havea useful, extendable glossary, and dictionary which helps thecommon work.
Our aim is to create a glossary and a dictionary withthe important terms of the forensic science for the foren-sic document examiners and pattern recognition experts indifferent languages. We are considering even the differentexpressions among countries who share the same languagein order to obtain a better understanding into our fields nomatter where we are from. Thinking and hoping this work willbe a useful tool for both: the forensic and pattern recognitioncommunities.
The long name of the glossary is Glossary of ForensicDocument Examination and Pattern Recognition and the shortname is GoFDER. The site is availabe on the http://projects.dfki.uni-kl.de/gofder/index.php URL. Figure 1 shows the logoof the glossary which depicts an important tool of the forensicscientist.
A. Related work
An offline glossary from 1999 is [2] which integrates firsttime in publishing terms from forensic science. The ForensicScience Central is a great contribution with links and forum,but its own glossary [3] contains only a small portion of def-inition, there is no dictionary and it is not extendible. Similarholds for the website of ThinkQuest [4], in addition there areless terms and the terms there were not described by experties,
the reference marked on the page is only Google search.The multilingua lexicon of European Network of ForensicScience Institutes (ENFSI) is a great contribution created byseveral forensic institute, founded in 1999. It contains severalwords in many languages, but it is only a dictionary, withoutexplanation, descriptions.
B. Authors
The first author Ines Rosa Baldatti is a forensic documentexaminer, analyst of Payment Systems at the Central Bankof Argentina Republic. The second author Erika Griechischis a PhD student at the University of Szeged (Institute ofInformatics), her topic is online signature verification. Furtherauthors are every colleague who would like to contribute.
1) Beginning: The authors met at First International Work-shop on Automated Forensic Handwriting Analysis (AFHA)in 2011, Beijing, China. In that opportunity it was clear thenecessity to get a good understanding and a fluid contactamong professionals worldwide. So, we decide to make thiswork, that takes a long time and dedication, and responsibility.
2) Creating: We read papers and books and websites, andextract the terms from them keeping the meaning.
II. TECHNICAL BACKGROUND
Nowadays a glossary or dictionary which is available onlyin printed version is not really useful. An online glossary ismore useful than a printed one and it can be easily printed if itis necessary. Several criteria should meet, which are feasibleonly if the glossary is an online one.
Fig. 1. The logo of the project
51

Fig. 2. WikiEditor: WikiText and Preview (above), Changes (below)
The most important criterion is the expandability of theglossary. There will be always terms which can be added, notnecessary because there incompleteness of the glossary itselfrather the expension of the scientist. Regarding the expansion,it is much easier to correct errors in an existing online websitethan a book.
Other consideration was the possibility of localization of theglossary. We know for the translation part it is necessary to beclean and easy otherwise we can expect only few translators.
In this section we introduce and describe the MediaWikipackage and its extensions which were most suitable for ourpurposes.
A. MediaWiki
MediaWiki (MW) is a versatile package, written in PHPand originally developed for use on Wikipedia since 2002. Itis very widespread, well-documented, can handle any kind ofmedia easily (links, images, videos, etc), moreover it is open-source which makes it easier to discover and fix any kindof bugs. The MediaWiki package quite flexible and furtherfunctionalities can be easily integrated to a basic MediaWikiwebsite.
MediaWiki uses a markup language called wikitext to usebasic formatting so the users without knowledge of HTMLcan edit the pages easily. We added the WikiEditor extensionto the GoFDER website, which allows the users to see 3different view during the editing. The first one is the plainwikitext, the second is a preview, the third one shows thedifferences between the previous version of the page and thecurrent (edited) version. Thus if someone is new in wikitextmarkup language, s/he can simply check the Preview beforesubmission, see Figure 2.
In order to achieve our goals, to create a multilingual
glossary with dictionary, a basic MediaWiki is not sufficient.Thus we added other extension to improve the efficiency. Inthe following we describe each of them.
B. Semantical MediaWiki
Semantical MediaWiki (often noted by SMW) is an exten-sion of MediaWiki that helps to search, organise, tag, browse,evaluate and share the wiki’s content [8] since 2005.
While a traditional Wikipedia site contains text which isuseful and can be processed easily by humans, it is not easyto understand or evaluate for a computers. The Semantical Me-diaWiki helps to extend a capability of a Wiki site by addingannotations, which makes wiki a collaborative database.
Semantical MediaWiki itself has several extension too, weadded the Semantic Glossary to our website, which helps todescribe terms with the Terminology page of the wiki. Thereader of a page just point to a word with the mouse and ifthe Terminology page contains that word, it’s description willappear in a small box below the word.
C. Translate extension
The Translate extension makes MediaWiki a powerful toolto translate every kind of text. [7]
It runs inside MediaWiki and has many features for transla-tors, however its usage is very simple. After a page is markedwith the <translation> tag, the extension automaticallysplits the text between the translation tag to translation units.The arrangment of the translation units can be approved orredefined if it is necessary. According to the default settingseach translation unit is one paragraph. After the arrangementof the translation units are saved, the page can be translatedvia a translation tool. Figure 3 and 4 show two view of atranslation page, translators can use which are more convinientfor them.
52

Fig. 3. Translate a page: List view
Fig. 4. Translate a page: Proofread view
Users can choose the language they intend to translatefrom a list. On the GoFDER website there is a predefinedlist on the top of all the translatable webpages which showsthe languages we primarily intend to find translators (thefirst author of this paper is responsible mainly for Spanishtranslations, the second is about Hungarian). Neverthelessthere is no language restrictions, contributors are welcome totranslate to any language.
If an original English wikipage (which is marked for trans-lation) has any changes, on the top of the page there will be anote about that and each unit which is effected will be markedas outdated translation.
III. CONTRIBUTION
Recently (end of May, 2013) the glossary has 20 pages(terms), the dictionary has 561 English words with Spanishtranslation and some Hungarian translation as well.
A. New terms
We encourage forensic document examiners to extend theglossary and the dictionary as well, comment the recent termson the discussion pages, ask if something is not clear orcomplete. We want to keep our glossary professional, so onour wiki site it is not possible to edit or modify pages withoutregistration. After registration and login, users can modify thepages.
B. TranslationWe would like to translate the terms from English primarily
to Spanish, German and Hungarian. In the same way toincrease the dictionary, we plan to add new languages as well.We hope to attain contributors who can create the Portuguese,Chinese, Japanese, Arabian, etc translation.
The translations are available for a page if it is marked fortranslation. Every registered user can translate sites, but onlytranslation administrators can mark pages for translation andconfirm completed translations. If a user creates a page ands/he is member of the Translation group, s/he can mark it fortranslation. if s/he is not member of this group, she can asksomeone from the Translation group.
More details about editing and translating are available onthe Contribution page of the website.
IV. CONCLUSION
Here we presented the conception and initation of our work.The technical background of the glossary have been prepared.However we are still open for suggestions and ideas to improvethe website. From now on the main part of the project is to addnew terms, specify and extend the existing ones, add examplesand explanation as many as possible.
We expect as an outcome of our common effort with thecontributors that we can provide a useful, up-to-date andbeneficial glossary for the scientific community.
53

ACKNOWLEDGEMENT
The second author was supported by the TAMOP-4.2.4B/2-11/1-2012-0001 project.
REFERENCES
[1] GoFDER website (May 2013 – )http://projects.dfki.uni-kl.de/gofder/
[2] John C. Brenner: Forensic Science Glossary, 1999, CRC Press (184pages), http://www.crcpress.com/product/isbn/9780849311963
[3] Forensic Science Glossary of Forensic Science Central (May 2013)http://www.forensicsciencecentral.co.uk/glossary.shtml
[4] ThinkQuest Glossary (May 2013)http://library.thinkquest.org/04oct/00206/text glossary.htm
[5] MULTILINGUA lexicon (May 2013)http://www.ies.krakow.pl/multilingua/welcome
[6] MediaWiki website (May 2013), http://www.mediawiki.org[7] Translate Extension (May 2013)
http://www.mediawiki.org/wiki/Extension:Translate[8] Semantic MediaWiki (May 2013), http://semantic-mediawiki.org
54

NavigationNavigation
Main page
Glossary
Dictionary
Recent changes
Help
Personal toolsPersonal tools
English
Create account
Log in
ToolboxToolbox
What links here
Related changes
Special pages
Printable version
Permanent link
Browse properties
GoFDERGoFDER
lossary of Forensic Document Examination and Pattern Recognitionlossary of Forensic Document Examination and Pattern Recognition
Other languages: Arabic • �German • �English • �Spanish • �Hungarian
This is the test website of the GoFDER project (Glossary of Forensic Document Examination & Pattern Recognition).
Our aim is to create a glossary and a dictionary with the important terms of the forensic science for the forensicdocument examiners and pattern recognition experts in different languages. We are considering even the differentexpressions among countries who share the same language in order to obtain a better understanding into ourfields no matter where we are from. Thinking and hoping this work will be a useful tool for both: the forensic andpattern recognition community.
If you have any suggestion, related request or just want to contribute, please contact us or/and register!
Looking forward to your comments,
Inés Baldatti and Erika Griechisch
Search Search Go Search
PageDiscussionView sourceHistory
Fig. 5. Main page
NavigationNavigation
Main page
Glossary
Dictionary
Recent changes
Help
Personal toolsPersonal tools
English
Create account
Log in
ToolboxToolbox
Special pages
All pagesAll pages
All pages
Display pages starting at:
Display pages ending at:
Namespace: (Main) Hide redirects Go
All pages
Characteristic Class characteristic ComparisonContribution Copybook form DictionaryDocument Document Examiner ExaminationExemplar Exemplar/en Exemplar/huExpert Witness Forensic science GoFDERGoFDER/de GoFDER/en GoFDER/esGoFDER/hu Graphology Graphology/enHabit Habit/en HandwritingHandwriting/en Handwriting recognition Infrared luminescenceInfrared luminescence/en Infrared luminescence/es Infrared luminescence/huList of abbreviations List of writings Main Page/deMain Page/en Main Page/es Main Page/huSignature Signature/en Signature/esSignature/hu
Privacy policy About Glossary of Forensic Document Examination & Pattern Recognition DisclaimersCavendish Skin
Search Search Go Search
Special page
Fig. 6. Glossary – All pages
55