2.Business Mgmt - IJBMR -Impact of Liberalization on - Rajeev Ranjan
12
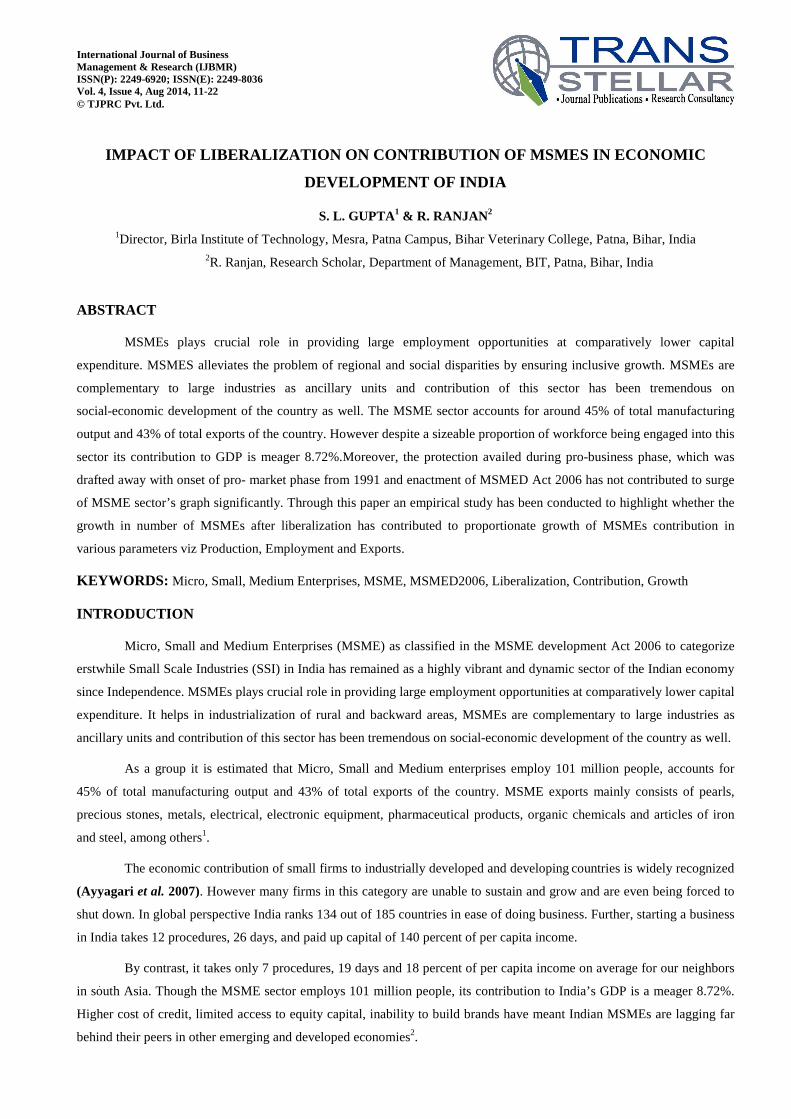
IMPACT OF LIBERALIZATION ON CONTRIBUTION OF MSMES IN ECONOMIC DEVELOPMENT OF INDIA S. L. GUPTA 1 & R. RANJAN 2 1 Director, Birla Institute of Technology, Mesra, Patna Campus, Bihar Veterinary College, Patna, Bihar, India 2 R. Ranjan, Research Scholar, Department of Management, BIT, Patna, Bihar, India ABSTRACT MSMEs plays crucial role in providing large employment opportunities at comparatively lower capital expenditure. MSMES alleviates the problem of regional and social disparities by ensuring inclusive growth. MSMEs are complementary to large industries as ancillary units and contribution of this sector has been tremendous on social-economic development of the country as well. The MSME sector accounts for around 45% of total manufacturing output and 43% of total exports of the country. However despite a sizeable proportion of workforce being engaged into this sector its contribution to GDP is meager 8.72%.Moreover, the protection availed during pro-business phase, which was drafted away with onset of pro- market phase from 1991 and enactment of MSMED Act 2006 has not contributed to surge of MSME sector’s graph significantly. Through this paper an empirical study has been conducted to highlight whether the growth in number of MSMEs after liberalization has contributed to proportionate growth of MSMEs contribution in various parameters viz Production, Employment and Exports. KEYWORDS: Micro, Small, Medium Enterprises, MSME, MSMED2006, Liberalization, Contribution, Growth INTRODUCTION Micro, Small and Medium Enterprises (MSME) as classified in the MSME development Act 2006 to categorize erstwhile Small Scale Industries (SSI) in India has remained as a highly vibrant and dynamic sector of the Indian economy since Independence. MSMEs plays crucial role in providing large employment opportunities at comparatively lower capital expenditure. It helps in industrialization of rural and backward areas, MSMEs are complementary to large industries as ancillary units and contribution of this sector has been tremendous on social-economic development of the country as well. As a group it is estimated that Micro, Small and Medium enterprises employ 101 million people, accounts for 45% of total manufacturing output and 43% of total exports of the country. MSME exports mainly consists of pearls, precious stones, metals, electrical, electronic equipment, pharmaceutical products, organic chemicals and articles of iron and steel, among others 1 . The economic contribution of small firms to industrially developed and developing countries is widely recognized (Ayyagari et al. 2007). However many firms in this category are unable to sustain and grow and are even being forced to shut down. In global perspective India ranks 134 out of 185 countries in ease of doing business. Further, starting a business in India takes 12 procedures, 26 days, and paid up capital of 140 percent of per capita income. By contrast, it takes only 7 procedures, 19 days and 18 percent of per capita income on average for our neighbors in south Asia. Though the MSME sector employs 101 million people, its contribution to India’s GDP is a meager 8.72%. Higher cost of credit, limited access to equity capital, inability to build brands have meant Indian MSMEs are lagging far behind their peers in other emerging and developed economies 2 . International Journal of Business Management & Research (IJBMR) ISSN(P): 2249-6920; ISSN(E): 2249-8036 Vol. 4, Issue 4, Aug 2014, 11-22 © TJPRC Pvt. Ltd.
-
Upload
tjprc-publications -
Category
Documents
-
view
14 -
download
1
description
Publication Journal
Transcript of 2.Business Mgmt - IJBMR -Impact of Liberalization on - Rajeev Ranjan
IMPACT OF LIBERALIZATION ON CONTRIBUTION OF MSMES I N ECONOMIC
DEVELOPMENT OF INDIA
S. L. GUPTA1 & R. RANJAN 2
1Director, Birla Institute of Technology, Mesra, Patna Campus, Bihar Veterinary College, Patna, Bihar, India 2R. Ranjan, Research Scholar, Department of Management, BIT, Patna, Bihar, India
ABSTRACT
MSMEs plays crucial role in providing large employment opportunities at comparatively lower capital
expenditure. MSMES alleviates the problem of regional and social disparities by ensuring inclusive growth. MSMEs are
complementary to large industries as ancillary units and contribution of this sector has been tremendous on
social-economic development of the country as well. The MSME sector accounts for around 45% of total manufacturing
output and 43% of total exports of the country. However despite a sizeable proportion of workforce being engaged into this
sector its contribution to GDP is meager 8.72%.Moreover, the protection availed during pro-business phase, which was
drafted away with onset of pro- market phase from 1991 and enactment of MSMED Act 2006 has not contributed to surge
of MSME sector’s graph significantly. Through this paper an empirical study has been conducted to highlight whether the
growth in number of MSMEs after liberalization has contributed to proportionate growth of MSMEs contribution in
various parameters viz Production, Employment and Exports.
KEYWORDS: Micro, Small, Medium Enterprises, MSME, MSMED2006, Liberalization, Contribution, Growth
INTRODUCTION
Micro, Small and Medium Enterprises (MSME) as classified in the MSME development Act 2006 to categorize
erstwhile Small Scale Industries (SSI) in India has remained as a highly vibrant and dynamic sector of the Indian economy
since Independence. MSMEs plays crucial role in providing large employment opportunities at comparatively lower capital
expenditure. It helps in industrialization of rural and backward areas, MSMEs are complementary to large industries as
ancillary units and contribution of this sector has been tremendous on social-economic development of the country as well.
As a group it is estimated that Micro, Small and Medium enterprises employ 101 million people, accounts for
45% of total manufacturing output and 43% of total exports of the country. MSME exports mainly consists of pearls,
precious stones, metals, electrical, electronic equipment, pharmaceutical products, organic chemicals and articles of iron
and steel, among others1.
The economic contribution of small firms to industrially developed and developing countries is widely recognized
(Ayyagari et al. 2007). However many firms in this category are unable to sustain and grow and are even being forced to
shut down. In global perspective India ranks 134 out of 185 countries in ease of doing business. Further, starting a business
in India takes 12 procedures, 26 days, and paid up capital of 140 percent of per capita income.
By contrast, it takes only 7 procedures, 19 days and 18 percent of per capita income on average for our neighbors
in south Asia. Though the MSME sector employs 101 million people, its contribution to India’s GDP is a meager 8.72%.
Higher cost of credit, limited access to equity capital, inability to build brands have meant Indian MSMEs are lagging far
behind their peers in other emerging and developed economies2.
International Journal of Business Management & Research (IJBMR) ISSN(P): 2249-6920; ISSN(E): 2249-8036 Vol. 4, Issue 4, Aug 2014, 11-22 © TJPRC Pvt. Ltd.
12 S. L. Gupta & R. Ranjan
Impact Factor (JCC): 4.9926 Index Copernicus Value (ICV): 3.0
Definition of Micro, Small and Medium Enterprise
The definition for small-scale sector undertakings has changed over time. Initially they were classified into two
categories- those using power with less than 50 employees and those not using power with the employee strength being
more than 50 but less than 100.
Definition of MSME’s in India
Micro, Small and Medium Enterprises Development Act, 2006, notifies the following enterprises, whether
proprietorship, Hindu undivided family, association of persons, co-operative society, partnership or undertaking or any
other legal entity, by whatever name be called:
In case of Enterprises engaged in manufacturing or production of goods pertaining to any industry specified in the
first schedule of the Industries (Development and Regulation) Act, 1951, as-
• A micro enterprise, where the investment in plant and machinery does not exceed twenty five lakh rupees;
• A small enterprise where the investment in plant and machinery is more than twenty five lakh rupees but does not
exceed five crore rupees.
• A medium enterprise, where the investment in plant and machinery is more than five crore rupees but does not
exceed ten crore rupees.
• Economic survey, 2012-13.
• World Bank’s Ease of doing business report for 2014 published in Hindustan Times, Nov 01, 2013.
• In case of enterprises engaged in providing or rendering of services, as-
• A Micro enterprise, where the investment in equipment does not exceed ten lakh rupees;
• A small enterprise where the investment in equipment is more than ten lakh rupees but does not exceed two crore
rupees
• A medium enterprise where the investment in equipment is more than two crore rupees but does not exceed five
crore rupees.
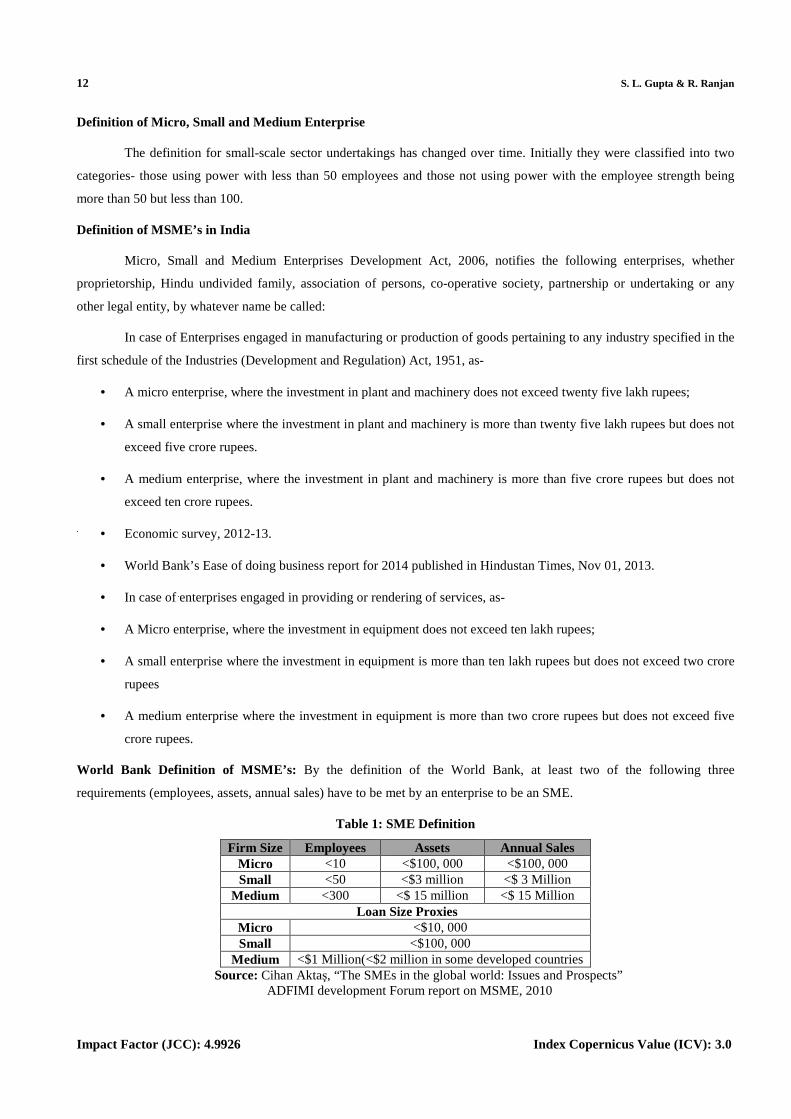
World Bank Definition of MSME’s: By the definition of the World Bank, at least two of the following three
requirements (employees, assets, annual sales) have to be met by an enterprise to be an SME.
Table 1: SME Definition
Firm Size Employees Assets Annual Sales Micro <10 <$100, 000 <$100, 000 Small <50 <$3 million <$ 3 Million
Medium <300 <$ 15 million <$ 15 Million Loan Size Proxies
Micro <$10, 000 Small <$100, 000
Medium <$1 Million(<$2 million in some developed countries Source: Cihan Aktaş, “The SMEs in the global world: Issues and Prospects”
ADFIMI development Forum report on MSME, 2010

Impact of Liberalization on Contribution of MSMES i n Economic Development of India 13
www.tjprc.org [email protected]
Literature Review
Grant Thornton and FICCI, (2013) has stressed that in the face of emerging challenges and the need to
strengthen global outreach it has become imperative for the MSME sector to demonstrate greater competitiveness and
position themselves strategically along the value chain. Report highlights specific models and approaches that MSMEs
could explore to plug into new market opportunities. The report also provides an insight into innovative marketing tools,
along with ways in which traditional strategies could be sharpened as companies strive to become globally competitive.
Today it is not individual enterprises that compete against each other, but global value chains that are mostly competing at
a global level. This makes it imperative for Indian MSMEs to evolve not only more innovative offerings, but also offer
greater value to their partners so that most competitive and mutually beneficial outcomes become possible. For instance, to
achieve the objective of becoming a preferred supplier in the global value chain, MSMEs would have to enhance adherence
to international standards and norms. Adapting to competitive pressures has implied an increase in the outsourcing of
activities. To improve their competitiveness, firms concentrate on core competencies and activities with the highest added
value, and outsource non-core activities. This has led global companies to increasingly outsource non-core activities to
MSMEs across the world and procure from regions which provide maximum value, and add in terms of product quality
and cost. Further, with the support of the Chinese government and huge amounts of subsidies (subsidy on import of raw
material for the purpose of export at the end of the production, special government fund to support technology innovation
of MSMEs etc).Chinese business partners have been able to deliver results to American corporations propelling U.S.
companies to partner with Chinese MSMEs.
IBEF report on MSME, (2013) has reported that MSME landscape has matured over time and moved up the
value chain. The MSME sector has evolved from the manufacturing of traditional products to much more hybrid products
to the value-added services segment. This transition has been majorly fuelled by the consortium approach adopted by
MSMEs. MSMEs owes much of their success to Industrial Clusters. Firms in the MSME sector that were earlier facing
difficulties in achieving economies of scale, specialization and innovation due to their small size are now increasingly
benefitting from the advent of industrial clusters. The MSME sector is the second largest employment generator in India
after agriculture. It generated employment for 73.2 million people in FY11; the figure is set to increase by another 12.0
million over FY12–14. MSMEs are a key source of employment for low-skilled and semi-skilled workers.
Spithoven A. et al. (2013) focused upon open innovation (OI) practices in small and medium-sized enterprises.
The lack of resources in SMEs to engage in looking outward is said to be a barrier to OI, but at the same time this shortage
is cited as a motive for looking beyond organizational boundaries for technological knowledge. The study has investigated
upon how OI dimensions impact the innovative performance of SMEs in comparison to large companies. The key finding
is that the effects of OI practices in SMEs often differ from those in large firms. SMEs are more effective in using different
OI practices simultaneously when they introduce new products on the market, whereas this is less the case for large firms.
Turnover from new products in SMEs is driven by intellectual property protection mechanisms, while large firms in this
case benefit more from their search strategies.
FICCIs Economic Impact analysis report, (2013) states that out of 951 SMEs surveyed covering 14 Industrial
Clusters in 19 Geographical Clusters of India, Internet use in SMEs can lead to 32% higher revenues, 43% higher profits,
37% higher employment, 35% higher employment growth and 32% more customers. According to benefits cited by
respondents Perceived benefits of the Internet can be listed as: 69% SMEs report increase in customers, 65% report

14 S. L. Gupta & R. Ranjan
Impact Factor (JCC): 4.9926 Index Copernicus Value (ICV): 3.0
increase in profits, 64% in sales, 63% in geographic reach and 44% in employment. Also, 27% of Internet using SMEs
engage in e-commerce. 61% of Internet using SMEs worry about security. 44% of Internet-non using SMEs feel IT
equipment costs are too high and 28% feel Internet connection costs are too high for them to adopt the Internet.
Chandraiah M. (2013) focused on economic policy introduced by government of India in 1991 that gave thrust
towards Globalization process. Globalization in India was adopted to integrate the economy of the country with world
economy. The policy shift at the behest of IMF and World Bank has led to Unequal competition between Multinational
companies and small Indian enterprises. As Small sector is a vital constituent of overall industrial sector of any country
particularly India there is need promote this sector.
Lahiri R. (2012) has analyzed the definitional aspect of MSMEs and explore the opportunities enjoyed and the
constraints faced by them in the era of globalization. Annual Average Growth rate (AAGR) has been used as the major
statistical tool to compare the performances of MSMEs during pre and post-liberalization period with the help of four
economic parameters namely No. of units, production, employment and export. The study results show that except
marginal increase in growth rate in employment generation, the growth rate in other parameters is not encouraging during
the liberalization period. In the study it has also been highlighted that MSMEs in India face a tough situation due to
extreme competition from large industries due to withdrawal of subsidy, lack of infrastructure, anti dumping policy,
challenges on product Standardization, total quality management etc.
Sengupta R. and Kumar G. (2011) In recent years, India’s international trade policy has been increasingly
moving away from WTO’s multilateral framework towards Free Trade Agreements (FTAs). While the WTO’s multilateral
trade framework obliges its member countries to reduce border duties and adhere to higher labour and environmental
standards, FTAs aim at total elimination of all tariffs and contain many items that are not part of the rules of the WTO.
Since FTAs have such wide coverage they can create a significant impact on domestic production system. As a result,
FTAs may severely impact the growth prospects of certain key sectors of the economy including the Micro, Small and
Medium Enterprises (MSME) sector. The food processing industry in India offers huge potential for growth and income
and employment generation. It is the largest segment of the MSME sector. Its potential and significance in terms of
creation of jobs, household oriented business opportunities (griha udyog), as well as providing a wide range of processed
food at relatively cheaper prices to India’s population is undeniable. It is also a gender-sensitive sector as there are
segments with high women’s participation in work force as well as in entrepreneurship.
Ramraj, P. (2010) reported that on an average, SMEs with large corporate customers carry receivables valued at
80 days of sales on their balance sheet: 15% of such SMEs carry receivables of more than 120 days. This has a significant
impact on the financial position of SMEs, strains their balance sheets significantly and vitiates financial ratios.
CRISIL estimates that timely payments by large corporate in line with the provisions of the MSMED Act will help SMEs
reduce interest costs, and improve profitability by about 15 per cent. This will have a critical bearing on the long-term
health and sustainability of India's SME sector.
Sonia, Kansai R. (2009) studied the effects of globalization on Micro, Small and Medium Enterprises (MSMEs)
during pre and post liberalization from 1973-74 to 2008-09. They used four economic parameters namely number of units,
production, employment and export and interpreted study results based on Annual Average Growth Rate (AAGR)
calculation. AAGR in pre liberalization period (1973-74 to 1989-90) was higher in all selected parameters than that of post

Impact of Liberalization on Contribution of MSMES i n Economic Development of India 15
www.tjprc.org [email protected]
liberalization period (1991-92 to 2007-08). They concluded that MSMEs failed to put up an impressive performance in
post reform era.
Ravi S. (2009) has observed that policy recommendation of MSME development act of 2006 has not been able to
resolve some of the ongoing debates in this sector. Specific policies that are aimed at the MSME sector have limited impact
on the growth of this sector, whereas more general development policies such as expenditure on infrastructure and access
to finance have significantly positive impact on growth of the MSME sector across states in India over the last 15 years.
It has been suggested that perhaps the government should play a facilitator role and improve access to finance by
encouraging more banks and other financial institutions to enter the local market, instead of becoming an active player
itself.
Ghatak S. (2009) has discussed about the policy environment for promoting MSME changed from protectionism
during Pre-1990 to export orientation during Post 1990’s.Key constraints affecting MSMEs includes access to credit,
technology and red tapism. These key issues should be eliminated to make MSMEs perform better.
Need and Objectives of the Study
Micro, Small and Medium Enterprises in India has been confronted with an increasingly competitive environment
due to transformations brought about in Micro and Macro environments following a series of policy changes brought about
by Government (i) Policy of Liberalization, Privatization and Globalization favouring foreign direct investment at the
international level, (ii) Formation of the World Trade Organizations (WTO) in 1995, mandating member- countries to scale
down restrictions on imports, and (iii) Gradual erosion of protection regime for MSMEs in domestic market. Impact of all
these developments forced MSMEs to to ‘compete’. “Globalization has led to unequal competition- a competition between
giant MNCs and dwarf Indian enterprises”, Chandraiah M. (2013).
Some of the objectives which is aimed to be accomplished through this paper can be listed as follows.
• Ascertain the growth rate of number of MSMEs post liberalization.
• Whether increase in number of units have resulted into proportionate increase in MSMEs contribution to GDP of
the country.
• Whether increase in number of units have resulted into proportionate increase in MSMEs contribution to
Employment rate of the country.
• Whether increase in number of units have resulted into proportionate increase in MSMEs contribution to Export
of the country.
The main objective of the present study is to analyze the impact of globalization on the growth of small scale
industries.
Data Base and Analysis
Following Globalization and pro-market reforms of 1991, their was shift in government’s policy regarding Small
Scale Industries. SSIs which privileged itself through protection and reservation regimes earlier were subjected to face
market forces. It propelled into bringing significant changes in business environment for small scale industries.

16 S. L. Gupta & R. Ranjan
Impact Factor (JCC): 4.9926 Index Copernicus Value (ICV): 3.0
Table 2: Growth Rate of MSMEs: No. of Units, Production, Per Unit Production, Per Unit Growth Rate of Production during Post Liberalization Period
Year No.of Units Lakh
Growth Rate Units
Production (RS in Lakh)
Growth Per Unit
Production(RS) Per Unit Growth
1991-92 70.63 - 7307200 - 103457.45 - 1992-93 73.51 4.08 8558100 17.12 116420.90 12.53 1993-94 76.49 4.05 9880400 15.45 129172.44 10.95 1994-95 79.6 4.07 12221000 23.69 153530.15 18.86 1995-96 82.84 4.07 14829000 21.34 179007.73 16.59 1996-97 86.21 4.07 16841300 13.57 195352.05 9.13 1997-98 89.71 4.06 18917800 12.33 210877.27 7.95 1998-99 93.36 4.07 21290100 12.54 228043.06 8.14 1999-00 97.15 4.06 23425500 10.03 241127.12 5.74 2000-01 101.1 4.07 26128900 11.54 258446.09 7.18 2001-02 105.21 4.07 28227000 8.03 268291.99 3.81 2002-03 109.49 4.07 31199300 10.53 284951.14 6.21 2003-04 113.95 4.07 36454700 16.84 319918.39 12.27 2004-05 118.59 4.07 42979600 17.90 362421.79 13.29 2005-06 123.42 4.07 49784200 15.83 403372.22 11.30 2006-07 261.12 111.57 70939800 42.49 271675.09 -32.65 2007-08 272.79 4.47 79075900 11.47 289878.29 6.70 2008-09 285.16 4.53 88080500 11.39 308880.98 6.56 2009-10 298.08 4.53 98291900 11.59 329750.07 6.76 2010-11 311.52 4.51 109575800 11.48 351745.63 6.67
Source: Prepared from Annual report 2011-2012.Govt.of India, Ministry of Micro, Small and Medium Ente rprises.
It can be seen through the table that there has been year on year increase in production and it is with increased
rate in comparison to number of Units added during the period which seems to be a good sign for overall productivity of
existing units. But on deeper analysis it is seen that the per unit increase in rate of production has not been able to match
with overall increase in production rate which indicates that though the new units added during the year supposedly ought
to be incorporated with new innovative and better technology are actually taking time to match the overall production rate
of older units.
Table 3: Growth rate of MSMEs: No. of Units, Employment, Per Unit Employment, per Unit Growth Rate of Employment during Post Liberalization Period
Year No. Of Units
Growth in No.of Units
Employment Growth Per Unit
Employment Growth
1991-92 70.63 165.99
2.35
1992-93 73.51 4.08 174.84 5.33 2.38 1.20
1993-94 76.49 4.05 182.64 4.46 2.39 0.39
1994-95 79.6 4.07 191.4 4.80 2.40 0.70
1995-96 82.84 4.07 197.93 3.41 2.39 -0.63
Table 3: Contd.,
1996-97 86.21 4.07 205.86 4.01 2.39 -0.06
1997-98 89.71 4.06 213.16 3.55 2.38 -0.49
1998-99 93.36 4.07 220.55 3.47 2.36 -0.58
1999-00 97.15 4.06 229.1 3.88 2.36 -0.18
2000-01 101.1 4.07 239.09 4.36 2.36 0.28

Impact of Liberalization on Contribution of MSMES i n Economic Development of India 17
www.tjprc.org [email protected]
2001-02 105.21 4.07 249.09 4.18 2.37 0.11
2002-03 109.49 4.07 260.13 4.43 2.38 0.35
2003-04 113.95 4.07 271.42 4.34 2.38 0.26
2004-05 118.59 4.07 282.57 4.11 2.38 0.03
2005-06 123.42 4.07 294.91 4.37 2.39 0.28
2006-07 261.12 111.57 595.66 101.98 2.28 -4.53
2007-08 272.79 4.47 626.34 5.15 2.30 0.65
2008-09 285.16 4.53 659.35 5.27 2.31 0.70
2009-10 298.08 4.53 695.38 5.46 2.33 0.89
2010-11 311.52 4.51 732.17 5.29 2.35 0.75 Source: Prepared from Annual report 2011-2012.Govt.of India, Ministry of Micro,
Small and Medium Enterprises.
Table 4: Growth rate of MSMEs: No. of Units, Export, Per Unit Contribution in Export, Per Unit Growth Rate of Export during Post Liberalization Period
Year No of Units Exports Per Unit Export Growth Growth Per Unit
1991-92 70.63 1388300 19655.95 - -
1992-93 73.51 1778400 24192.63 28.10 23.08
1993-94 76.49 2530700 33085.37 42.30 36.76
1994-95 79.6 2906800 36517.59 14.86 10.37
1995-96 82.84 3647000 44024.63 25.46 20.56
1996-97 86.21 3924800 45526.04 7.62 3.41
1997-98 89.71 4444200 49539.63 13.23 8.82
1998-99 93.36 4897900 52462.51 10.21 5.90
1999-00 97.15 5420000 55790.02 10.66 6.34
2000-01 101.1 6979700 69037.59 28.78 23.75
2001-02 105.21 7124400 67716.00 2.07 -1.91
2002-03 109.49 8601300 78557.86 20.73 16.01
2003-04 113.95 9764400 85690.22 13.52 9.08
2004-05 118.59 12441700 104913.57 27.42 22.43
2005-06 123.42 15024200 121732.30 20.76 16.03
2006-07 261.12 18253800 69905.79 21.50 -42.57
2007-08 272.79 20201700 74055.87 10.67 5.94
Source: Prepared from Annual report 2011-2012.Govt.of India, Ministry of Micro, Small and Medium Enterprises.
Table 5: Growth Rate of Composition of Export Percentage in Total Production by MSMEs
Year Export RS in Lakh
Production RS in Lakh
% of Export in Total Production
Growth in % of Export in Total Production
1991-92 1388300 7307200 19.00 -
1992-93 1778400 8558100 20.78 9.4
1993-94 2530700 9880400 25.61 23.3
1994-95 2906800 12221000 23.79 -7.1
18 S. L. Gupta & R. Ranjan
Impact Factor (JCC): 4.9926 Index Copernicus Value (ICV): 3.0
1995-96 3647000 14829000 24.59 3.4
1996-97 3924800 16841300 23.30 -5.2
1997-98 4444200 18917800 23.49 0.8
1998-99 4897900 21290100 23.01 -2.1
1999-00 5420000 23425500 23.14 0.6
2000-01 6979700 26128900 26.71 15.5
2001-02 7124400 28227000 25.24 -5.5
2002-03 8601300 31199300 27.57 9.2
2003-04 9764400 36454700 26.79 -2.8
2004-05 12441700 42979600 28.95 8.1
2005-06 15024200 49784200 30.18 4.3
2006-07 18253800 70939800 25.73 -14.7
2007-08 20201700 79075900 25.55 -0.7 Source: Figure of Export and Production taken from Annual report 2011-2012.Govt.of India, Ministry of Micro, Small and Medium Enterprises.
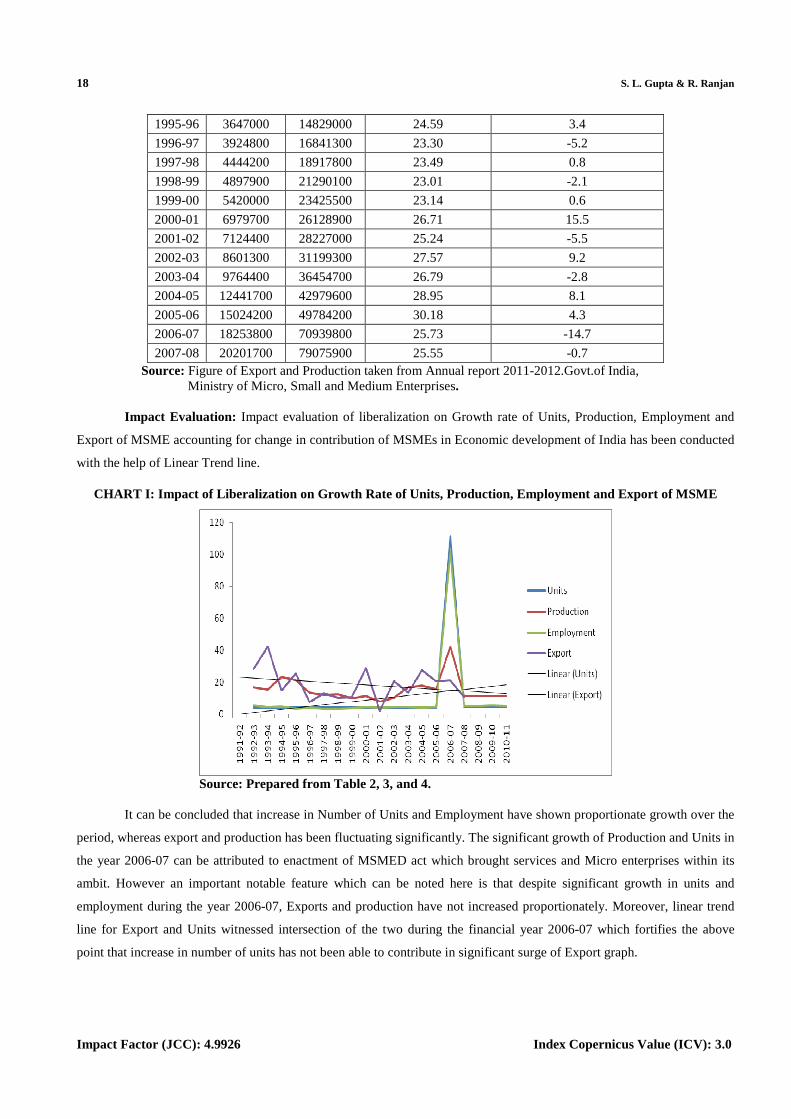
Impact Evaluation: Impact evaluation of liberalization on Growth rate of Units, Production, Employment and
Export of MSME accounting for change in contribution of MSMEs in Economic development of India has been conducted
with the help of Linear Trend line.
CHART I: Impact of Liberalization on Growth Rate of Units, Production, Employment and Export of MSME
Source: Prepared from Table 2, 3, and 4.
It can be concluded that increase in Number of Units and Employment have shown proportionate growth over the
period, whereas export and production has been fluctuating significantly. The significant growth of Production and Units in
the year 2006-07 can be attributed to enactment of MSMED act which brought services and Micro enterprises within its
ambit. However an important notable feature which can be noted here is that despite significant growth in units and
employment during the year 2006-07, Exports and production have not increased proportionately. Moreover, linear trend
line for Export and Units witnessed intersection of the two during the financial year 2006-07 which fortifies the above
point that increase in number of units has not been able to contribute in significant surge of Export graph.

Impact of Liberalization on Contribution of MSMES i n Economic Development of India 19
www.tjprc.org [email protected]
CHART II: Impact of Liberalization on Growth Rate o f per Unit Production, Employment and Export of MSME
Source: Prepared from Table 2, 3, and 4.
Per unit Production and Export shows a gradual decrease, which does not seems to be helping the newly admitted
units.The Linear trendline shows intersection of Export and Production during the financial year 2001-02 which indicates
that there is more steep fall in Exports in comparison to Production. The downward curve is more pronounced after 2006-
07 which reflects that MSMED act 2006 which was supposed to help the MSMEs has not been able to bring desired
results.
CHART III: Impact of Liberalization on Growth rate of Export Percentage in Total Production by MSMEs
Source: Prepared from Table 5
It can be seen through the chart that there is divergence in Percentage of Export in total production and year on
year growth rate of Percentage of Export in total production by MSMEs. It seems that though the policy of liberalization
resulted into exodus of investments into India but that investment could not be capitalized to enhance the overall efficiency
of new enterprises by boosting the exports.

20 S. L. Gupta & R. Ranjan
Impact Factor (JCC): 4.9926 Index Copernicus Value (ICV): 3.0
CONCLUSIONS
The policy of liberalization which was aimed to deregulate the market and keep investments flowing did manage
to increase the number of units, but their overall productivity leaves a lot to be desired. Increase in number of Units and
Employment have shown proportionate growth over the period, wheras export and production has been fluctuating
significantly. Per unit increase in rate of production has not been able to match with overall increase in production rate
which indicates that new units added during the year supposedly ought to be incorporated with new innovative and better
technology are actually taking time to match the overall production rate of older units. Similar is the case for Exports from
MSMEs. It seems that investment coming from outside is meant to tap local market rather than to export. Their is need to
learn from Chinese experience that subsidies should be given only to those investment proposals which are intended
towards export after value addition.
REFERENCES
1. Chandraiah M., (2013), ‘The Impact of Globalization on Micro, Small and Medium Enterprises with special
reference to India’, Innovative Journal of Business and Management 2-5 September-October 2013.
2. FICCI-Grant Thornton Report India, (2013) "Integrating MSMEs with the global value chain",
http://www.ficci.com/spdocument/20249/Grant-Thornton-FICCI-report.pdf
3. FICCIs Economic Impact analysis report, (2013), “ Unleashing the potential: Internet’s role in the
performance of India’s Small and Medium enterprises”,
http://www.nathaninc.com/sites/default/files/Unleashing_Potential_The%20Internet_and_SMEs_in_India.pdf
4. Ghatak S., (2009), ‘Micro, Small and Medium Enterprises (MSMEs) in India: An Appraisal’, URL
:(http://www.legalpundits.com/Content_folder/SMEArti150610.pdf as appeared on 09 Dec 2013).
5. IBEF report on MSME, (2013), “MSMEs and Growing role of Industrial Clusters”,
http://www.ibef.org/download/MSME-040213.pdf
6. Lahiri R. (2012), “Problems and prospects of Micro, Small and Medium Enterprises (MSMEs) in India in
the era of Globalisation”.URL: http://www.rtc.bt/Conference/2012_10_15/6-RajibLahiri-
MSMEs_in_India.pdf
7. Ramraj P., (2010), ‘Timely payments by large corporate can boost SME profits by 15 percent’, SME Insight
Vol 1, CRISIL MSME Knowledge series.
8. Ravi S., (2009) “Entrepreneurship Development in the Micro Small and Medium Enterprise Sector in India”,
http://www.isb.edu/faculty/shamika/MSME%20chapter_Shamika%20Ravi.PDF
9. Sonia and Kansai R., (2009) ‘Globalization and Its Impact on Small Scale Industries in India’, PCMA
Journal of Business Vol. 1, No. 2 (June, 2009)
10. Sengupta R & Kumar G.(2011)‘India’s Free Trade Agreements and Micro, Small and Medium Enterprises
‘Part IV, MSME series, Third world Network.
11. Spithoven A., Vanhaverbeke and W., Roijakkers N., (2013), ‘Open innovation practices in SMEs and
Large Enterprises’, Small Business Economics, Vol41, issue3, October2013, Pages 537-562.
Impact of Liberalization on Contribution of MSMES i n Economic Development of India 21
www.tjprc.org [email protected]
12. www.msme.gov.in
13. www.dcmsme.gov.in
14. www.rbi.org.in
15. www.crisil.com