29.7.2003M. Kowalski Search for Neutrino-Induced Cascades in AMANDA II Marek Kowalski DESY-Zeuthen...
26
29.7.2003 M. Kowalski Search for Neutrino- Induced Cascades in AMANDA II Marek Kowalski DESY-Zeuthen Workshop on Ultra High Energy Neutrino Telescopes Chiba, 29.7.2003
-
date post
20-Dec-2015 -
Category
Documents
-
view
217 -
download
2
Transcript of 29.7.2003M. Kowalski Search for Neutrino-Induced Cascades in AMANDA II Marek Kowalski DESY-Zeuthen...

29.7.2003 M. Kowalski
Search for Neutrino-Induced Cascades in AMANDA II
Marek Kowalski
DESY-Zeuthen
Workshop on Ultra High Energy Neutrino Telescopes
Chiba, 29.7.2003

29.7.2003 M. Kowalski
Outline
• Introduction
• Reconstruction of cascade-like events
• Searching for cascade-like events in the AMANDA II data
• Summary

29.7.2003 M. Kowalski
Neutrino-Induced Cascades:
• Signature of e and are hadronic and electro-magnetic cascades.
• Neutral Current interactions of all neutrino flavors produce hadronic cascades
• Background consists of atmospheric muons, emitting energetic secondaries
S
Signal and Background
~ 5 m

29.7.2003 M. Kowalski
Advantages:• Large Sensitivity for e and
• Local events, therefore better energy resolution• Less intrinsic background of atmospheric muons & neutrinos• Nearly 4sensitivity
Disadvantages:• Less signal than in the muon channel due to very large muon range • Worse angular resolution
• Local events, therefore better energy resolution
• Less background of atmospheric neutrinos
• Less signal than in the muon channel since muon range very large
Why search for Neutrino-Induced Cascades?

29.7.2003 M. Kowalski
With scattering
0 t
N
i i
ii tt
12
202 )(
t
0 t
far track
close track
0 t
),,,,,( 0 scattabsiii distttfL
Reconstructing Cascades:Vertex Position
Without scattering

29.7.2003 M. Kowalski
Vertex Resolution
Reconstruction of 1 TeV EM cascades which trigger AMANDA II
Vertex resolution of cascades in the detector: (radius 100 m, height = 200 m)
~ 5 m for x,y,z coordinates and large range of energies.

29.7.2003 M. Kowalski
Energy Reconstruction
• Parameterization of hit-probability with MC. Function is random walk inspired:
• Construction of Likelihood
function:
//
1),(
d
hit
e
eP
dEc
Ed
)1()()( allhits nohits
hithit PPL EE

29.7.2003 M. Kowalski
Resolution of Energy Reconstruction
Reconstruction of EM cascades of energies: 102, 103 , 104 ,105 ,106 GeV.
Vertex within AMANDA II. (radius = 100m, height =200m) Vertex fitted with time-likelihood.
logE) < 0.2
<7.1
29.7.2003 M. Kowalski
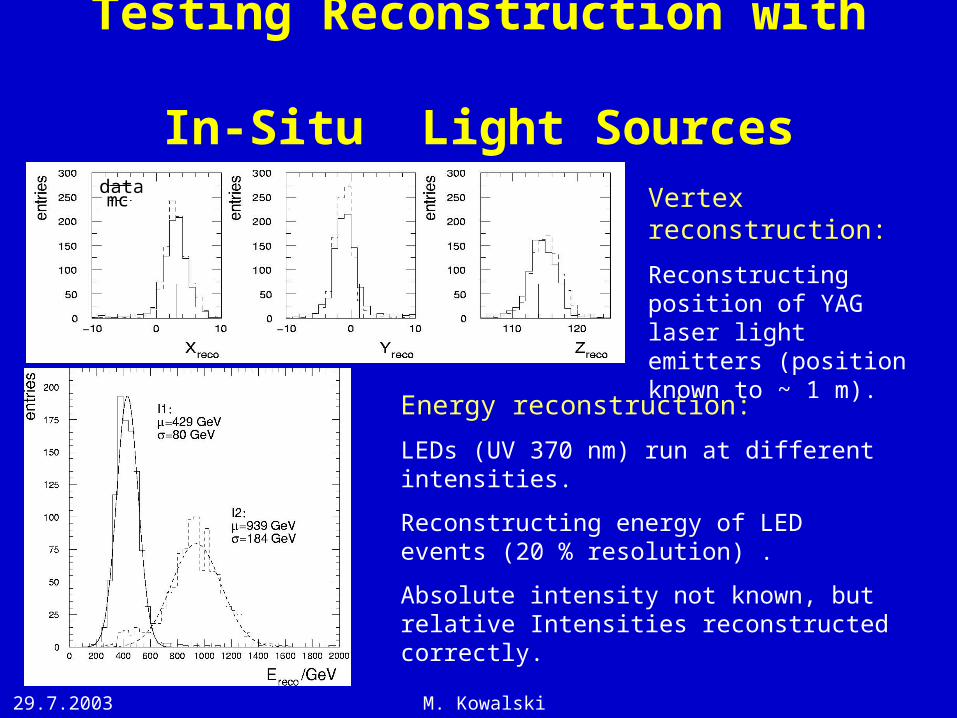
Vertex reconstruction:
Reconstructing position of YAG laser light emitters (position known to ~ 1 m).
Energy reconstruction:
LEDs (UV 370 nm) run at different intensities.
Reconstructing energy of LED events (20 % resolution) .
Absolute intensity not known, but relative Intensities reconstructed correctly.
Testing Reconstruction with In-Situ Light Sources
datamc

29.7.2003 M. Kowalski
The cascade filter
Final cut
Starting with 1.2 x 10⁹ events (in the 2000 data set)
7 cuts to reduce background
The full likelihood reconstruction is performed after cut # 2

29.7.2003 M. Kowalski
Final cut variable
BS
S
iiB
iS
iBS
BS
PP
P
PP
PP
s
//
L
Variables merged into one
“Bayesian Discriminator”
(thereby neglecting correl.)
[m]
29.7.2003 M. Kowalski
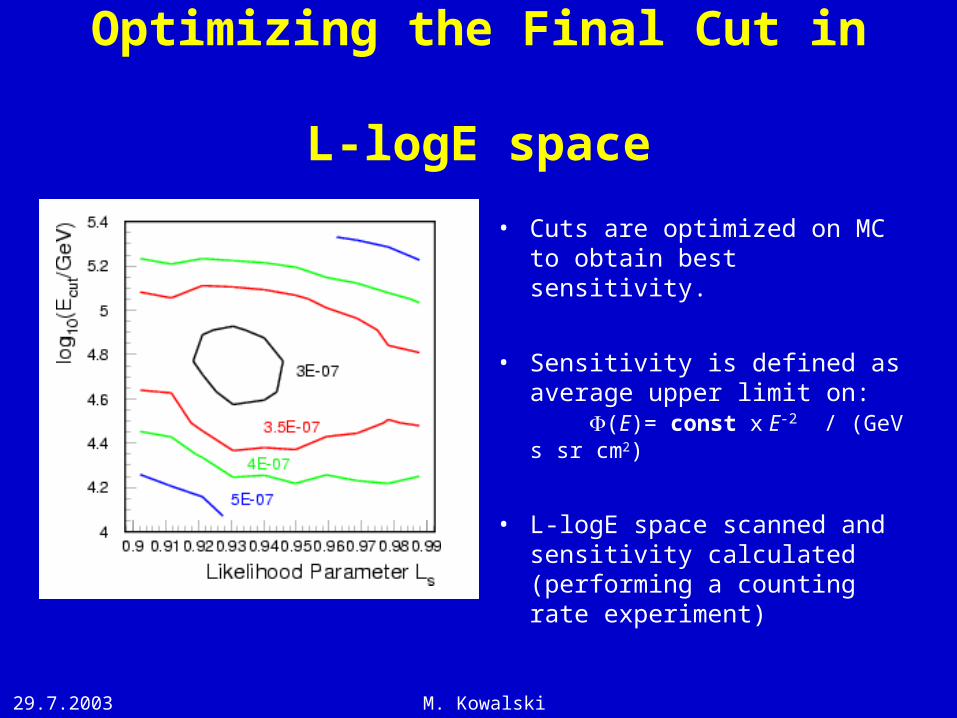
Optimizing the Final Cut in L-logE space
• Cuts are optimized on MC to obtain best sensitivity.
• Sensitivity is defined as average upper limit on: (E)= const x E-2 / (GeV s sr cm2)
• L-logE space scanned and sensitivity calculated (performing a counting rate experiment)

29.7.2003 M. Kowalski
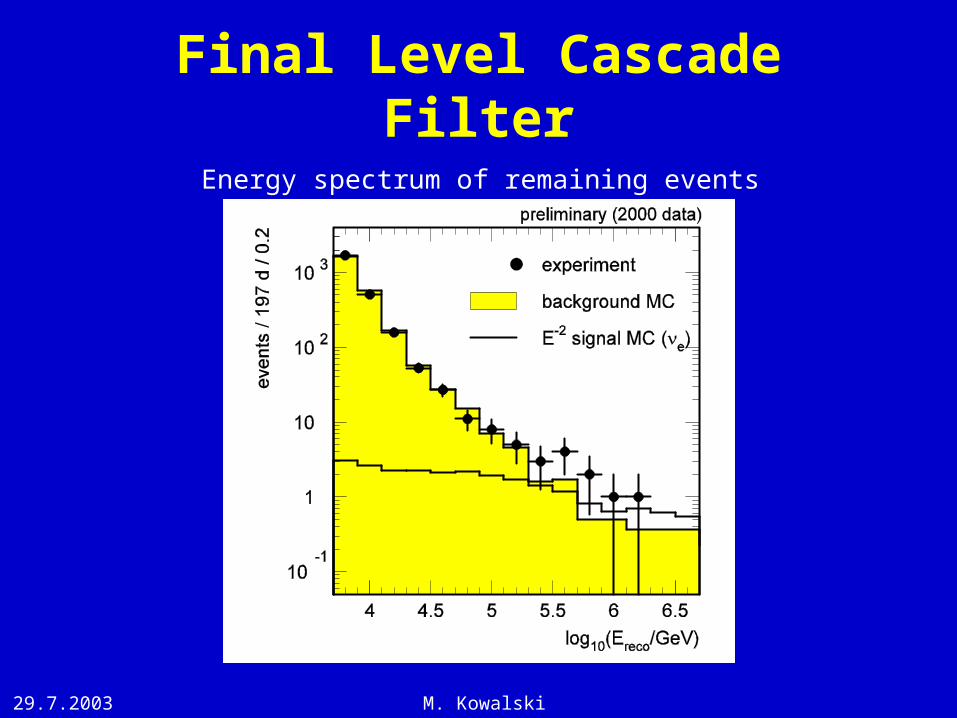
Final energy spectrum
Energy cut chosen by MC
Optimization
2 events passed all cuts
Background Expectation
Atmospheric muons
0.45 +0.5-0.3
Conventional
atmospheric 0.05+0.05
-0.02
Prompt charm 0.015-0.7
Sum (w/o charm) 0.50 +0.5-0.3

29.7.2003 M. Kowalski
The highest energy event (~200 TeV)
300 m

29.7.2003 M. Kowalski
Effective Volume for e , and
29.7.2003 M. Kowalski
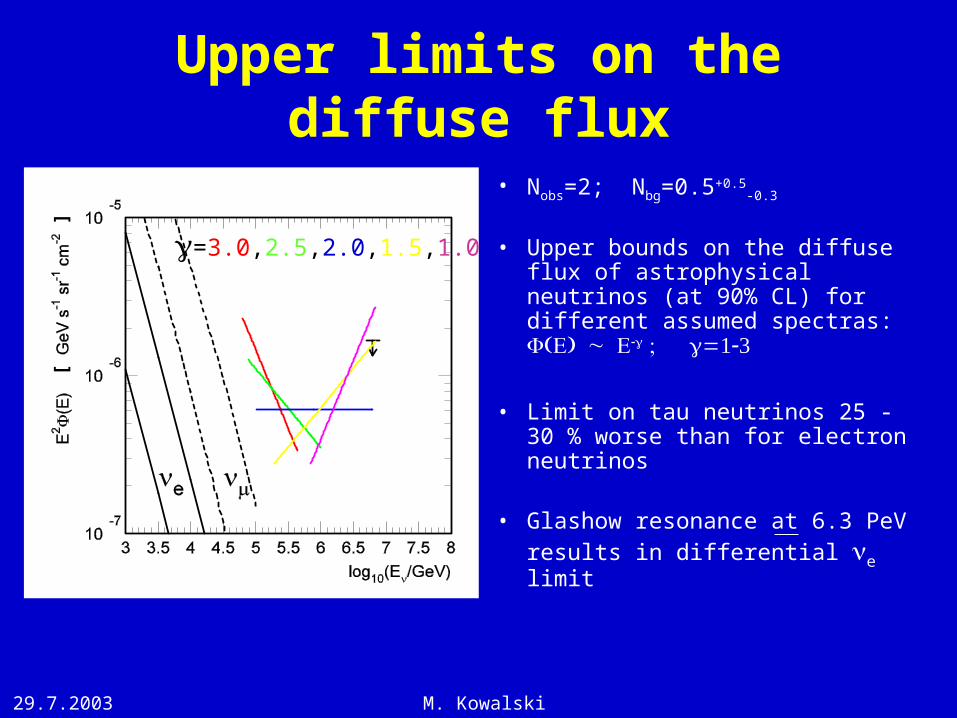
Upper limits on the diffuse flux
• Nobs=2; Nbg=0.5+0.5-0.3
• Upper bounds on the diffuse flux of astrophysical neutrinos (at 90% CL) for different assumed spectras:
• Limit on tau neutrinos 25 - 30 % worse than for electron neutrinos
• Glashow resonance at 6.3 PeV
results in differential e limit
[]
=3.0,2.5,2.0,1.5,1.0

29.7.2003 M. Kowalski
[Comparision with other Limits
and Models
Model e e
1e-6 x E-2 1.8 0.9
SSDS (92) 0.86 0.41
SS QC (95) 0.43 0.21
SS BJ (95) 1.2 0.61
P p(96)
4.7 2.4
MPR (98) 9.8 4.8
units: model rejection factor
* assuming a flavor ratio 1:1:1
SS
DS
MPR
Preliminary (2000 data)
[
[

29.7.2003 M. Kowalski
Conclusions
Cascades interacting within AMANDA can be reconstructed with a resolutions:
x,y,z=5 m, =30o- 40o and logE=0.1-0.2
A search for neutrino-induced cascades in the data of the first year of AMANDA II was performed. No significant excess over background was seen!
Upper limits set on the diffuse flux of neutrinos, ruling out several AGN flux models.
AMANDA can be considered an all flavor neutrino detector!

29.7.2003 M. Kowalski
Back Up

29.7.2003 M. Kowalski
Angular detector sensitivity nearly uniform.Depletion due to propagation through the earth.
Example:e @ 1 PeV

29.7.2003 M. Kowalski
29.7.2003 M. Kowalski
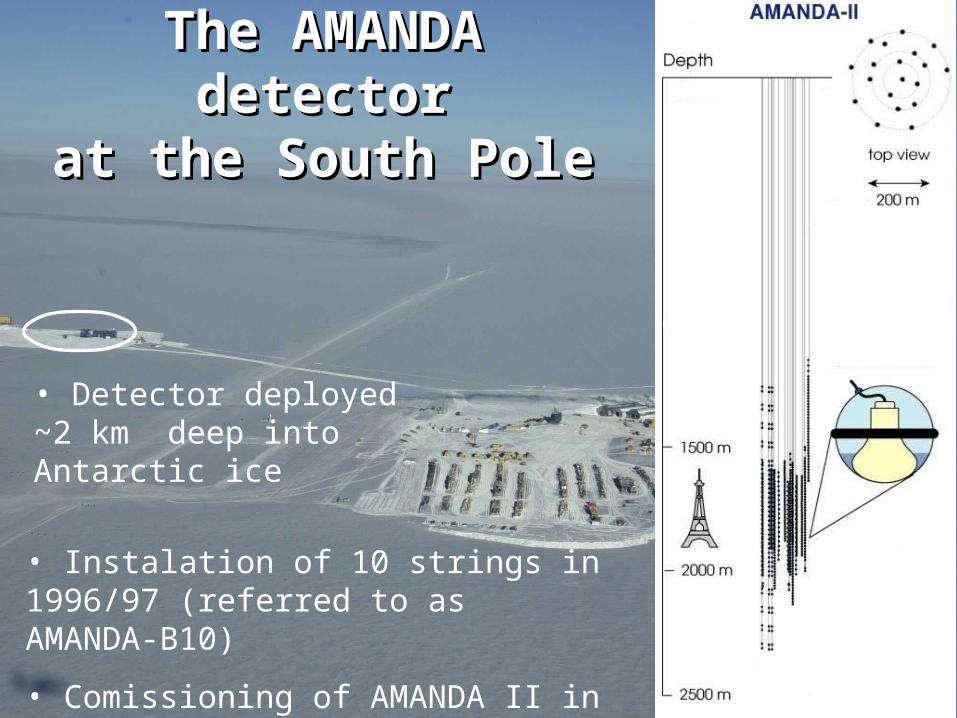
The AMANDA detectorThe AMANDA detectorat the South Poleat the South Pole
• Instalation of 10 strings in 1996/97 (referred to as AMANDA-B10)
• Comissioning of AMANDA II in 2000 consisting of 19 strings and 677 OMs
• Detector deployed ~2 km deep into Antarctic ice
29.7.2003 M. Kowalski
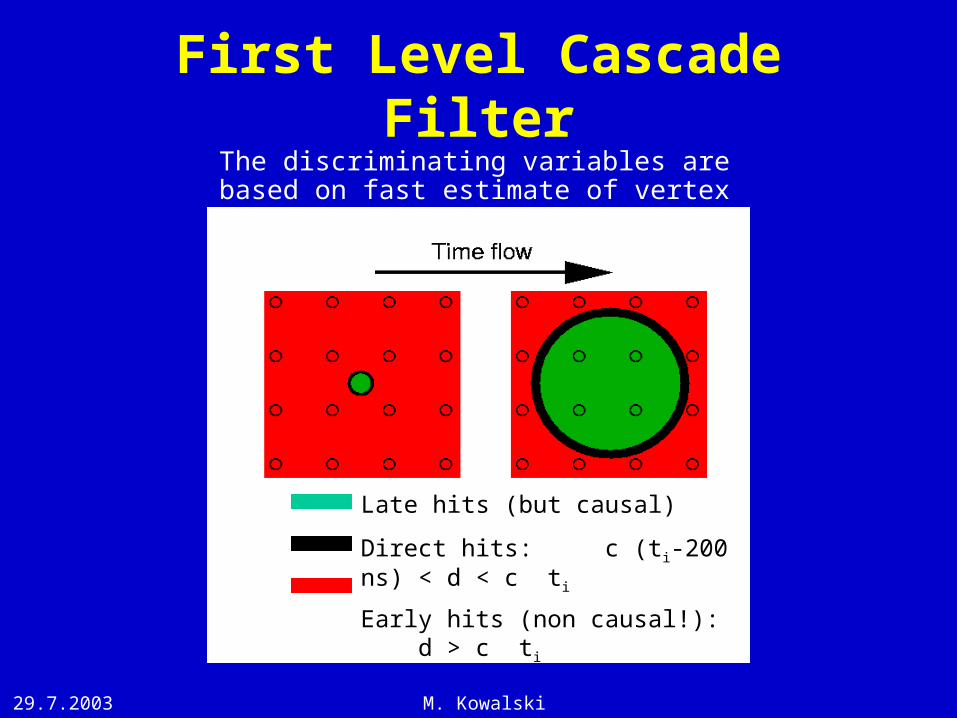
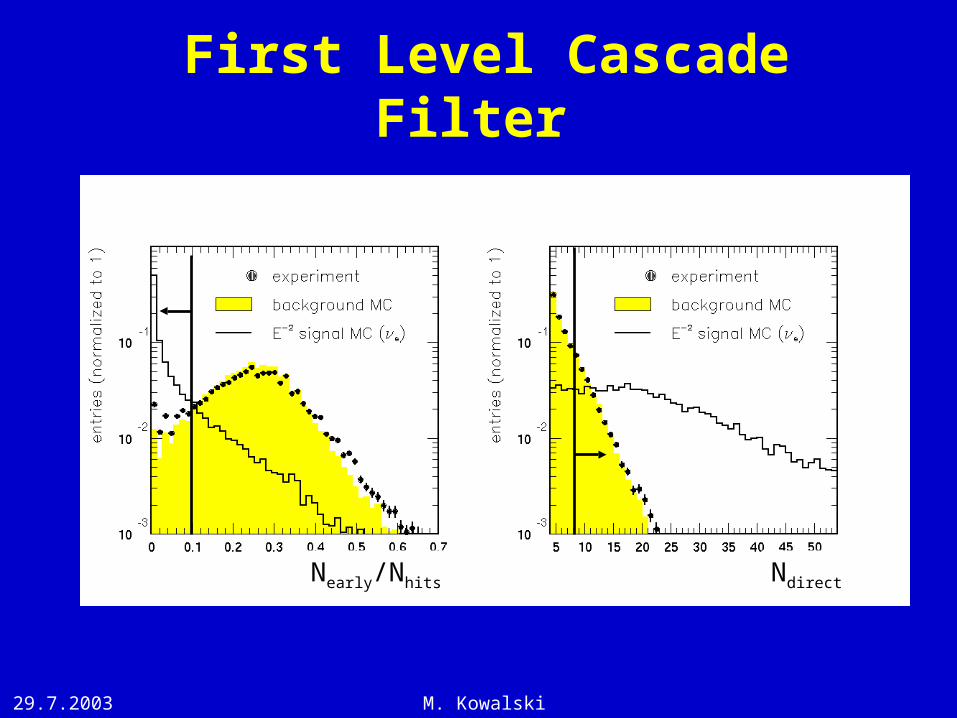
First Level Cascade Filter
Late hits (but causal)
Direct hits: c (ti-200 ns) < d < c ti
Early hits (non causal!): d > c ti
The discriminating variables are based on fast estimate of vertex position & time
29.7.2003 M. Kowalski
First Level Cascade Filter
Nearly/Nhits Ndirect
29.7.2003 M. Kowalski
Final Level Cascade Filter
Energy spectrum of remaining events

29.7.2003 M. Kowalski
Systematic uncertainty on signal sensitivity
Type and size of uncertainty
Unertainty in
event rate (e)
Variation of ice models 10 %
OM sensitivity (+/- 20 %) 10 %
Energy scale (+/- 20 %) 10 %
Cut variation 5 %
MC Statistics 3 %
Shower simulation 1 %
Quadratic sum ~ 20 %