
2802 Treasury Operations Survey 2005 Results for UPLOAD · The survey was conducted by Ernst &...
36
F INANCIAL S ERVICES R ISK M ANAGEMENT Treasury Operations Survey 2005 Results Ernst & Young In conjunction with The Association of Corporate Treasurers !+#
Transcript of 2802 Treasury Operations Survey 2005 Results for UPLOAD · The survey was conducted by Ernst &...

FI N A N C I A L SE R V I C E SRI S K MA N A G E M E N T
Treasury Operations Survey 2005 ResultsErnst & Young In conjunction with The Association of Corporate Treasurers
!+#


Contents
Page
1. Executive Summary 3
2. Key Findings: Detailed Analysis 7 2.1 Reporting
2.2 Risk Management
2.3 Impact of IAS 39
3. Background 23 Sample and Demographics
4. About this Survey 27
5. The Association of Corporate Treasurers (ACT) 29
6. Ernst & Young’s Global Treasury Advisory Group 31

3
1. Executive Summary
The survey was conducted by Ernst & Young’s Financial Services Risk Management practice in conjunction with the Association of Corporate Treasurers (ACT). This survey is conducted annually based on organisations who respond through the ACT website. The survey provides a means for treasurers to benchmark themselves against other treasuries and to gain an insight into the impact IAS 39, IFRS and other regulatory change is having on organisations. Despite the range of respondents and the variety of issues effecting treasurers, there were some interesting themes and trends highlighted by the survey.
Background: Sample and Demographics
The number of responses to the 2005 survey was 51, similar to previous surveys. Since the last survey there has been an increase in the proportion of UK treasuries reporting to overseas head offices. Much of this can be attributed to a change in the respondent mix. However, the general profile of respondents, their size and volume of treasury activities, remains generally consistent with previous surveys.
In addition to aggregate data, analysis relating to the size and scope of respondents has been undertaken, to reflect the different environments faced by treasuries in large and small organisations. In many cases responses were similar across the spectrum, but where there is a significant difference in responses, this has been noted and outlined in the body of the survey.
Reporting
Over the last 3 years of the survey we have observed an increase in the proportion of respondents measuring treasury performance. Increasingly, performance measurement is seen as a means for an organisation to evaluate the effectiveness of its treasury. We see this as beneficial to organisations, treasury staff and the profession as a whole.
Without being able to demonstrate the value added by a corporate treasury, the function is often simply seen as overhead and as the last couple of decades have shown, cost cutting and efficiency pressures on organisations have led to the downsizing of treasuries and a general contraction of opportunities within the corporate treasury profession. We consider the growing use of performance measures as a positive step in increasing the value of treasury activities by senior management.
A downside to the growth in performance measurement has been the growing dissatisfaction with the measures being used. Intuitively, we would expect this to be due to the lack of sophistication in traditional measures of performance when applied to treasury, but our survey indicates that measures have simply become too complicated and difficult to develop. Much management time has been taken up of late by IFRS and Sarbanes-Oxley requirements which have probably hindered the ability of treasurers to develop more appropriate measurement tools. We would hope as these pressures diminish that addressing the quality of treasury performance measures will be given a high priority. Other highlights from the survey:
Most treasuries use market rates as a benchmark for funding performance, though benchmarking against risk neutral positions is increasing.
Budget rates are now the most popular tool, replacing market rates, for measuring foreign exchange risk management, with risk neutral position benchmarking gaining popularity.

4 TR E A S U R Y OP E R A T I O N S SU R V E Y 2005 RE S U L T S
EX E C U T I V E SU M M A R Y
Market rates remain the most used measurement tool for interest rate risk management performance.
The use of budget rates in commodity price risk management has increased substantially.
Credit risk management is measured primarily by the use of risk neutral positions, with the remainder of treasuries using market rate benchmarks.
Treasury system use continues to grow, particularly in large organisations, and the reliance on spreadsheets continues to fall. We see this as a welcome development given the increasing complexity of managing a modern treasury and the very large inherent risks that arise from reliance on manual data input and risk of error when using self developed spreadsheets. The cost of treasury systems remains a significant barrier but as prices slowly fall, take up should continue to improve.
Risk Management
All of our respondents have a treasury policy in place, the overwhelming majority of those being formal documents. We feel this is an excellent result which reflects the importance placed on governance within modern treasury operations.
The use of treasury procedures manuals has also increased with procedural coverage of all areas increasing significantly. It is also heartening to note that most procedures manuals are being updated annually or bi-annually. The onset of Sarbanes-Oxley requirements is likely to be a driver of this trend but the benefit to treasury staff is likely to make the efforts undertaken worthwhile.
The proportion of respondents describing their treasury’s risk appetite as cautious or very cautious has increased relative to previous years. It is apparent that the days of aggressive, profit centre corporate treasuries have long disappeared. It is not certain what is driving this recent trend towards caution, though what constitutes a cautious risk appetite has always been subjective.
The top three risk management functions identified by our respondents were:
Cash and liquidity management;
Foreign exchange exposure management; and
Funding.
Interest rate risk management was, however, not far behind. This is similar to previous survey results. The most interesting development was the increase in prominence of operational risk management, an area not traditionally associated with corporate treasury, but utilising many of the same skills. All too often the role of treasury has been too narrowly defined so taking on additional operational risk responsibilities should provide greater depth of skill within a treasury and increase its value to the organisation. It will be interesting to watch this trend in the future.
The requirement for Sarbanes-Oxley reporting remained stable at around a third of respondents. An impressive number have now completed their initial requirements, which is encouraging considering the amount of resources that have been dedicated to achieving compliance in the previous year.
Other highlights from the survey include:
Interest rate risk management is an issue to almost all respondents, though a worrying number of organisations have no policy to manage this risk;
Most organisations use a five year time horizon to manage interest rate risk and the majority still use derivatives to hedge the risks they face;
A growing, though small (just 15%), number of respondents are viewing their pension fund obligations as an exposure to be managed like any other liability; and
Around half of respondents have a commodity price exposure and there is a growing trend for organisations that did not hedge this risk to now actively manage it.
Cash flow forecasting, the bane of many a treasurer, remains less than perfect. As expected the longer the forecast timeframe the less satisfied the respondents were with the quality of the forecast. An issue of concern is that a significant minority of organisations do not use cash flow forecasts to manage their liquidity.

5
Impact of IAS 39
IAS 39 appears to remain an important issue for many corporate treasurers. Whilst substantial progress has been made by almost all respondents and the level of knowledge and experience with the standard continues to grow, IAS 39 is still regarded fairly sceptically by a large proportion of respondents. It is interesting to note, however, that many of the responses were significantly polarised with equal numbers of respondents agreeing and disagreeing with the questions being asked. This probably reflects the continuing uncertainty of requirements and impacts of the standard and the different effects that it has on different types and sizes of organisations and treasuries.
Highlights include:
More respondents, particularly smaller organisations, agree that IAS 39 better reflects treasury risks than last year, but opinion is still strongly divided;
Opinion is also divided on the impact on treasury reporting and management and the awareness of these within the organisation;
Far fewer respondents than in 2004 felt that IAS 39 would have a material impact on their financial statements;
More respondents are having to upgrade their systems to cope with the additional revaluation and recording requirements that IAS 39 compliance requires;
Most respondents feel that earnings volatility will or is increasing due to IAS 39’s impacts;
A large proportion of treasurers are concerned that stakeholders will not fully understand the consequences of IFRS;
Contrasting with views on likely financial statement impacts, most organisations have not or do not plan to change general business policies as a result of IAS 39 impacts;
Similarly, most respondents do not feel that they will need to renegotiate their financial covenants as a result of IAS 39 compliance;
Most organisations have been able to achieve hedge accounting through the establishment of hedging relationships and documentation for the majority of their hedging instruments;
Effectiveness testing, however, has caused significant difficulties for a majority of respondents; and
Almost half of respondents feel that the suite of IFRS changes, including IAS 32, IAS 39 and ED 7 will result in the provision of excess information on treasury activity.
5

7
2. Findings: Detailed Analysis
2.1 Reporting
General Performance Measurement
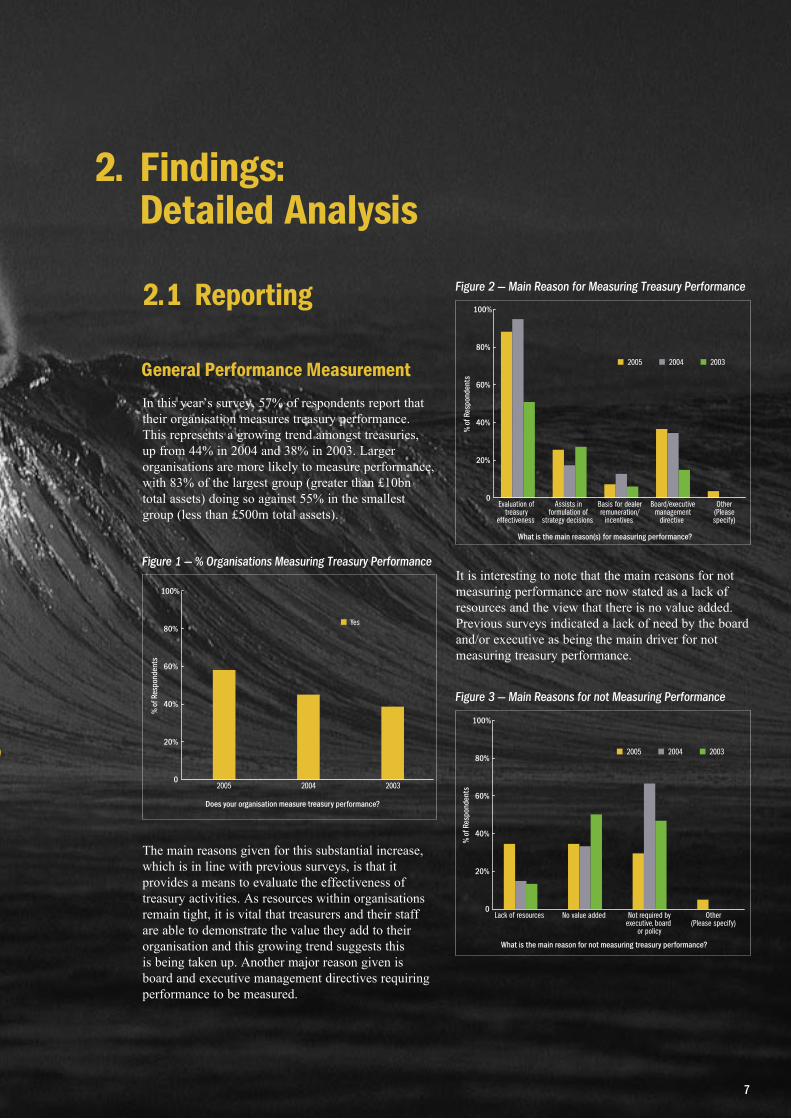
In this year’s survey, 57% of respondents report that their organisation measures treasury performance. This represents a growing trend amongst treasuries, up from 44% in 2004 and 38% in 2003. Larger organisations are more likely to measure performance, with 83% of the largest group (greater than £10bn total assets) doing so against 55% in the smallest group (less than £500m total assets).
The main reasons given for this substantial increase, which is in line with previous surveys, is that it provides a means to evaluate the effectiveness of treasury activities. As resources within organisations remain tight, it is vital that treasurers and their staff are able to demonstrate the value they add to their organisation and this growing trend suggests this is being taken up. Another major reason given is board and executive management directives requiring performance to be measured.
It is interesting to note that the main reasons for not measuring performance are now stated as a lack of resources and the view that there is no value added. Previous surveys indicated a lack of need by the board and/or executive as being the main driver for not measuring treasury performance.
Figure 1 — % Organisations Measuring Treasury Performance
�
���
���
���
���
����
���
�����
����
����
����������������������������������������������������
���� ���� ����
���
Figure 2 — Main Reason for Measuring Treasury Performance
�
���
���
���
���
����
���
�����
����
����
�����������������������������������������������������
�����������������������������������������
������������������������������������
���������������������
��������������������������
������������������
�����������������������
�������������
������������
Figure 3 — Main Reasons for not Measuring Performance
�
���
���
���
���
����
���
�����
����
����
���������������������������������������������������������������
��������������������������������
���������
���������������������
�������������������������������
������������

8 TR E A S U R Y OP E R A T I O N S SU R V E Y 2005 RE S U L T S
2. F I N D I N G S: D E T A I L E D A N A L Y S I S
Whilst the measurement of treasury performance is increasing, satisfaction amongst respondents with the performance measures being used has decreased significantly to 54% against 73% in 2004 and 71% in 2003.
As in previous years, the main reason given for dissatisfaction is that measures are still in development. However a quarter of respondents now suggest that their measures are too complicated for non-treasury management to understand, as compared to negligible responses in this category in previous years. Only a fifth of respondents now feel their measures are too simplistic, down from 45% in 2004.
Specific Measures
Funding Performance
Over 80% of respondents use market rates as a benchmark for measuring funding performance. This however represents a decline from 95% in 2004 and 100% in 2003. The use of budget rates has also fallen from 55% to 40% in the current survey. The switch has been primarily into benchmarking against a risk neutral position and/or against competitors (10% each). Whilst there is insufficient data to suggest a trend, it may be a reflection of the increasing sophistication of treasury and financial systems allowing treasuries to move beyond simple market rate based measures.
Foreign Exchange Risk Management Performance
Like funding performance measures, the use of market rates has declined as a measure of foreign exchange risk management performance, down from 67% in 2003 to 46% in 2005. The use of budget rates is now the main tool, being used by 54% of respondents. The use of risk neutral positions as a benchmark has increase to 36% from 22% in 2004 as well. It is interesting to note that smaller organisations tend to use budget rates exclusively whilst larger ones are more reliant on market rates but use a wider range of measures.
Figure 4 — Satisfaction with Performance Measures
�
���
���
���
���
����
���
�����
����
����
����������������������������������������������������������������������
���� ���� ����
���
Figure 5 — Reasons for Dis-Satisfaction with Performance Measures
�
���
���
���
���
����
���
�����
����
����
��������������������������
����������������������������
��������������
������������������������������������
���������������������
�����������������
������������
���������������������������������������������������������
������������
Figure 6 — Measuring Funding Performance
�
���
���
���
���
����
���
�����
����
����
��������������������������������������������������������
�������������������������������������
������������������
�����������
���������������������
��������������
������������
������������

9
Interest Rate Risk Management Performance
The use of market rates has remained steady when measuring interest rate risk management performance at 64% of respondents. Budget rate usage has also remained relatively constant at 45% and while use of a risk neutral comparator has increased from 21% to 36%.
Commodity Price Risk Management Performance
The use of budget rates has increased dramatically in measuring commodity price risk management performance, increasing to 80% of respondents from 43% in 2004. The use of market rates has increased slightly to 60% of respondents with benchmarking and other measures being used by 20% of respondents each.
Credit Risk Management Performance
The overwhelming majority of respondents, 67% in this area use risk neutral positions to measure their performance with the remaining 33% using market rates, though the small number of responses in this segment limits the value of analysis.
Figure 7 — Measuring FX Risk Management Performance
�
���
���
���
���
����
���
�����
����
����
����������������������������������������������������������������������������
�������������������������������������
������������������
�����������
���������������������
��������������
������������
������������
Figure 8 — Measuring Interest Rate Risk Management Performance
�
���
���
���
���
����
���
�����
����
����
������������������������������������������������������������������������������
�������������������������������������
������������������
�����������
���������������������
��������������
������������
������������
Figure 9 — Measuring Commodity Price Risk Management Performance
�
���
���
���
���
����
���
�����
����
����
�����������������������������������������������������������������������
�������������������������������������
������������������
�����������
���������������������
��������������
������������
������������
Treasury Systems
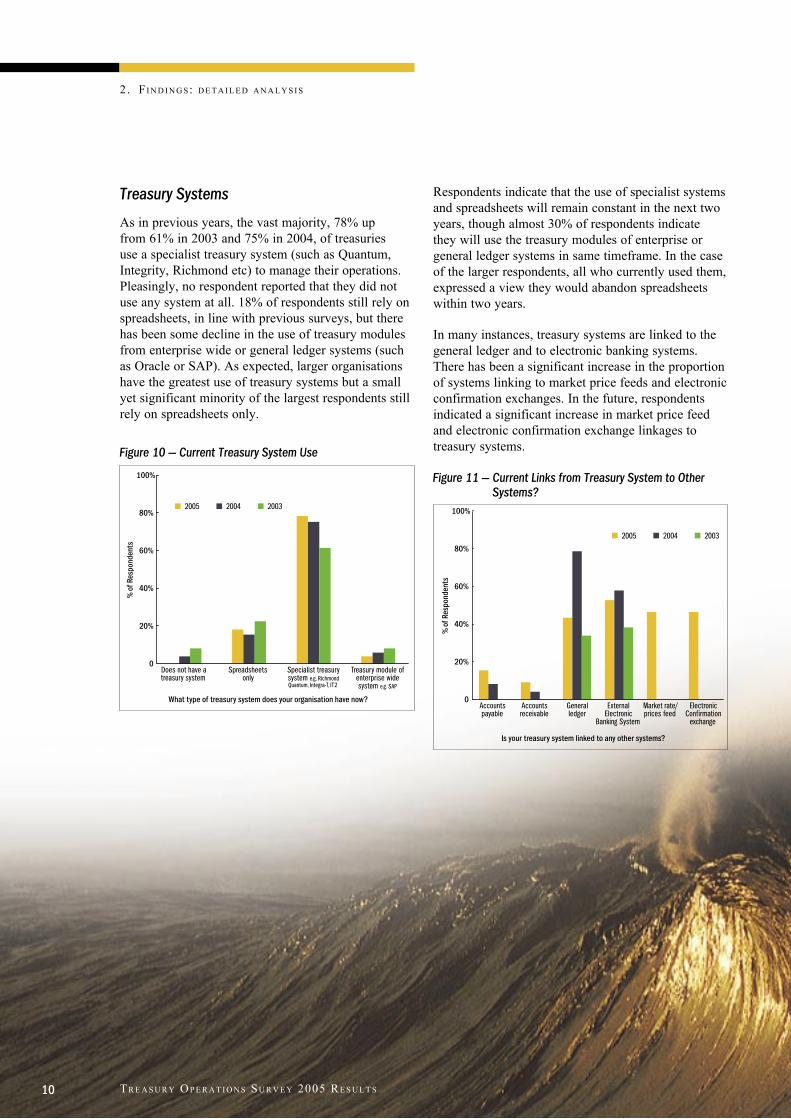
As in previous years, the vast majority, 78% up from 61% in 2003 and 75% in 2004, of treasuries use a specialist treasury system (such as Quantum, Integrity, Richmond etc) to manage their operations. Pleasingly, no respondent reported that they did not use any system at all. 18% of respondents still rely on spreadsheets, in line with previous surveys, but there has been some decline in the use of treasury modules from enterprise wide or general ledger systems (such as Oracle or SAP). As expected, larger organisations have the greatest use of treasury systems but a small yet significant minority of the largest respondents still rely on spreadsheets only.
Respondents indicate that the use of specialist systems and spreadsheets will remain constant in the next two years, though almost 30% of respondents indicate they will use the treasury modules of enterprise or general ledger systems in same timeframe. In the case of the larger respondents, all who currently used them, expressed a view they would abandon spreadsheets within two years.
In many instances, treasury systems are linked to the general ledger and to electronic banking systems. There has been a significant increase in the proportion of systems linking to market price feeds and electronic confirmation exchanges. In the future, respondents indicated a significant increase in market price feed and electronic confirmation exchange linkages to treasury systems.
2. FI N D I N G S: D E T A I L E D A N A L Y S I S
Figure 10 — Current Treasury System Use
�
���
���
���
���
����
���
�����
����
����
�������������������������������������������������������������
����������������������������������������������������������������
��������������������������������������������������
����������������
�������������������������������
������������
Figure 11 — Current Links from Treasury System to Other Systems?
�
���
���
���
���
����
���
�����
����
����
����������������������������������������������������
��������������������
��������������
������������������������
��������������������������������
��������������
����������������
�������������������
������������
10 TR E A S U R Y OP E R A T I O N S SU R V E Y 2005 RE S U L T S

2.2. Risk Management
General
100% of respondents report having a treasury policy in place, up from 98% in previous years. There appears to have been a slight increase in the use of informal policy manuals, up to 20% compared to just below 80% using formal documentation. Again as expected, larger organisations tend to have a higher incidence of formal policies, with a third of smaller organisations relying on informal policies.
Relative to 2004, there has been an encouraging increase in the coverage of treasury procedures manuals with 64% covering all areas, relative to only 52% in 2004. Also pleasing is that 71% of respondents had updated their procedures manual in the last year, compared to 65% in 2004. In fact 91% of respondents have updated their procedures manual in the last two years.
Figure 12 — Form of Treasury Policy
�����������������������������������������
�
���
���
���
���
����
���
�����
����
����
�����������������������������������������
�������������������������
����������������������
������������
Figure 13 — Treasury Procedures Manual
���������������������������������������������������������
�
���
���
���
���
����
���
�����
����
����
������������
�������������
��
��������
11

12 TR E A S U R Y OP E R A T I O N S SU R V E Y 2005 RE S U L T S
2. F I N D I N G S: D E T A I L E D A N A L Y S I S
80% of respondents describe their operation’s risk appetite as very cautious or cautious, up from 70% in 2004 and 73% in 2003. The remainder overwhelmingly describe themselves as balanced. Perhaps unsurprisingly, the level of caution increases significantly as the size of the respondent increases. This may reflect greater scrutiny on larger organisations and the larger sums at stake, but also the more entrepreneurial culture of some of the smaller respondents.
84% of respondents rated cash and liquidity management in their top three risk management functions compared to 88% in 2004. This was followed by 67% (54% in 2004) indicating foreign exchange exposure management, probably reflecting increased currency volatility in 2005, funding at 57%, and interest rate risk management at 53%. A noticeable increase occurred in the area of operational risk management, where 29% of respondents indicated it was a top three function compared to only 13% in 2004. This is probably due to the increased Sarbanes-Oxley and other regulatory changes that are impacting treasuries and their organisations.Figure 14 — Treasury Risk Appetite
�
���
���
���
���
����
���
�����
����
����
����������������������������������������������������
�������� ���������� ���������������
���������������������
������������
Figure 15 — Most Important Risk Management Functions
� ��� ��� ��� ��� ����
����������������
���
�����
�����
����
���
�����
���
����
�����
���
����
����
����
�����
�����
����
�����
����
����
��
����������������������
���������������������������
�������������������������������
������������������������������������
�������
�����������������������������
�����������������������������
������������

13
Sarbanes-Oxley
The number of companies required to comply with Sarbanes-Oxley 404 regulation remains stable at 34% of respondents, despite many organisations indicating a desire to withdraw from the US regulatory regime. It will be interesting to follow this statistic in future surveys to assess the impact of Sarbanes-Oxley on UK organisations.
Impressively, 29% of these respondents have completed their work on Sarbanes-Oxley 404 internal control requirements, up from an unsurprising nil in 2004. 65% of respondents have commenced work on their requirements and only 6% have not yet begun the necessary compliance work.
Interest Rate Risk Management
94% of respondents indicated they were exposed to interest rate risk, up from 90% in 2004 and 92% in 2003. Surprisingly, 15% of respondents, up from 6% in 2004, do not have an interest rate risk policy. For those that do, 72% which is in line with previous years, use a target ratio or range of fixed and floating rate debt.
Figure 16 — Progress of Internal Control Requirements
�������������������������������������������������������������������������������������
�
���
���
���
���
����
���
�����
����
����
���������������������������������������������������
��������������
��������������
��������
Figure 17 — Interest Rate Risk Policy
�������������������������������������������
�
���
���
���
���
����
���
�����
����
����
��������� �����������������������������������������������������
����������������������
������������
14 TR E A S U R Y OP E R A T I O N S SU R V E Y 2005 RE S U L T S
2. F I N D I N G S: D E T A I L E D A N A L Y S I S
Figure 18 — Pension Fund Exposure
�
���
���
���
���
����
���
�����
����
����
�����������������������������������������������������������������������
�����������������������������������������������������
�����������
�����������������������������������������������������������������������������������
���������������������������������������������������������
�����������
��������������������������������������������������������
��������
��������
Figure 19 — Hedging of Commodity Price Risk
�
���
���
���
���
����
���
�����
����
����
����������������������������������������
�����������������������
��������������������
��������������������������
���������������������
������������
�������������������
������������������
������������������������
��������
Just over half of respondents, down from 62% in 2004, use a time horizon of up to 5 years when assessing their risk and a third use a horizon of up to 10 years. Only 11% of respondents use a time horizon less than a year.
The use of derivatives to manage interest rate risk has fallen from 92% in 2004 to 82%, which is in line with the 2003 figure of 81%. It is unclear as to why this is the case and may be a statistical anomaly.
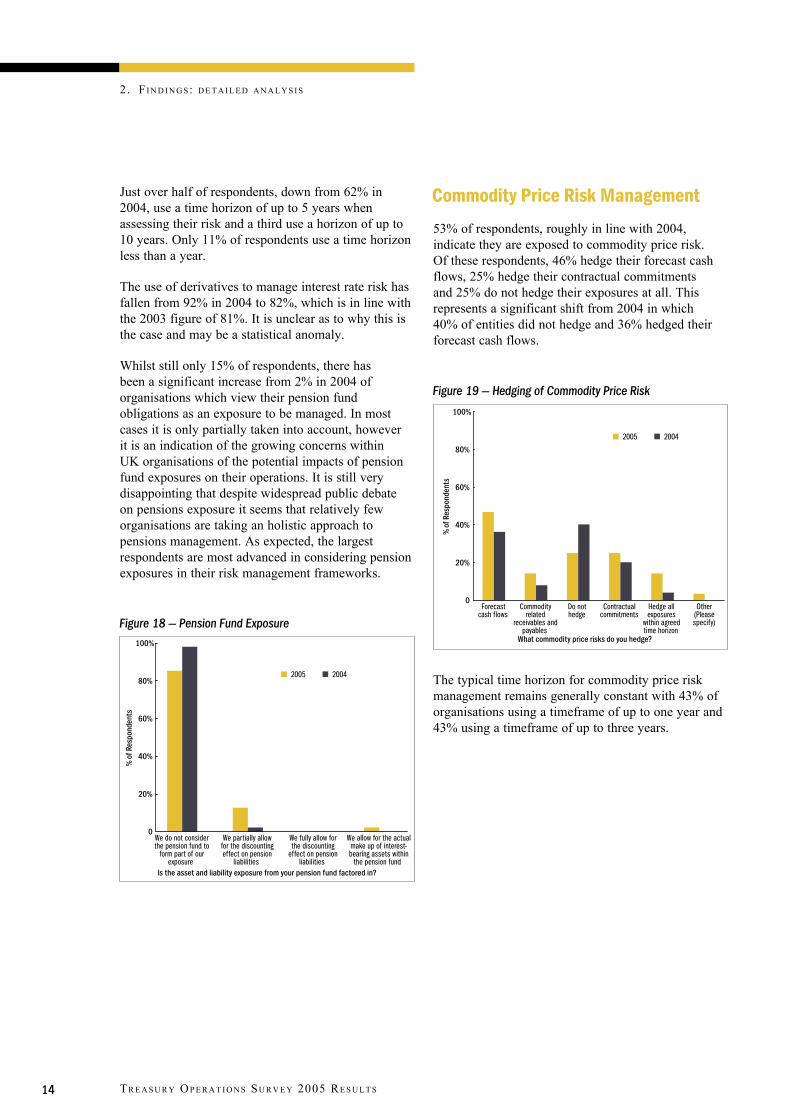
Whilst still only 15% of respondents, there has been a significant increase from 2% in 2004 of organisations which view their pension fund obligations as an exposure to be managed. In most cases it is only partially taken into account, however it is an indication of the growing concerns within UK organisations of the potential impacts of pension fund exposures on their operations. It is still very disappointing that despite widespread public debate on pensions exposure it seems that relatively few organisations are taking an holistic approach to pensions management. As expected, the largest respondents are most advanced in considering pension exposures in their risk management frameworks.
Commodity Price Risk Management
53% of respondents, roughly in line with 2004, indicate they are exposed to commodity price risk. Of these respondents, 46% hedge their forecast cash flows, 25% hedge their contractual commitments and 25% do not hedge their exposures at all. This represents a significant shift from 2004 in which 40% of entities did not hedge and 36% hedged their forecast cash flows.
The typical time horizon for commodity price risk management remains generally constant with 43% of organisations using a timeframe of up to one year and 43% using a timeframe of up to three years.

15
Liquidity Management
Just like 2004, 75% of respondents are satisfied with the effectiveness of cash flow forecasting for their daily liquidity management, with 21% of organisations not undertaking forecasting.
Satisfaction falls when considering weekly cash flow forecasting, with 69% satisfied and 25% not forecasting. 63% are satisfied with their monthly cash flow forecasting with 27% not satisfied and 10% not forecasting.
Unsurprisingly, given our experience and view in the market, only 51% of treasuries are satisfied with the quality of annual cash flow forecasting, down from 56% in 2004. A surprising 18% of organisations do not use annual cash flow forecasts for their liquidity management process and 31% are not satisfied with what they do receive.
Overall, larger organisations are happiest with the quality of cash flow forecasting they receive which may be a reflection of the additional resources available in their businesses to produce them and the greater costs that poor forecasting can cause.
The majority, 57% up from 51% in 2004 rely on business units to submit regular reports / forecasts to treasury. Only 14%, down from 18%, rely on verbal advice from business units and the remainder use data from accounting systems or management forecasts.
Figure 20 — Cashflow Forecasting
�
���
���
���
���
����
���
�����
����
����
���������������������
������� �����������������
������������������������������ ����������������
Figure 21 — Sources of Cashflow Forecasts
�
���
���
���
���
����
���
�����
����
����
������������������������������������������������������������������������
���������������������������������������������������������
���������������������
����������������������
����������������������������������
����������������������
������������������������������
�����������������������������
�����������������������������������������������������������������
������������

16 TR E A S U R Y OP E R A T I O N S SU R V E Y 2005 RE S U L T S
86% of respondents have liquidity reserves in the form of external committed facilities (such as standby lines). This represents a slight decline from 94% in 2004 and 90% in 2003. This difference is made up by an increase in the use of parent guarantees/support/loans of which 24% of respondents now rely on, up from 6% in 2003 and 2004. Much of this increase is from the smaller respondents, perhaps reflecting that this year’s respondents are more likely to be subsidiaries of foreign entities rather than a shift in the credit markets. 67% of respondents rely on cash and liquid investments to provide their necessary liquidity reserves.
2.3 Impact of IAS 39This year’s survey has simplified and considerably shortened the IAS 39 section, reflecting the development of the standard and the progress made by organisations to adopt and comply with the standard. However, some interesting trends are still apparent when similar questions are compared.
43% of respondents agree or strongly agree that accounting under IAS 39 better reflects the risks inherent within a treasury operation, compared to only 26% last year, possibly reflecting greater understanding of the requirements an impacts of the standard as it is implemented. However, 45%, down from 48% in 2004 disagree or strongly disagree, with 12% (26% in 2004) not knowing or indifferent, reflecting ongoing dissatisfaction with the impact of the standard, This was especially the case in larger organisations where hedging programmes are likely to be more extensive.
2. FI N D I N G S: D E T A I L E D A N A L Y S I S
Figure 23 — IAS 39: Accounting under IAS 39 better reflects the risks inherent within a treasury operation
�
���
���
���
���
����
���
�����
����
����
������������������������
���������
������������������
������
���������������
��������
Figure 22 — Liquidity Reserves
�
���
���
���
���
����
���
�����
����
����
���������������������������������������������
�����������������������
����������������������
��������������������������������
�����������������������������
��������������������
������������

17
Also polarised are views on the impact on reporting and management. 33% of respondents agree or strongly agree that the fair values focus has had the benefit of improving treasury reporting and management, compared to 41% who disagree and 26% who don’t know or are indifferent. This corresponds with the views on risk awareness. 39% of respondents agree or strongly agree that the awareness of treasury risks and management has improved as a result of IAS 39. This compares to 41% who disagree or strongly disagree and 20% who don’t know or are indifferent.
An interesting trend concerns views on the impact of IAS 39 on financial statements. In 2004, 87% of respondents felt that IAS 39 would have a material impact on their organisation’s financial statements, however this year this figure has fallen to 49%. 39%, up from 3% in 2004 now disagree or strongly disagree that there will be any impact. This seems a natural trend given the growing knowledge of what impacts IAS 39 has as more organisations implement its requirements.
Figure 24 — IAS 39: The fair values focus has had the benefit of improving treasury reporting and management
�
���
���
���
���
����
���
�����
����
����
������������������������
���������
������������������
������
���������������
Figure 25 — IAS 39 will have a material affect on the organisation’s financial statements
�
���
���
���
���
����
���
�����
����
����
������������������������
���������
������������������
������
���������������
��������
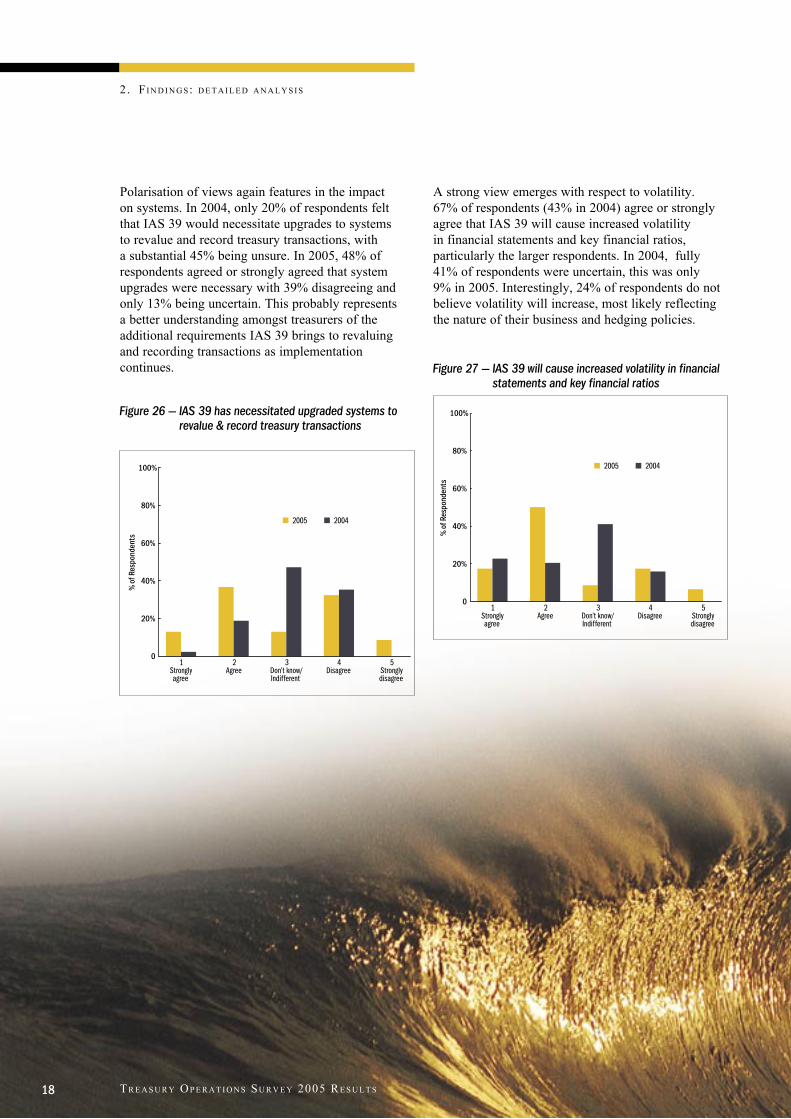
Polarisation of views again features in the impact on systems. In 2004, only 20% of respondents felt that IAS 39 would necessitate upgrades to systems to revalue and record treasury transactions, with a substantial 45% being unsure. In 2005, 48% of respondents agreed or strongly agreed that system upgrades were necessary with 39% disagreeing and only 13% being uncertain. This probably represents a better understanding amongst treasurers of the additional requirements IAS 39 brings to revaluing and recording transactions as implementation continues.
A strong view emerges with respect to volatility. 67% of respondents (43% in 2004) agree or strongly agree that IAS 39 will cause increased volatility in financial statements and key financial ratios, particularly the larger respondents. In 2004, fully 41% of respondents were uncertain, this was only 9% in 2005. Interestingly, 24% of respondents do not believe volatility will increase, most likely reflecting the nature of their business and hedging policies.
2. FI N D I N G S: D E T A I L E D A N A L Y S I S
Figure 26 — IAS 39 has necessitated upgraded systems to revalue & record treasury transactions
�
���
���
���
���
����
���
�����
����
����
������������������������
���������
������������������
������
���������������
��������
Figure 27 — IAS 39 will cause increased volatility in financial statements and key financial ratios
�
���
���
���
���
����
���
�����
����
����
������������������������
���������
������������������
������
���������������
��������
TR E A S U R Y OP E R A T I O N S SU R V E Y 2005 RE S U L T S18

Again, consensus is closer with respect to stakeholders. 47% of respondents are concerned that stakeholders will not understand the consequences of IFRS, with 26% uncertain and only 28% disagreeing.
The limitations of the impact of IAS 39 are shown in the views on business policies. 67% of respondents disagree or strongly disagree that IAS 39 has caused the organisation to change its business policies, with only 31% stating they had done so. Further, the impact on treasury has been limited with 92% of respondents indicating that IAS 39 has not impacted their treasury structure.
Another interesting indication that IAS 39’s impact is limited is the fact that 64% of respondents do not believe they will need to negotiate financial covenants in light of IAS 39 changes. This represents a decline from 73% in 2004 but is still strong evidence that lenders and bond holders are acknowledging the impacts of IAS 39 on financial reporting.
Figure 28 — IAS 39 has caused the organisation to change its treasury structure
�
���
���
���
���
����
���
�����
����
����
������������������������
���������
������������������
������
���������������
Figure 29 — IAS 39 means the organisation will have to negotiate its financial covenants in borrowing
�
���
���
���
���
����
���
�����
����
����
������������������������
���������
������������������
������
���������������
��������
19

Encouragingly, given the huge amount of resources many organisations have devoted to IAS 39 projects, it appears that 69% of organisations are able to achieve hedge accounting for the majority of treasury transactions. Only 15% of organisations do not appear able to do so. Similarly, 88% of organisations have been able to establish IAS 39 compliant hedging relationships and 83% have been able to document these hedging relationships. Smaller organisations however, have experienced more problems in this area, perhaps due to having less resources to tackle the issue.
Effectiveness testing has not been as straight-forward. Only 37% of organisations have not had a problem testing hedge effectiveness against an identical percentage who have. Fully 26% of organisations are uncertain, most likely reflecting that their IAS 39 compliance activities are not yet complete.
Valuations however do not appear to be a problem, with 85% of respondents able to obtain market valuations for their treasury instruments.
Foreign exchange hedging appears to be less of a problem for most organisations with only 22% of respondents indicating problems caused by IAS 39 not allowing a net FX position to be a hedged item. However, in the case of most other derivatives this is a more significant issue with 45% indicating that this has been a problem for them.
Uncertainty amongst respondents appears when considering the use of fair value. 55% of respondents don’t know or are indifferent to whether the use of fair value through the Profit and Loss Option will be useful to the organisation, with 34% disagreeing. This may be a reflection of unfamiliarity with this element of IAS 39.
Finally, the frustration of IFRS and related changes to accounting activities is reflected in the view of 49% of respondents who agree that overall, IAS 32, IAS 39 and ED 7 will result in the provision of excess information on treasury activity, with a further 40% not knowing or being indifferent.
2. FI N D I N G S: D E T A I L E D A N A L Y S I S
Figure 31 — Overall, IAS 32, IAS 39 and ED 7 will result in the provision of excess information on treasury activity
�
���
���
���
���
����
���
�����
����
����
������������������������
���������
������������������
������
���������������
20 TR E A S U R Y OP E R A T I O N S SU R V E Y 2005 RE S U L T S
Figure 30 — For the majority of treasury transactions, the organisation is able to achieve hedge accounting
�
���
���
���
���
����
���
�����
����
����
������������������������
���������
������������������
������
���������������

21


23
3. Background: Sample and Demographics
In terms of respondent’s scope of operations, 60% (down from 71% in 2004) are multinational organisations, 24% (up from 20% in 2004) are domestic organisations operating within one country and 10% are regional, operating within a region of several countries. The remainder were domestic or regional branches of multinational organisations.
Perhaps reflecting more globalisation amongst treasury functions, 56% of respondents have treasury operations outside of the UK, up from 42% in 2004 and 44% in 2005. Of these non-UK treasury functions, 50% report to the UK treasury, 23% (down from 45% in 2004) report to their local finance function and in 27% of cases (up from 5% in 2004) the UK treasury reports to an overseas treasury. These trends are mainly explained by the changing mix of respondents but there is some impact from the establishment of UK treasury operations by foreign organisation.
Of our respondents, 65% undertake less than 50 foreign exchange transactions a month, with 20% undertaking 51-150 and 12% more than 150. The remainder of respondents are financial services organisations.
Figure 32 — Scope of Operations
� ��� ��� ��� ��� ����
����������������
���
�����
�����
����
�����
����
����
����
����
�����
�
�������������
�����������������������������������������
����������������������������������������������������������
�����������������������������������������
���������������������������������������
������������
Figure 33 — Treasury Activity Levels Monthly Foreign Exchange Transactions
�
���
���
���
���
����
���
�����
����
����
����������������������
�������������
�����������������������������������������
��������������������
��������

3. BA C K G R O U N D: SA M P L E A N D DE M O G R A P H I C S
The activity profile is similar for derivative transactions with 98% of respondents undertaking less than 50 transactions per month and the remainder being financial services organisations.
Money market activities are more varied, with 40% of respondents undertaking less than 50 transactions per month, 48% undertaking 51-150 per month and the remainder undertaking more than 150 per month or are financial services organisations.
As would be expected, organisations with larger asset and turnover sizes tended to undertake more of all types of transactions than smaller organisations.
Figure 34 — Treasury Activity Levels Monthly Derivative Transactions
�
���
���
���
���
����
���
�����
����
����
����������������������
�������������
�����������������������������������������
��������������������
��������
Figure 35 — Treasury Activity Levels Monthly Money Market Transactions
�
���
���
���
���
����
���
�����
����
����
����������������������
�������������
�����������������������������������������
��������������������
��������
TR E A S U R Y OP E R A T I O N S SU R V E Y 2005 RE S U L T S24

25
Without being able to demonstrate
the value added by a corporate treasury, the function is often simply
seen as overhead and as the last couple of decades have shown, cost cutting and
efficiency pressures on organisations have led to the downsizing of treasuries and a general
contraction of opportunities within the corporate treasury profession. We consider the growing use of performance measures
as a positive step in increasing the value of treasury activities by
senior management.


27
4. About this Survey
BackgroundThe survey was conducted by the Corporate Treasury team of Ernst & Young’s Financial Services Risk Management practice in conjunction with the Association of Corporate Treasurers (ACT). It followed on from the successful 2003 and 2004 surveys and was aimed primarily at treasurers outside the financial sector.
The objectives of the Treasury Operations Survey 2005 were to allow treasurers to:
Express their opinions on key issues affecting treasury operation;
Benchmark their own operation against that of other organisations;
Identify the latest trends in the structuring of treasury operations and the management of risk; and
Understand what impact IAS 39 is having on other organisations.
Respondent ProfileWe invited all ACT members to respond to the survey and over 50 responses were received. The size of the respondents varied although the majority of organisations surveyed had total assets and turnover in excess of £1 billion including a small proportion greater than £10 billion.
Most treasuries surveyed deal less than 50 transactions a month for both FX and derivatives, with the volume of money market transactions being slightly higher.
Survey ResultsThis survey results report is available from both the Ernst & Young (www.ey.com/uk) and ACT (www.treasurers.org) websites. Additionally copies of this report are available from Natalie Cudlip via e-mail at [email protected] or at Ernst & Young, 1 More London Place, London, SE1 2AF.
AuthorPatrick Clarke
Manager Global Treasury Advisory Group Financial Services Risk Management Ernst & Young LLP
AcknowledgementsJeffrey Teague
Director Global Treasury Advisory Group Financial Services Risk Management Ernst & Young LLP
Belinda Harrison
Senior Marketing Manager Financial Services Risk Management Ernst & Young LLP
Martin O’Donovan
Technical Officer The Association of Corporate Treasurers


29
5. The Association of Corporate Treasurers (ACT)
Established in the UK in 1979, The Association of Corporate Treasurers (ACT) is a centre of excellence for professionals in treasury, risk and corporate finance operating in the international marketplace. From a growing worldwide membership we provide specialist qualifications, training and publications tailored to individual needs. Our attention to detail and commitment to quality ensures that the ACT is recognised as a leading provider of treasury products and services.
The ACT has over 3,500 members and 1,500 students in more than 40 countries. Its examinations are recognised by both practitioners and bankers as the global standard setters for treasury education and it is the leading provider of professional treasury education. The ACT promotes study and best practice in finance and treasury management. It represents the interests of non-financial sector corporations in financial markets to governments, regulators, standards setters and trade bodies.
If you would like further information on any of our activities, or wish to join, then please contact:
Louise Tatham
Ocean House 10/12 Little Trinity Lane London EC4V 2DJ
tel +44 (0)20 7213 9728 fax +44 (0)20 7248 2591 web www.treasurers.org
A copy of this survey is available for download at www.treasurers.org

31
6. Ernst & Young’s Global Treasury Advisory Services Group
Our team of experienced treasury professionals provides advice and support to clients in an increasingly challenging environment.
We help corporate and financial sector treasuries to:
Manage the risks to which their activities expose them;
Comply with the rules and regulations that govern different aspects of their operations; and
Assists and advise them to perform the various functions for which they are responsible as effectively as possible.
Our Services
Risk management assessment
Identification and quantification of the impact of all the risks that impact treasuries, review and develop risk management strategies, policies and procedures, and develop measurement processes for foreign currency, interest rate, commodity price, credit and operational risk.
International Accounting Standards
Assist companies in understanding and overcoming the challenges presented by convergence to International Accounting Standards, specifically IAS 39, through services such as impact assessments, diagnostic projects and assistance with the implementation of changes required to comply with IAS 39.
Treasury process and control review
Full review of all the functions performed by treasuries with gap analyses against leading industry practice and compliance with relevant legislation e.g. S. 404 of the Sarbanes-Oxley Act for SEC registrants.
Treasury structure
Development and implementation of innovative treasury structures that meet the business goals of the organisation whilst maximising the efficiency of the various functions within treasury.

32 TR E A S U R Y OP E R A T I O N S SU R V E Y 2005 RE S U L T S
6. ER N S T & YO U N G’S GL O B A L TR E A S U R Y AD V I S O R Y SE R V I C E S GR O U P
Cash forecasting and liquidity management
Review of a company’s cash collection and disbursement mechanisms, bank relationships and account structures on a worldwide basis to effect efficient management and investment of funds.
Asset and liability management
Review of a financial institution’s asset/liability management process from both the business and the regulatory perspective. The review addresses management oversight, data, risk measurement methodologies, modelling assumptions, controls, management reporting and risk limits.
Treasury systems
A wide spectrum of system related services including needs assessment, RFP development and scoring, vendor selection, project management and programme assurance.
Our Qualifications The right people, analytical processes and
technology to deliver results;
Expertise across all treasury risks including foreign currency, interest rate, commodity price, credit and operational risk;
Practical expertise in a wide range of industries and in different sizes of organisation; and
The ability to fully support and implement any recommendations.
In addition to the UK, the Treasury Advisory Group is also represented in Continental Europe, North America, Asia and Australia.
Contact details:
Jeffrey Teague
[email protected] +44 (0)20 7951 8494
Patrick Clarke
[email protected] +44 (0)20 7951 8904
A copy of the survey is available from www.ey.com/uk
33
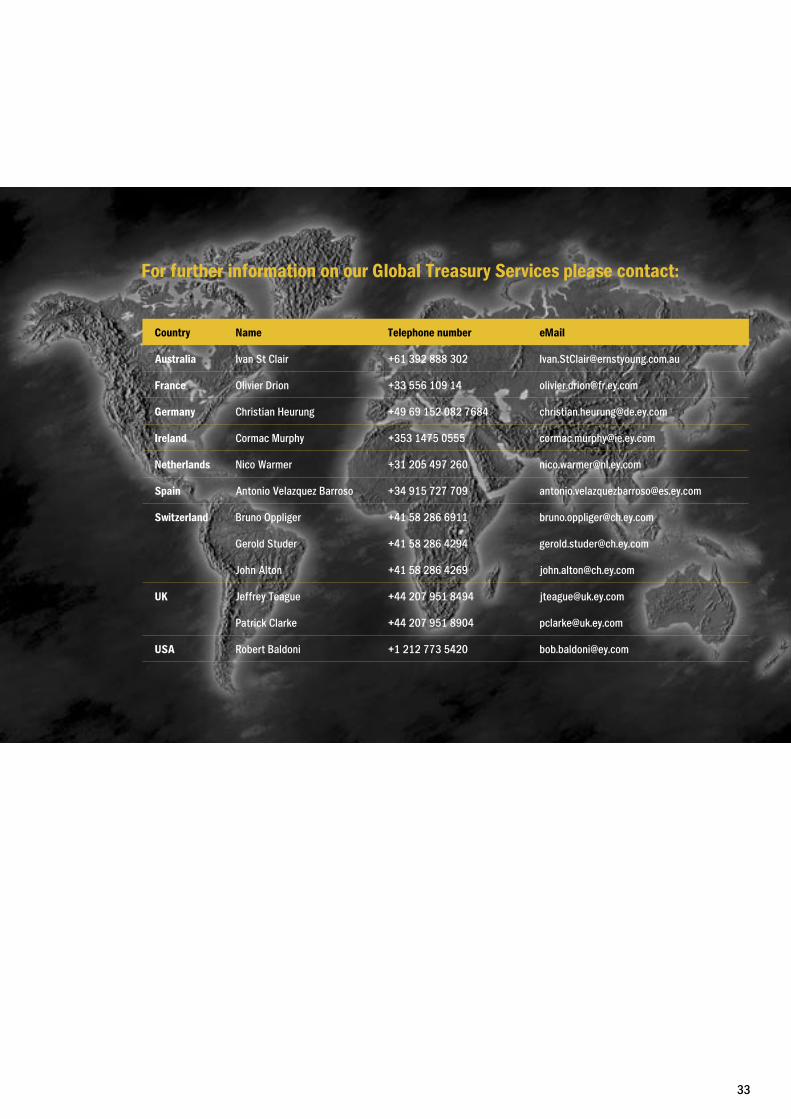
For further information on our Global Treasury Services please contact:
Country Name Telephone number eMail
Australia Ivan St Clair +61 392 888 302 [email protected]
France Olivier Drion +33 556 109 14 [email protected]
Germany Christian Heurung +49 69 152 082 7684 [email protected]
Ireland Cormac Murphy +353 1475 0555 [email protected]
Netherlands Nico Warmer +31 205 497 260 [email protected]
Spain Antonio Velazquez Barroso +34 915 727 709 [email protected]
Switzerland Bruno Oppliger +41 58 286 6911 [email protected]
Gerold Studer +41 58 286 4294 [email protected]
John Alton +41 58 286 4269 [email protected]
UK Jeffrey Teague +44 207 951 8494 [email protected]
Patrick Clarke +44 207 951 8904 [email protected]
USA Robert Baldoni +1 212 773 5420 [email protected]

© 2005 Ernst & Young LLP. Published in the UK. All rights reserved.
1 More London Place, London SE1 2AF.
The UK firm Ernst & Young LLP is a limited liability partnership registered in England and Wales with registered number OC300001 and is a member practice of Ernst & Young Global.
Information in this publication is intended to provide only a general outline of the subjects covered. It should neither be regarded as comprehensive nor sufficient for making decisions, nor should it be used in place of professional advice. Ernst & Young LLP accepts no responsibility for any loss arising from any action taken or not taken by anyone using this material.
2802.indd 09/2005 Produced by Ernst & Young Creative Services.
Ernst & Young LLP www.ey.com/uk