27 June 2008Copyright: Ganesha Associates1 Basic reading, writing and informatics skills for...
70
27 June 2008 Copyright: Ganesha Associ ates 1 Basic reading, writing and informatics skills for biomedical research Segment 6. Developing and presenting your project
-
Upload
dayna-howard -
Category
Documents
-
view
217 -
download
0
Transcript of 27 June 2008Copyright: Ganesha Associates1 Basic reading, writing and informatics skills for...

27 June 2008 Copyright: Ganesha Associates 1
Basic reading, writing and informatics skills for biomedical
researchSegment 6. Developing and
presenting your project

27 June 2008 Copyright: Ganesha Associates 2
Contents
• Writing a project proposal
• Experimental design
• Making a presentation

27 June 2008 Copyright: Ganesha Associates 3
Outline of a research proposal - 1
• Title
• Abstract
• Specific Aims
• Background & Significance
• Preliminary Data
• Methods
• Resources

27 June 2008 Copyright: Ganesha Associates 4
Outline of a research proposal - 2
• Title– What is the problem ?
• Abstract– Write it last– State the problem and the specific aims of the
project– Describe the main methodologies to be used– State the significance of the work– May be the only thing some reviewers read
27 June 2008 Copyright: Ganesha Associates 5
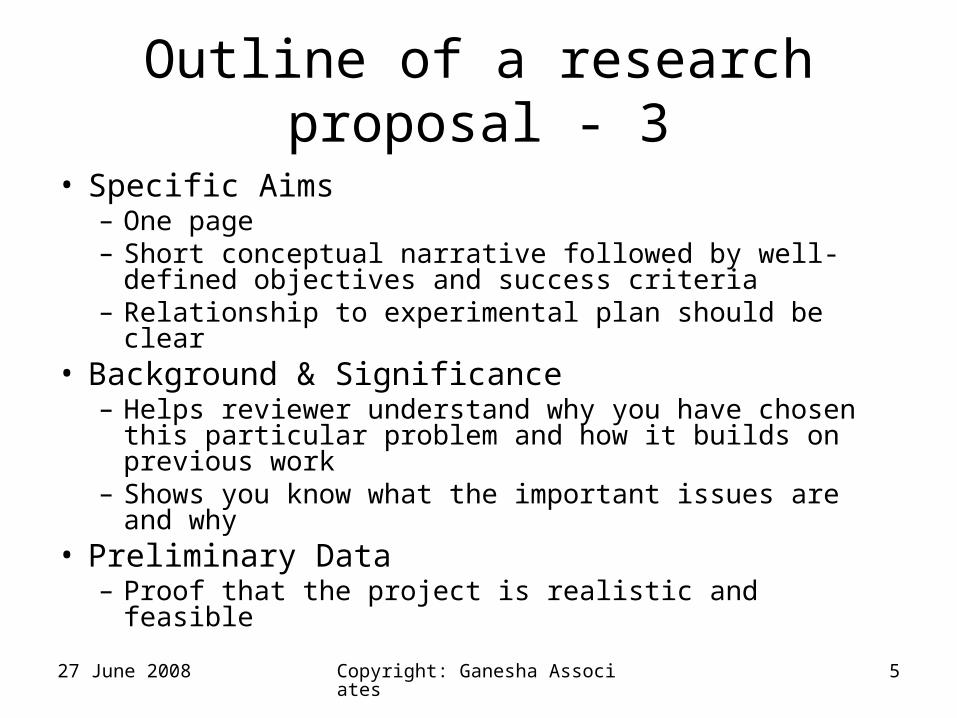
Outline of a research proposal - 3
• Specific Aims– One page– Short conceptual narrative followed by well-defined
objectives and success criteria– Relationship to experimental plan should be clear
• Background & Significance– Helps reviewer understand why you have chosen this
particular problem and how it builds on previous work– Shows you know what the important issues are and
why• Preliminary Data
– Proof that the project is realistic and feasible

27 June 2008 Copyright: Ganesha Associates 6
Outline of a research proposal - 4
• Methods– Presents a detailed plan of attack for each specific aim– Should support costs proposed in the budget– Describes how you will evaluate success in achieving your aims– Provides a flow chart of logic for each experiment's results and
the subsequent steps in the research plan– Addresses sub-optimal methodologies and offers rationale for
their use
• Resources– Includes time table, often at end of section, to make
organizational and resourcing requirements apparent– Budget

27 June 2008 Copyright: Ganesha Associates 7
Methods - choose your model system carefully
• In vivo, in vitro, in silico• Pharmacological, surgical, genetic• Example: Fetal malnutrition and metabolic
syndrome– Animal: Rat, mouse, human ?– Diet: Global under-nutrition, low maternal protein,
high fat diet during pregnancy– Single, or multigenerational study ?– Pharmacological, genetic or surgical model– Disease: diabetes, hypertension, cardiovascular– See review Brit. Med. Bull. 2001, 60, 103-121

27 June 2008 Copyright: Ganesha Associates 8
Methodology – make sure you understand the variables you are measuring
• What is the normal range of variation in measurement values ?
• Do you know why these arise ?
• What is the time course of the effect ?
27 June 2008 Copyright: Ganesha Associates 9
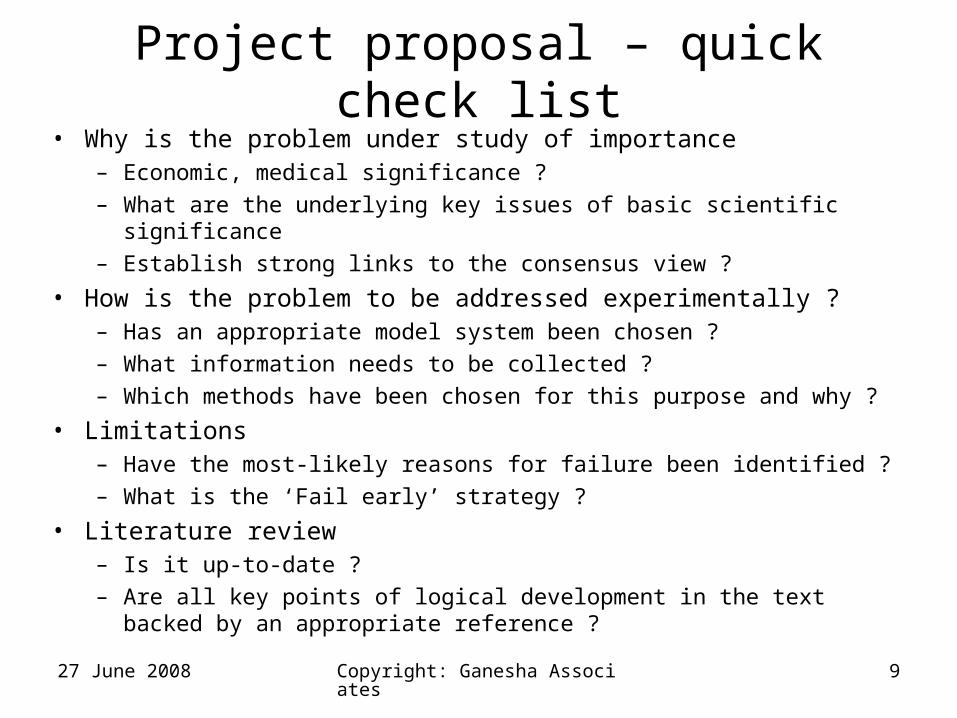
Project proposal – quick check list• Why is the problem under study of importance
– Economic, medical significance ?
– What are the underlying key issues of basic scientific significance
– Establish strong links to the consensus view ?
• How is the problem to be addressed experimentally ?– Has an appropriate model system been chosen ?
– What information needs to be collected ?
– Which methods have been chosen for this purpose and why ?
• Limitations– Have the most-likely reasons for failure been identified ?
– What is the ‘Fail early’ strategy ?
• Literature review– Is it up-to-date ?
– Are all key points of logical development in the text backed by an appropriate reference ?

27 June 2008 Copyright: Ganesha Associates 10
Experimental design
• Hypothesis• Assumptions, expectations• Statistics• Experiment 1• Results• Test assumptions• Experiment 2• Results...

27 June 2008 Copyright: Ganesha Associates 11
Experimental design
• An experimental strategy, often involving specialist statistical techniques, used to test hypotheses involving independent and dependent variables by means of manipulation of variables, controls and randomization.
• A true experiment involves the random allocation of participants to experimental and control groups, manipulation of the independent variable, and the use of a control group for comparison purposes.
27 June 2008 Copyright: Ganesha Associates 12
Early example of experimental design
• In 1747, while serving as surgeon on HM Bark Salisbury, James Lind, the ship's surgeon, carried out a controlled experiment to develop a cure for scurvy.
• Lind selected 12 men from the ship, all suffering from scurvy, and divided them into six pairs, giving each group different additions to their basic diet for a period of two weeks. The treatments were all remedies that had been proposed at one time or another.

27 June 2008 Copyright: Ganesha Associates 13
Early example of experimental design
• They were– A quart of cider per day – Twenty five gutts of elixir vitriol three times a
day upon an empty stomach, – Half a pint of seawater every day – A mixture of garlic, mustard and horseradish,
in a lump the size of a nutmeg – Two spoonfuls of vinegar three times a day – Two oranges and one lemon every day.

27 June 2008 Copyright: Ganesha Associates 14
Early example of experimental design
• The men who had been given citrus fruits recovered dramatically within a week. One of them returned to duty after 6 days and the other became nurse to the rest. The others experienced some improvement, but nothing was comparable to the citrus fruits, which were proved to be substantially superior to the other treatments.

27 June 2008 Copyright: Ganesha Associates 15
Early example of experimental design
• In this study his subjects' cases "were as similar as I could have them", that is he provided strict entry requirements to reduce extraneous variation.
• The men were paired, which provided replication. From a modern perspective, the main thing that is missing is randomized allocation of subjects to treatments.

27 June 2008 Copyright: Ganesha Associates 16
Statistics
• There are many types of statistical tests• Most can be carried out in Excel or with a
specialist statistics package• The problems include:
– Selecting the right test (preferably before you do the experiment)
– Understanding the assumptions on which the test is based (which may have an impact on your experimental design)
– Making sure the power of the test is adequate

27 June 2008 Copyright: Ganesha Associates 17
Variables
• The independent variables are the ones that the researcher expects to be the cause of an outcome of interest.
• The dependent variable is the outcome variable. In experimental research, this variable is expected to depend on a predictor (or independent) variable.
• For example, if a researcher wants to examine the effect of a drug on blood pressure, the drug is the independent variable, the blood pressure response the dependent variable.
• An experiments can have more than one independent or dependent variable, eg. Multivariate ANOVA

27 June 2008 Copyright: Ganesha Associates 18
Some definitions
• For a data set, the mean is the sum of the observations divided by the number of observations.
• The mean is often quoted along with the standard deviation which describes the spread of the data about the mean.
• Standard error – a statistical measure of variation in a population of means
• The variance is a measure of statistical dispersion, the average of the squared differences between sample values and the expected value (mean).
27 June 2008 Copyright: Ganesha Associates 19
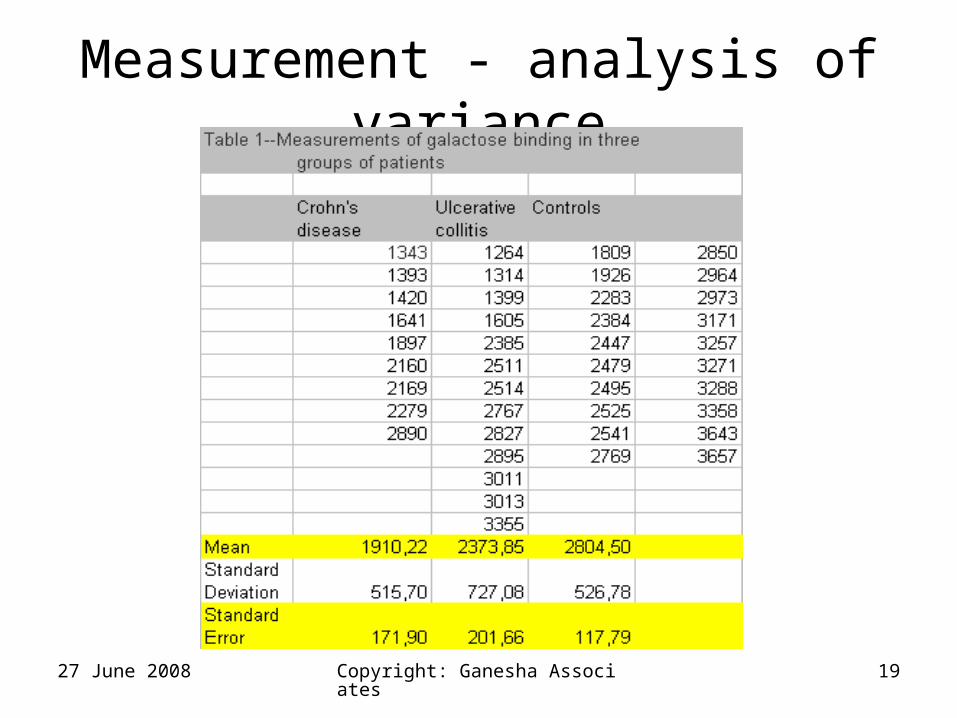
Measurement - analysis of variance

27 June 2008 Copyright: Ganesha Associates 20
Measurement - 1
• Repeated measurements are rarely the same• This variation can be expressed as a frequency histogram• The variation may be due to experimental error or to natural variations in
the variable being measured • The standard deviation about the mean is a statistic that is used to define
this variation precisely

27 June 2008 Copyright: Ganesha Associates 21
Measurement - 2
• When many observations are made, the histogram becomes a curve.• In many cases this curve can be described precisely by a mathematical
equation – called the ‘normal distribution’.• The normal distribution can be defined mathematically by its mean and its
standard deviation.• Note, biological phenomena at best only approximate to the normal curve

27 June 2008 Copyright: Ganesha Associates 22
Measurement - 3
• If you take a sample of n measurements of a variable that has a normal distribution (blue) then you can calculate an estimate of the mean and the standard deviation.
• If you repeat this sampling many times than you will get a second, narrower normal distribution (green - n, red - 4n).
• The standard deviation of these errors is known as the standard error.

27 June 2008 Copyright: Ganesha Associates 23
Measurement - 4
• Imagine that the green curve is the distribution of possible means of n measurements for the blood pressure of control animals, and the purple curve is the corresponding distribution for animals receiving the drug.
• The actual mean recorded for the test animals is shown by the grey arrow on the left, controls on the right.
• Can I tell from these measurements whether the drug had an effect ?

27 June 2008 Copyright: Ganesha Associates 24
Measurement - 5
• No !• All I can do is calculate the probabilty that both sets of measurements
come from the same normal distribution, i.e. Ho, the null hypothesis, ‘there is no effect’
• If the probability is sufficiently low, usually p<0.05, then I may choose to reject the Ho.. But I could still be wrong...

27 June 2008 Copyright: Ganesha Associates 25
Statistical tests
• Most statistical tests begin with the assumption that each data sample (control, test, etc) was drawn from the same population, i.e. that there is no treatment effect
• They assume that the individual measurements are normally distributed (or can be transformed so that they approximate to a normal distribution)

27 June 2008 Copyright: Ganesha Associates 26
Assumptions
• Controls and test subjects must from identical populations– Age, gender, medical history, genetics...
• Data are independent• Effects of multiple testing have been accounted
for• Sources of human bias have been controlled for• The power of the statistical test is sufficient to
detect the change predicted. Use a positive control

27 June 2008 Copyright: Ganesha Associates 27
Assumptions - controls
• Suppose a farmer wishes to evaluate a new fertilizer. She uses the new fertilizer on one field of crops (A), while using her current fertilizer on another field of crops (B).
• The irrigation system on field A has recently been repaired and provides adequate water to all of the crops, while the system on field B will not be repaired until next season.
• She concludes that the new fertilizer is far superior.
• Examples from clinical genetics

27 June 2008 Copyright: Ganesha Associates 28
Assumptions – independence (1)• Statistical tests are based on the assumption that
each subject was sampled independently of the rest. • Consider the following three situations:
– You are measuring blood pressure in animals. – You have five animals in each group, and measure the blood
pressure three times in each animal. – You do not have 15 independent measurements, because
the triplicate measurements in one animal are likely to be closer to each other than to measurements from the other animals.
– You should average the three measurements in each animal.
– Now you have five mean values that are independent of each other.

27 June 2008 Copyright: Ganesha Associates 29
Assumptions – independence (2)– You have done a biochemical experiment three times,
each time in triplicate. You do not have nine independent values, as an error in preparing the reagents for one experiment could affect all three triplicates. If you average the triplicates, you do have three independent mean values.
– You are doing a clinical study, and recruit ten patients from an inner-city hospital and ten more patients from a suburban clinic. You have not independently sampled 20 subjects from one population. The data from the ten inner-city patients may be closer to each other than to the data from the suburban patients. You have sampled from two populations, and need to account for this in your analysis.

27 June 2008 Copyright: Ganesha Associates 30
Assumptions – multiple tests
• If you test several independent null hypotheses, and leave the threshold at 0.05 for each comparison, there is greater than a 5% chance of obtaining at least one "statistically significant" result by chance
• For example, if you test three null hypotheses and use the traditional cutoff of p<0.05 for declaring each p value to be significant, there would be a 14% chance of observing one or more significant p values, even if all three null hypotheses were true.
• To keep the overall chance at 5%, you need to lower the threshold for significance to 0.0170.

27 June 2008 Copyright: Ganesha Associates 31
Assumptions - bias
• Double blind experiments
• A research design where both the experimenter and the subjects are unaware of which is the treatment group (drug) and which is the control (placebo).

27 June 2008 Copyright: Ganesha Associates 32
Types of statistical test - 1
• Number of independent variables– Drug, diet...
• Number of dependent variables– Blood pressure, heart rate, glucose levels...
• Type of data– Parametric, non-parametric

27 June 2008 Copyright: Ganesha Associates 33
Types of statistical test - 2
• Student's t-test • chi-square test • Analysis of variance (ANOVA) • Mann-Whitney U • Regression analysis • Factor Analysis • Correlation • Pearson product-moment correlation coefficient • Spearman's rank correlation coefficient • Time Series Analysis

27 June 2008 Copyright: Ganesha Associates 34
Types of statistical test - 3
• Interval, or parametric– 0.32, 1052, etc– Normal distribution
• Nominal, or non-parametric– Male, pregnant, red– Binary distribution
• Ordinal, or non-parametric– First, third– Order by rank

27 June 2008 Copyright: Ganesha Associates 35
Types of statistical test - 4

27 June 2008 Copyright: Ganesha Associates 36
Types of statistical test - 5
When we have more than two groups, it is inappropriate to simply compare each pair using a t-test because of the problem of multiple testing.
The correct way to do the analysis is to use a one-way analysis of variance (ANOVA) to evaluate whether there is any evidence that the means of the populations differ.
If the ANOVA leads to a conclusion that there is evidence that the group means differ, we might then be interested in investigating which of the means are different.

27 June 2008 Copyright: Ganesha Associates 37
Types of statistical test - 6
Tukey's multiple comparison test is one of several tests that can be used to determine which means amongst a set of means differ from the rest.
The results are presented as a matrix showing the result for each pair, either as a P-value or as a confidence interval.
The Tukey multiple comparison test, like both the t-test assumes that the data from the different groups come from populations where the observations have a normal distribution and the standard deviation is the same for each group.

27 June 2008 Copyright: Ganesha Associates 38
“Why most published research findings are false”
• There is increasing concern that most current published research findings are false.
• A research finding is less likely to be true:– when the studies conducted in a field are smaller– effect sizes are smaller– when there is a greater number and lesser pre-selection of tested
relationships– where there is greater flexibility in designs, definitions, outcomes, and
analytical modes– when there is greater financial and other interest and prejudice– when more teams are involved in a scientific field in chase of statistical
significance. • For many current scientific fields, claimed research findings may
often be simply accurate measures of the prevailing bias.
John Ioannidis, PLos Medicine, 30 Aug 2005
27 June 2008 Copyright: Ganesha Associates 39
Learning points
• If you aren’t certain how much variation to expect in your experiment, try a small scale preliminary version.
• The more measurements you take, the greater the precision, but
• First try to identify and eliminate some of the sources of variation

27 June 2008 Copyright: Ganesha Associates 40
Collecting data – keep a notebook
27 June 2008 Copyright: Ganesha Associates 41
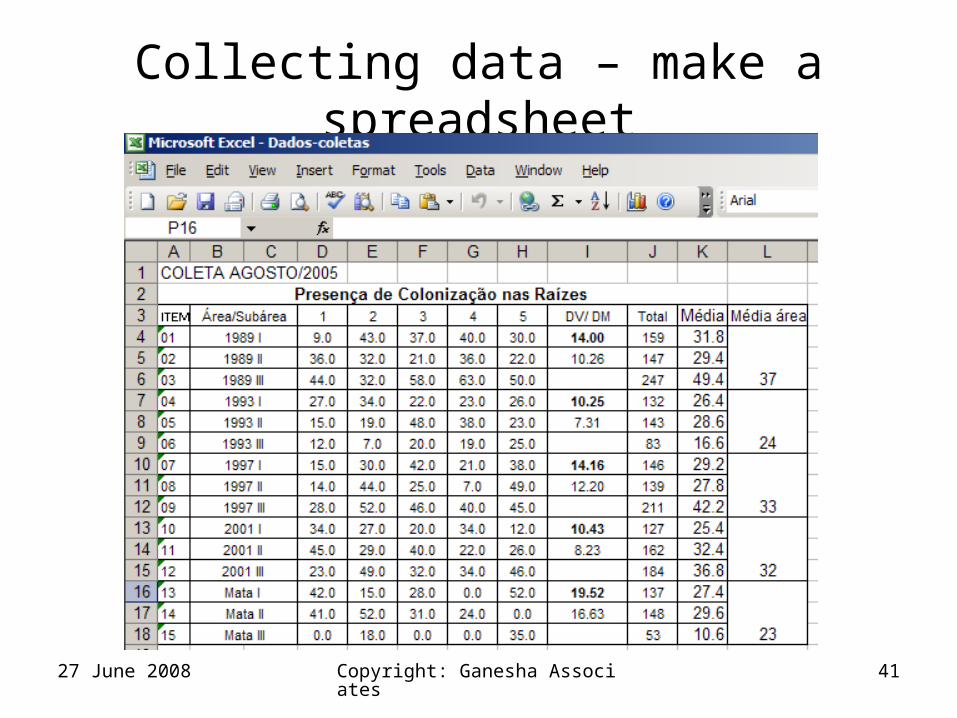
Collecting data – make a spreadsheet

27 June 2008 Copyright: Ganesha Associates 42
Collecting data – check key assumptions
0.0
10.0
20.0
30.0
40.0
50.0
60.0
16 I 16 II 16 III 12 I 12 II 12 III 8 I 8 II 8 III 4 I 4 II 4 III MataI
MataII
MataIII
Subáreas
Col
oniz
ação
(%
) Jan-05
Aug-05
Linear (Jan-05)
Linear (Aug-05)

27 June 2008 Copyright: Ganesha Associates 43
Beware, in biology there are many unknowns
“As we know,There are known knowns.There are things we know we know.We also knowThere are known unknowns.That is to sayWe know there are some thingsWe do not know.But there are also unknown unknowns,The ones we don't knowWe don't know.”
Donald Rumsfeldt, US Secretary of Defense (sic)Feb. 12, 2002, Department of Defense news briefingfrom "The Poetry of D.H. Rumsfeldt"
http://slate.msn.com/id/2081042/

27 June 2008 Copyright: Ganesha Associates 44
Presenting your ideas
• Create a slide show that is an outline, not a script
• Use the slide show... – to select important information and visuals– to organize content – to create a hierarchy
• Many of the subsequent slides were adapted from work done by the Cain Project in Engineering & Professional Communication
• www.owlnet.rice.edu/~cainproj

27 June 2008 Copyright: Ganesha Associates 45
Selecting Content
• Consider your audience – not everyone will have your knowledge of the problem!
• State problem/question clearly, early and repeat (in the title, in the introduction)
• Explain the significance, context• Include background:
organism/system/model• State the point of departure for work
precisely

27 June 2008 Copyright: Ganesha Associates 46
Displaying Text• Remember that your audience...
– skims each slide– looks for critical points, not details – needs help reading/ seeing text – So keep to an outline only
• Help your audience by…– Projecting a clear font– Using bullets– Using content-specific headings– Using short phrases– Using grammatical parallelism

27 June 2008 Copyright: Ganesha Associates 47
Project a clear font
• Serif: easy to read in printed documents– Times New Roman, Palatino, Garamond
• Sans serif: easy to see projected across the room– Arial, Helvetica, Geneva

27 June 2008 Copyright: Ganesha Associates 48
Use bullets – but not too many
• Bullets help your audience– to skim the slide– to see relationships between information– organize information in a logical way
• For example, this is Main Point 1, which leads to...– Sub-point 1
• Further subordinated point 1• Further subordinated point 2
– Sub-point 2

27 June 2008 Copyright: Ganesha Associates 49
Use content-specific headings
• “Results” suggests the content area for a slide
• “Substance X up-regulates gene Y” (with data shown below) shows the audience what is observed

27 June 2008 Copyright: Ganesha Associates 50
Use short phrases
• Be clear, concise, accurate
• Write complete sentences only in certain cases:
Hypothesis / problem statement
Quote
???
Difficult to read
DNA polymerase catalyzes elongation of DNA chains in
the 5’ to 3’ direction
Better
DNA polymerase extends 5’ to 3’

27 June 2008 Copyright: Ganesha Associates 51
Use grammatical parallelism• Use same grammatical form in lists
• Not Parallel:– Cells were lysed in buffer– 5 minute centrifuging of lysate– Removed supernatant
• Parallel:– Lysed cells in buffer– Centrifuged lysate for 5 minutes– Removed supernatant

27 June 2008 Copyright: Ganesha Associates 52
Use grammatical parallelismHow would you revise this list?
Telomeres• Contain non-coding DNA• Telomerases can extended telomeres• Cells enter senescence/apoptosis when telomeres
are too short

27 June 2008 Copyright: Ganesha Associates 53
Use grammatical parallelismOne possible revision…
Telomeres• Contain non-coding DNA• Are extended by telomerase• Cause senescence/apoptosis when shortened too
much

27 June 2008 Copyright: Ganesha Associates 54
Displaying visuals• Select visuals that enhance understanding
– Figures from your work: evidence for argument
– Figures from other sources (web; review articles):
• Model a process or concept• Help explain background, context
• Design easy-to-read visuals– Are the visuals easy to read by all members of
your audience?
• Draw attention to aspects of visuals

27 June 2008 Copyright: Ganesha Associates 55
Simplify and draw attention
http://www.indstate.edu/thcme/mwking/tca-cycle.html

27 June 2008 Copyright: Ganesha Associates 56
Cite others’ visuals
http://www.bioc.rice.edu/~shamoo/shamoolab.html
Harvey et al. (2005) Cell 122:407-20

27 June 2008 Copyright: Ganesha Associates 57
Samples
Features to consider:• Text
– Fonts, use of phrases, parallelism
• Visuals– Readability, drawing attention
• Slide design• Organization/ hierarchy
– Titles, bullets, arrangement of information, font size
27 June 2008 Copyright: Ganesha Associates 58

27 June 2008 Copyright: Ganesha Associates 59
27 June 2008 Copyright: Ganesha Associates 60

27 June 2008 Copyright: Ganesha Associates 61
27 June 2008 Copyright: Ganesha Associates 62

27 June 2008 Copyright: Ganesha Associates 63
The Calcium Ion
Calcium is a crucial cell-signaling molecule
–Calcium is toxic at high intracellular concentrations because of the phosphate-based system energy system
–Intracellular concentrations of calcium are kept very low, which allows an influx of calcium to be a signal to alter transcription

27 June 2008 Copyright: Ganesha Associates 64
Microarrays
Phillips G. (2004) Iowa State University College of Veterinary Medicine.

27 June 2008 Copyright: Ganesha Associates 65
Presenting
• Delivery
• Handling questions

27 June 2008 Copyright: Ganesha Associates 66
Delivery
• Physical Environment• Stance
– Body language– Handling notes
• Gestures• Eye contact• Voice quality
– Volume– Inflection– Pace

27 June 2008 Copyright: Ganesha Associates 67
Handling Questions
• LISTEN
• Repeat or rephrase
• Watch body language
• Don’t pretend to know
27 June 2008 Copyright: Ganesha Associates 68
Practical activity 6a - Developing and presenting your project
• Total duration - ca. 2 hours.• Identify the five most important research articles that frame your
hypothesis, i.e. the fundamental facts and assumptions upon which your idea is based.
• Describe the basis for your hypothesis in a paragraph of no more than seven sentences.
• Read the article by Peter Norvig on experimental design. (For Firefox users the alternative URL is here.)
• What alternative experimental approaches are available to answer your question ?
• How do you intend to verify your hypothesis?• Identify and justify the journal you want to publish the results of your
research in. • Give a 5-slide presentation to justify your choices at the next
session.

27 June 2008 Copyright: Ganesha Associates 69
Practical activity 6b - Thinking about probability and statistics
• Total duration - ca. 3 hours.• First read the series of articles published recently by Wai-Ching Leung in the British Medical Journal.
Although intended for a medical audience, these article provide the basis for a useful primer for all most fields of biomedical research. The articles are:
• Why and when do we need medical statistics • Measuring chances • Summarising information • Testing hypotheses • Now answer the following questions:• I have a plant extract which I believe has an effect on blood pressure. I measure its effects by injecting the
substance into rats and measuring their blood pressure before and after the injection. The statistical test I use tells me that the probability of collecting this sample of results is less than 0.05. What does this mean ?
• 1% of women aged forty who participate in routine mamography screening have breast cancer. 80% of the women with breast cancer get a positive result. 9.6% of women without breast cancer will also get a positive result. So, if a woman from this group gets a positive result, what is the probablity that she has breast cancer ?
• In the UK, car registration plates can typically consist of a string of 6 or 7 alphanumeric characters (A, B, C, etc, 1, 2, 3 etc). So the probability of a specific sequence of characters (e.g. DB1979) is less than 1 in 2 billion. I send a small group of people out into a car park and ask them to look for a registration plate that has personal significance for them. What is the likelihood of this happening ?
• A friend of mine has consistently predicted the results of 5 of the football matches leading to today's final. He is offering to sell me his prediction for the final match so that I can place a bet and make some money. What are the odds that he will predict the outcome of the last match correctly ?
• A murder is committed. Traces of your fingerprints are found on the murder weapon. What is the probability that you are guilty ?

27 June 2008 Copyright: Ganesha Associates 70
Practical activity 6c - Presenting data
• Total duration - ca. 1 hour.
• Read Mary Purugganan's presentation about data visualisation. Identify some examples of illustrations used in recent primary research papers which illustrate some of the points she makes.