27 JULY 2017 - Inchcape · PDF file• H1 UK Service GP +5% YoY UK Note: Acqn. refers to...
33
H1 2017 RESULTS 27 JULY 2017
Transcript of 27 JULY 2017 - Inchcape · PDF file• H1 UK Service GP +5% YoY UK Note: Acqn. refers to...

H1 2017 RESULTS27 JULY 2017
STEFAN BOMHARDGROUP CHIEF EXECUTIVE

3
H1 2017 HIGHLIGHTS
Broad-based earnings growth
Strong EM performance & return to profit growth in Asia
Distribution M&A momentum
Distribution c.75% Group profit
Strong free cash flow generation
Continuing to deliver on Ignite strategy
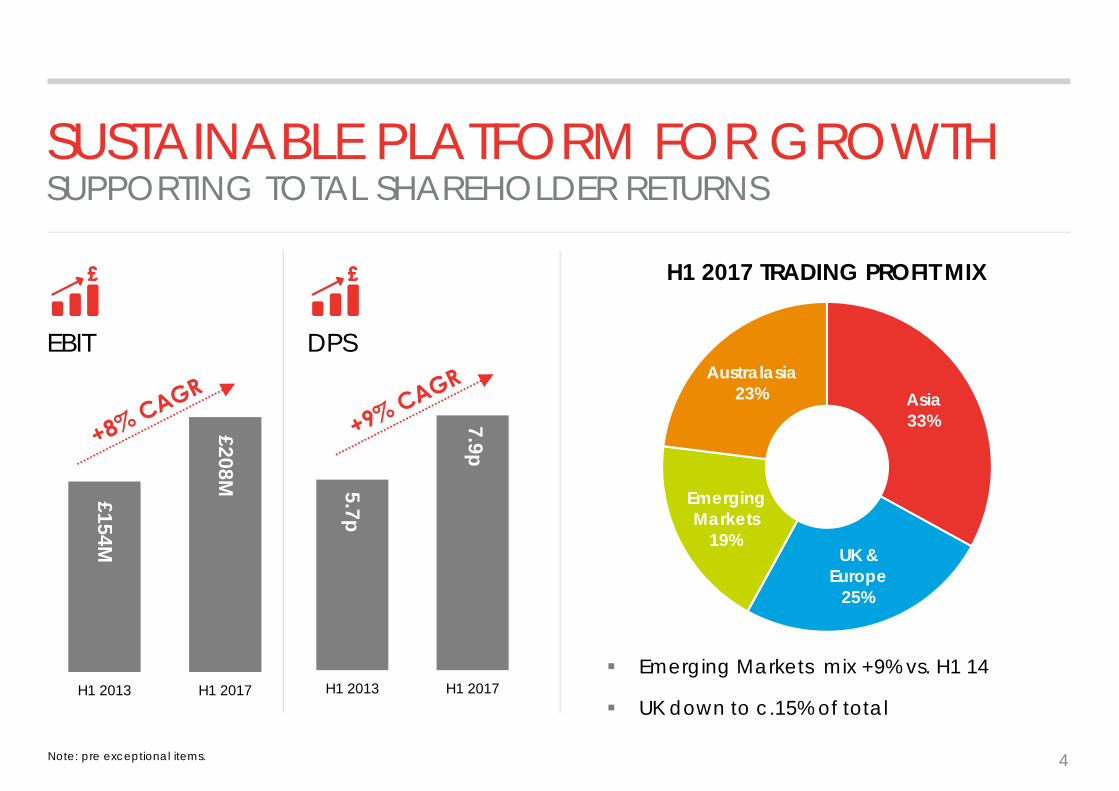
Asia33%
UK & Europe
25%
Emerging Markets
19%
Australasia23%
H1 2013 H1 2017H1 2013 H1 2017
£154M
£208M 5.7p
7.9p
SUSTAINABLE PLATFORM FOR GROWTHSUPPORTING TOTAL SHAREHOLDER RETURNS
Note: pre exceptional items. 4
EBIT
H1 2017 TRADING PROFIT MIX
DPS
Emerging Markets mix +9% vs. H1 14
UK down to c.15% of total
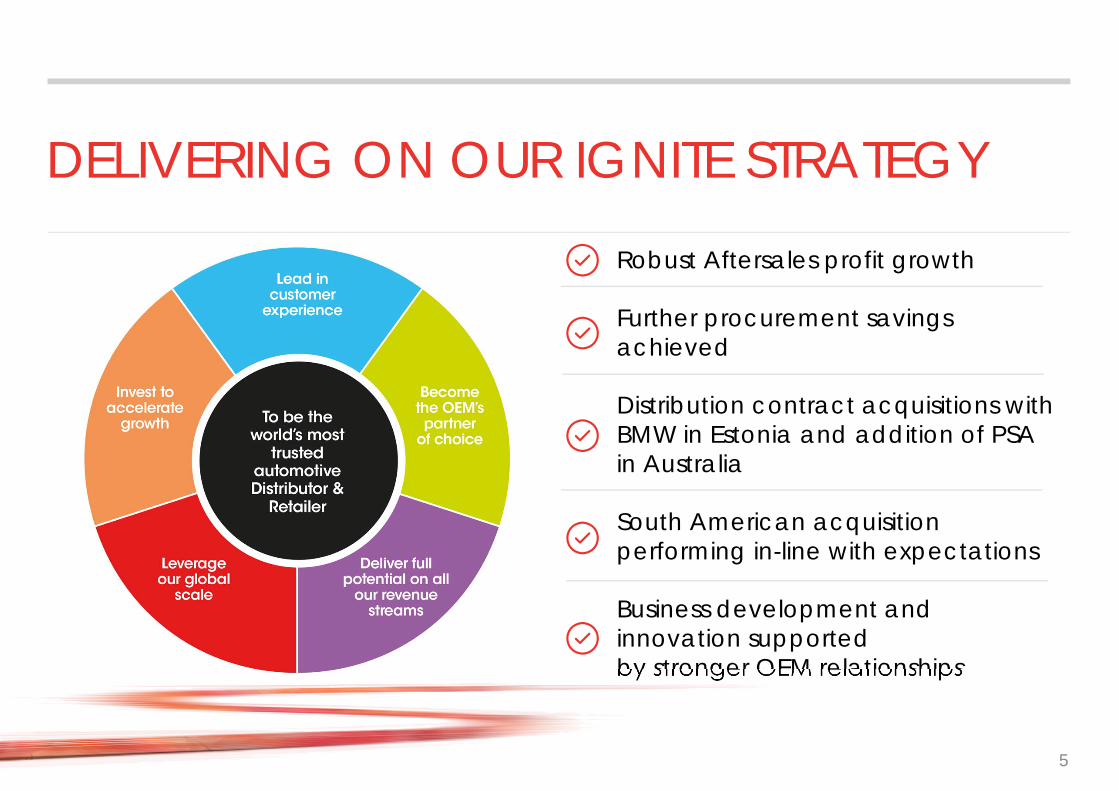
DELIVERING ON OUR IGNITE STRATEGY
5
Robust Aftersales profit growth
Further procurement savings achieved
Distribution contract acquisitions with BMW in Estonia and addition of PSA in Australia
South American acquisition performing in-line with expectations
Business development and innovation supported by stronger OEM relationships

RICHARD HOWESCHIEF FINANCIAL OFFICER
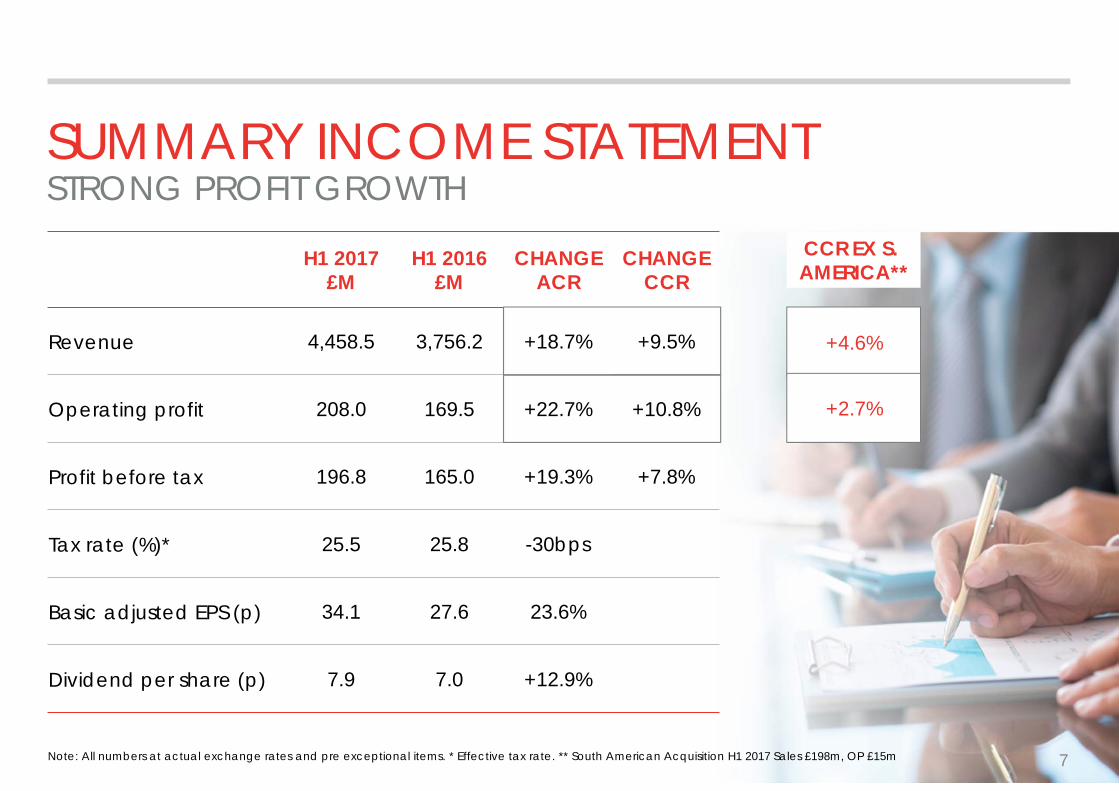
SUMMARY INCOME STATEMENTSTRONG PROFIT GROWTH
7
H1 2017£M
H1 2016£M
CHANGEACR
CHANGECCR
Revenue 4,458.5 3,756.2 +18.7% +9.5%
Operating profit 208.0 169.5 +22.7% +10.8%
Profit before tax 196.8 165.0 +19.3% +7.8%
Tax rate (%)* 25.5 25.8 -30bps
Basic adjusted EPS (p) 34.1 27.6 23.6%
Dividend per share (p) 7.9 7.0 +12.9%
Note: All numbers at actual exchange rates and pre exceptional items. * Effective tax rate. ** South American Acquisition H1 2017 Sales £198m, OP £15m
+4.6%
+2.7%
CCR EX S. AMERICA**

DISTRIBUTION
8Note: All numbers at actual exchange rates in table.
45% of Group Revenue
73% of Group Trading profit
Strong underlying profit growth, driven by Asia and Emerging Markets
Indumotora acquisition profit accretive (£15m)
Yen headwind in Australasia c.£20m
Aftersales Gross Profit +17% CCR
H1 2017 £M
H1 2016 £M
CHANGEACR
CHANGECCR
Revenue 2,027.2 1,549.9 +30.8% +16.7%
Trading profit 161.1 130.3 +23.6% +10.7%
Trading margin % 7.9% 8.4% -50 bps

£130M
£161M£15M £20M
£9M
£2M£7M
£3M
£15M
H1 16 FX Yen impact Australasia -underlying
UK & Europe Asia EM H1 17
DISTRIBUTION – TRADING PROFIT
9Note: Regional profit growth at CCR
Acquisition

RETAIL
Note: All numbers at actual exchange rates in table. 10
55% of Group Revenue
27% of Group Trading profit
Retail decreasing in the mix
Continue to optimise property portfolio
Aftersales Gross Profit +8% CCR
H1 2017 £M
H1 2016 £M
CHANGEACR
CHANGECCR
Revenue 2,431.3 2,206.3 +10.2% +4.1%
Trading profit 60.3 53.4 +12.9% +8.1%
Trading margin % 2.5% 2.4% +10 bps

RETAIL – TRADING PROFIT
11Note: Regional profit growth at CCR
£53M£60M
£2M£9M
£3M £1M £0M
H1 16 FX Australasia -property profit
Australasia -underlying
UK & Europe EM H1 17

GROUP OPERATING PROFIT
12
MARGIN6.3% 2.5% 9.3% 6.3% 4.7%
-90 bps -10 bps +80 bps -30 bps +20 bps
PROFIT YOY CHANGE (CCR)
-10.3%(+9% ex Yen impact/ property)
+1.8% +10.1% +76.5%(+12% ex
Acqn)
+10.8%
Group Growth +22.7%
£170MH1 2016
£208MH1 2017
(YoYprofit
growth)
Translational FX+£17m
Yen impact £20m
Asia+£7m
UK & Europe+£1m
EM
Australasia (Ex Yen impact)
+£15m *
Note: Regional profit growth at CCR; Acqn. refers to South American acquisition in Dec 2016; * Australasia (ex Yen impact) includes £9.3m property profit.
Acquisition+£15m
Organic+£3m
CCR (inc Yen impact) Group Growth +10.8%

VALUE DRIVER DISCLOSUREAFTERSALES AND VEHICLES
13
Aftersales growing well, Yen pressure for Vehicle GP
GROSS PROFIT (£M)
YoYCHANGE
H1 2017 CCR
GROUP
Vehicles 386.3 3.9%
Aftersales 228.7 12.9%
Total 615.0 7.1%
GROSS PROFIT MIX
Vehicles 63% (-2% YoY)
Aftersales 37% (+2% YoY)
Note: Acqn. refers to South American acquisition in Dec 2016, YoY is CCR
-
+8.1%
(4.7)%
YoYCHANGE
Ex Acqn*

OPERATING & FREE CASH FLOW
14
2017 GUIDANCE UNCHANGEDUnderlying capital expenditure £75m
£25m additional spend
OPERATING CASH FLOWH1
2017£M
H1 2016£M
FREE CASH FLOWH1
2017£M
H1 2016£M
Operating profit* 208.0 169.5 Operating cash flow 252.0 134.8
Depreciation / amortisation 31.1 26.2 Net interest (11.2) (5.2)
Working capital 19.6 (62.8) Taxation (51.1) (52.5)
Pension 1.2 0.6 Non controlling interest (6.5) (6.5)
Other (7.9) 1.3 Net capex (33.4) (27.4)
Operating cash flow * 252.0 134.8 Free cash flow 149.8 43.2
Conversion 121% 80% Conversion 72% 25%
Note: All numbers at actual exchange rates. * Pre exceptional items
FIXED COST REVIEW UPDATEProgress on track
£10m 2017 exceptional
WORKING CAPITAL2017 WC improvements and adverse timing impact on 2016 WC movement

INCOME STATEMENT REVIEW
15
£M H1 2017£M
H1 2016£M
Trading profit 221.4 183.7
Central costs (13.4) (14.2)
Operating profit 208.0 169.5
Operating margin 4.7% 4.5%
Finance charges / JVs (11.2) (4.5)
Profit before tax 196.8 165.0
Tax (50.1) (42.6)
Tax % 25.5% 25.8%
Minority interest (MI) (4.0) (3.7)
Profit after MI 142.7 118.7
Note: All numbers at actual exchange rates and pre exceptional items
Tax rate
25-26%
Interest cost
c.£19m
2017 GUIDANCE

16
Strong balance sheet – Prudent & retaining firepower for M&A
Organic investment • Capex and Working Capital• Key H1 investments: BMW Poznan (Poland)
• Acquisitions – Estonia (BMW) and Australia (PSA)• Integration of significant South American
acquisition going to plan• Pipeline of opportunities in fragmented market
• £400m returned to shareholders through share buybacks since 2013
• Dividend payout ratio 40%
Selective M&A
Cash returns
Prio
ritie
s
CAPITAL ALLOCATIONDISCIPLINED APPROACH
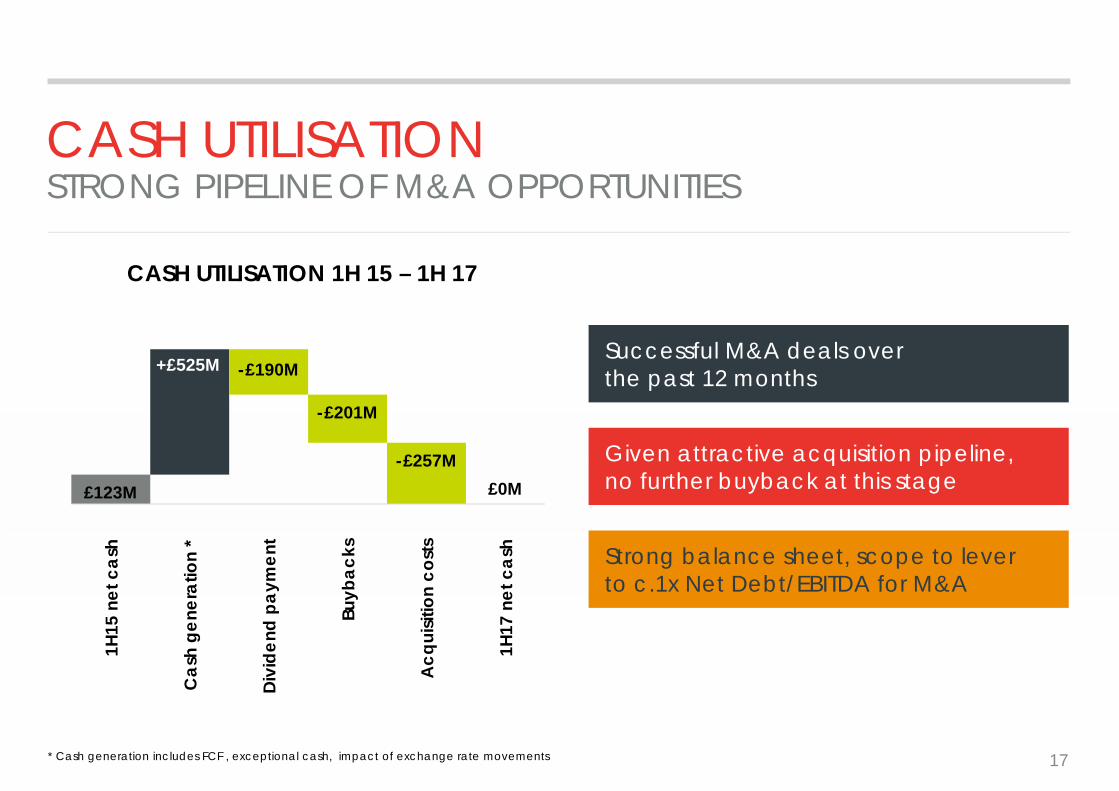
CASH UTILISATIONSTRONG PIPELINE OF M&A OPPORTUNITIES
CASH UTILISATION 1H 15 – 1H 17
£123M £0M
+£525M -£190M
-£201M
-£257M
1H15
net
cas
h
Cas
h ge
nera
tion
*
Divi
dend
pay
men
t
Buyb
acks
Acq
uisit
ion
cost
s
1H17
net
cas
h
* Cash generation includes FCF , exceptional cash, impact of exchange rate movements 17
Successful M&A deals over the past 12 months
Strong balance sheet, scope to lever to c.1x Net Debt/EBITDA for M&A
Given attractive acquisition pipeline, no further buyback at this stage
IGNITE STRATEGY UPDATE

STRATEGIC UPDATESUPPORTING OUR GROWTH
1919
Robust Aftersales profit growth
Further procurement savings achieved
Acquisition in Estonia with BMW and addition of PSA in Australia
South American acquisition trading in-line with expectations
Business development and innovation supported by stronger OEM relationships

2020
OPPORTUNITY FOR CONSOLIDATION
The AmericasAfrica
North Africa
Europe Central Asia
Asia
Middle East Pacifics
8 FOCUS REGIONS WITH c.15M TIV, c.20% OF GLOBAL TOTAL
INCHCAPE SHARE OF THIS ADDRESSABLE MARKET <1%
2121
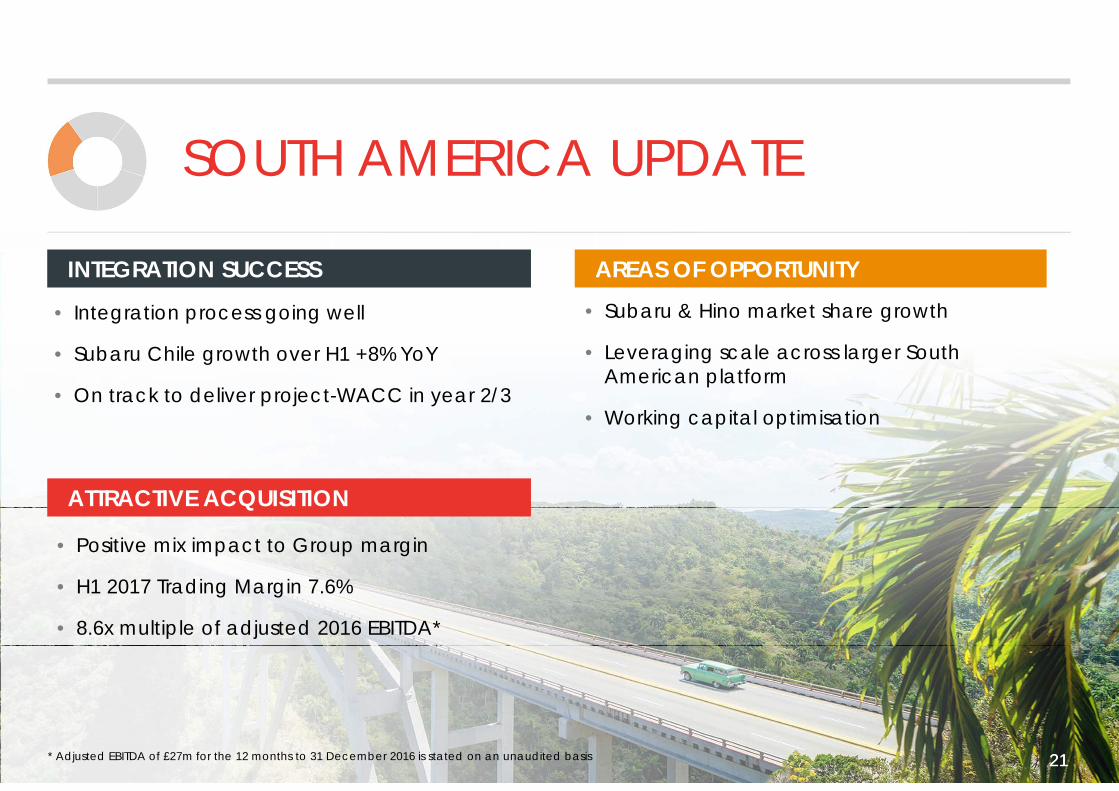
SOUTH AMERICA UPDATE
ATTRACTIVE ACQUISITION
INTEGRATION SUCCESS
* Adjusted EBITDA of £27m for the 12 months to 31 December 2016 is stated on an unaudited basis
AREAS OF OPPORTUNITY• Subaru & Hino market share growth
• Leveraging scale across larger South American platform
• Working capital optimisation
• Integration process going well
• Subaru Chile growth over H1 +8% YoY
• On track to deliver project-WACC in year 2/3
• Positive mix impact to Group margin
• H1 2017 Trading Margin 7.6%
• 8.6x multiple of adjusted 2016 EBITDA*

MEANINGFUL STRATEGIC BENEFITSStronger BMW Platform in Eastern Europe
New PSA Brand relationship
New Entry into Thailand with existing partner, JLR
2222
INVEST TO ACCELERATE GROWTHM&A
22
£M (Combined) Year 1* Year 3 (EST)
Trading profit 2 10
Investment 24
Working Capital improvements
(9)
Return on investment * 67%
SMALL BOLT-ON ACQUISITIONS CAN GENERATE SIGNIFICANT RETURNS AND BENEFITS THROUGH:Earnings uplift (synergies, Ignite benefits)
Working capital optimisation
Thailand (JLR), Estonia (BMW), Australasia (PSA)
* Year 1 is 2018, ** Pre Tax
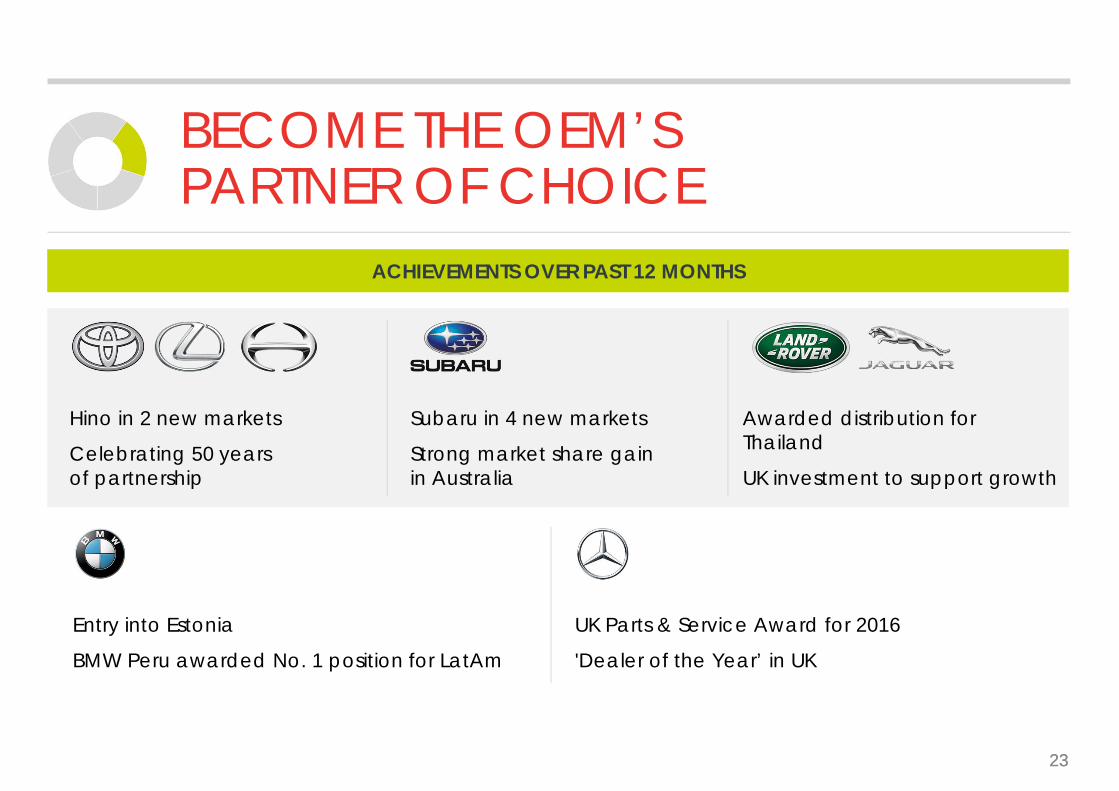
ACHIEVEMENTS OVER PAST 12 MONTHS
BECOME THE OEM’S PARTNER OF CHOICE
2323
Hino in 2 new markets
Celebrating 50 years of partnership
Subaru in 4 new markets
Strong market share gain in Australia
Awarded distribution for Thailand
UK investment to support growth
Entry into Estonia
BMW Peru awarded No. 1 position for LatAm
UK Parts & Service Award for 2016
'Dealer of the Year’ in UK

ROBUST AFTERSALES GROWTH
24
H1 Gross Profit +8% (ex Acqn*)• Capacity increases
• UK technician recruitment drive• Ignite diagnostic tool highlighted
technician shortage• Over > 100 technicians recruited
in last 2 months• New pay-plan and clear career
progression to attract and retain the best technicians
• Continued process improvements
• H1 UK Service GP +5% YoY
UK
Note: Acqn. refers to South American acquisition in Dec 2016
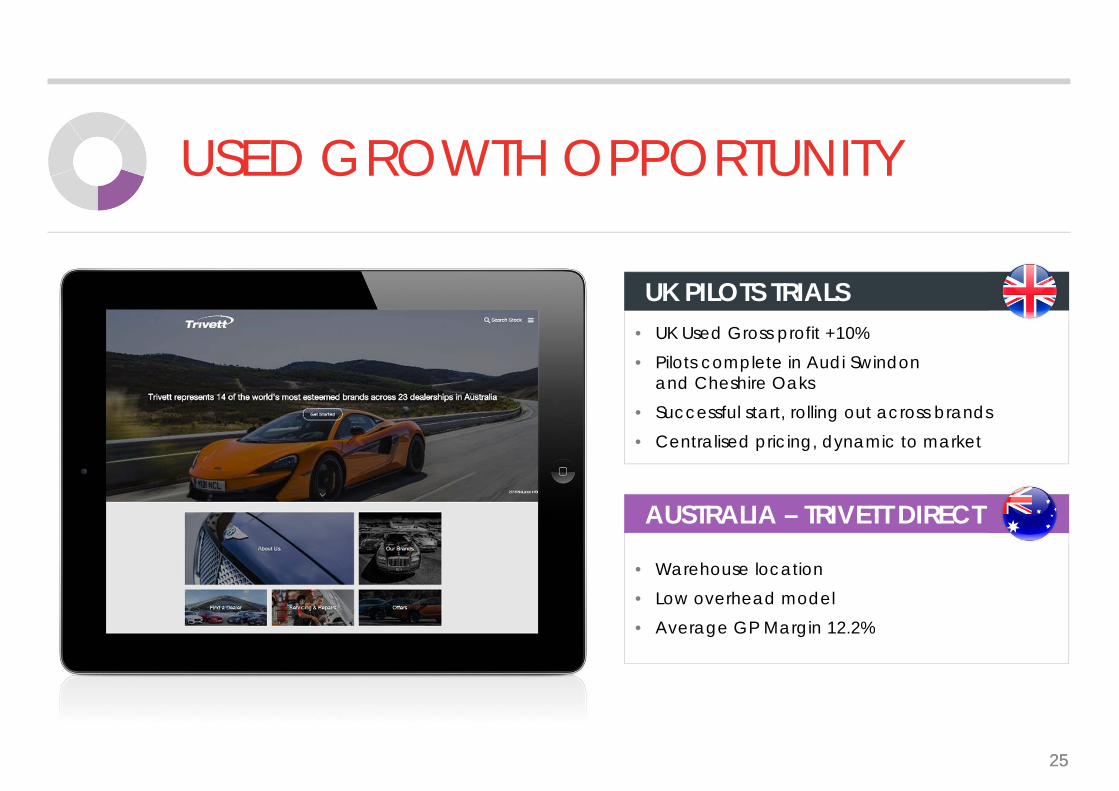
USED GROWTH OPPORTUNITY
2525
• UK Used Gross profit +10%• Pilots complete in Audi Swindon
and Cheshire Oaks• Successful start, rolling out across brands• Centralised pricing, dynamic to market
UK PILOTS TRIALS
• Warehouse location• Low overhead model• Average GP Margin 12.2%
AUSTRALIA – TRIVETT DIRECT

ENHANCING THE CUSTOMER EXPERIENCE
2626
INCHCAPE EXPERIENCE PILOTSDIGITAL• Global framework created
• Detailed guidelines for regions
SATISFACTION MONITORING• Enhanced NPS measurement
• Supplemented by external reviews
EVOLUTION OF SALES PROCESS• Proprietary research conducted
on global ‘pinch-points’ for customers
• Countermeasures developed for global implementation
• Mall-based showroom (Australia)
• Experience-led retail sales process (UK)
SHOWROOM EXPERIENCE
• Global implementation in coordination with OEM partners
OWNERSHIP EXPERIENCE

LEVERAGE GLOBAL SCALE
272727
DRIVING EFFICIENCY FROMOUR 29 MARKETSCOST BASE
Procurement savings on c.£400m cost base progressing well
£14m annualised savings achieved (vs. £7m at FY16)*
BETTERSHARING OF KNOWLEDGE
REVENUE AND GROSS MARGIN
Finance & Insurance (F&I) global review on product opportunity conducted
Multi-year opportunity
* Cumulative savings

LOOKING AHEAD

Portfolio of markets support growth opportunity• Increased Emerging Markets presence• Slower New Vehicle trend expected in some mature markets
Ignite strategy contributing well to growth• Annualised procurement savings• Strong pipeline of M&A opportunities• Further consolidation of Indumotora profit• Continued growth in Aftersales and Used Vehicles
Fixed cost savings continuing to accrue (Asia, Europe/UK)
Yen H1 transactional headwind of c.£20m becomes a c.£10m tailwind in H2
2017 OUTLOOK
SOLID CONSTANT CURRENCY PERFORMANCE EXPECTED IN 2017
29

CONCLUSION
30
Predominantly Distribution in Asia Pacific &
Emerging Markets
Strongly cash generative
business model
Driving performance for our partners and creating value for
shareholders
Significant growth opportunities fromour Ignite strategy

APPENDIX
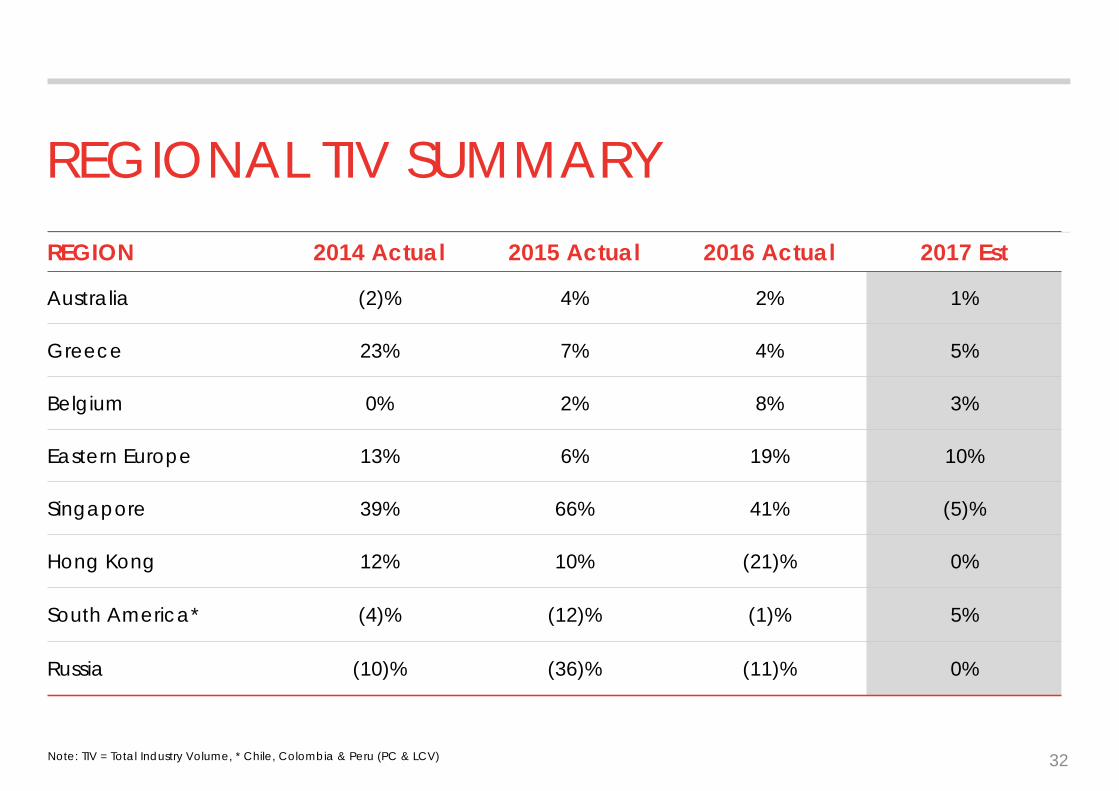
REGIONAL TIV SUMMARY
32
REGION 2014 Actual 2015 Actual 2016 Actual 2017 Est
Australia (2)% 4% 2% 1%
Greece 23% 7% 4% 5%
Belgium 0% 2% 8% 3%
Eastern Europe 13% 6% 19% 10%
Singapore 39% 66% 41% (5)%
Hong Kong 12% 10% (21)% 0%
South America* (4)% (12)% (1)% 5%
Russia (10)% (36)% (11)% 0%
Note: TIV = Total Industry Volume, * Chile, Colombia & Peru (PC & LCV)

DISCLAIMER
The information and opinions contained in this presentation are provided as at the date of the document.Certain statements in this presentation, particularly those regarding the future prospects of Inchcape plc (“Inchcape”), returns, pricing, acquisitions, divestments, industry growth or other trend projections are or may be forward-looking statements. These forward-looking statements are not historical facts, nor are they guarantees of future performance. Such statements are based on current expectations and belief and, by their nature, are subject to a number of known and unknown risks and uncertainties which may cause the actual results, prospects and developments of Inchcape to differ materially from those expressed or implied by these forward-looking statements. Except as required by any applicable law or regulation, Inchcape expressly disclaims any obligation or undertaking to release publicly any updates or revisions to any forward-looking statements contained in this presentation to reflect any change in Inchcape’s expectations with regard thereto or any change in events, conditions or circumstances on which any such statement is based.All information in the presentation is the property of Inchcape plc and may not be reproduced or recorded without the written permission of the company. Nothing contained in the presentation constitutes or shall be deemed to constitute an offer or invitation to invest in or otherwise deal in any shares or other securities of Inchcape plc.
© Inchcape 2017. All rights reserved. Proprietary and confidential information. No unauthorised copying or reproduction. Inchcape and the Inchcape logo are the registered trademarks of the Inchcape Group.The information contained in this presentation has been obtained from company sources and from sources which Inchcape believes to be reliable but it has not independently verified such information and does not guarantee that it is accurate or complete.