27 ANNUAL AUSTRALIAN POULTRY SCIENCE SYMPOSIUM
278
27 th ANNUAL AUSTRALIAN POULTRY SCIENCE SYMPOSIUM SYDNEY, NEW SOUTH WALES 14 TH -17 TH FEBRUARY 2016 Organised by THE POULTRY RESEARCH FOUNDATION (University of Sydney) and THE WORLD’S POULTRY SCIENCE ASSOCIATION (Australian Branch)
Transcript of 27 ANNUAL AUSTRALIAN POULTRY SCIENCE SYMPOSIUM

27th ANNUAL AUSTRALIAN POULTRY SCIENCE SYMPOSIUM
SYDNEY, NEW SOUTH WALES
14TH -17TH FEBRUARY 2016
Organised by
THE POULTRY RESEARCH FOUNDATION (University of Sydney)
and
THE WORLD’S POULTRY SCIENCE ASSOCIATION
(Australian Branch)

Papers presented at this Symposium have been refereed by external referees and by members of the Editorial Committee. However, the comments and views expressed in the papers are entirely the responsibility of the author or authors concerned and do not necessarily represent the views of the Poultry Research Foundation or the World’s Poultry Science Association. Enquiries regarding the Proceedings should be addressed to: The Director, Poultry Research Foundation Faculty of Veterinary Science, University of Sydney Camden NSW 2570
Tel: 02 46 550 656; 9351 1656 Fax: 02 46 550 693; 9351 1693
ISSN-1034-6260

AUSTRALIAN POULTRY SCIENCE SYMPOSIUM 2016
ORGANISING COMMITTEE
The Committee thanks the following, who refereed papers for the Proceedings:
M.Abdollahi P. Iji R. Barekatain R. Jenner L. Browning X. Li K.Bruerton S.Y. Liu W. Bryden A. Moss D. Cadogan W. Muir R. Carter C. O’Shea G. Cronin G. Parkinson C. Dekoning V. Ravindran K. Drake J. Roberts M. Dunlop P. Selle T. Grimes M. Singh P. Groves HH Truong R. Horn T. Walker R. Hughes S. Wilkinson
The Committee would also like to recognise the following Chairpersons for their contribution
to:
Australian Poultry Science Symposium 2015
Dr. Peter Groves – Acting Director PRF Ms. Judith O’Keeffe – President - Poultry Research Foundation Professor Julie Roberts – President - Australian WPSA Branch Ms. Jojo Jackson - AECL Dr. Vivien Kite – RIRDC Chicken Meat Program Dr. Peter Selle – University of Sydney Dr. David Cadogan - Feedworks Dr. Kelly Drake - SARDI Professor Robert Moore – RMIT University Professor Wayne Bryden – University of Queensland Dr. Bob Swick – University of New England Professor Mingan Choct - University of New England Dr. Greg Cronin – University of Sydney
Dr. P. Groves (Director) Mr. J. McLeish Ms. J. O’Keeffe (President PRF) Dr. W. Muir Professor W.L. Bryden Mr. A. Naylor Dr. D. Cadogan Dr J. Roberts Dr. N. Gannon Dr. P. Selle (Editor) Mr. G. Hargreave Dr. S. Wilkinson Ms. J. Jackson


AUSTRALIAN POULTRY AWARD
The Australian Poultry Award is presented annually to an Australian resident who has made a long-term outstanding contribution to poultry science and/or the Australian poultry industry. The Award is made by the Australian Branch of the World’s Poultry Science Association (WPSA) and takes the form of a suitably inscribed plaque which includes the winner’s name, together with a framed citation. Nominations are called for early each year from the membership of WPSA, and completed nominations require to be forwarded to the Secretary of the Australian Branch no later than 31st July. The selection committee consists of the Australian Branch Management Committee of WPSA (10 members) as well as Award recipients from the previous 10 years who are still active in the Australian poultry Industry. Voting is by secret postal ballot, and if more than two candidates are nominated, a preferential voting system is used. The Award is made to the winner at suitable forums where poultry industry people are gathered, such as the annual Australian Poultry Science Symposium, the biennial Poultry Information Exchange (PIX), and the triennial Australian Poultry Convention.
Previous recipients of the award are: 1964 Mr A.O. Moll 1990 Dr M. Mackenzie 1965 Dr M.W. McDonald 1991 Professor D.J. Farrell 1966 Professor R.B. Cumming 1992 Dr B.L. Sheldon 1967 Mr F. Skaller 1993 Mr R. Macindoe 1968 Professor G.L. McClymont 1994 Mr B. Bartlett 1969 Dr S. Hunt 1995 Dr R.A.E. Pym 1970 Dr L. Hart 1996 Dr E.E. Best 1971 Mr N. Milne 1997 Mr M. Peacock 1972 Mr R. Morris 1998 Professor D. Balnave 1973 Mr J. & Mr R. Ingham 1999 Dr H. Westbury 1974 Mr S.J. Wilkins 2000 Mr L. Brajkovich 1975 Professor C.G. Payne 2001 Mr R.J. Hughes 1976 Mr W. Stanhope 2002 Dr T.M. Grimes 1977 Professor B. Sinkovic 2003 Dr R. MacAlpine 1978 Mr J. Douglas 2004 Dr M. Choct 1979 Mr D. Blackett 2005 Professor P. Spradbrow 1980 Dr A.F. Webster 2006 Dr J. R. Roberts 1981 Mr R. Fuge 2007 Dr V. Kite 1982 Dr J.G. Fairbrother 2008 Mr R. Horn 1983 Dr R.K. Ryan 2009 Professor W. Bryden 1984 Mr C. Donnelley 2010 Dr G. Parkinson 1985 Dr P. Gilchrist 2011 Dr K. Whithear 1986 Dr C.A.W. Jackson 2012 Dr P.J. Groves 1987 Mr E. Rigby 2013 Dr B.S. Baines 1988 Mr W. Shaw 2014 Dr P. Blackall 1989 Dr H. Bray


SPONSORS of the 2016 AUSTRALIAN POULTRY SCIENCE SYMPOSIUM
Speaker Sponsors
Australian Egg Corporation DSM Nutritional Products
Hy-Line Poultry Research Foundation
RIRDC Chicken Meat Program
Gold Sponsors
Poultry CRC
Silver Sponsors
Adisseo / BEC Feed Solutions Alltech Australia
DSM Nutritional Products Australia Pty Ltd Elanco Australia
DuPont / Feedworks Pty. Ltd
Bronze Sponsors
Biomin Australia Pty Ltd Jefo
Novus Nutrition Pty. Ltd Ruth Consolidated Industries Pty. Ltd
Zoetis Australia Pty. Ltd
Alternative Sponsors
BASF Australia Ltd Evonik Australia Pty. Ltd
DuPont / Feedworks Pty. Ltd Kemin (Aust). Pty. Ltd Oxford University Press Novus Nutrition Pty. Ltd Zoetis Australia Pty. Ltd


CONTENTS FOOD SECURITY
WATER, ENERGY AND FEED: THE TRIFECTA FOR FOOD SECURITY 1 W.L Bryden – University of Queensland, Australia PEAK FOOD AND OUR QUEST FOR AN ETHICAL AND ECOLOGICALLY SUSTAINABLE HUMAN DIET
9
R.G Alders – University of Sydney, Australia WATER, PHYSIOLOGY AND WET LITTER
POSSIBLE INTERACTIONS BETWEEN DRINKING WATER CHARACTERISTICS AND FEED ENZYME EFFICACY IN POULTRY PRODUCTION
14
A.J Cowieson – DSM Nutritional Products, Switzerland WET LITTER – FACTORS ASSOCIATED WITH THE SHED MICRO-ENVIRONMENT AND LITTER PROPERTIES
21
M.W Dunlop and R.M Stuetz – Department of Agriculture and Fisheries QLD, Australia
NUTRIENT LOADING ON FREE RANGE LAYER FARMS 29 M. Singh, I. Ruhnke, C.T De Koning, K. Drake and A. Skerman – University of Sydney, Australia
POULTRY LITTER PASTEURISATION - PRINCIPLES 30
S.W Walkden-Brown, Y.C.S.M Laurenson, A.F.M.F Islam, M. Dunlop and B.A Wells– University of New England, Australia
LITTERHEATMAP: A DECISION SUPPORT TOOL FOR PREDICTING TEMPERATURE IN POULTRY LITTER HEAPED FOR PASTEURISATION
34
Y.C.S.M Laurenson, A.F Islam, M. Dunlop, M.D Cressman and S.W. Walkden-Brown – University of New England, Australia
POULTRY LITTER PASTEURISATION – PRACTICES AND PROCEDURES 38 S.W Walkden-Brown, Y.C.S.M Laurenson, A.F.M.F Islam, M. Dunlop and B.A Wells– University of New England, Australia
EVALUATION OF BIOCHAR, ZEOLITE AND BENTONITE AS FEED ADDITIVES ON EGG YIELD AND QUALITY OF BOND BROWN LAYER
42
T.P Prasai, K. Walsh, D. Midmore and S.P Bhattarai – Central Queensland University, Australia
FEEDING LOW PROTEIN DIETS TO MEAT CHICKENS: EFFECTS ON EMISSIONS OF TOXIC AND ODOROUS METABOLITES
46
N.K Sharma, R.A Swick, M.W Dunlop, S.B Wu and M. Choct – University of New England, Australia

BROILER WELFARE AND HEALTH
A FOCUSED REVIEW OF SCIENCE-BASED EVIDENCE ON THE WELFARE OF AUSTRALIAN MEAT CHICKENS
47
L.R Matthews and J-L Rault – University of Melbourne, Australia EFFECTS OF LIGHT INTENSITY ON BROILER PRODUCTIVITY AND LEG HEALTH 51 J.L Rault, K.V Clark, P.J Groves and G.M Cronin – University of Melbourne, Australia
THE IMPACT OF β-MANNANASE ENZYME ON THE INTESTINAL HEALTH OF POULTRY UNDER COMMERCIAL CONDITIONS
52
A.M Grieve, S. Cervantes-Pahm and M.A Martinez– Elanco Animal Health, Australia
IMPORTANCE OF HATCH TIME AND ACCESS TO FEED ON BROILER MUSCLE DEVELOPMENT
56
D.J Powell, S.G Velleman, A.J Cowieson, M. Singh and W.I Muir– University of Sydney, Australia
THE EFFECT OF A PLANT ALKALOID SUPPLEMENT ON PERFORMANCE OF BROILERS UNDER NECROTIC ENTERITIS
57
G.D Xue, M. Choct, S.B Wu and R.A Swick – University of New England, Australia IMPROVEMENT IN GROWTH RESPONSES OF BROILER CHICKENS WITH PROLONGED DIETARY SUPPLEMENTATION OF PROCESSED PLANT PROTEIN
58
A.A Omede, M.M Bhuiyan and P.A Iji – University of New England, Australia HOCK BRUISES IN BROILERS ARE INDICATIVE OF LEG WEAKNESS 59 P.J Groves and W.I Muir – University of Sydney, Australia RESIDUAL YOLK SAC CALCIUM AND PHOSPHORUS UPTAKE OVER THREE DAYS 60 R.L Hopcroft, A.J Cowieson, W.I Muir, J. Freilikh, M. Jovanovski and P.J Groves – University of Sydney, Australia
EFFECTS OF CRUDE ILEAL AND CAECAL FLORA MIX ON NECROTIC ENTERITIS 64 C. Keerqin, S.B Wu, R. Swick, B. Svihus and M. Choct – University of New England, Australia
EFFECT OF ELEVATED DIGESTIBLE AMINO ACIDS IN HIGH CANOLA MEAL DIETS ON FEED CONSUMPTION AND PERFORMANCE OF BROILER CHICKENS
65
M. Toghyani, G.Channarayapatina, S.B Wu and R.A Swick – University of New England, Australia
EVALUATION OF A LIGNOCELLULOSE-RICH FIBRE SOURCE AND PARTICLE SIZE ON BROILER GROWTH PERFORMANCE
66
S.K Kheravii, R.A Swick, M. Choct and S.Wu – University of New England, Australia
STUDY ON BROILER PERFORMANCE AND CARCASS CHARACTERISTICS UNDER DIFFERENT BROODING SYSTEMS IN THE TROPICS
67
M.A Zaman – Chittagong Veterinary & Animal Sciences University, Bangladesh

LAYER WELFARE AND HEALTH
ASSESSING OPTIMAL OUTDOOR STOCKING DENSITY IN FREE-RANGE LAYING 71 S. Campbell, G. Hinch and C. Lee – CSIRO, Australia FREE-RANGING BY LAYING HENS SOON AFTER THE POP-HOLES OPEN 72 G.M Cronin, K. T. N Tran, K.M Hartcher and P.H Hemsworth – University of Sydney, Australia
IS RANGE USE RELATED TO FEARFULNESS AND PLUMAGE DAMAGE? 76 K.M Hartcher, K.A Hickey, P.H Hemsworth, G.M Cronin, S.J Wilkinson and M Singh – University of Sydney, Australia
USE OF DIFFERENT OUTDOOR AREAS IN COMMERCIAL FREE-RANGE LAYERS USING RFID TECHNOLOGY
77
H. Larsen, G.M Cronin, C.L Smith, P.H Hemsworth and J-L Rault – University of Melbourne, Australia
WANDERERS VERSUS STAY AT HOME: WHO HAS THE BETTER GUTS? 78 M. Singh, C.E Hernandez, C. Lee, G. Hinch and A.J Cowieson – University of Sydney, Australia
IDENTIFYING FEATHER PECKING AND FEATHER EATING ISA BROWN HENS USING ARTIFICIAL FEATHER PRESENTATION
82
K.M Prescilla, G.M Cronin, S. Liu and M. Singh – University of Sydney, Australia DEVELOPMENT OF A RELIABLE INFECTION MODEL FOR ASCARIDIA GALLI IN LAYING HENS
86
N. Sharma, P. Hunt, B. Hine, N.K Sharma, R.A Swick and I. Ruhnke – University of New England, Australia
ISA BROWN LAYING HENS ON THE RANGE ARE INITIALLY MORE ATTRACTED TO OVERHEAD COVER THAN PERCHES
87
R.A Doran, R.L Hopcroft and G.M Cronin – University of Sydney, Australia AN INVESTIGATION INTO THE INTERACTION BETWEEN DIETARY CALCIUM AND PHOSPHORUS ON EGG PRODUCTION AND QUALITY OF LAYING HENS USING THE GEOMETRIC FRAMEWORK
91
C.J O’Shea, S.J Wilkinson, S.Y Liu, Y. Bao, N. Dhand, P. Selle and A.J Cowieson – University of Sydney, Australia
A NEW DOUBLE CHOICE MODEL DEVELOPED IN LAYING HENS REVEALS HIGH PREFERENCE FOR L-ALANINE
95
S. Cho, J.M Kim and E. Roura – University of Queensland, Australia NSP ENZYME COMPLEX IMPROVES PRODUCTIVE PERFORMANCE OF LAYING HENS 96
M. Le Crapper, P. Cozannet, R. Montanhini Neto, D. Wu and A. Preynat – Adisseo France S.A.S, France

LAYER WELFARE AND HEALTH (cont)
EFFECT OF TWO DIFFERENT FIBRE SOURCES ON GROWTH AND IMMUNE FUNCTION IN GROWER LAYER-PULLETS
97
S.M Hussein, J.S Yokhana and T.L Frankel – Latrobe University, Australia FOOD SAFETY AND QUALITY
WORKING WITH THE EGG STRUCTURE TO MINIMISE SALMONELLOSIS 101 N. Sparks – Scotland’s Rural College, Roslin Institute, UK
THROUGH-CHAIN MANAGEMENT OF BACTERIAL PATHOGENS ASSOCIATED WITH POULTRY MEAT IN QUEENSLAND, AUSTRALIA
109
M. Groves, A. Wilson and L. Cuttell – Safe Food Production Queensland, Australia SALMONELLA AND CAMPYLOBACTER IN POULTRY IN AUSTRALIA 116 M. Sexton – PIRSA, Australia ON-FARM CONTROL OF CAMPYLOBACTER 125 N. Sparks – Scotland’s Rural College, Roslin Institute, UK EFFECT OF PRODUCTION SYSTEM AND FLOCK AGE ON EGG QUALITY 133 S. Samiullah, A.S Omar, J.R Roberts and K. Chousalkar – University of New England, Australia
BODY WEIGHT UNIFORMITY AND EGGSHELL QUALITY OF HENS IN A FREE-RANGE PRODUCTION SYSTEM
137
E.K Suawa, J.R Roberts and G. Parkinson – University of New England, Australia
THE EFFECT OF DIETARY SUPPLEMENTATION WITH CALCIUM PIDOLATE AND 25-HYDROXYCHOLECALCIFEROL ON EGG QUALITY IN COMMERCIAL LAYING HENS
141
K. Al-Zahrani and J.R Roberts – University of New England, Australia
EFFECT OF PASTURE AND FEED ADDITIVES ON PERFORMANCE AND EGG QUALITY IN RANGING LAYING HENS
145
Z. Iqbal, N. Sharma, N.K Sharma, S. M’Sadeq, R.A Perez-Maldonado, S. Ramirez-Cuevas, J. Robert, M. Hilliar, M. Singh, S. Wu, R.A Swick and I. Ruhnke – University of New England, Australia
ALPHA D3 LAYERS WITH DIFFERENT LEVELS OF CALCIUM AT THE END OF THE PRODUCTION PHASE
146
D.E Sanchez, T.C Betacourt, J. Gomez and G.M Restrepo – Premex Inc, USA
ADDITION OF OAT HULLS IN BROILER DIETS IMPROVES UTILISATION OF FULL FAT CANOLA SEED
147
M.R Barekatain, M. Toghyani and R.A Swick – SARDI, Australia
TOWARDS COMMERCIALIZATION OF OMEGA-3 ENRICHED CHICKEN MEAT 148
K. Kanakri, J. Carragher, B. Muhlhausler, R. Hughes and R. Gibson – University of Adelaide, Australia

FOOD SAFETY AND QUALITY (cont)
HYDROXY-SELENOMETHIONINE CONTRIBUTES TO MAINTAIN COLOR STABILITY OF TURKEY MEAT
149
M. Briens, M.Faure, F. Couloigner, J. Garet, T. Maucotel, N. Tommasino, P. Gatelier, D. Durand, P.A.Geraert and Y. Mercier – Adisseo France S.A.S.A, France
PHOSPHORUS, PHYTATE and PHYTASE
GLOBAL PHOSPHORUS SCARCITY : A FOOD SECURE FUTURE? 153 D. Cordell – University of Technology Sydney, Australia BIOTECHNOLOGY IN THE DEVELOPMENT OF IMPROVED PHYTASES 158 R.E Speight – Queensland University of Technology, Australia
THE ECONOMIC FEASIBILITY OF ELEVATED PHYTASE INCLUSIONS IN MAIZE-BASED BROILER DIETS
166
A.F Moss, H.H Truong, D.J Cadogan, G.G Partridge, S.Y Liu and P.H Selle – University of Sydney, Australia
PROTEIN AND ENERGY RATIOS INFLUENCE PERFORMANCE IN BROILER CHICKENS 170 S.Y Liu, D. Raubenheimer, P.H Selle, R.M Gous, G. Hargreave, S.J Simpson, D.J Cadogan and A.J Cowieson – University of Sydney, Australia
PHYTATE DEGRADATION IN THE GIZZARD IS PIVOTAL TO PHYTASE RESPONSES IN BROILER CHICKENS
174
H.H Truong, S. Yu, A.F Moss, S.Y Liu and P H Selle – University of Sydney , Australia
INFLUENCE OF CALCIUM, AVAILABLE PHOSPHORUS AND PHYTASE ON BROILER GROWTH PERFORMANCE, FOOT ASH AND NUTRIENT RETENTION
178
C.L Walk, H. Graham and M.R Bedford– AB Vista, UK IMPACTS OF DIETARY CALCIUM, PHYTATE AND NON-PHYTATE PHOSPHORUS CONCENTRATIONS, WITHOUT AND WITH PHYTASE ON MYO-INOSITOL HEXAPHOSPHATE (IP6) DEGRADATION IN BROILERS
182
W. Li and R. Angel – Danisco Animal Nutrition, Dupont UK SUPER-DOSE LEVELS OF PROTEASE AND PHYTASE ENABLE UTILIZATION OF RAW SOYBEAN MEALS IN BROILER DIETS
186
M.M Erdaw, R.A Perez-Maldonado, M.M Bhuiyan and P.A Iji– University of New England, Australia
HOT TOPIC: AVIAN INFLUENZA 2015 USA HIGHLY PATHOGENIC AVIAN INFLUENZA OUTBREAK, REVIEW AND LESSONS LEARNED
190
T. Schaal – Hy-Line International, USA ON-FARM SURVEYS TO INFORM AVIAN INFLUENZA RISK ASSESSMENT MODEL 196 A.B Scott, M. Singh, M. Hernandez-Jover, B. Barnes, K. Glass, B. Moloney, A. Lee, P. Groves and J-A. Toribio – University of Sydney, Australia

ALTERNATIVES TO ANTIBIOTICS
PROBIOTICS AS AN ALTERNATIVE TO ANTIBIOTICS FOR TREATING LAMENESS DUE TO BACTERIAL INFECTIONS IN BROILERS
200
R.F Wideman Jr. – Australian Egg Corporation, Australia
LIFE WITHOUT ANTIBIOTIC GROWTH PROMOTERS – A UK PERSPECTIVE 206 S. Pritchard – Premier Nutrition, UK
BIOMARKERS OF INCREASED INTESTINAL PERMEABILITY IN CHICKENS 213 S.S Gilani, R.E.A Forder, G.S Howarth, R.J Hughes, S.M Kitessa and C.D Tran – University of Adelaide, Australia
DIETARY SUPPLEMENTATION OF CATHARANTHUS ROSEUS STIMULATES GUT PROTECTIVE MECHANISMS IN BROILERS
217
H.Zaneb, S. Anwar, S. Masood, A. Ijaz, M.S Yousaf, S. Ashraf and J. Rehman – University of Veterinary and Animal Sciences, Pakistan
BACILLUS SUBTILIS IMPROVES PERFORMANCE OF BROILERS FED MEDICATED OR NON-MEDICATED FEED
218
L. Rhayat, V.Jacquier, E. Devillard and P-A. Geraert – Adisseo France S.A.S, France
NOVEL BACILLUS SUBTILIS STRAIN BRINGS CONSISTENT IMPROVEMENT OF PERFORMANCE IN BROILERS
219
E. Devillard, P.Nielsen, A. Nelson, L. Rhayat, V. Jacquier and P-A. Geraert – Adisseo France S.A.S, France
GENERAL NUTRITION
INFLUENCE OF HWOLE HEAT INCLUSION AND EXOGENOUS ENZYME SUPPLEMENTATION ON GROWTH PERFORMANCE AND NUTRIENT UTILISATION IN BROILER STARTERS
223
M.R. Abdollahi, A.M Amerah and V. Ravindran – Massey University, New Zealand
INFLUENCE OF FEED INGREDIENTS ON PHYSICAL PELLET QUALITY AND GROWTH PERFORMANCE IN BROILER CHICKENS
227
A Moradi, S. Moradi and M.R Abdollahi – Massey University, New Zealand
EFFECT OF PELLETING TEMPERATURES AND ENZYME SUPPLEMENTATION ON THE PERFORMANCE OF BROILERS FED A WHEAT-BASED DIET
231
G.A Gomes, H. Graham, G. Gonzalez-Ortiz, R.A.H.M ten Doeschate, M. Hejdysz, A. Rutkowski and S. Kaczmarek – AB Vista, UK
BREED, GENDER AND FEED ENZYMES AFFECT ABILITY OF MEAT CHICKENS TO EXTRACT ENERGY FROM WHEAT
235
R.J Hughes, J.L Black, P.C Flinn, A.M Tredrea and S. Diffy – SARDI, Australia
CALCIUM AND SODIUM IN BROILER BONE – WHAT IS THE RELATIONSHIP? 239 L.C Browning and A.J Cowieson – University of Sydney, Australia
MEETING CREATINE NEEDS OF MODERN BROILERS VIA GUANIDINOACETIC ACID SUPPLEMENTATION IN DIETS WITH OR WITHOUT ANIMAL PROTEIN
240
K.R. Pradeep, M. Rademacher and C.K Girish – Evonik, Singapore

GENERAL NUTRITION (cont)
META-ANALYSIS OF TRIALS CONDUCTED TO EVALUATE THE EFFICACY OF A MULTI ENZYME COMPLEX IN CORN-SOYBEAN MEAL FED BROILERS
244
R. Montanhini Neto, D. Wu and A. Preynat – Adisseo France S.A.S, France
EFFECT OF XYLANASE, ARABINOFURANOSIDASE, AND THEIR COMBINATION ON IN VITRO DIGESTIBILITY OF MAIN RAW MATERIALS
245
P. Cozannet, O. Guais, R. Montanhini Neto, A. Preynat and E. Devillard – Adisseo France S.A.S, France
GLOBAL APPLICABILITY OF NIR CALIBRATIONS FOR PREDICTING APPARENT METABOLISABLE ENERGY OF GRAINS FOR BROILERS
248
J.L Black, J.A Downing, H. Graham, P.C Flinn, S. Diffy, A.M Tredrea and C. Piotrowski – John Black Consulting, Australia
THE EFFECTS OF VARIABLE BUTTIAUXXELLA PHYTASE DOSE ON MARKET-AGE BROILER PERFORMANCE AND CARCASS CHARACTERISTICS
252
M. Hruby, R. Bold, C.T Mou and M.E Persia – Dupont Danisco Animal Nutrition, USA
RVA STARCH PASTING PROFILES MAY BE INDICATIVE OF FEED GRAIN QUALITY 255 P.H Selle, A. Khoddami, A.F Moss, H.H Truong and S.Y Liu – University of Sydney, Australia
AUTHOR INDEX 259

Notes

WATER, ENERGY AND FEED: THE TRIFECTA FOR FOOD SECURITY
W.L. BRYDEN1
Summary The massive increase in the human population that has occurred over the last century is precipitating a cascade of environmental, economic, political and cultural changes that have far-reaching implications for the provision of an adequate global food supply. In the future our food will need to be produced more efficiently. Increased agricultural productivity must come from a reduced land area and resource base. Arable land continues to be lost due to soil degradation and urbanisation. We will need to be less dependent on resources that are becoming scarce, like arable land and water, or more costly, like energy and petrochemical-based inputs, including fertilizers. It is how we manage the nexus between water, energy and feed that is our biggest challenge for global security of animal-sourced food products.
I. INTRODUCTION The world population exceeds 7 billion and is expected to climb to between 9 and 10 billion by the middle of this century and then stabilise and perhaps decline (Lutz and Samir 2010). It is the massive increase in the number of humans that has occurred over the last century, which is precipitating a cascade of environmental, economic, political and cultural changes that have far-reaching implications for life on earth and for food security. To make matters worse, this is occurring at a time of rapid climate change. Food is fundamental for human existence and health but many of the world’s inhabitants experience ongoing hunger. For some this is due to drought, others war and for many it is a lack of money to buy food. The United Nations, Food and Agriculture Organization estimates that 850 million people worldwide are hungry and a greater number suffer from nutrient deficiencies. Approximately one billion people have inadequate nutrient intake, others excessive calorie intake. The challenge of preventing malnutrition will become even greater as the global population grows to nearly 10 billion by 2050. Not only is the global population increasing, but we are living longer and becoming more affluent. Our demand for resources – particularly water, energy and food - increases dramatically with economic growth. As incomes increase, diets become more energy-dense and meat becomes a larger proportion of the diet (Godfray, 2011).The challenge of preventing hunger and malnutrition will become even greater as the global population grows. Water requirements for drinking and food production will increase, as will the energy demand for food manufacture and distribution, and likewise for feed production and transport. While many of the resources we take for granted have yet to physically run out, the perception of “peak” resources will have major impacts on political debate and commercial behaviour. What is often overlooked is the high level of interdependence between resources, especially as demand increases (Finley and Seiber, 2014). Increased prices for resources have knock-on effects – including food cost and availability. The question is: how will it be possible to maintain global resource security in a sustainable manner? Before addressing this question it is important to discuss the relationship between food and human health. In this paper, food refers to humans and feed refers to livestock and poultry. This distinction appears in the title as it is my contention that maintaining a supply of animal-sources foods is necessary for a balanced human diet. For this to be achieved, an adequate supply of animal
1 School of Agriculture & Food Sciences, The University of Queensland; [email protected]
Aust. Poult. Sci. Symp. 2016.....27
1

feed is required. It is not possible in this paper to present more than an overview of these very important and complex topics and interested readers should consult detailed reviews; including, Cribb (2010), Finley and Seiber (2014), Bryden (2015) and Whitmee et al. (2015).
II. ANIMAL PRODUCTION AND HUMAN HEALTH
The link between human health and agriculture is through food; its sources, composition and distribution. Food sources include both plant and animal and the availability and composition of the latter is largely determined by the cost of plant-based feedstuffs. It is not surprising therefore, that any consideration of population demographics demonstrates the importance of agricultural production as a major determinant of public health (Matossian, 1989; Scholthof, 2003) as agriculture is the major source of our food. This would appear to be a straight forward proposition, embracing the adage ‘we are what we eat’, especially in tribal societies. However, the relationship between agricultural production and human health is complex in a modern, developed society and measuring the impacts is difficult (Hawkesworth et al., 2010). For non-infectious human disease, the major cause is malnutrition whether a lack of food or excess consumption. Nutrient deficiencies are a major problem in many developing countries while excess intake leading to obesity and metabolic disease is an epidemic in developed countries. This double burden of nutrient deficiency and obesity is occurring simultaneously in some societies as the population becomes more affluent (Amuna and Zotor, 2008). For many years there has been an ongoing debate about the benefit or otherwise of animal source foods, especially red meat consumption (see Givens, 2010). In the past, claims of the detrimental effect of animal-sourced foods on human health have been made without rigorous scientific investigation (Blaxter, 1991). There is no doubt, however, that animal source foods, including lean meat, fish, poultry, eggs and milk, are an excellent source of protein and micronutrients (Williams, 2007; Givens, 2010; Samman et al., 2012). It should not be forgotten that humans evolved as ‘meat eaters’ (see Cordain et al., 2004). It is unlikely that we will curb our appetite for meat. In many instances, the mechanism that allows impoverished families to improve their income and wellbeing is access to livestock or poultry (Delgado, 2003). Animal products play an important role in the human diet and contribute about 16% of energy and 38% of protein consumed globally (CAST, 1999). There has been a significant increase in the demand for meat, milk and eggs over the last four decades (Speedy, 2003; Thornton, 2010). This reflects, not only population increase but also increasing affluence and what economists call Bennett’s Law: ‘as people become wealthier, they switch from simple starchy plant diets to a more varied food input that includes a range of vegetables, fruit, dairy products, and especially meat’ Godfray (2011).
III. THE GLOBAL CHALLENGE There is little doubt that the global demand for meat will increase and will need to be produced more efficiently. Increased agricultural productivity must come from a reduced land area and resource base. Arable land continues to be lost due to soil degradation and urbanisation. We will need to be less dependent on resources that are becoming scarce, like arable land and water, or more costly, like energy and petrochemical-based inputs, including fertilizers. Some would argue that it is how we manage the nexus between food, water and energy that is our biggest challenge for global food security (Finley and Seiber, 2014).
Conversely, the environmental impact of agriculture should not be forgotten. There is no doubt that agriculture exerts considerable pressure on water supplies, especially when irrigation is used. What form of energy will agriculture use in the future to produce, process and transport our food? The impact of agriculture on plant and animal biodiversity and other
Aust. Poult. Sci. Symp. 2016.....27
2

ecosystem services also must be addressed. Pollination of crops by bees is an integral component of agricultural production. Any disruption to this ecosystem service could have devastating consequences for food production (see Whitmee et al., 2015). Future food production must have vastly increased productivity, good environmental practices and acceptance by society. Meeting these goals will require the effective use of science, underpinned by rigorous research. This will require substantial public and private sector investment; something which has been sadly lacking both in Australia and globally.
IV. THE TRIFECTA
To meet the needs of an additional three billion people over the next 35 years and to prevent further escalation of global poverty, agricultural production must double during this time. In meeting the increased demand for food, the interdependence between water, food and energy will become more evident and highlight resource insecurities.
a) Water It is often not appreciated how scarce fresh water is. Some 70% of the earth’s surface is covered by water but only 3% of this volume is fresh water and of that, at least two thirds is trapped in ice sheets. Most of the fresh water that is available for use is found in ground water (0.76%) with only a very small portion in surface water (0.009%), distributed in lakes, rivers, soil, and the atmosphere (Bidlock et al., 2004). For most resources there are alternatives but not for water. Water is a scarce commodity, which becomes highly political when river water flows and water re-use are raised as issues. Water scarcity is not only a social challenge but also a commercial one. Consumers often fail to recognise that water is used throughout the supply chain to produce goods and services. On a positive note, water is a renewable resource and there is much to be gained by improving water-use efficiency.
b) Energy Energy supply is fundamental to our way of life. Electricity is required in all links of the food chain from fertiliser manufacture to grain harvesting and transport. Even our domestic water supply requires electricity for treatment, pumping and wastewater collection. The generation of water in thermal power plants requires vast quantities of cooling water and this may come at the expense of agriculture. The energy system is at the beginning of an inevitable transition, with increasing contributions from renewable energy, energy efficiency and sustainable development. Driving the transitions is a range of factors as outlined by Bentham (2015) including growing prosperity, changes in resource availability, technology and cost developments, political imperatives, shifting social norms and ever increasing environmental concerns. The two fundamental and strongest influences behind the energy system transition is an increasingly prosperous and growing global population, and concerns about climate change. There is increasing international interest in moving away from the use of fossil fuels to generate power to renewable resources like wind and solar. Biofuels are being increasing produced in some regions as an alternative energy source but may have limited application as this can create a three-way interaction between energy, food and water (Walker, 2010).
c) Nexus
It is obvious from the few points raised above that any improvements in the sustainability of water, energy and food security must be done in a coordinated manner. There will need to be
Aust. Poult. Sci. Symp. 2016.....27
3

trade-offs including water for municipal supply and river flows with demand from agricultural and thermoelectric industries; there will be competition between agriculture and the demand for water from the hydroelectric sector and mining; the push to increase energy security through development of biofuels will continue to be in competition with food production for land and water. Climate change will accentuate these trade-offs.
V. OPTIONS AND POSSIBILITIES Food production must increase substantially and cope with more severe climate events (2015 was the hottest year on record) and increased globalisation as more free trade agreements are signed. The increased amount of food required will need to be produced with finite water supplies on existing areas of arable land. Another “Green Revolution” is required but today’s revolution must be different to overcome existing environmental, financial and societal constraints. It is no longer possible or responsible to use unlimited water and chemical inputs to increase production. Other approaches to food production and processing must be found that use existing and new technologies in conjunction with appropriate social policies that are sustainable.
a) Technology
Biotechnology with its evolving “omics” tools (genomics, proteomics, metabolomics), will allow the development of new approaches to counter some of the complex problems we now face. With these approaches it will be possible to fast track current crop plants with agronomic traits such as yield and tolerance to environmental stress using the same or diminished inputs and be able to withstand pathogen attack and potential contamination with mycotoxins. The coming generation of crop plants may have value-added outputs such as improved nutrient and food functionality and be sources for biomass for biofuel production and human therapeutics.
Another important area that will undergo a major renaissance is microbial ecology with the application of molecular biology techniques. While microbial ecology is not a new concept, it is pivotal to understanding the presence and functioning of microbes in complex and dynamic food environments, both outside and inside the gastrointestinal tract. As we understand more about the complex and dynamic microbial ecology of foods, we will be in a better position to manipulate those biotic and abiotic factors that enhance food quality and human health. Similar improvements will be made to animal health.
The other platform that should permit a major leap forward is nanotechnology. It holds promise for responding to the need for more precise management of resources such as water and fertilizers, improving crop and livestock production, controlling pests, diseases, and weeds, monitoring plant disease and environmental stresses, improving postharvest technology, including waste management and food safety. It will allow the application of precision agriculture in both developed and developing economies.
b) Social policy
New technologies will only succeed with consumer acceptance. The reluctance by some to accept genetically modified organisms (GMOs) or vaccination, are examples, which highlight the importance of having a “conversation”. This will require education and communication of the benefits that will accrue from the application of new and appropriately tested technologies. This will need to be achieved with a back-drop of increased consumer interest in foods produced locally and organic agriculture. These “feel-good” approaches to
Aust. Poult. Sci. Symp. 2016.....27
4

agriculture will not overcome the food demands of the future but the more useful aspects of these practices must be part of food production in the future.
The increasing urbanisation of the global community exacerbates this situation as more and more people become isolated from the land and farming. Moreover, urban populations are more vulnerable to disruptions in the food supply chain. Those in cities need to understand where their food comes from. This will require education to explain the importance that adequate nutrition has for human health. To maintain a viable food supply we must be prepared to pay realistic prices and reduce waste throughout the food supply chain. All of the required changes must be underpinned by inclusive national and international government policies.
VI. IMPLICATIONS FOR THE FUTURE OF FOOD AND POULTRY PRODUCTION
Awareness of the implications of an ever-increasing human population is not a recent phenomenon. It is a concern that has been voiced throughout human history (Malthus, 1798). Population concerns in the past have been overcome by breakthroughs in science that have facilitated continued population growth, for example, the Green revolution and our ability to combat most infectious diseases of plants and animals (Tribe, 1992). This has secured our food supply and when coupled with improvements in human disease prevention has allowed the human population to increase virtually unchecked (Lutz and Samir, 2010). How many more people can be accommodated on the earth with increased rates of depletion of finite resources (fossil fuel, arable land, phosphates, water) is a legitimate concern. Moreover, as all those involved in poultry production appreciate, there is an optimum stocking density and beyond that production declines or in the case of the human animal, lifestyle diminishes or for those less fortunate, famine and pestilence consume them.
a) Feed production As the demand for food grows, how will it be met? Following an in-depth, global and regional analysis, Keyzer et al. (2005) have made projections which show that the greatest demand will be for poultry meat, eggs, pork and dairy as Asia and Africa, the regions from where the largest demand is expected, have limited scope for expanded grazing. On the basis of their analysis, Keyzer et al. (2005) concluded that the world demand for cereal feed grain would be significantly higher over the next 30 years than currently estimated. Given this scenario, any factor that limits or reduces crop yields has the potential to significantly impact on the supply of human food of both plant and animal origin. Climate change and plant fungal diseases and associated mycotoxins have that capacity (Bryden, 2012). The increased demand for animal products is accompanied by an increased utilisation of resources and as Thornton (2010) has intimated, future patterns of animal product demand will be modified by competition for resources, climate change, socio-cultural factors, ethical concerns and technological developments. Notwithstanding these drivers of change there is increasing concern about the competition between man and animals for the global supplies of grain which has been exacerbated by the use of cereal grains, especially maize, for biofuel production (Wu and Munkvold, 2008). It is not possible within the present paper to discuss the complexities of this conflict between animals and man. It has been reviewed by others (see Cheeke, 2004; Keyzer et al., 2005; Farrel, 2010; Swick, 2011). Likewise the global capacity to meet the increasing demand for cereal grains that will require both increased yields and cropping intensity has been the subject of numerous reviews (see Tester and Langridge, 2010; Gregory and George, 2011).
Aust. Poult. Sci. Symp. 2016.....27
5

b) Poultry production Poultry products, especially meat and to a lesser degree eggs, have been major leaders as the global demand for animal sourced products has increased. Australia’s quarantine laws have shielded the local industry from many of the pressures of globalisation. Nevertheless to retain its competitive edge, the local industry must develop strategies to deal with scarcity of essential resources. Moreover to maintain public confidence it must think globally and act locally. The environmental impact generated by the poultry industry is primarily from feed production, the utilization of fossil fuels, and manure management. While the industry has limited control over the production of the feed that is used on farm, other GHG emissions occur on farms that are under its control. These emissions may be in the form of purchased electricity, propane used for heat and incineration of dead birds, diesel used in farm equipment (including generators), and emissions from manure management. Currently, the available data from actual Australian farm activities (Wiedemann and McGahan, 2011; Wiedemann et al., 2012) that show the environmental impacts that occur are limited. Nevertheless, improvements will be achieved through increased feed conversion efficiency, use of alternative energy sources, use of spent litter and water recycling.
VII. GLOBAL ACCORD In the future our food will need to be produced more efficiently with increased agricultural productivity coming from a reduced land area and resource base. Maintaining global food security will become much more difficult as the population increases. We must double food production in a sustainable manner. Greater quantities of food will need to be produced with reduced inputs of water, energy and nutrients on the same or reduced area of arable land in a changing environment. To do otherwise will court significant human conflict. The application of contemporary food production and processing practices, along with scientific advances combined with appropriate social policies, can underpin sustainable global food production systems. Clearly, the solution to the challenge of meeting future food demands lies in increased agricultural productivity. Priority should be given to policies that target sustainable intensive production by the use of carefully managed inputs of fertilizer, water, and feed to minimize waste and environmental impact, supported by improved access to markets, new varieties, and technologies. The attainment of water, food and energy security will permit our food systems to evolve in a sustainable manner. To achieve this, a number of areas (adapted from Cribb, 2010) must be addressed urgently: • Science and research: There has been a global decline in agricultural R&D in the past
four decades. There is now an urgent need to redouble the agricultural research effort. The new food producing system has to be science-based with low resource input. To ensure this occurs there must be definable career paths to encourage the next generation to enter agriculture and food research.
• Economics and education: Increased economic development is required in developing countries hand-in-hand with education. These improvements will ultimately decrease the birth rate. In many economies, women manage the food cycle and their recognition and education should be a priority. In developed economies, education will be equally important as consumer attitudes will be very important to the eventual acceptance of new technologies and adoption of different patterns of food consumption. Part of the economic equation must be to pay farmers more for their products.
• Sustainable diet: Part of the solution to feeding the planet is the development of consumption patterns that meet requirements in a safe, nutritious and affordable manner. In developed countries this will mean learning to eat sustainably with less reliance on
Aust. Poult. Sci. Symp. 2016.....27
6

meat. Through the application of the tools of molecular biotechnology, future nutrition will be personalised to account for individual variation and to improve health and well-being.
• Waste: Postharvest losses of plant foods can be substantial in developing countries and amount to 30 to 50 % of production due to a lack of storage infrastructure. In developed countries we throw away a similar proportion of all food produced. The combined loss would feed about 3 billion people. Reducing wastage will provide breathing space to allow the development and adoption of new food production technologies.
• Governance: Addressing these complex issues will take commitment and collaborative efforts at both an international and national government levels. It must also involve government agencies, private enterprise, and nongovernmental organizations. An atmosphere of collective good will ensure that research investment is appropriate and will enable the development of policy to allow integrated implementation of new food production systems.
The Paris Climate Accord provides a glimmer of hope that global issues will be
increasingly addressed at the global level. We now have a UN-based mechanism to tackle the issue of global food security – if nations realise it is as every-bit important as climate change.
REFERENCES
Amuna P & Zotor FB (2008) Proceedings of the Nutrition Society 67: 82-90. Bentham J (2015) The Future of Energy. www.futureagenda.org Blaxter KL (1991) Animal Production 53: 261-269. Bryden WL (2012) Animal Production Science 52: 383-397. Bryden WL (2015) The Future of Food. www.futureagenda.org CAST (1999) Animal agriculture and global food supply, Report No. 135 (Council for
Agricultural Science and Technology, Ames, IA, USA). Cheeke PR (2004) Contemporary Issues in Animal Agriculture (Pearson Prentice Hall, New
Jersey, USA) Cordain L, Eaton SB, Sebastian A, Mann N, Lindeberg S, Watkins BA, O’Keefe JH &
Brand-Miller J (2004) The American Journal of Clinical Nutrition 81: 341-354. Cribb J (2010) The Coming Famine (CSIRO Publishing, Melbourne, Australia). Delgado CL (2003) Journal of Nutrition 133: 3902S-3910S. Farrell D (2010) Great Wealth, Poor Health: Contemporary Issues in Eating and Living
(Nottingham University Press, Nottingham, UK). Finley JW & Seiber JN (2014) Journal of Agricultural and Food Chemistry 62: 6255-6262. Garrett KA, Dendy SP, Frank EE, Rouse MN & Travers SE (2006) Annual Review of
Phytopathology 44: 489-509. Givens DI (2010) Animal 4: 1941-1952. Godfray CJ (2011) Proceedings of the National Academy of Sciences of the United States of
America 108: 19845-19846. Gregory PJ & George TS (2011) Experimental Botany 62: 5233-5239. Hawkesworth S, Dangouri AD, Johnston D, Lock K, Poole P, Rushton J, Uauy R & Waage J
(2010) Philosophical Transactions of the Royal Society B 365: 3083-3097. Keyzer MA, Merbis MD, Pavel IFPW & van Wesenbeeck CFA (2005) Ecological
Economics 55: 187-202.
Aust. Poult. Sci. Symp. 2016.....27
7

Lutz W & Samir KC (2010). Philosophical Transactions of the Royal Society B 365: 2779-2791.
Malthus T (1798) An Essay on the Principle of Population (J Johnson, London, UK) Matossian MK (1989) Poisons of the Past: Molds, Epidemics and History (Yale University
Press, Newhaven, USA) Samman S, Skeaf S, Thomson C & Truswell S (2012) In: ‘Essentials of Human Nutrition -
4th Edition’ (Eds. JI Mann & AS Truswell, Oxford University Press, Oxford, UK) pp. 139-159.
Scholthof K-BG (2003) Annual Review of Public Health 24: 153-174. Speedy AW (2003) Journal of Nutrition 133: 4048S-4043S. Strange RN & Scott PR (2005) Annual Review of Phytopathology 43: 83-116. Swick RA (2011) Proceedings of Recent Advances in Animal Nutrition 18: 1-7. Tester M & Langridge P (2010) Science 327: 818-827. Thornton PK (2010) Philosophical Transactions of the Royal Society B 365: 2853-2867. Tribe DE (1994) Feeding and Greening the World: The Role of International Agricultural
Research (CAB International, Wallingford, UK). Walker DA (2010) Annals of Applied Biology 156: 319-329. Whitmee S, Haines A, Beyrer C, Boltz F, Capon AG, Ferreira de Souza Dias B, Ezeh A,
Frumkin H, G Peng, Head P, Horton R, Mace GM, Marten R, Myers SS, Nishtar S, Osofsky SA, Pattanayak SK, Pongsiri MJ, Romanelli C, Soucat A, Vega J & Yach D (2015) Lancet 386: 1973-2028.
Wiedemann SG & McGahan EJ (2011) Environmental Assessment of an Egg Production Supply Chain using Life Cycle Assessment (AECL Publication No 1FS091A).
Wiedemann S, McGahan E & Poad G (2012) Using Life Cycle Assessment to Quantify the Environmental Impact of Chicken Meat Production (RIRDC Chicken Meat Publication No. 12/029).
Williams P (2007) Nutrition and Dietetics 64: S113-S119. Wu F & Munkvold GP (2008) Journal of Agricultural and Food Chemistry 56: 3900-3911.
Aust. Poult. Sci. Symp. 2016.....27
8

PEAK FOOD AND OUR QUEST FOR AN ETHICAL AND ECOLOGICALLY SUSTAINABLE HUMAN DIET
R.G. ALDERS1
Summary
Crude analyses of sustainable global resource use suggest that the peak rate year for commercial poultry production was reached in 2006 while projections indicate the need to deliver optimal and sustainable diets for 9 billion people by 2050. In addition, despite increases in agricultural production over the past two decades, malnutrition rates in have not diminished significantly, with undernutrition remaining a significant problem in many developing countries and overnutrition becoming a major issue globally. Consequently, the past focus on increasing the quantity of food production is giving way to a focus on producing quality food that is nutrient rich, bioavailable and affordable and that can efficiently and sustainably meet the nutritional needs of individuals at every stage of life. This paper discusses key challenges and potential solutions associated with i) increasing food production (by providing diets tailored to individuals according to their life stages and cuisines of sub-populations, producing nutritionally rich foods, increasing dietary diversity and empowering women) and ii) decreasing food wastage (by decreasing post-harvest losses, increasing the purchase of appropriate quantities of nutritious food, increasing food safety and decreasing nutrient loss). It concludes that food producers and harvesters can play a key role in enhancing human physical and mental health while at the same time making the health of the planet more resilient.
I. INTRODUCTION Humanity is at a crossroads as we seek to deliver optimal and sustainable diets for 9 billion people by 2050 (Alders et al., 2016; FAO 2009). Crude analyses of global resource use have suggested that “peak poultry”, i.e. the maximum resource appropriation rate for poultry, was reached in 2006 (Seppelt et al., 2014). However, while certain production systems may have peaked, food technology is not static and will play a crucial role in meeting food requirements (Campbell, 2015). Moreover, it is important that our food systems can ensure that people have access to affordable, nutritious foods at every stage of life (Glopan, 2014).
The mandate of the Food and Agriculture Organization of the United Nations (FAO), established at the end of the Second World War, prioritises “ensuring humanity's freedom from hunger” (FAO 1981). Farmers and agricultural researchers responded to this challenge with huge increases in agricultural production since the 1950s. However, the focus has generally been on the volume of food produced with the farm gate prices being determined by weight, i.e. focussed on quantity rather than quality. Projections show that feeding a world population of 9 billion people in 2050 would require raising overall food production by some 70 percent between 2005/07 and 2050 (FAO, 2009). In addition to requiring increased food production, we also require diets targeted to individual needs appropriate to the life stages and the cuisines of sub-populations (Alders et al., 2016). Despite increases in agricultural production over the past two decades, malnutrition rates have not diminished significantly, with undernutrition remaining a significant problem in many developing countries (Girard et al., 2012; Masset et al., 2012) and overnutrition becoming a major issue globally (Glopan, 2014). These trends are reflected statistically with: 200 million children under the age of five who are stunted or wasted due to undernutrition; two billion people
1 Faculty of Veterinary Science and Charles Perkins Centre, University of Sydney; [email protected]
Aust. Poult. Sci. Symp. 2016.....27
9

suffering physical and cognitive effects resulting from a lack of essential vitamins and minerals in their diets; and 1.4 billion people who are overweight or obese (Glopan, 2014).
Nationally, the 2011-12 Australian Health Survey (AHS) nutrient intake data demonstrated significant nutrition-related issues, for example: (i) 62.8% of Australians aged 18 years and over were overweight or obese, (with 35.3% overweight and 27.5% obese); and (ii) one in eight Australians over the age of two years had an inadequate daily intake of iron (Australian Bureau of Statistics 2015). Women in particular had poor intakes of iron with 23% not meeting requirements compared to only 3% of men, and the prevalence was highest amongst women of reproductive age (14-50 years). These nutritionally-related health conditions have an impact on food requirements both now and into the future. This is tackled in the Sustainable Development Goal #2 which aims to end hunger, achieve food security and improved nutrition, and promote sustainable agriculture (United Nations, 2015). Nutrition-sensitive food value chains (Hawkes and Ruel, 2012) will be vital to achieving this goal as will adopting an Ecohealth framework (Rapport and Singh, 2006). EcoHealth can be defined as the recognition that “health and well-being are the result of complex and dynamic interactions between determinants, and between people, social and economic conditions, and ecosystems” (Charron, 2012).
In addition to providing nutrition for humans, our food systems currently provide nutrition for companion and intensively raised farm animals. As human population increases the number of companion animals has tended to increase, and pet food has changed in parallel with the changing roles of these animals in human society (Swanson et al., 2013). With increasing pressure on agricultural production, assessing the competing needs of humans, animals and the environment becomes increasingly important.
Of the multitude of challenges facing our food systems, this paper specifically highlights key challenges and solutions to this through increased food production and decreased food wastage.
II. KEY CHALLENGES AND POTENTIAL SOLUTIONS
a) Increasing the sustainable production of nutritious and safe food As noted above, human population is set to reach 9 billion by 2050 and 11 billion by 2100. This increase will be accompanied by increasing urbanisation, an increasing middle class and aging population together with a smaller rural labour force and more feedstocks for a potentially huge bioenergy market (FAO, 2009). Challenges and possible solutions to increasing the sustainable production of nutritious and safe food include: • Providing diets tailored to individuals according to the life stages and cuisines of sub-
populations - Future food production will need to specifically target the nutritional requirements of individuals according to their age, gender and reproductive status while also employing efficient technologies. This is a major commercial opportunity that should inspire public-private partnerships. Urban food production will need to complement that produced by farmers in agricultural areas (Alders et al., 2016).
• Producing nutritionally rich foods - Accessing sufficient calories is important, but calories alone are not enough to optimize epigenetic programming (Kaput, 2010); the proper balance of micronutrients is also essential for both short- and long-term health. This has become clear, as obesity and related health concerns are becoming significant issues in individuals and communities adopting western diets (Alders et al., 2016). Therefore, instead of focussing solely on volume or weight, it will be important for food producers to increasingly take the naturally nutrient-rich (NNR) score (which assesses the contribution a food makes to the nutrient intake of a 2000 calorie [8360 kJ] daily diet and
Aust. Poult. Sci. Symp. 2016.....27
10

includes 14 key macronutrients; Markovic and Natoli, 2009) into account to produce whole foods that provide the highest nutrient-to-kilojoule ratio.
Where animal source food (ASF) is concerned, it should ideally mimic the naturally lean wild meat consumed by humans over thousands of year (Wang et al., 2009). As the human gene line separated from the great apes about 5–7 million years ago, the human genome is largely ancient with our physiology and genomics remaining adapted to wild foods. Wild meats are naturally lean. Wang et al. (2009) report a substantial increase in the amount of non-essential fats and a loss of essential fats derived from contemporary animal husbandry, including poultry meat, a trend which needs to be reversed.
As we move into the future, food production programs will need to: explicitly incorporate nutrition objectives and indicators; collaborate and coordinate with other sectors (health, environment, social protection, labour, water, sanitation, education and energy); and maintain or improve the natural resource base (water, soil, air, climate, biodiversity; Ruel, 2013). While in vitro meat (Edelman et al., 2005) may provide a source of protein, it does not currently offer the full range of bioavailable nutrients (e.g. calcium) provided by traditional animal source food and so is unlikely to completely replace all animal production systems in the foreseeable future.
• Promoting dietary diversity - Neglected or underutilized crops have the potential to play a number of roles in the improvement of food security that include being: (a) a way to reduce the risk of over-reliance on very limited numbers of major crops; (b) a way to increase sustainability of agriculture through a reduction in inputs, such as fossil fuel-derived nitrogen fertilizers and fuel for agriculture, given the risks of the carbon footprint of agriculture on climate change and the transition to a post peak-oil world; (c) a contribution to food quality; and (d) a way to preserve and celebrate cultural and dietary diversity (Mayes et al., 2011).
With respect to ASF, dietary diversity can be promoted through the consumption of all edible parts of the carcass, including offal. Offal such as liver, provide an excellent source of bioavailable micronutrients such as haem iron (de Bruyn et al., 2015).
• Empowering women - Ensuring access to productive resources, income opportunities, extension services and information (Ruel, 2013). Improving women’s access to inputs and services has the potential to increase women’s output to the same level as that of men, implying an improvement of 2.5-4% of total agricultural output (FAO, 2014). Improving women and children’s access to a balanced diet, especially during the crucial period from conception until children reach 2 years of age will reduce stunting and, therefore, improve life-long health and productivity (Glopan, 2014).
b) Decreasing food wastage
FAO (2103) estimates that each year, approximately one-third of all food produced for human consumption in the world is lost or wasted. A 2009 study found that NSW households spent $2.5 billion on food that was not consumed (DSEWPaC, 2011). This food wastage represents a missed opportunity to improve global food security and also to mitigate environmental impacts and resources use from food chains. Again, challenges and possible solutions associated with mitigating food wastage include: • Decreasing post-harvest losses - Improving access to and reliability of cold storage
facilities will reduce losses of poultry meat globally. For example, the shelf life of eggs can be augmented in many locations by expanding the use of coating them in vegetable oil (McGregor,2015).
Aust. Poult. Sci. Symp. 2016.....27
11

• Increasing the purchase of appropriate quantities of nutritious food - Increasing awareness of the importance of purchasing less but more nutritious food will significantly reduce food wastage (Alders et al., 2016).
• Increasing food safety - Disease emergence has paralleled the intensification of livestock production with diseases such as bovine spongiform encephalopathy and highly pathogenic avian influenza, leading to the disposal of huge numbers of carcasses. Intensive animal production systems are already responding to concerns about antimicrobial resistance through research into a range of alternative growth promotants (Verstegen and Williams, 2002). Investigations into the molecular basis of genetic resistance to disease (Zekarias, 2002) may also contribute to enhanced food safety in addition to overcoming the lack of genetic diversity amongst commercial chicken breeds.
• Decreasing nutrient loss - Nutrients are essential to life and yet modern food production and processing systems are causing huge nutrient losses (Cribb, 2010). Annual nutrient losses through soil erosion are thought to exceed all the nutrients applied as fertilizer across the globe. Producing fertiliser from heat-treated urban human waste has the potential to contribute to improved nutrient cycling.
• Integrating supply chain and consumer technologies - The possibility of the “wired home” and the “internet of things” means a product can potentially be ordered, tracked and monitored through its entire lifespan, from production to plate. Home refrigerators themselves may monitor and optimise food usage for their owners: keeping track of food expiry dates and quantities, reordering food on a the “just in time” logistics principle, linking directly to automated supermarket supply chains to ensure an optimal distribution network from farm to consumer (D. Stellmach, pers.comm, 7 January, 2016).
III. CONCLUSIONS
It will be essential for the agriculture, health, education and infrastructure sectors to work together closely to ensure that food can be produced and utilised efficiently and effectively. An awareness of the importance of the nutrient density and bioavailability of foods will help people wanting to maintain a nutritionally sound diet and healthy body weight. Food producers and harvesters can contribute to enhanced physical and mental health and in the process make the health of the planet more resilient (Alders et al., 2016).
Adequately and sustainably nourishing 9 billion people by 2050 will involve direct action from all levels of production from the soil to the plate. An Ecohealth approach to the production of sustainable, nutritious and safe food delivered with minimal waste has the potential to promote human, animal and environmental health. As governments worldwide grapple with unsustainable health budgets, nutrition-sensitive agriculture and value chains, bolstered by more effective policy frameworks, can help to stop malnutrition and ensure that the food produced delivers maximum benefits. ACKNOWLEDGEMENTS: I would like to thank the organisers for the invitation to speak at this symposium and the Australian Centre for International Agricultural Research for supporting my food and nutrition security research over many years.
REFERENCES Alders R., Nunn M, Bagnol B, Cribb J, Kock R & Rushton J (2016) Good Nutrition in One
World (Karger, Basel, Switzerland). [in press]
Aust. Poult. Sci. Symp. 2016.....27
12

Australian Bureau of Statistics (2015) Australian Health Survey: Usual Nutrient Intakes, 2011-12 (ABS, Canberra, Australia).
de Bruyn J, Wong J, Bagnol B, Pengelly B & Alders R (2015) CAB Reviews 10: 1-9. Campbell H (2015) Science20.com.
http://www.science20.com/science_20/no_we_have_not_reached_peak_food152734 Charron DF (2012) Ecohealth Research in Practice: Innovative Applications of an Ecosystem
Approach to Health (Ed. Charron DF, Springer, New York, USA) pp. 1-32. Cribb J (2010) The Coming Famine: The Global Food Crisis and What We Can Do to Avoid
It (CSIRO Publishing, Australia). DSEWPaC (2011) National Food Waste Assessment, Final Report (Department of
Sustainability, Environment, Water, Population and Communities, Canberra, Australia). Edelman PD, McFarland DC, Mironov VA & Matheny JG (2005) Tissue Engineering 11:
659-662. FAO (2009) High Level Expert Forum - How to Feed the World in 2050.
http://www.fao.org/fileadmin/templates/wsfs/docs/Issues_papers/HLEF2050_Global_Agriculture.pdf
FAO (2013) Food wastage footprint: impacts on natural resources. http://www.fao.org/docrep/018/i3347e/i3347e.pdf
FAO (2014) The female face of farming. http://www.fao.org/gender/infographic/en/ Glopan (2014) How can Agriculture and Food System Policies improve Nutrition?
(Technical Brief, London, UK: Global Panel on Agriculture and Food Systems for Nutrition).
Hawkes C & Ruel MT (2012) Reshaping Agriculture for Nutrition and Health (International Food Policy Research Institute, Washington) pp. 73-81.
Kaput J (2010) Using genetics to tackle malnutrition (SciDevNet). http://www.scidev.net/en/opinions/using-genetics-to-tackle-malnutrition.html
Markovic TP & Natoli SJ (2009) Medical Journal of Australia 190: 149-151. Mason L, Boyle T, Fyfe J, Smith T & Cordell D (2011) National Food Waste Data
Assessment: Final Report (Prepared for the Department of Sustainability, Environment, Water, Population and Communities by the Institute for Sustainable Futures, University of Technology, Sydney).
Mayes S, Massawe FJ, Alderson PG, Roberts JA, Azam-Ali SN & Hermann M (2011) Journal of Experimental Botany. http://doi.org/10.1093/jxb/err396
McGregor O (2015) BVSc Honours Dissertation (Faculty of Veterinary Science, University of Sydney, Australia).
Rapport DJ & Singh A (2006) Ecological Indicators 6: 409-428. Ruel M (2013) The Road to Good Nutrition (Karger, Basel, Switzerland) pp. 24-38. Seppelt R, Manceur AM, Liu J, Fenichel EP & Klotz S (2014) Ecology and Society 19: 50. Swanson KS, Carter RA, Yount TP, Aretz J & Buff PR (2013) Advances in Nutrition 4: 141-
150. United Nations (2015) Transforming our world: the 2030 Agenda for Sustainable
Development (United Nations, New York, USA). https://sustainabledevelopment.un.org/post2015/transformingourworld
Verstegen MW & Williams BA (2002) Animal Biotechnology 13: 113-127. Wang Y, Lehane C, Ghebremeskel K & Crawford MA (2009) Public Health Nutrition 13:
400-408. Zekarias B, Ter Huurne AA, Landman WJ, Rebel JM, Pol JM & Gruys E (2002) Veterinary
Research 33: 109-125.
Aust. Poult. Sci. Symp. 2016.....27
13

POSSIBLE INTERACTIONS BETWEEN DRINKING WATER CHARACTERISTICS AND FEED ENZYME EFFICACY IN POULTRY PRODUCTION
A.J. COWIESON1
Summary
Considerable attention has been given in the past few decades to the influence of diet chemistry on the effectiveness of exogenous enzymes. Characterization of substrates such as soluble arabinoxylan, phytic acid and resistant starch has allowed feed enzymes to be applied more strategically to close nutritional input gaps in poultry and swine production. Furthermore, various technologies such as ingredient quality prediction by NIR have been deployed in order to align enzyme use with the digestibility of key macronutrients in a feedstuff. However, whilst association of enzyme effect with substrate concentration and nutritional quality of raw materials is clearly logical there has been virtually no interest in the possible interfering effects of drinking water on enzyme effect. Such effects are likely to be linked to changes in solubility of key substrates for enzymes e.g. phytic acid, changes to the passage of feed through the intestine, electrolyte balance and influences on nutrient transport and possible extension to the microbiome. It is the purpose of this short review article to suggest some possible influences of drinking water on the nutrition of poultry in general and more specifically, to the influence such variation may have on the efficacy of exogenous enzymes. This paper will not consider microbiological/sanitary aspects of water quality and bird health and welfare but rather aspects of water characteristics that may have a direct bearing on the efficacy of exogenous enzymes and nutrition.
I. INTRODUCTION Exogenous enzymes have been applied successfully to poultry and swine diets since the 1980s in order to enhance the digestibility of macronutrients in feedstuffs and to reduce the adverse effects of various dietary antinutrients. As with most zootechnical additives, variance exists in the effect of enzymes on bird performance, nutrient digestibility and various other phenotypic response metrics. For example, recent holo-analyses of the effect of protease, phytase and xylanase on ileal amino acid digestibility revealed that responses ranged from less than zero to over 10% increase relative to the appropriate control diet (Cowieson & Bedford, 2009; Cowieson, 2010; Cowieson & Roos, 2014). The origin of the variance in enzyme response is not clear but is likely to be related to substrate concentration, the inherent digestibility of focal nutrients such as starch, amino acids, fat and phosphorus and various other factors such as health status of the flock, age, feed processing etc. One potentially important source of variance that has attracted scant attention in the literature is the characteristics of the drinking water and is the focus of the present review.
The characteristics of drinking water in poultry operations may be broadly considered in four major groups. Firstly the sanitary ‘biological’ quality of the water where factors such as bacterial contamination is clearly important for poultry health and welfare (Amaral, 2004). Secondly the concentration of suspended or dissolved material e.g. metal ions, nitrates etc. has a bearing on salinity, hardness and potential toxicity issues. Thirdly the temperature of the drinking water will clearly interact with the bird, especially in situations where the bird is thermally stressed. Finally the pH of the drinking water (not independent from either of the first two categories) will play a major role in solubility of proteins and minerals in the proximal digestive tract.
1 DSM Nutritional Products, Kaiseraugst, Switzerland; [email protected]
Aust. Poult. Sci. Symp. 2016.....27
14

It is not the purpose of the present review to extensively describe each category and to
discuss the potential influence on bird health and nutritional status. However, some potential overlaps between water characteristics and the efficacy of exogenous enzymes will be discussed as well as some options to reduce any negative consequences that may arise from such interactions.
II. pH The solubility of nutrients in the intestine of poultry is highly pH dependent and relies on rapid acidification of the ingesta for improving miscibility with water and activation of pepsinogen (Duke, 1986). Perhaps surprisingly the pH of drinking water and the influence this has on intestinal (proximal and distal) pH has not been widely studied. Additionally, the pH range of drinking water in various poultry producing countries has not been systematically reviewed. Indeed, much of the research in the area of drinking water pH involves organic acid supplementation for the purposes, typically, of microbial management and this is not directly related to water pH per se. Carter & Sneed (1996) report that in a 1996 survey of drinking water wells used in North Carolina, USA, 16% of samples had a pH below 6.0, a level associated with reduced feed intake and poor performance (Fig. 1; Grizzle et al., 1996).
Figure 1 - Effect of drinking water pH on body weight of broilers (adapted from Grizzle et al., 1996). A
significant difference between pH 5.75 and the two higher groups was observed on d42.
Grizzard et al., (1996) observed a significant reduction in body weight of broilers fed a standard corn/soy-based diet. This response was associated with a significant increase in liver (2.18, 2.38 & 2.51% of BW respectively for water pH 5.75, 6.25 and 6.75) and spleen (0.129, 0.125 & 0.155% of BW respectively for water pH 5.75, 6.25 and 6.75) weights. The authors conclude that these changes may be associated with a depressed immune competence at low drinking water pH. Unfortunately a similar study exploring possible detrimental effects of high drinking water pH (>8) could not be found. However, it is well accepted that the solubility of various nutrients including protein and especially phytic acid requires a low pH environment. High drinking water pH is likely to be associated with high water hardness
0
200
400
600
800
1000
1200
1400
1600
1800
2000
d14 BW (g) d28 BW (g) d42 BW (g)
pH 5.75
pH 6.25
pH 6.75
Aust. Poult. Sci. Symp. 2016.....27
15

(or a high concentration of dissolved CaCO3) which introduces direct pH effects as well as buffering, acid binding and phytate-chelating influences. The influence of pH on the solubility of phytic acid and related mineral precipitates is well known (Cheryan & Rackis, 1980). Furthermore, it is clear that higher Ca concentrations result in precipitates forming at lower pH than is otherwise the case (Martin & Evans, 1986). Although drinking water pH may not directly influence the pH of the small intestine due to the substantial capacity of the gut to buffer it is likely that drinking water pH will influence the pH in the proximal tract and so the solubility of phytic acid and other nutrients in the incoming diet. High drinking water pH and hardness, given that broilers will typically drink 1.5-2.0 times more water by weight than the feed they consume, may substantially alter the ability of, for example, exogenous phytase, to rapidly hydrolyse phytic acid in the gastric phase of digestion. As the gastric gut is the principal hydrolytic ‘window’ for phytase to effect a reduction in the solubility of phytic acid associated with higher drinking water pH, and dissolved CaCO3 may influence how much phytic acid, in a fully phosphorylated form, passes to the small intestine to interfere with the digestive process. Given that acidification of drinking water with various organic acids promotes increased digestibility of phytic acid (Rafacz-Livingston et al., 2005) it is axiomatic that opposing trends may be apparent at high pH.
Interestingly, a systematic study on the effect of drinking water pH (from 5-8) on broiler performance, nutrient digestibility and GI tract pH has not been reported (or at least the present author was unable to find such an article). Given the importance of pH on the rate and completeness of digestion of protein and minerals this information may be helpful in determining opportunity for intervention with acidifying agents and/or to control the use of zootechnical additives, such as enzymes, more strategically. The author appreciates the extensive capacity of the gut to buffer incoming feed and water but given the rapid rate of feed passage in modern broilers and also their relative juvenility at slaughter it is conceivable that drinking water pH may influence their capacity to solubilise and digest feed. Finally, the importance of drinking water pH and hardness for enzyme activity warrants some thought as different enzymes have different pH activity profiles. Indeed, Greiner & Konietzny (2010) report that pH optima for phytases from a variety of sources ranges from 4.0 for Citrobacter braakii to around 8.0 for a phytase from Bacillus amyloliquifaciens. A study to explore the influence of drinking water pH per se on performance and gut pH would be of value.
III. TEMPERATURE Akin to work on drinking water pH, the vast majority of work on drinking water temperature is associated not with classical nutrition but rather with disease/health management (in particular mitigation of heat stress). It is well known that water of higher temperature than the ambient temperature at bird level is not favoured by birds and will depress growth and feed intake (Gates & Kare, 1961). Furthermore, work by Harris et al. (1975) confirmed that drinking water temperature below ambient air temperature (obviously considering the influence of bird age/brooding temperature) appears to promote efficiency and growth rate of birds (Fig. 2), perhaps particularly in grower and finisher phases. It is likely that this conclusion would be exaggerated with contemporary birds who have considerably accelerated growth rates compared with their 1970s ancestors and substantially higher metabolic heat production (Gous & Morris, 2005).
To the authors knowledge there have been no studies published where the effect of drinking water temperature on the solubility and digestibility of various nutrients in broilers have been systematically explored. Furthermore, there is no information in the literature on the effect of drinking water temperature on the temperature of the contents of the proximal and distal GI tract. Presumably any deviation between the temperature of the drinking water
Aust. Poult. Sci. Symp. 2016.....27
16

and core body temperature of the bird would be transient and would find an equilibrium with body temperature moderately quickly. However, in instances when drinking water temperature is very divergent from the body temperature of the bird and/or when the bird is already under heat or cold stress, these changes may not be especially rapid, especially in the neonate and in the proximal sections of the tract such as the crop, proventriculus and gizzard.
Figure 2 - Effect of drinking water temperature on growth rate and feed intake in broilers (adapted from Harris
et al., 1975). Significant reductions in growth and feed intake were associated with drinking water temperature above 35ºC which also extended to FCR (not shown). When common water temperature was introduced from 3-7 weeks no carry-over effects were noted (not shown).
Exogenous enzymes vary considerably in their temperature profiles. For example,
Greiner & Konietzny (2010) show that the optimal temperature for phytase from a wide variety of sources varies from 38ºC (endogenous phytase from oat) to around 70ºC (phytase from Aspergillus terreus). The optimal temperature for most commercially available exogenous phytases is in the range 50-60ºC e.g. Aspergillus niger (55-58ºC), Eschericia coli (55-60ºC) and Citrobacter braakii (50ºC). As exogenous enzymes have both an optimum temperature and a temperature range over which they express meaningful activity some attention should be given to the compatibility of the temperature profile of current xylanases, phytases, proteases and so on and the temperature of the drinking water in various locations. This interaction may be particularly important for phytase given that the principal site of activity of phytase is the gastric gut (the part of the intestine likely to vary most in temperature associated with the drinking water). Furthermore, recent work by Darby et al. (2016) suggests that phytate/protein complexes form at low (10ºC) but not high (40ºC) temperatures and as the phytate/protein complex has a central involvement in both the antinutritional effect of phytic acid and also the solubility and accessibility of this substrate for phytase this is an emergent area that requires further consideration. A systematic assessment of variance in drinking water temperature in various poultry-producing locations globally would also be valuable.
IV. IONS Drinking water contains various naturally occurring ions including Na, Cl, Zn, Fe, Cu, Ca and sulphate (Carter & Sneed, 1996). Typically these ions are present at very low
0
100
200
300
400
500
600
700
d1-21 BWG (g) d1-21 FI (g)
17.8ºC
23.9ºC
29.4ºC
35.0ºC
40.0ºC
Aust. Poult. Sci. Symp. 2016.....27
17

concentrations (see Table 1) but can vary considerably, especially when well water is used rather than water from municipal sources. A survey of Na and Cl concentrations in southern Arkansas in 2005 found that water supplies for poultry producers ranged between 367-450 mg/l and 268-470 mg/l for Na and Cl respectively, levels well above recommended concentrations (Watkins et al., 2005).
Table 1 - Selected naturally occurring chemicals in water (adapted from Coetzee, 2006; cited by Klein, 2013).
Chemical Average Low Concentration
Average High Concentration
Average Concentration on
Top Farms Ca, mg/l 9.8 30.5 20.3 Cl, mg/l 14 56.8 30.2 K, ppm 1.29 2.4 1.53 Na, mg/l 7.4 32.9 19.9
The influence of some exogenous salts such as NaCl and KCl and more generally the
electroyle balance of the diet (DEB) on broiler performance is reasonably well elucidated. Borges et al. (2003) noted that a DEB between 200-250 meq/kg was optimal for broiler chick performance. However, there are rather few studies that consider dietary ion balance and water ion balance and the interactive effects between diet and water. Watkins et al. (2005) observed a strong interaction between dietary Na and Cl and Na and Cl from the drinking water (Fig.3), concluding that the drinking water ion concentrations should be considered as forming part of the bird’s need for these salts and that drinking water Na and Cl concentrations should be considered in feed formulation.
Figure 3 - Effect of drinking water Na/Cl concentrations and dietary Na/Cl concentrations on FCR of broilers
from d1-21 (adapted from Watkins et al., 2005).
The effect of salt intake (from dietary or water sources) on the efficacy of exogenous enzymes has not received much attention. However, Ravindran et al. (2008) observed that the beneficial effects of phytase on FCR in broilers were linearly reduced when DEB was increased from 150 meq/kg to 375 meq/kg. The reason for the interaction between DEB and
0
0.5
1
1.5
2
2.5
0/0 200/300 500/750
FCR 1-21d
Na/Cl concentrations in drinking water (mg/l)
0.02/0.04
0.15/0.24
0.25/0.40
Aust. Poult. Sci. Symp. 2016.....27
18

phytase is not clear but may be related to the influence of salt concentrations on the solubility of protein/phytate complexes. Bye et al., (2013) noted that elevating Cl concentration could solubilise protein/phytate complexes, probably by a ‘competitive exclusion’ mechanism whereby the Cl ions compete with phytate for positively charged sites on the protein surface.
Figure 4 - Effect of phytase (500 FTU/kg) on the FCR of broilers fed diets varying in DEB (adapted from
Ravindran et al., 2008).
Ambient salt concentrations in the digestive tract are influenced by the presence of endogenous salts as well as salts from the feed and drinking water. These salts will influence the stability of proteins in the aqueous phase of digesta and will promote or demote solubility depending on their chaotropic or kosmotropic effects. This lyotropic effect of various ions (often collectively referred to as the Hofmeister Series) has been well described in various biochemical disciplines (Zhang & Cremer, 2006) but is largely ignored in nutrition. A representation of the Hofmeister Series is presented in Fig. 5.
Figure 5 - Representation of Hofmeister anions (above) and cations (below) with increasing chaotropic potency from left to right (adapted from Leontidis, 2002; Zhang & Cremer, 2006; Hess & Van der Vegt, 2009).
Nutritionally relevant kosmotropic cations and anions include CO3, SO4, HPO4 and
K. These ions will tend to stabilise proteins in solution, reducing solubility. Alternatively, nutritionally relevant chaotropic cations and anions include Cl, I, Ca, Sr, Mg and Na. These ions will promote the solubility of proteins in solution. It is possible that ion type and concentration in drinking water will directly influence the ability of the bird to solubilise nutrients such as protein in the digestive tract. German et al. (1982) noted that soy protein solubility was around 72% in the presence of 1M NaI, 58% soluble in 1M NaCl and only 45% soluble in 1M Na2SO4, further supporting the influential effect of, in this case, anions, on protein solubility. These effects will have a bearing on the solubility of substrates in the digestive milieu for exogenous and endogenous enzyme functionality.
1.32
1.34
1.36
1.38
1.4
1.42
1.44
1.46
1.48
1.5
DEB150 DEB225 DEB300 DEB375
Control
Phytase
Aust. Poult. Sci. Symp. 2016.....27
19

V. CONCLUSIONS It can be concluded that the interactive effects of drinking water pH, temperature and soluble ion concentration on poultry performance per se and specifically the efficacy of supplemental enzymes is an under-explored area. There is some potential for enzyme effect to be enhanced in magnitude and consistency if appropriate consideration is taken for the possible influences of pH and temperature on enzyme activity and the solubility of substrate. Furthermore, the characteristics of drinking water including pH, temperature and both cation and ion balance should be considered in feed formulation to mitigate issues of wet litter, poor protein and phosphate solubility and variable feed intake.
REFERENCES
Amaral LA (2004) Revista Brasileira de Ciência Avícola 6: 191-199. Borges SA, Fischer da Silva AV, Ariki J, Hooge DM & Cummings KR (2003) Poultry
Science 82: 428-435. Bye JW, Cowieson NP, Cowieson AJ, Selle PH & Falconer RJ (2013) Journal of
Agricultural and Food Chemistry 61: 290-295. Carter TA & Sneed RE (1996) In: ‘Drinking Water Quality for Poultry’ (North Carolina
Cooperative Extension Service). Coetzee CB (2006) In: ‘Development of water quality guidelines for poultry production in
southern Africa’ (PhD Thesis, University of Pretoria). Cheryan M & Rackis JJ (1980) Critical Reviews in Food Science and Nutrition 13: 297-335. Cowieson AJ (2010) The Journal of Poultry Science 47: 1-7. Cowieson AJ & Bedford MR (2009) Worlds Poultry Science Journal 65: 609-624. Cowieson AJ & Roos FF (2014) Journal of Applied Animal Nutrition 2: 1-8. Darby SJ, Platts L, Daniel MS, Cowieson AJ & Falconer RJ (2016) Journal of Agricultural
and Food Chemistry (In press). Duke GE (1986) In: ‘Avian Physiology’ (Ed. Sturkie PD, Springer, New York) pp. 289-302. Gates JD & Kare MR (1961) Poultry Science 40: 1407. German B, Damodaran S & Kinsella JE (1982) Journal of Agricultural and Food Chemistry
30: 807-811. Gous RM & Morris TR (2005) Worlds Poultry Science Journal 61: 463-475. Greiner R & Konietzny U (2010) In: ‘Enzymes in Farm Animal Nutrition’ 2nd Edition (Eds.
Bedford MR & Partridge GG, CAB International, Oxfordshire, UK) pp. 96-128. Grizzle J, Armburst T, Bryan M & Saxton A (1996) Journal of Applied Poultry Research 5:
330-336. Harris GC, Nelson GS, Seay RL & Dodgen WH (1975) Poultry Science 54: 775-779. Hess B & van der Vegt NFA (2009) PNAS 106: 13296-13300. Klein R (2013) In: ‘Chicken Nutrition: A guide for nutritionists and poultry professionals’
(Context Products Ltd, Leicestershire, UK) pp. 11-20. Leontidis E (2002) Current Opinion in Colloid and Interface Science 7: 81-91. Martin CJ & Evans WJ (1986) Journal of Inorganic Biochemistry 27: 17-30. Rafacz-Livingston KA, Parsons CM & Jungk RA (2005) Poultry Science 84: 1356-1362. Ravindran V, Cowieson AJ & Selle PH (2008) Poultry Science 87: 677-688. Watkins SE, Fritts CA, Yan F, Wilson ML & Waldroup PW (2005) Journal of Applied
Poultry Research 14: 55-59. Zhang Y & Cremer PS (2006) Current Opinion in Chemical Biology 10: 658-663.
Aust. Poult. Sci. Symp. 2016.....27
20

WET LITTER – FACTORS ASSOCIATED WITH THE SHED MICRO-ENVIRONMENT AND LITTER PROPERTIES
M.W. DUNLOP1,2,3 and R.M. STUETZ2
Summary
Wet litter in meat chicken sheds occurs as the result of multiple, interrelated causes. This paper discusses some of the sources of water in meat chicken sheds, the properties of litter and the contribution of the shed micro-environment. By increasing awareness of the factors associated with wet litter, it will empower the chicken meat industry with knowledge to identify causes and address local incidences through improved litter management. In general, wet litter will be caused by excess water going into the litter, insufficient evaporation and/or limited water holding capability of the litter. Some strategies to improve the effectiveness of ventilation to maintain litter dryness are discussed.
I. INTRODUCTION
A variety of litter management practices are used in chicken meat production due to environmental, economic, engineering and animal husbandry constraints (Tucker and Walker, 1992). Litter moisture is associated with a multitude of factors such as shed micro-environment and properties of poultry litter. The term ‘wet litter’ is used when the accumulation of water changes the properties of the litter in ways that are considered to be detrimental to health and welfare of the birds, production efficiency, food safety and/or the environment due to odour and ammonia production. Dann (1923) declared wet litter to be a “rather troublesome problem”. Wet litter continues to be a challenging issue despite over 90 years of industry development in terms of selective breeding, shed design, ventilation systems and production methods.
There is no precise, all-inclusive definition of wet litter. In Australia, one welfare-based growing scheme requires that “litter must be maintained in a dry and friable condition” (RSPCA, 2013). Lister (2009) summarised requirements in the United Kingdom that “all chickens shall have permanent access to litter which is dry and friable on the surface” but then “litter should be inspected to ensure it does not become excessively wet or dry”. Presumably, friable litter is required so that it is possible for birds to peck and scratch (DEFRA, 2013), but litter shouldn’t be too dry in order to control dust concentrations (DEFRA, 2002). But exactly how much water can litter contain before it is becomes a concern? Collett (2012) suggested that 25% moisture content (mass of water divided by mass of moist, in situ litter) is the limit above which the “cushioning, insulating and water holding capacity is compromised”. Others have reported that Salmonella and E. coli could be controlled by maintaining litter moisture below 20–35% (Carr et al., 1994; Eriksson De Rezende et al., 2001; Hayes et al., 2000). El-Wahab et al. (2012) reported that the critical moisture content for the onset of foot pad dermatitis (FPD) was approximately 35%. Other studies have distinguished wet vs dry litter based on appearance or litter score, and in these cases, 1.5 to 2.5 L/m²/day of water was added to litter in order to initiate conditions to produce FPD (Cejiz et al., 2011; de Jong et al., 2014). All things considered, there is no single value of moisture content that describes the conditions that initiate the problems
1 Department of Agriculture and Fisheries, Queensland Government; [email protected] 2 UNSW, School of Civil and Environmental Engineering, Sydney; [email protected] 3 Poultry CRC. University of New England, Armidale.
©State of Queensland, 2015
Aust. Poult. Sci. Symp. 2016.....27
21

associated with ‘wet litter’. Additionally, the surface moisture content of litter can vary spatially within a meat chicken shed and published literature doesn’t provide guidance as to whether all or just a portion of the shed needs to be above the critical moisture content for litter moisture to become a concern. How much of the shed can have wet litter or cake and not be considered a problem?
There will be no easy resolution to litter moisture management. Wet litter is an incurable condition but the occurrence, frequency or severity of wet litter can be reduced by specific, consistent and persistent management of the litter, flock and shed micro-environment. While the intention is always to avoid wet litter, strict control of litter moisture may not always be possible due to abnormal or adverse production conditions that increase the amount of water going into the litter or that reduce evaporation.
II. SOURCES OF WATER
There are many sources of water in meat chicken sheds that add water to the litter including excreted moisture, normal drinker spillage, leaking drinkers, shed leaks, condensation and water vapour in the air (humidity). When one or more of these are greater than normal it can contribute to the onset of wet litter.
Water in excreta is one of the primary sources of regular water addition to the litter. Dunlop et al. (2015) estimated that the amount of water added to litter from excretion (which inherently includes normal drinking spillage) is 1.5–3.2 L/m²/day for most of a grow-out (Figure 1). Even in the first week of a grow-out, the amount of water added to the litter is 0.5–1.2 L/m²/day. Over the course of a grow-out, the total amount of water added to the litter is over 100 L/m², which is several times more water than the litter can hold, highlighting the necessity of regular water evaporation and removal from the shed using ventilation.
Figure 1 - The amount of water estimated to be added to the litter from bird excretion and normal drinking spillage during a grow-out (reproduced from Dunlop et al. (2015)).
These estimated amounts of water added to the litter from bird excretion are based on ‘average’ conditions. When birds are out of their thermal neutral zone, if they have digestive upset, or if they are not evenly distributed in the shed, the estimated values may vary. If birds
0
20
40
60
80
100
120
0.0
0.5
1.0
1.5
2.0
2.5
3.0
3.5
0 7 14 21 28 35 42 49 56
Gro
w-o
ut c
umul
ativ
e to
tal (
L/m
²)
Wat
er a
dded
dai
ly to
litt
er (L
/m²)
Bird age (days)
Water added daily Grow-out cumulative total
Aust. Poult. Sci. Symp. 2016.....27
22

congregate at higher than average density in particular parts of the shed due to uneven conditions such as temperatures, lighting, drafts, litter condition or because of instinctive or learned behaviours (e.g. perching or migration), it can lead to wet litter commencing in localised areas within a shed. Recurrence of wet litter in the same part of a shed may be useful as a trigger to investigate the specific cause. Drinkers are frequently identified as a cause of wet litter. Litter crusting and caking often starts underneath the drinkers, which suggests that there is higher moisture content. Water spillage underneath drinkers is unavoidable, but may be reduced with evaporation cups and by ensuring water pressure and drinker heights are optimal. Pressure needs to be sufficient for drinker nipples to seal and to ensure that water supply is adequate. Uneven pressures along drinker lines can contribute to spillage, and may be reduced with multiple supply points and specialised regulators. The height of drinkers is equally important and needs to be adjusted at least daily to ensure the birds’ beaks are positioned to minimise spillage.
III. LITTER PROPERTIES
‘Wet litter’ is not only about moisture, but is also about friability if the definitions provided in welfare guidelines are considered. It is therefore necessary to keep litter in a friable condition. Maintaining friability also has certain advantages apart from welfare considerations. When litter is friable, it helps to keep litter dry and enables birds to ‘work’ the litter when they walk, scratch, dust-bathe and forage. This action incorporates fresh excreta, aerates the litter and regularly exchanges the litter particles at the surface where evaporation potential is greatest (Dann, 1923). Litter moisture affects the amount of cohesion (stickiness) between litter particles (Bernhart and Fasina, 2009), which affects friability. As litter moisture increases above 20–30%, litter particles begin sticking together and form agglomerates or ‘clumps’ because water acts as a natural binder (Bernhart et al., 2010). Bernhart et al. (2010) also found that more force was required to break down the clumps and return the litter to a friable state when litter had higher moisture content at the time of compaction. Litter dryness and friability affects the way that fresh excreta are worked into the surface of litter. When a dropping is deposited onto dry and friable litter it gets coated with litter particles. These absorb some moisture from the excreta and provide a non-sticky layer that prevents droppings from sticking together. Bird activity moves and rolls droppings over the litter surface and breaks them into smaller pieces, each becoming coated as this physical breakdown continues. This increases surface area, which accelerates moisture loss and drying, and also sustains a material that the birds can continue to ‘work’ with normal activity. Conversely, when a dropping is deposited on wet or caked litter, it is unable to be coated by litter particles. The dropping becomes smeared on the litter or caked surface. Because moisture is not readily transferred to the litter below, there is sole reliance on evaporative removal from the litter surface and the dropping will stay wetter for longer. When conditions in the shed don’t favour drying (e.g. low air velocity and high humidity, which frequently occur at night) the damp manure layer grows. Because it forms at high moisture content, the energy/force required to break the manure down into a friable mixture is more than the birds can manage.
There is a need to focus on conditions at the litter surface in order to understand and address wet litter. Water is routinely applied at the surface from drinker spillage, excreta and absorption of humidity from the air. Water is also evaporated from the litter surface. If the surface is damp, manure crusting and/or caking occurs, which slows the rate of drying from the litter surface and slows the movement of water into the litter below the caked surface.
Aust. Poult. Sci. Symp. 2016.....27
23

Moisture at the litter surface is an important consideration and yet it is rarely specifically measured; instead the average moisture of the full litter depth is most often measured. The value of this is questionable because a few hours (e.g. overnight) of high humidity or water application may be sufficient for the surface to act like wet litter even though the average moisture content for the full litter depth might suggest that the litter is fairly dry. Measuring litter surface conditions in a meaningful and repeatable manner is something that requires further investigation and development.
a) Water storage capability of litter
So how much water is in litter? This is a very important question and there are several ways to measure the wetness of litter; however, none of these necessarily help with establishing the critical point at which litter could be defined as ‘wet’. This is because not all litter materials behave the same, especially with respect to stickiness, matting and friability. The properties of litter also change during a grow-out, so while bedding/litter may behave in a certain way at the start of a grow-out, it may behave differently at the end. The most common way to measure the wetness of litter is with the unit ‘moisture content’, which is calculated by dividing the mass of water contained in the litter by the mass of the litter (expressed as a percentage). For example, if a sample of litter has 25% moisture content, then a quarter of the mass of the litter is water. One shortcoming with this unit of measurement is that the density (mass divided by volume) of the dry litter material affects the calculation of moisture content. The denser a material, the more water it will contain for the same value of moisture content. This requires careful consideration when trials are conducted with different bedding/litter materials, or those that contain different amounts of manure. An alternative method to measure the wetness of litter is to consider the actual volume of water contained in a square metre of litter (litres per square metre, L/m²) assuming a specified depth (e.g. 5 cm). By using this measure, it is possible to calculate a water balance if water inputs (e.g. excreted/spilt water, Figure 1) and evaporation are known. This method of describing litter wetness also has its limitations, especially in defining the volume of the litter material, which can be difficult because litter is readily compressible.
Figure 2 - The amount of water in a square metre of litter (L/m²) at selected values of moisture content throughout a grow-out period (derived from Dunlop et al. (2015)).
0
2
4
6
8
10
12
14
16
7 14 21 28 35 42 49 56
Wat
er in
1 m
² of l
itte
r (L
/m²)
Length of grow-out (days)
60%
47%
35%
23%
10%
Litter moisture content
Aust. Poult. Sci. Symp. 2016.....27
24

The amounts of water stored in a square metre of selected bedding materials and end-of-grow-out litter have previously been presented (Dunlop, 2014). Figure 2 shows how the amount of water able to be stored in meat chicken litter increases during a grow-out (over a range of selected moisture content values for litter that started as pine shavings). The addition of manure during the grow-out increased the moisture holding capacity. Towards the end of the grow-out, the litter held approximately twice the amount of water as that of pine shavings. Referring to Figures 1 and 2, it can be seen that the amount of water applied to the litter from the birds daily is approximately enough to increase the litter moisture content by about 10%.
b) Water dynamics within litter
The amount of water in litter is one consideration, but the availability and freedom of that water is arguably more important. This necessitates discussion about the concept of water activity (Aw), otherwise known as equilibrium relative humidity (ERH). Water activity is used to explain why different materials may contain the same amount of water but the availability of that water for microbiota and evaporation may not be equal. This is because of differences in how the water molecules are bound to the material. Water activity is used extensively in food preservation, where dehydration, cool storage or the addition of sugar, salt or other additives may be used to reduce the water activity to prevent spoilage.
Water activity is more closely related to microbial, physical (e.g. friability) and chemical properties of litter than moisture content (van der Hoeven-Hangoor et al., 2014). It is also relatable to relative humidity (in isothermal, equilibrium conditions) and therefore can be used to explain how much water is absorbed by litter or evaporated from litter depending on the relative humidity of air at the litter surface. Figure 3 shows the relationship between water activity and litter moisture content (measured at 25 °C). The title of the vertical axis can be replaced with ‘relative humidity’ in order to consider the relationship between in-shed relative humidity and litter moisture content. It can be seen that fresh pine shavings have higher water activity than end-of-grow-out litter for the same moisture content. This occurs because pine shavings are a cellulose material that holds water by simple bonds whereas the addition of excreta, which contains carbohydrates, proteins and salts, creates complex molecular bonds that strongly bind water into the litter.
Figure 3 - Relationships between litter moisture content and water activity (otherwise known as equilibrium relative humidity) in litter over a grow-out period. (Microbiota water activity limits from Fontana (2007) and Taoukis and Richardson (2007)).
0.7
0.75
0.8
0.85
0.9
0.95
1
10% 20% 30% 40% 50% 60% 70%
Wat
er A
ctiv
ity
Litres moisture content
Fresh pine shavings
Day 14
Day 35
Day 52
CampylobacterE. coli
Salmonella, Clostridium
Staphylococcus
Aspergillis fumigatus
Aust. Poult. Sci. Symp. 2016.....27
25

Water activity is important in three processes that occur within litter: a) microbiological growth; b) litter stickiness/friability; and c) water absorption and evaporation.
Microbiota require a certain amount of water to grow, and the availability of this water is related to water activity. Figure 3 displays indicative water activity limits for a selection of microbiota of importance in chicken meat production. Below these limits, organisms have restricted growth. Thus maintaining relatively dry litter (below 20–25% moisture content depending on specific litter properties) is sufficient to reduce the growth of specific organisms. It is suggested that relatively higher water activity early in the grow-out (when using fresh bedding) may increase microbiological risks.
Stickiness and friability are directly related to water activity because water needs to be available on the surface of particles to form inter-particle bonds. Once litter reaches a ‘critical hydration level’, particle surfaces plasticise and merge with neighbouring particles (Roudaut, 2007), which results in compacted clumps rather than a friable material. Bernhart and Fasina (2009) found that reduction in friability occurred at a water activity of approximately 0.80–0.85 (corresponding to moisture content 18–22%).
Water absorbance and evaporation will be explained in the following section regarding the shed micro-environment.
IV. SHED MICROENVIRONMENT Water absorption/evaporation between the litter and air is related to the relationship between water activity of the litter and relative humidity of the air (i.e. a water activity gradient). Water will travel from a condition of high water activity to low water activity, and this becomes the driving force to move water within litter and between the litter and air. The rate at which water will move through the litter is also controlled by the molecular diffusion of water through the pores. Because of this, the movement of water through litter will be slower if pores are long or constricted (i.e. litter is compacted or composed of fine materials). Also, movement of water from the base of a thick bed of litter will be much slower than from the surface. Consequently, if litter is deep and allowed to become wet all the way to the base, it will be slow to dry (Dann (1923) recommended that litter should be less than 100 mm deep).
Recalling that the other name for water activity is equilibrium relative humidity, the transfer of water will be regulated by the water activity of the litter and the relative humidity of the air. If the water activity is lower in the litter than the relative humidity of the air, then the litter will absorb moisture from the air but if the situation is reversed then water will transfer from the litter to the air. Therefore, one way to ensure that water is evaporating from litter into the air is to ensure that the relative humidity of the air at the litter surface is kept as low as possible (and certainly below the water activity of the litter).
Relative humidity of the air at the litter surface can be controlled with temperature regulation (Payne, 1967). As a general rule, the relative humidity of air halves if the air temperature is increased by 10–14 °C or the relative humidity doubles if the temperature drops by 10–14 °C, to a maximum of 100% at which time water condenses out of the air creating a fog of water droplets. Payne (1967) and Weaver and Meijerhof (1991) recommended that an in-shed relative humidity of 72–75% was sufficient to cause wet litter or result in litter surface caking. Applying these values to Figure 3 might suggest that litter should reach and stabilise at a very low moisture content (~ 10%), but that the moisture content will be higher because water is being added to the litter by the birds (Figure 1). To that end, Czarick and Fairchild (2012) recommended that the relative humidity should be kept below 60%.
Aust. Poult. Sci. Symp. 2016.....27
26

Modern meat chicken sheds, when well designed and operated, are effective at minimising the relative humidity at the litter surface. This is achieved by having insulation to retain heat within the shed and using well-designed wall inlet vents to mix incoming air with the warm air. However, this action may be ineffective if the in-shed static pressure is not adequate, if the vents are not well adjusted or if exposed battens/purlins on the ceiling prevent air from reaching the ceiling apex and fully mixing. Maintaining warm, low relative humidity air at the litter surface may be enhanced with the use of thermal destratification fans (Ferreira, 2015). Sufficient moisture-laden air needs to be exhausted from the shed to prevent in-shed relative humidity from increasing. When sheds transition into tunnel ventilation, frequent air exchange in the shed prevents the build-up of relative humidity and high air speed is effective at removing moisture from the litter; however, using evaporative cooling increases the relative humidity in the shed, which reduces litter drying. To reduce this effect, Czarick and Fairchild (2014) suggest a ventilation strategy that utilises maximum shed airspeed (at least 3.0 m/s) and not introducing evaporative cooling until the temperature reaches approximately 29 °C. Applying this strategy was found to be effective in maintaining friable litter inside the shed nearest the cool cells. Ventilation needs to be effective at removing water. This means more than simply having enough fans operating. It means bringing in enough air and conditioning it (usually with heat) to lower its relative humidity so it can absorb more water. It is then essential to get this air to the litter where the water needs to be removed. This can be a challenge for litter located underneath drinkers or where birds congregate. For example, if the litter is damp or caked under the drinkers but dry and dusty in between, then simply increasing the number of fans may not necessarily be effective. The reasons for excess water deposition or insufficient evaporation need to be specifically investigated.
V. SUMMARY
There are many interrelated factors that contribute to wet litter. There is a substantial quantity of water added to the litter from bird excretion and drinking spillage and even more is added still if there is an ‘upset’ condition or if the relative humidity of the air at the litter surface is high. The capacity of litter to hold water, and to bind water tightly with low water activity, increases during a grow-out. But if ventilation is not effective, the litter surface can become damp within a short period of time (i.e. hours), which can be enough for ‘wet litter’ and manure crusting/caking to occur. Effective ventilation requires incoming air to be conditioned so that it has low relative humidity (less than 60%) and can absorb moisture from the litter. Water needs to be removed from where it is being applied, which can be a challenge because water addition is not uniform across the shed floor. Strategies that regulate the relative humidity of air at the litter surface and keep the air moving, (e.g. using destratification fans and not excessively using evaporative cooling) may help to prevent wet litter from occurring. ACKNOWLEDGEMENTS: This research was conducted within the Poultry CRC, established and supported under the Australian Government’s Cooperative Research Centres Program, as well as supported by the Department of Agriculture and Fisheries (DAF), Queensland Government; and The University of New South Wales (UNSW).
Aust. Poult. Sci. Symp. 2016.....27
27

REFERENCES Bernhart M & Fasina OO (2009) Waste Management 29: 1392-1398. Bernhart M, Fasina OO, Fulton J & Wood CW (2010) Bioresource Technology 101: 234-
238. Carr LE, Mallinson ET, Stewart LE & Joseph SW (1994) Applied Engineering in Agriculture
10: 403-405. Cejiz Ö, Hess JB & Bilgili SF (2011) Journal of Applied Poultry Research 20: 554-560. Collett SR (2012) Animal Feed Science and Technology 173: 65-75. Czarick M & Fairchild BD (2012) Poultry Housing Tips 24: 1-3. Czarick M & Fairchild BD (2014) Poultry Housing Tips 26: 1-5. Dann AB (1923) Poultry Science 3: 15-19. de Jong IC, Gunnink H & van Harn J (2014) The Journal of Applied Poultry Research 23:
51-58. DEFRA (2002) Code of recommendations for the welfare of livestock: Meat chickens and
breeding chickens. Department for Environment, Food and Rural Affairs. DEFRA (2013) Keeping farmed animals – guidance — Poultry Farming: welfare
regulations. Department for Environment, Food and Rural Affairs. Dunlop M (2014) Proceedings of the PIX2014 Litter Management Workshop pp. 25-34 Dunlop MW, Blackall PJ & Stuetz RM (2015) Science of The Total Environment 538: 979-
985. El-Wahab AA, Visscher CF, Beineke A, Beyerbach M & Kamphues J (2012) Arch.Geflügelk
76: 55-62. Eriksson De Rezende CL, Mallinson ET, Tablante NL, Morales R, Park A, Carr LE & Joseph
SW (2001) Journal of Applied Poultry Research 10: 245-251. Ferreira F (2015) Poultry Digest 30: 28-30. Fontana AJ (2007) Minimum Water Activity Limits for Growth of Microorganisms, In:
‘Water Activity in Foods: Fundamentals and Applications’ (Eds. Barbosa-Cánovas G, Fontana Jr AJ, Schmidt SJ & Labuza TP) pp. 405.
Hayes JR, Carr LE, Mallinson ET, Douglass LW & Joseph, SW (2000) Poultry Science 79: 1557-1561.
Lister SA (2009) Proceedings of the 17th European Symposium on Poultry Nutrition. World Poultry Science Association (WPSA).
Payne CG (1967) British Poultry Science 8: 101-118. Roudaut G (2007) Water activity and physical stability, In: ‘Water Activity in Foods:
Fundamentals and Applications’ (Eds. Barbosa-Cánovas G, Fontana Jr AJ, Schmidt SJ & Labuza TP) pp. 199-213.
RSPCA (2013) Meat Chickens: RSPCA approved farming scheme standards. Taoukis PS & Richardson M (2007) Principles of intermediate-moisture foods and related
technology, In: ‘Water Activity in Foods: Fundamentals and Applications’ (Eds. Barbosa-Cánovas G, Fontana Jr AJ, Schmidt SJ & Labuza TP) pp. 273-312.
Tucker SA & Walker AW (1992) Hock burn in broilers, In: Recent Advances in Animal Nutrition (Eds. Garnsworthy PC, Haresign W & Cole DJA) pp. 33-50.
van der Hoeven-Hangoor E, Rademaker CJ, Paton ND, Verstegen MWA. & Hendriks WH (2014) Poultry Science 93: 1782-1792.
Weaver WD & Meijerhof R (1991) Poultry Science 70: 746-755.
Aust. Poult. Sci. Symp. 2016.....27
28

NUTRIENT LOADING ON FREE RANGE LAYER FARMS
M. SINGH1,2, I. RUHNKE3, C.T. DE KONING4, K. DRAKE4 and A. SKERMAN5 A considerable proportion of the dietary nutrients consumed by poultry are excreted in the manure. This becomes an important issue on free range farms, if manure and/or nutrients are not removed periodically from the range areas. The nutrients and trace elements in manure can accumulate in the soil and become toxic to vegetation, while also causing pollution of ground and surface water through leaching. Soil samples were collected from fourteen free range layer farms both on the range and control areas (with no exposure to poultry) to investigate comparative soil nutrient concentrations. Nutrient concentrations were also compared between fixed and rotational ranges and between farms having different bird densities. At each site, soil was collected from 10 sampling points, arranged diagonally in a grid across both the range and control areas. A sampling probe was used to collect soil from the top 10 cm depth. These were submitted for a standardised lab analysis (Apal Agricultural Laboratory, SA, Australia). Data was subjected to analysis of variance and means considered significant at P < 0.05.
Table 1 - Nutrient concentrations on range and control areas and fixed and rotational range areas as determined by soil analysis on 14 free range layer farms.
ECEC^ pH 1:5 Water
pH 1:5 CaCl2
NO3-
-N NH4+-N
Colwell - P
Colwell- K KCl- S Ca Mg Na
Desired level
12-25 6.0-7.0 5.5-6.5 10 - 50 - 20 - 25 140 - 170 10 - 20 800 - 1000 150 - 200 < 120
Control 12.0 6.6 5.9 12.4 14.0 56.9 371.1 7.2 1584.6 312.6 84.1 Range 14.9 6.8 6.1 51.5 39.1 85.4 354.7 13.7 2047.9 345.0 175.3 SEM 2.6 0.2 0.3 13.3 8.2 25.0 75.3 2.3 376.8 80.8 61.3
P-Value NS NS NS * * NS NS * * NS NS Fixed 16.6 7.1 6.4 34.9 25.5 82.9 380.3 10.8 2352.8 368.6 133.9
Rotational 9.2 6.2 5.4 28.1 27.8 55.5 339.7 9.7 1100.9 275.8 60.2 SEM 2.4 0.2 0.2 13.4 8.4 23.4 70.2 2.5 334.5 76.5 45.5
P-Value * ** ** NS NS NS NS NS ** NS NS ^Effective Cation Exchange Capacity (ECEC) measured in c.mol/kg and all other nutrients as ppm. *( P < 0.05), **( P < 0.01)
The soil nutrient concentrations in range areas were well above the levels required for normal crop/pasture nutrition. Concentrations of N, Ca and S were significantly high (P < 0.05) in the range as compared to control areas. Soil samples from fixed ranges showed significantly higher concentrations of Ca (P < 0.01) and were significantly more alkaline (P < 0.01) than in rotational ranges, probably due to constant deposition of manure and lack of any rotational cropping program to remove nutrients from the soil. Bird density was not found to be a significant factor for soil nutrient concentrations in range areas. The percentage of birds using the range and the percentage of the range being used by birds may be more important variables than density, for nutrient loading. The highly elevated concentrations indicate increased risk of off-site export of nutrients, in runoff, or by leaching into groundwater, potentially contaminating surface and groundwater resources. The potential impacts of nutrient export should be evaluated across a wide range of Australian climatic conditions and soil types, to assist in developing design and management practices. Failure to mitigate adverse environmental impacts may threaten the long-term sustainability and social acceptance of free range production systems.
1 Poultry Research Foundation, Faculty of Veterinary Science, The University of Sydney, Camden, NSW 2570; [email protected]
2 Poultry Cooperative Research Centre, University of New England, Armidale, NSW 2351. 3 Animal Science, School of Environmental and Rural Science, University of New England, NSW 2351. 4 South Australian Research and Development Institute, Roseworthy Campus, University of Adelaide,
Roseworthy, SA 5371. 5 Department of Agriculture and Fisheries, Toowoomba, QLD 4350.
Aust. Poult. Sci. Symp. 2016.....27
29

POULTRY LITTER PASTEURISATION - PRINCIPLES
S.W. WALKDEN-BROWN1, A.F.M.F. ISLAM1, Y.C.S.M. LAURENSON1, M. DUNLOP2 and B.A. WELLS3
Summary
Heaping of used poultry litter reliably induces significant elevations in temperature due to the actions of variety of aerobic bacteria and fungi. Temperatures typically rise to over 50˚C in 1-4 days and may peak at more than 60˚C. These temperatures are sufficient to reduce or eliminate a range of pathogens giving rise to the term ’pasteurisation’. A common target for litter pasteurisation is heating to 55˚C for a minimum of 3 days. Factors influencing heating potential include carbon to nitrogen ratio, moisture content, oxygen availability and to a lesser extent pH. This paper summarises the key underlying principles and factors influencing litter pasteurisation while a companion paper deals with practices to optimise it.
I. INTRODUCTION The provision of bedding material and disposal of spent litter pose large economic and social challenges to the chicken meat industry. Consequently, the practice of reusing litter across successive batches of chickens is widespread in the USA, where the estimated mean interval between full litter cleanouts is 1-2 years (Malone and Marsh Johnson 2011). In Australia, estimates of 2% (East 2007) to 30% (Runge et al. 2007) of chickens are reared on previously used litter. To limit pathogen transfer, used litter may be heaped for varying periods between grow-outs, allowing natural composting processes to generate sufficient heat and ammonia to reduce pathogen load. Hence, the term ‘pasteurisation’ is used to describe this process as its broadest definition describes a process of partial sterilisation using heat, although this process may not meet the narrow definitions applied to food. This paper provides an overview of the basic principles underpinning litter pasteurisation and factors influencing it, while a companion paper will outline management practices to optimise the pasteurisation process.
II. MICROBIAL BASIS FOR GENERATING PASTEURISING TEMPERATURES Pasteurising heats of 50˚C and above obtained in heaped poultry litter are due largely to aerobic microbial activity. Aerobic oxidation of carbon substrates releases large amounts of heat, water and CO2 while anaerobic fermentation yields much less energy and CO2 and large amounts of energy rich methane (Haug 1993). Aerobic oxidation of glucose produces 677 kcal/mol of energy while anaerobic oxidation produces only 96 kcal/mol of energy. Putrefactive odours are a common by-product bacteria of anoxic and anaerobic composting with sulphur and nitrogen acting as electron acceptors rather oxygen.
At an early phase of the composting process (between 20-40°C) the dominant active degraders of organic material are mesophilic/thermotolerant fungi (principally yeasts and moulds) and acid producing bacteria (Beffa et al. 1996). Thermophilic fungi usually appear after 5 to 10 days followed by actinomycetes. Mesophilic microorganisms are killed or inactivated during the initial thermogenic stage (between 40-60°C). The optimal temperature for thermophilic fungi is 40-55°C, with a maximum at 60-62°C. Thermophilic actinomycetes are more tolerant than fungi to high temperatures but at temperatures above 60°C their
1 Animal Science, University of New England; [email protected] 2 Department of Agriculture and Fisheries, Queensland Government; [email protected] 3 Wells Avian Consultancy, 33 Moores Rd, Glenorie, NSW 2157; [email protected]
Aust. Poult. Sci. Symp. 2016.....27
30

number and species diversity decreases, and their importance in the degradation process becomes negligible. Thermophilic bacteria are very active at 50-60°C, and at temperatures above 60°C the degradation process is essentially performed by these microorganisms.
III. TARGET TEMPERATURES AND DURATIONS Heat inactivation of pathogens relies on complex time-temperature relationships (Haug 1993). Higher temperatures require shorter periods to cause inactivation. Moist heat and higher levels of hydration are more effective than dry heat. Parasites and their eggs are inactivated more readily than bacteria, which in turn are inactivated more readily than viruses, although there is wide variation and overlap. Heat in the temperature range achieved during thermophilic litter composting is a potentially effective means of inactivating many pathogens including viruses, bacteria, fungi, protozoa and metazoan parasites. Exceptions include prions, bacterial spores, some helminth eggs and certain protozoal cysts. In general, vegetative bacteria are destroyed after 5-10 min at 60-70˚C and pasteurisation at 70˚C for 30 minutes destroys most pathogens (including viruses) found in sewage sludge (Haug 1993).
Temperature acts primarily by denaturing proteins. Irreversible protein cross-linking and coagulation is solvent dependent, requiring higher temperatures as material becomes more desiccated. This likely explains both the greater efficacy of moist heat over dry heat and the extended survival of very resistant life forms such as spores, lyophilized virus etc. Viruses are inactivated by a) the breakdown of hydrogen bonds and consequent collapse of the secondary structure of DNA or protein capsid (DNA viruses) or b) a break or change in the nucleic acid chain at a single point (mainly RNA viruses) (Woese 1960).
Regarding bacterial inactivation, the thermophilic temperatures achieved during litter composting are well above the thermal death points of mesophilic pathogens, such as E. coli and Salmonella spp. (Chen and Jiang 2014). In several studies enteric bacteria such as Salmonella spp., E. coli, Campylobacter spp., vegetative Clostridum perfringens and Listeria monocytogenes were reduced to undetectable levels by poultry litter composting (Kwak et al. 2005; Macklin et al. 2008; Silva et al. 2009). The mortality of pathogens during composting is not uniform throughout the litter heap, with many studies reporting the persistence of pathogens at the surface of fresh compost (Chen and Jiang 2014). Regrowth of bacterial pathogens due to recontamination is a risk for open-air composting environments, but this is not a major risk for short-term litter pasteurisation in sheds.
In regards to virus inactivation, Newcastle disease virus and avian influenza virus in chicken faeces, feed and litter (in porous nylon bags) were inactivated by day 3 in composting litter (Guan et al. 2009). Infectious laryngotracheitis virus was reduced to undetectable levels by normal litter composting for 5 days or heating at 38˚C for 48 hours (Giambrone et al. 2008). Walkden-Brown et al. (2010) reported that Fowl Adenovirus type 8 was largely inactivated in litter after 6–7 days of litter pasteurisation while chicken anaemia virus and infectious bursal disease virus were largely inactivated after 6-10 days. Marek’s disease virus retained significant infectivity at days 9–10. There was little evidence of any litter transmission of infectious bronchitis virus or vaccinal Newcastle disease virus at all. Coccidial oocysts are inactivated after 3 days of pasteurisation (Walkden-Brown et al. 2010).
Given this information, the identification of suitable target temperatures and durations for litter pasteurisation is a challenge. The most common target is heating to 55˚C for 3 days derived largely from guidelines provided in USA and Australian regulations relating to the inactivation of pathogens in sewage sludges and composts. These regulations are summarised below but it should be emphasised that they are not directed at litter pasteurisation, and are generally impractical to apply in full in the short periods available between chicken batches.
USA – Environmental Protection Agency (EPA). In its Part 503 Biosolids Rule the
Aust. Poult. Sci. Symp. 2016.....27
31

EPA differentiates between Class A and Class B treated sludges (EPA 2012). If pathogens (Salmonella sp. bacteria, enteric viruses, and viable helminth ova) are below detectable levels, the biosolids meet the Class A designation. Biosolids are designated Class B if pathogens are detectable but have been reduced to levels that do not pose a threat to public health and the environment as long as actions are taken to prevent exposure to the biosolids after their use or disposal. To meet Class A and B conditions using composting the following requirements must be met (EPA 2012): • Class A. Using either the within-vessel composting method or the static aerated pile
composting method the temperature of the biosolids is maintained at 55˚C or higher for 3 days. Using the windrow composting method, the temperature of the biosolids is maintained at 55°C or higher for 15 days or longer. During the period when the compost is maintained at 55°C or higher, the windrow is turned a minimum of five times.
• Class B. Using the within-vessel, static aerated pile, or windrow composting methods, the temperature of the biosolids is raised to 40˚C or higher and maintained for 5 days. For 4 hours during the 5-day period, the temperature in the compost pile exceeds 55°C.
Australia – Standards Australia. Clause 3.2.la) of the AS4454 Australian Standard on Compost and Produce Standards in Australia (Standards Australia 2012). This standard specifies the following process criteria for pasteurisation on the basis of all material being subjected to sufficiently high temperature for a sufficient duration to cause thermal death: • Appropriate turning of outer material to the inside of the compost pile/windrow so the
whole mass is subjected to a minimum of three turns with the internal temperature reaching a minimum of 55˚C for three consecutive days before each turn
• Where higher risk materials are included in the compost feedstock (including manures, animal waste, food or grease trap wastes) the core temperature of the compost mass shall be maintained at 55˚C or higher for a period of 15 days or longer; and during this period of high temperature the compost pile/windrow shall be turned a minimum of five times.
IV. FACTORS INFLUENCING THE PASTEURISATION PROCESS
A carbon to nitrogen ratio (C:N) between 15 and 30 is recommended. Above 30 microbial growth is impaired. Below 15, high temperatures are achieved but nitrogen is in excess and given off as ammonia. Broiler litter typically has a C:N of 10-15 and this ratio reduces with increased litter reuse. Adding a high C-low N source will reduce ammonia emissions.
The optimum moisture content for compostable material is between 40 and 60%. Excessive moisture limits porosity and oxygen availability and insufficient moisture inhibits microbial growth. Used poultry litter typically has a dry matter content of 20-35%. Our research in Australia has shown variable temperature responses for moisture addition to litter, with significant temperature responses only seen in very dry litter (<20% moisture content) (Walkden-Brown et al. 2015). In the USA the on-farm impact of moisture addition to litter with an initial moisture content of 25-26% did not produce the expected increase in temperature and created later issues with ammonia production, wet litter and caking (Lavergne et al. 2006). Excessive ammonia production following the addition of water to litter (to create 28-34% moisture content) has also been observed in Australia (Walkden-Brown et al. 2015). As such, a potential relationship exists between the C:N ratio and moisture content of litter leading to excessive ammonia production and the consequent inhibition of thermophilic bacteria.
Pasteurisation is largely an aerobic process and oxygen can become limiting if particle size is small and porosity poor, or if moisture content is too high. Compression in large heaps will reduce porosity and oxygen availability deep in the heap. Turning increases oxygen availability but cools the heap producing a saw-tooth like temperature profile.
Aust. Poult. Sci. Symp. 2016.....27
32

Compost microorganisms operate best under neutral to acidic conditions, with pH in the range of 5.5 to 8 although pH up to 9 supports adequate microbial composting. Composting litter tends to be slightly alkaline (pH > 8) and to acidify slightly during the process. Ammonia production increases rapidly as pH increases above 8. The composting process is somewhat self-buffering and deliberate modification of pH is rarely justified.
V. DISCUSSION
The major factors affecting the temperatures generated in heaped litter are the C:N ratio and the availability of oxygen and moisture. These can be manipulated in practical ways to optimise temperature outcomes in the brief time usually available to pasteurise litter between batches of chickens (Walkden-Brown et al., 2016). ACKNOWLEDGEMENTS: This work was conducted within the Poultry CRC, established and supported under the Australian Government’s Cooperative Research Centres program. Yan Laurenson is the recipient of a University of New England postdoctoral fellowship.
REFERENCES Beffa T, Blanc M, Marilley L, Fischer JL, Lyon P-F & Aragno M (1996) In: 'The Science of
Composting' (Springer) pp. 149-161.. Chen Z & Jiang X (2014) Agriculture 4: 1-29. East IJ (2007) Australian Veterinary Journal 85: 107-112. EPA (2012) Guide to the EPA Part 503 Biosolids Rule (United States Environmental
Protection Agency). Giambrone JJ, Fagbohun O & Macklin KS (2008) Journal of Applied Poultry Research 17:
64-68. Guan J, Chan M, Grenier C, Wilkie DC, Brooks BW & Spencer JL (2009) Avian Diseases
53: 26-33. Haug RT (1993) In: 'The Practical Handbook of Compost Engineering’ (Lewis, Boca Raton)
pp. 161-203. Kwak WS, Huh JW & McCaskey TA (2005) Bioresource Technology 96: 1529-1536. Lavergne TK, Stephens MF, Schellinger D & Carney WA (2006) Louisiana State University
Agricultural Centre Publication 2955 Macklin KS, Hess JB & Bilgili SF (2008) Journal of Applied Poultry Research 17: 121-127. Malone G & Marsh Johnson T (2011). In: 'A Practical Guide for Managing Risk In Poultry
Production' (American Association of Avian Pathologists, Inc) pp. 146-180. Runge GA, Blackall PJ & Casey KD (2007) Final Report for Project WS990-19 (RIRDC,
Barton, ACT). Silva ME, Lemos LT, Cunha-Queda AC & Nunes OC (2009) Waste Management &
Research 27: 119-128. Standards Australia (2012) AS 4454-2012 74, Standards Australia, Sydney, Australia. Walkden-Brown SW, Islam AFMF, Dunlop M &, Wells B (2010) Final Report of Poultry
CRC Project 06-15 (Australian Poultry CRC, Armidale). Walkden-Brown SW, Islam AFMF, Laurenson YCSM, Hunt PW & Dunlop M (2015) Final
Report of Project 2.2.3 (Australian Poultry CRC, Armidale). Walkden-Brown SW, Laurenson YCSM, Islam AFMF, Dunlop M & Wells BA (2016)
Proceedings of the Australian Poultry Science Symposium 27: (these proceedings). Woese C (1960) Annals of the New York Academy of Sciences 81: 741-750.
Aust. Poult. Sci. Symp. 2016.....27
33

LITTERHEATMAP: A DECISION SUPPORT TOOL FOR PREDICTING TEMPERATURE IN POULTRY LITTER HEAPED FOR PASTEURISATION
Y.C.S.M. LAURENSON1, A.F. ISLAM1, M. DUNLOP2, M.D. CRESSMAN3
and S.W. WALKDEN-BROWN1
Summary Litter pasteurisation through the partial composting of meat chicken (broiler) litter reduces pathogen carryover between grow-outs. Pathogen inactivation is primarily via the effects of temperature; however, our understanding of factors affecting the temperature profile of composting heaps is incomplete. Temperature profiles at differing depths within heaps subjected to a wide range of treatments on different farms were used to construct a mathematical model empirically describing the impact of ambient temperature, heap dimension, initial moisture content, covering and turning on temperatures within a composting heap. This model was incorporated into an Excel® workbook with an appropriate user-interface and customised inputs and outputs to create a decision support tool to assist with the appropriate design of litter pasteurisation practices.
I. INTRODUCTION The Australian chicken meat industry incurs large financial and logistical costs involved in the supply of bedding material and disposal of spent litter (Runge et al., 2007), which could be reduced as much as 50% by re-using litter (Coufal et al., 2006). However, in Australia only a small proportion of chickens are reared on previously used litter, with estimates ranging from 2% (East, 2007) to 30% (Runge et al., 2007), due to concerns with the carryover of poultry pathogens (Groves, 2002). Under Australian conditions the most practical means of reducing the pathogen load in litter is through the partial composting of litter in static heaps or windrows (litter pasteurisation) between grow-outs. Pathogen inactivation during composting is primarily due to the effects of temperature (Bohm, 2007). Our understanding of how various factors influence the temperature profiles within heaps is incomplete although factors such as moisture content and covering (Lavergne et al., 2006; Macklin et al., 2006) have been shown to influence temperatures. As such on farm experimental data from three large studies (Walkden-Brown et al., 2010; Cressman, 2014; Walkden-Brown et al., 2015) were analysed to empirically model the temperature profiles of composting litter taking into account composting duration, ambient temperature, heap/windrow dimensions, initial moisture content, tarpaulin covering and litter turning. The resultant model was incorporated into an Excel® workbook with an appropriate user-interface to create a decision support tool for predicting temperature in broiler litter heaped for pasteurisation and provide user-defined summary outputs. It is hoped that this will aid in ensuring appropriate design of litter pasteurisation practices in the Australian chicken meat industry.
II. EXPERIMENTAL DATA Temperature was measured at 15 to 60 minute intervals for seven to ten days using iButton® DS1921 data loggers (Evolution Education Ltd, Bath, UK) inserted into litter heaps. These
1 Animal Science, University of New England; [email protected] 2 Department of Agriculture and Fisheries, Queensland Government; [email protected] 3 College of Food, Agriculture and Environmental Sciences, Ohio State University, USA;
Aust. Poult. Sci. Symp. 2016.....27
34

included measurements of the ambient shed temperature and at depths of 0, 5, 10, 20, 25, 50, 75 and 100cm relative to the surface of the heap. The final dataset comprised 375 temperature profiles from 69 used litter heaps on eight farms in New South Wales and Queensland (65,148 hourly temperature measurements). The 69 pine shaving heaps had varying dimensions ranging from a height of 0.65m to 2.3m, a base width of 0.95m to 6m and a base length of 1.6m to 149m. Further, the 69 heaps were subject to a variety of treatments including the use of tarpaulin covers and litter turning. Tarpaulin covering and turning of heaps were investigated as binary traits (Yes or No), however, the timing of turning ranged from 58 to 94 hours following the start of composting.
The initial moisture content was measured by sampling 200 to 300g of litter from each heap. These samples were placed in aluminium foil trays, weighed and then placed in a drying oven at 100°C for 24 hours. Following removal from the oven, the samples were allowed to cool and then weighed again. Initial moisture content was calculated as the difference between wet and dry weight and expressed as a percentage. The initial moisture content of the 69 heaps ranged from 12.8 to 40.4%.
III. MATHEMATICAL MODEL Ambient temperature was modelled as a continuous profile such that the user could specify input values for the maximum and minimum temperature (°C), the time of the maximum and minimum temperatures (24 hour clock), and the time at which composting starts (24 hour clock). The ambient temperature was validated by comparison to shed temperatures recorded at three of the eight farms, providing r2 = 0.93 and standard error (SE) = 1.7°C (relative SE = 9%).
A mathematical model was constructed to predict temperature (°C) according to depth from heap surface (cm), time (hours), initial moisture content (%) and ambient temperature (°C) in heaps subjected to practices such as tarpaulin covering and litter turning. The available experimental data was divided into two datasets, for model construction and validation, ensuring an even distribution of experimental variables (heap dimensions, initial moisture content, ambient temperature, covering and turning) within both datasets. The mathematical model was constructed and parameterised by empirically describing ~71.5% of the available experimental data (50 heaps, 260 temperature profiles and 46,499 individual hourly temperature measurements). This was achieved by minimising the residual sum of squares for model parameterisation and utilising the corrected Akiake’s information criterion to reduce model complexity. As such, the final model was determined to be the sum of the ambient temperature, two logistic growth curves and a logistic decay function, providing R2 = 0.86 and SE = 4.1°C (relative SE = 8%) to the data used for model construction and parameterisation. The mathematical model was consequently validated using the remaining ~28.5% of the experimental data (19 heaps, 115 temperature profiles and 18,649 individual hourly temperature measurements), providing r2 = 0.82 and SE = 3.9°C (relative SE = 7%).
The heap/windrow was modelled as a truncated paraboloid, such that the user could specify input values for height, base width and base length (cm). This allowed for the estimation of heap volume and surface area. Heap volume calculations were validated against 12 heaps with known dimensions and volume (based on shed area and litter depth) providing r2 = 0.96.
The model predicting temperature (°C) according to depth from heap surface (cm), time (hours), initial moisture content (%), ambient temperature (°C), tarpaulin covering and litter turning was combined with the model describing the shape of the heap. This created a three-dimensional heat map with a resolution of 1cm3.
Aust. Poult. Sci. Symp. 2016.....27
35

IV. DECISION SUPPORT TOOL The decision support tool comprises three visible worksheets in a Microsoft Excel® workbook. These include an information/instructions page, an input page and a results page. It is anticipated that the model will be made freely available on the Poultry Hub web site. The information page provides statements regarding the purpose, development, inputs, outputs, acknowledgements of contribution and funding, and the acknowledgement requirements for use of the decision support tool. Further, an instructions section is provided to aid the end-user in running the decision support tool.
The input page allows the end-user to define the duration of composting, ambient temperature, heap dimensions, initial moisture content, use of a tarpaulin cover and litter turning (including turn timing). Further, the user can provide specifications for the summarisation of outputs. These include the time (from the start of composting) for the provision of a parabolic cross-section of the heat map, temperature and duration thresholds for the calculation of heap percentages reaching these values, and three depths (from the heap surface) for the provision of temperature profiles.
The results page provides predictions for the minimum, mean and maximum temperatures within the heap over time. Further, user defined outputs are provided which include a parabolic cross-section of the heat map at the specified time from the start of composting, the percentage of the heap greater than the specified temperature over time, the final percentage of the heap greater than the specified temperature for the specified duration, and temperature profiles at the three specified depths within the heap. To compare the effect of varying input values, multiple simulations can be run and the outputs saved as a PDF file. Further, the results page contains a summary of the input values for comparison. An example of the results page output is given in Figure 1.
V. DISCUSSION The mathematical model underlying the decision support tool reliably predicts the temperature profile within a composting litter heap and the impact of factors including composting duration, ambient temperature, heap/windrow dimensions, initial moisture content, tarpaulin covering and litter turning. The remaining variation between observed and predicted temperature, evidenced by a relative SE of ~8%, may be due to sampling errors or factors not currently included within the model. Sampling errors may include incorrect depth placement or movement of iButtons due to the heap subsidence. Other factors not currently accounted for include the impact of aeration, litter particle size and pH.
This decision support tool, together with the guidelines proposed by Walkden-Brown et al. (2015), may be used to optimise the design of litter pasteurisation practices in the Australian chicken meat industry. For example, the model can predict the best pasteurising approach for a given turnaround time between depopulation and chick placement.
Future work includes the definition of temperature-time relationships for the inactivation of key poultry pathogens. These relationships could be linked to the current decision support tool to ensure that standard operating procedures for between batch litter composting reduces pathogen loads to acceptable levels.
ACKNOWLEDGEMENTS: This work was conducted within the Poultry CRC, established and supported under the Australian Government’s Cooperative Research Centres program. Yan Laurenson is the recipient of a University of New England postdoctoral fellowship.
Aust. Poult. Sci. Symp. 2016.....27
36

Figure 1 – Example of decision support tool result page.
REFERENCES Bohm R (2007) Waste Management Series 8: 177-200. Coufal CD, Chavez C, Niemeyer PR & Carey JB (2006) Poultry Science 85: 398-403. Cressman MD (2014) PhD thesis. (Ohio State University, USA). East IJ (2007) Australian Veterinary Journal 85: 107-112. Groves PJ (2002) Proceedings of the Poultry Information Exchange pp.107-110. Lavergne TK, Stephens MF, Schellinger D & Carney WA (2006) www.lsuagcenter.com Macklin KS, Hess JB, Bilgili SF & Norton RA (2006) Journal of Applied Poultry Research
15: 531-537. Runge GA, Blackall PJ & Casey KD (2007) Final Report for Project WS990-19 (RIRDC,
Barton, ACT). Walkden-Brown SW, Islam AFMF, Dunlop M & Wells B (2010) Final Report for Project
06-15 (Australian Poultry CRC, Armidale, NSW). Walkden-Brown SW, Islam AFMF, Laurenson YCSM, Hunt PW & Dunlop M (2015) Final
Report for Project 2.2.3 (Poultry CRC, Armidale, NSW).
Maximum % of Heap/Windrow >= 55°C at any time-point :Final % of Heap/Windrow >= 55°C for 20 hours :
17.81%14.99%
% of Heap/WindrowSummary of Cross-sectional Heat Map at 48 hours
Temperature (°C)
4.64%0.00%1.24%
15 to 2020 to 2525 to 30
14.07%23.65%43.70%
30 to 3535 to 4040 to 45
11.53%0.00%0.00%
45 to 5050 to 5555 to 60
< 55 to 10
10 to 15
0.00%0.00%0.00%
60 to 65> 65
0.00%0.00%
Input Summary Heap/Windrow DimensionHeight = 100cmBase Width = 200cm
Base Length = 400cm
Initial Water Content = 20.5%15:00 Cover = No6:00 Turn = Yes occuring at 76 hours
Shed Air TemperatureMax = 25°C occuring at
Min = 15°C occuring at
Start time = 8:00Duration = 96 hours
Aust. Poult. Sci. Symp. 2016.....27
37

POULTRY LITTER PASTEURISATION – PRACTICES AND PROCEDURES
S.W. WALKDEN-BROWN1, Y.C.S.M. LAURENSON
1, A.F.M.F. ISLAM
1, M. DUNLOP
2
and B.A. WELLS3,
Summary
Heaping of used poultry litter produces elevations in temperature that lead to a significant
reductions in pathogen load, analogous to pasteurisation. The speed and degree of heating
varies with depth in the heap and with a range of factors that can be influenced by
management. These include heap size, moisture content, turning and covering. In broad terms
smaller heaps heat more quickly and are more appropriate for shorter pasteurisation periods.
Turning of heaps is only beneficial for pasteurisation periods of longer than 7 days and
potentially detrimental for periods of 6 days or shorter. On the other hand the benefits of
covering heaps are reduced with longer pasteurisation periods. Addition of moisture is rarely
needed and never required if covers are used. This paper summarises the effects and
interactions between these practices and concludes with a brief suggested operating
procedure.
I. INTRODUCTION
In a companion paper in these proceedings we summarised the main principles underpinning
litter pasteurisation by heaping and partial composting (Walkden-Brown et al. 2016). This
practice can reduce pathogen carryover between batches of chickens on reused litter. The aim
of this paper is to review management practices that influence litter pasteurisation and
develop a set of operating guidelines or procedures that will result in optimal outcomes for
the given situation.
II. LITTER PASTEURISATION PRACTICES
a) Caked litter removal (de-caking)
Litter cake is typically removed to reduce moisture content and condition litter. Removing
cake is also likely to improve the carbon to nitrogen ratio (C:N) by increasing it. Cake
removal is best completed before heaping. Our research has shown that pasteurisation for 7
days had no effect on reducing the size of cake pieces (Walkden-Brown et al. 2015) so it
cannot be used to break cake down.
b) Heap size and dimensions
Long windrows are generally easier to create than very large heaps, and smaller heaps or
windrows tend to heat more quickly as the core of large heaps (2 m or more in height) may be
still increasing in temperature after 10 days (Walkden-Brown et al. 2010). In the USA the
recommended optimum pile size using windrowing equipment is 45-60 cm (18 to 24 inches)
high and conical in shape (Malone and Marsh Johnson 2011). Using the LitterHeatMap
model developed using a large Australian dataset (Laurenson et al. 2016) it is indicated that
the optimum height increases with the proposed duration of the pasteurisation (Figure 1, Left)
1 Animal Science, University of New England; [email protected] 2 Department of Agriculture and Fisheries, Queensland Government; [email protected] 3 Wells Avian Consultancy, 33 Moores Rd, Glenorie, NSW 2157; [email protected]
Aust. Poult. Sci. Symp. 2016.....27
38

c) Duration of pasteurisation
Longer periods, particularly with turning, enable more of the heap to achieve sustained
pasteurising temperatures. In the USA a minimum of 7 days actual pasteurisation time in a 14
day turnaround time is suggested with 2 days for heap forming, a turn at days 5-6, spreading
of litter on days 9-10, application of litter treatments on days 12-13 and chick placement from
day 14 (Malone and Marsh Johnson 2011). The results of our studies revealed interactions
between pasteurisation duration, turning and covering (Figure 1, Right). This showed benefits
of covers but these diminish with increasing duration, whereas turning only becomes
beneficial at durations of about 7 days or longer.
d) Turning of litter to improve aeration and mix layers
Long composting cycles typically involve turning to aerate the core and to mix in the cooler
drier outer layers to produce a more uniform product. The benefits of turning for shorter litter
pasteurisation periods are less clear. Early Poultry CRC research showed that over a 9-day
pasteurisation, turning large heaps (height 2.5-2.8 m) at day 3 resulted in a sustained increase
in mean temperature following turning whereas there was no benefit in turning smaller
windrows (height 0.8-1.2 m) (Walkden-Brown et al. 2010). More recent work over a 7-day
pasteurisation period has shown that turning of litter on day 3 led to a significant reduction in
temperature on the day after turning, with a rebound increase resulting in higher temperatures
on days 6 and 7 with the two effects cancelling themselves out (Walkden-Brown et al. 2015).
The imperative of mixing to ensure more uniform exposure to pasteurising temperatures was
also reduced because time spent at 55˚C or higher was significantly greater at a depth of 5 cm
from the surface than at 100 cm deep over a 7-day pasteurisation period in heaps of a wide
range of sizes. This indicates that the cool surface ‘rind’ on pasteurised litter heaps is thin. As
noted above, modelling of the full heap thermal profile suggests that in uncovered heaps,
turning is only beneficial if duration is greater than 7 days.
Figure 1 - LitterHeatMap (Laurenson et al. 2016) outputs providing the maximum percentage of the heap
reaching ≥55°C for 3 days. Left: Optimum heap height (cm) vs. duration of litter pasteurisation
(Max ambient temperature 25°C, min 15°C, initial moisture content = 25%, No cover, No turn).
Right: Effects of a tarpaulin cover and turning on day 3 (Max ambient temperature 25°C, min 15°C,
initial moisture content = 25%, heap height = 100cm, heap width = 200cm, heap length = 400cm).
e) Covering heaps with tarpaulins
In three on-farm studies overall benefits of covering on temperatures were only observed
under conditions when litter was very dry, heaps were small, and ambient conditions were
Aust. Poult. Sci. Symp. 2016.....27
39

very cold. Under higher moisture conditions there was no beneficial effect of covering. Under
a wider range of conditions on two other commercial farms, no major benefit of covering was
observed. This contrasts with a single report from the USA in which covering increased
temperatures in heaps of higher moisture content (37-40%) but only following moisture
addition (Macklin et al. 2006). Modelling of the full profile of the heap from the Australian
data show that the benefits of covering are reduced with increasing duration of pasteurisation
(Figure 1, Right) and increased moisture content (Figure 2, Left).
f) Addition of water
Addition of moisture to heaped litter has had variable results in both Australia and the USA
(Lavergne et al. 2006) with negative effects on final litter moisture and subsequent ammonia
production from the pasteurised litter. The one unequivocal improvement observed in our
studies involved very dry litter (16% moisture) in which increasing moisture content to 28%
led to a large increase in average temperatures of 8.9˚C. In covered heaps in the same
experiment no response to additional moisture was observed, demonstrating that the two
effects are not additive (Walkden-Brown et al. 2015). On a commercial farm with large heap
sizes and 2nd
use litter with mean initial moisture content of 18%, there was no clear benefit
from increasing moisture content to 28% or 34%. Adverse effects due to excessive ammonia
were observed in chicks reared on pasteurised litter including that from the high moisture
treatments. On another farm with a range of heap sizes and initial moisture contents ranging
from 13-26˚C the association between initial moisture content and temperatures during
pasteurisation was negative rather than positive. Modelling of the full profile of the heap
from these data predicts some temperature advantages from higher moisture content litter in
uncovered heaps, but no advantage in covered heaps (Figure 2)
Figure 2 - LitterHeatMap outputs showing maximuml percentage of the heap reaching ≥55°C for 3 days given
different initial moisture contents, covering and turning at day 3. Left: Pasteurisation duration of 10
days. Right: Pasteurisation duration of 5 days. (Max ambient temperature 25°C, min 15°C, initial
moisture content = 25%, heap height = 100cm, heap width = 200cm, heap length = 400cm).
III. SUGGESTED OPERATING PROCEDURE
1. Record the disease status of the last placement on the litter to be pasteurised and note any
unusual disease problems encountered. Extend pasteurisation period or opt for full
cleanout and new litter following a major infectious disease problem.
2. Use the LitterHeapMap program (Laurenson et al. 2016, http://www.poultryhub.org) to
optimise pasteurising conditions or follow steps 3 and 4 as an alternative.
Aust. Poult. Sci. Symp. 2016.....27
40

3. Record the period of time available for pasteurisation. Longer times will result in a
greater reduction of pathogens.
a. Heap height: If the time available is 10 days or longer, then heap height is not
limiting and larger heaps can be used (height ~2m), however, if the time available
is less than 10 days then smaller heap heights should be used (Figure 1, Left).
b. Turning: If the time available is longer than 7 days, a turn on day 3 will provide
additional thermal inactivation of pathogens (Figure 1, Right), however, if the
time available is less than 6 days then a turn on day 3 will reduce the inactivation
of pathogens via heap cooling (Figure 1, Left).
4. Estimate the moisture content of the litter to be pasteurised. Use the following
descriptions from (McGahan et al. 2014) as a guide to moisture content: dusty <15%; dry
to friable 15-20%; friable to moist 20-30%; sticky, beginning to cake 30-40%; wet and
sticky, heavy caking 40-50%; and very wet and sticky >50%. If moisture content is very
low (dusty litter), litter is first reuse and external conditions are cold (<15˚C) consider
addition of 5% moisture OR covering the heaped litter to improve pasteurisation. Do not
do both (Figure 2). If the litter is wet and sticky is probably best not to pasteurise or to
implement a stringent ammonia control program following spreading.
5. If possible de-cake the litter and heap or windrow the de-caked litter using available
equipment.
6. Ventilate to remove ammonia and moisture from the heaps and shed, aggressively in
warm weather, less so in cool weather to maintain temperatures in the shed.
7. Use a datalogger or temperature probe to record temperatures at 25 cm depth in the heap
daily. Temperatures should exceed 55˚C on at least 3 of the daily measurements.
8. Spread the litter and ventilate for a minimum of 2 days and ideally 4 days prior to chick
placement. Consider incorporation of an effective litter amendment at this point to reduce
ammonia production during brooding, particularly if the litter is moist (>25% moisture).
9. Pre-heat for 24 hours before brooding to drive off further ammonia and provide a warm
dry insulating surface for the chicks.
ACKNOWLEDGEMENTS: This work was conducted within the Poultry CRC, established
and supported under the Australian Government’s Cooperative Research Centres program.
Yan Laurenson is the recipient of a University of New England postdoctoral fellowship.
REFERENCES
Laurenson YCSM, Islam AFMF, Dunlop M, Cressman MD & Walkden-Brown SW (2016)
Proceedings of the Australian Poultry Science Symposium 27: (these proceedings).
Lavergne TK, Stephens MF, Schellinger D & Carney WA (2006) Louisiana State University
Agricultural Centre Publication 2955
Macklin KS, Hess JB & Bilgili SF (2008) Journal of Applied Poultry Research 17: 121-127.
Malone G & Marsh Johnson T (2011) In: 'A Practical Guide for Managing Risk In Poultry
Production' (American Association of Avian Pathologists, Inc) pp. 146-180.
McGahan E, Bielefeld N, Wiedemann S & Keane O (2014) Final Report of RIRDC Project
No PRJ-005765, Publication No. 14/100 (RIRDC Corporation, Barton ACT 2600).
Walkden-Brown SW, Islam AFMF, Dunlop M & Wells B (2010) Final Report of Poultry
CRC Project 06-15 (Australian Poultry CRC, Armidale).
Walkden-Brown SW, Islam AFMF, Laurenson YCSM, Hunt PW & Dunlop M (2015) Final
Report of Project 2.2.3 (Poultry CRC, Armidale).
Walkden-Brown SW, Islam AFMF, Laurenson YCSM, Dunlop M & Wells BA (2016)
Proceedings of the Australian Poultry Science Symposium 27: (these proceedings).
Aust. Poult. Sci. Symp. 2016.....27
41

EVALUATION OF BIOCHAR, ZEOLITE AND BENTONITE AS FEED ADDITIVES ON EGG YIELD AND QUALITY OF BOND BROWN LAYER
T.P. PRASAI1, K. WALSH1, D. MIDMORE1 and S.P. BHATTARAI1
Summary
A 23 week feeding experiment was conducted to investigate the effects of biochar, zeolite and bentonite feed additives on egg yield and quality of commercial laying hens. These additives may act as detoxifiers, slow digestion and/or alter microbial flora, improving the feed conversion ratio. Bond Brown Layer (BBL) pullets (n=200, 17 weeks old) were randomly assigned to ten dietary treatments involving biochar, zeolite and bentonite at 1, 2, and 4 % supplementation in standard layer feed against a control. Egg yield improved significantly (p=0.022) with addition of feed additives to layer rations. Average egg production per day was improved by use of feed additives, with the differences between feed additive types or rate of different proportions statistically significant (p=0.001) between weeks 26 - 37 of production. Feed conversion ratio was significantly improved (p=0.009) in 1, 2 and 4 % biochar feed additive groups compared to the control and other treatments. External egg quality traits of egg weight (p=0.001), shell percentage (p=0.007) and shell translucency (p=0.036) were significantly different between the treatment groups and control, however, shell weight, shell breaking strength, shell thickness, shell deformation and shell reflectivity were not significantly different. Internal egg quality traits of albumen height Haugh unit were not statistically different whereas yolk colour score (p=0.001) was significantly different between treatment groups and control. Thus, supplementation of commercial layer ration with biochar, zeolite and bentonite can improve egg quality traits and egg production performance. We hypothesise that the improvement in egg yield and quality traits are due to an enhanced gastrointestinal environment, in terms of a beneficial microbial population or absorption of toxins.
I. INTRODUCTION Biochar, zeolite and bentonite can be used as growth promotants and toxin binders in poultry rations. These materials may act as detoxifiers, slow digesta transit, alter microbial populations for positive effects and improve feed conversion ratio (Zeng et al., 2012). Egg yield is the total number of eggs produced per production cycle of a bird whereas egg quality is a common term for a number of values which describe both internal and external quality traits. External quality parameters include shell sanitation, surface and shape. Within these parameters egg weight (g), shell weight (g), shell percentage (%), shell thickness (µm), shell translucency score, shell breaking strength (N), shell deformation (µm) and shell reflectivity (%) are the major components to be measured in an egg quality laboratory. Internal quality parameters include egg albumen purity and viscosity, size of the air cell, yolk outline and yolk strength. Of these internal parameters, albumen height (mm), Haugh unit and yolk colour score are the ones most commonly measured.
Use of biochar as a feed additive in poultry rations resulted in activation of microflora in poultry birds, in terms of increased number of beneficial gastrointestinal tract (GIT) bacteria, improved growth and vitality of birds, and higher egg production (Gerlach & Schmidt, 2012). Natural zeolites are useful in absorption of toxins under in vivo conditions and have properties to absorb the toxins that are detrimental to the growth of animals
1 School of Medical and Applied Science, Central Queensland University, Rockhampton, Australia; [email protected]
Aust. Poult. Sci. Symp. 2016.....27
42

(Goodarzi & Modiri, 2011). Reduction in bacterial contamination of the gut, and the detrimental effects of mycotoxin contaminated diets have been achieved through use of bentonite clay in animal feed (Tauqir & Nawaz, 2001). Although some feeding trials involving substances like biochar, zeolite and bentonite in laying hens have been conducted, the current literature is not comprehensive regarding the egg yield and quality characteristics of commercial laying hens, particularly in relation to different proportions of supplementation of these materials. The objective of this study was to investigate the effects of biochar, zeolite and bentonite supplemented feed on egg quality (external and internal) traits and egg yield performance.
II. MATERIALS AND METHODS All procedures involving animals were approved by the Animal Ethics Committee of the Central Queensland University (Approval number A 12/06-283). The trial was conducted in a screened shed environment with temperature variation from 22.5 to 36.5oC at Central Queensland University, Rockhampton, from May to December 2014. A total of two hundred Bond Brown Layer (BBL) 17 week old pullets were obtained from Bond Enterprises P/L (Grantham, Qld, 4347, Australia). The treatments involved a control ration supplemented with biochar, zeolite or bentonite at 1, 2, and 4 % w/w. The pullets were randomly allotted among the ten dietary treatment groups. Each dietary treatment was replicated four times and each replicate had five birds, a total of 20 birds for each treatment. Trial feed formulation was adjusted to maintain the same level of major nutrients, metabolisable energy, crude protein, calcium, and essential amino acids as the standard commercial ration. Birds were maintained in cages (each cage size 60 cm×60 cm×50 cm) with ad libitum water and feed supply.
Egg yield and performance traits data were collected daily for weeks 26 - 37 of bird age and live body weights were measured weekly. At 32 weeks of age, a total of 24 eggs from each dietary treatment (six eggs from each replicate) were randomly collected and despatched to the Egg Quality Laboratory at the University of New England, Armidale, Australia. All measurements were made using egg quality equipment from Technical Services and Supplies (TSS), U.K. Eggs were scored for translucency (0 lowest - 5 highest) using an egg candler and analysed for egg shell quality measurements: shell colour by reflectivity, egg weight, egg shell breaking strength by quasi-static compression, shell deformation to breaking point and shell weight. Shell thickness was measured using a custom-made gauge based on a Mitutoyo Dial Comparator gauge (Model 2109-10). Percentage shell was calculated from shell weight and egg weight. Egg internal quality was measured as albumen height, Haugh Units and yolk colour (TSS equipment). A nested analysis of variance (ANOVA) was used for analysis of data related to growth, egg yield and quality. GenStat version 16.1 software package was used for all statistical analysis. All the means were compared by using a nested ANOVA with Duncan Multiple Range statistical test.
III. RESULTS The feed additive treatments were associated with significant increases in egg yield (p=0.022), egg weight (p=0.012), percent egg production per day (p=0.001) and egg mass (p=0.021) compared to the control treatment (Table 1). Feed intake (p=0.001) and feed conversion ratio (FCR) (p=0.009) were significantly reduced in all feed additive treatments compared to the control group, while there was no difference in survivability rate (p=0.621) among the experimental groups. There were no significant differences in eggshell thickness, eggshell weight, eggshell reflectivity percentage and eggshell breaking strength (p>0.05) among the treatment groups. Egg weight was higher in the 2 and 4 % biochar, 2 and 4 % zeolite and 4 % bentonite treatments relative to the control group (p=0.001). Eggshell translucency was
Aust. Poult. Sci. Symp. 2016.....27
43

decreased significantly in the zeolite 2 % treatment compared to the control treatment (p=0.036). Shell deformation tended to be higher in 1 % zeolite and bentonite treatments (Table 2). Similarly, albumen height and Haugh Unit tended to be higher in 1 and 2 % biochar treatments but treatment groups were not significantly different from the control. Yolk colour score was decreased significantly in 4 % biochar, zeolite and bentonite treatments compared to control group (p=0.001).
Table 1 - Effects of biochar, zeolite and bentonite feed additives on egg yield and performance traits.
Treatment types
Surv. (%)
EY (number)
EP (%/hen/d)
EW (g/egg)
EM (g/hen/d)
FI (g/hen/d)
FCR
LBWG (g/ hen)
Biochar 1 % 95.0 357ab 87.6cd 61.6d 53.9c 116.2b 2.15ab 123.3a Biochar 2 % 93.3 359b 87.5d 62.2e 53.8c 116.3b 2.16ab 136.0ab Biochar 4 % 99.1 350ab 85.8b 60.7bc 51.5b 109.5a 2.13a 123.9a Zeolite 1 % 98.6 353ab 87.6d 61.3cd 53.8c 117.5cd 2.18b 135.9ab Zeolite 2 % 100 364b 88.2d 62.3e 54.5c 117.4cd 2.15ab 133.8ab Zeolite 4 % 97.6 351ab 85.8b 60.7bc 52.0b 116.2b 2.23c 130.1ab
Bentonite 1 % 95.0 339ab 86.1bc 60.6bc 52.2b 117.7d 2.26c 129.4a Bentonite 2 % 100 350ab 85.1b 60.5b 51.5b 117.2c 2.28c 139.7b Bentonite 4 % 98.3 338ab 85.2b 60.4b 51.5b 116.3b 2.26c 132.4ab
Control 95.8 331.2a 83.6a 59.5a 49.7a 118.6e 2.38d 130.1ab SEM 3.180 7.89 0.486 0.226 0.392 0.142 0.016 3.788
P values 0.621 0.022 0.001 0.012 0.021 0.001 0.009 0.037 Overall effects NS
* *** ** * *** ** *
a b c d e Letters refer in the same column with different superscript differ significantly *p<0.05, **p<0.01, ***p<0.001. Survivability (Surv), egg yield (EY), feed intake (FI), feed conversion ratio (FCR) expressed in g feed/g egg, live body weight gain (LBWG) and egg weight (EW), egg mass (EM) and egg production (EP), Standard error of means (SEM).
Table 2 - Effects of biochar, zeolite and bentonite feed additives on egg quality traits at 32 weeks.
Treatment types
EW (g)
SW (g)
Shell (%)
ST (µm)
STS (%)
SBS (N)
SR (%)
SD (µm)
AlbH (mm)
H U YCS
Biochar 1% 59.7ab 5.6a 9.4ab 410 3.1ab 44.9 26.4ab 283ab 7.8ab 88.7b 7.25bc Biochar 2 % 63.3cd 6.0ab 9.4 ab 413 3.2ab 42.0 25.5ab 274ab 7.9b 87.9ab 7.17bc Biochar 4 % 61.8bcd 5.9ab 9.5ab 415 3.1ab 43.3 24.0a 280ab 7.4ab 85.7ab 6.08a Zeolite 1 % 60.5abc 5.8ab 9.6ab 411 3.1ab 45.4 26.5ab 292b 6.9ab 82.8ab 7.50cd Zeolite 2 % 62.6bcd 5.8ab 9.3a 406 2.7a 41.7 24.7a 277ab 7.2ab 83.8ab 7.21bc Zeolite 4 % 63.8d 6.0ab 9.4ab 409 3.1ab 44.8 25.5ab 290b 7.4ab 85.3ab 6.75b
Bentonite 1 % 58.3a 5.7ab 9.9b 417 3.3ab 47.2 27.8b 294b 7.4ab 86.7ab 8.04d Bentonite 2 % 58.5a 5.7ab 9.8ab 418 3.3ab 41.4 26.8ab 266a 6.9a 83.1ab 7.38bc Bentonite 4 % 62.2bcd 6.1b 9.7ab 424 3.8b 45.2 25.9ab 276ab 6.9ab 81.3a 6.83b
Control 58.2a 5.7ab 9.9 b 412 3.7b 43.9 24.8a 289ab 7.2ab 85.3ab 7.50cd SEM 1.078 0.174 0.152 6.597 0.254 2.344 1.001 8.000 0.340 2.280 0.223 P values 0.001 0.057 0.007 0.062 0.036 0.055 0.053 0.010 0.027 0.051 0.001 Overall effect *** NS ** NS * NS NS ** * NS ***
a b c d Letters refer in the same column with different superscript differ significantly *p<0.05, **p<0.01, ***p<0.001. Egg weight (EW), shell weight (SW), shell percent (Shell %), shell thickness (ST), shell translucency score (STS), shell breaking strength (SBS), shell reflectivity percent (SR %), eggshell deformation (SD), albumen height (AlbH), Haugh unit (HU), Yolk colour score (YCS), Bond Brown Layer (BBL).
IV. DISCUSSION AND CONCLUSIONS Egg yield of the control group for weeks 26 to 37 of bird age was comparable to expected performance under optimum conditions. Egg yield was significantly improved (p=0.022) in the treatment groups as compared with the control. The performance standard for BBL
Aust. Poult. Sci. Symp. 2016.....27
44

include an average egg weight at 32 weeks of 62.0 g (Bond, 2015), which is comparable to that observed in the control group (58.2 g) and increased egg weights were obtained in all treatment groups compared to the control.
Under the conditions of the present study, biochar, zeolite and bentonite feed additives to a commercial poultry ration were associated with positive effects on egg production, egg weight, egg mass, daily feed intake and FCR. These feed additives substances acted as production promotants. While this study has not addressed the mechanism of this effect, we suggest biochar, zeolite and bentonite may act as absorbents for toxins and harmful metabolites and/or inhibit the growth of harmful microorganisms resulting in an enhanced beneficial microbial community in the gut. These additives may also decrease the speed of peristalsis, thus increasing nutrient absorption time in the digestive tract of birds, resulting in improved feed conversion efficiency. We are undertaking further study work to test these hypotheses. ACKNOWLEDGEMENTS: We thank Mr Garry Small, proprietor of Smalls Poultry, Mount Morgan, for his support in building the caging system for the feed additive egg laying trial at the Central Queensland University, Rockhampton. We also acknowledge the support provided by Associate Professor Julie Roberts in egg quality analysis laboratory work, carried out at the University of New England, Armidale.
REFERENCES
Bond (2015) Bond Brown Layer, (Bond Enterprises) http://www.bondenterprises.com.au/website
Gerlach H & Schmidt HP (2012) Ithaka Journal 2012: 262-264. Goodarzi M & Modiri D (2011) International Conference on Asia Agricultural and Animal
13: 38-43. Tauqir NA & Nawaz H (2001) International Journal of Agricultural Biology 3: 149-150. Zeng Y, de Guardia A, Daumoin M & Benoist JC (2012) Waste Management 32: 2239-2247.
Aust. Poult. Sci. Symp. 2016.....27
45

FEEDING LOW PROTEIN DIETS TO MEAT CHICKENS: EFFECTS ON EMISSIONS OF TOXIC AND ODOROUS METABOLITES
N.K. SHARMA1, R.A. SWICK1, M.W. DUNLOP2, S.B. WU1 and M. CHOCT3
Meat chickens fed a high protein diet produce increased levels of putrefactive metabolites in the caeca such as ammonia, amines, phenols, indoles, skatole, cresol and branched chain fatty acids (reviewed by Qaisrani et al., 2015). Some of these metabolites are toxic and odorous (Mackie et al., 1998). A low protein diet formulated to provide all the required amino acids without excesses may reduce putrefaction and therefore the production of toxic and odorous metabolites in the hindgut and litter. This study was conducted to investigate the effect of a low protein diet on odorous metabolites emitted from litter.
Day-old Ross 308 male chicks (n=144) were weighed and assigned to two treatments with 12 birds per floor pen and six replicate pens per treatment. Two diets were formulated to contain the same ratio of soybean, canola and meat meals but with different crude protein (CP) contents as follows: starter phase (260 g/kg vs 210 g/kg), grower phase (240 g/kg vs 195 g/kg) and finisher phase (230 g/kg vs 184 g/kg). The low CP diet was supplemented with crystalline amino acids including L-valine, L-isoleucine, L-arginine, L-lysine, D,L-methionine and L-threonine. At day 34, two birds from each pen were euthanized to collect caecal contents for measurement of microbial metabolites using a gas chromatography-mass spectrometry (GC-MS). Odorant concentrations were measured from litter headspace at days 15, 29 and 35 using a selective ion flow tube mass spectrometer (SIFT-MS, Voice 200TM SYFT technologies, Christchurch, New Zealand) and a flux hood that had some similar design features to the U.S. EPA flux chamber (Standards Australia/Standards New Zealand, 2009) and was operated in the same manner for each sample. Prior to each analysis, the SIFT-MS was run with standard gases which included ethylbenzene, tetrafluorobenzene, toluene, hexafluorobenzene, ethylene, octafluorotoluene, benzene, and isobutene to ensure a properly-calibrated instrument. Odorant concentrations were log transformed and analysed as a 2×3 factorial arrangement (2 diets, 3 ages) using SAS JMP v.8 software and differences were considered significant at P < 0.05.
Birds fed a low CP diet had lower concentrations of isobutyric acid, isovaleric acid and branched chain fatty acids in the caecal contents at day 34 than those fed a high CP diet (P < 0.05). In litter, concentrations of dimethyl amine, trimethyl amine, ammonia, H2S, phenol and benzene were lower with the low CP diet (P < 0.05). The concentration of methyl mercaptan in litter also tended to be lower with the low CP diet (P = 0.065). There was a diet × age interaction for 2,3-butanedione, 3-hydroxy-2-butanone, 3-methyl-1-butanol, 3-methyl-butanal, ethyl mercaptan, propionic acid and hexane (P < 0.05). Concentrations of these odorants were higher with the low CP diet (P < 0.01) on day 35 but not on days 15 and 29. Dietary CP content had no effect on the concentrations of dimethyl sulfide, dimethyl disulfide, dimethyl trisulfide, methyl amine, indole, skatole, cresol, acetic acid, butanoic acid, 2-butanone and butanol. These findings suggest that a low CP diet can reduce the production of odorous metabolites in litter but may increase the production of some odorants (including some ketones, aldehydes and alcohols) on day 35.
Mackie RI, Stroot PG & Varel VH (1998) J. Anim. Sci. 76: 1331-1342. Qaisrani SN, van Krimpen MM, Kwakkel RP, Verstegen MWA & Hendriks WH (2015) W.
Poult. Sci. J. 71: 139-160. Standards Australia/Standards New Zealand (2009) AS/NZS 4323.4-2009, Sydney, Australia.
1 School of Environmental and Rural Science, University of New England, Australia; [email protected] 2 Department of Agriculture and Fisheries, Queensland Government; [email protected] 3 Poultry Cooperative Research Centre, University of New England, Australia; [email protected]
Aust. Poult. Sci. Symp. 2016.....27
46

A FOCUSED REVIEW OF SCIENCE-BASED EVIDENCE ON THE WELFARE OF AUSTRALIAN MEAT CHICKENS
L.R. MATTHEWS1 and J.-L. RAULT2
Summary
This paper provides a summary of the up-to-date verifiable evidence regarding key welfare topics, risk factors and husbandry practices that potentially impact meat chicken welfare: locomotion, leg and foot conditions, stocking density, broiler breeder feeding, thinning, light, environmental enrichment, and free range production and welfare monitoring. This was achieved through a systematic review of the relevant, recently-published scientific literature.
I. INTRODUCTION The development of Australian standards and guidelines for the welfare of poultry are currently under development. The standards will specify acceptable animal welfare requirements, according to contemporary scientific knowledge alongside competent animal husbandry and mainstream community expectations. As the standards aim to reflect up-to-date scientific knowledge, it is critical that such knowledge is readily available. Currently, there are no up-to-date peer-reviewed papers summarising factors potentially affecting the welfare of meat chickens and associated risk factors. Hence, our aim was to review and report on the recent and relevant literature on meat chicken welfare so as to ensure that the best verifiable information is available to inform the development of the standards and guidelines for the welfare of meat chickens.
II. METHODS A systemic literature search was conducted using several literature databases, from the year 2000 to 2014. An emphasis was placed on experimental studies conducted under commercial conditions vis-a-vis those conducted in laboratory situations (which are typically less-representative of the production environment); studies conducted in Australian settings were favoured over studies conducted overseas; and recent studies were given more weight than older studies.
III. FINDINGS Locomotion: While there is some variation between breeds, poor leg health is an important welfare concern in commercial meat chicken flocks overseas; there are no data on its prevalence in Australia. The level of welfare compromise caused by leg pathologies is typically assessed by measuring walking ability (gait scoring). There is a lack of good correspondence between the various ways that walking ability has been assessed, which raises concerns about the reliability of all of them. Moderate to severe walking impairment (Gait Score 3 and 4 on the Kestin et al. (1992) scale) cannot yet be used to differentiate between leg pathologies (and presumed painful conditions) and abnormal gait due to unbalanced body conformation. As a result of the extreme functional impairment in birds with Gait Scores 4 or 5, it is generally recognised that birds in commercial flocks with such scores should be humanely culled as soon as possible. The welfare implications of birds with
1 Lindsay Matthews and Associates Research International; Honorary Academic, University of Auckland and University of Melbourne; [email protected]
2 Animal Welfare Science Centre, University of Melbourne; [email protected]
Aust. Poult. Sci. Symp. 2016.....27
47

Gait Score 3 or below require further clarification. The way a flock is sampled during gait scoring has a large impact on the observed prevalence of impaired walking ability, which raises questions about the correct way to sample and the published prevalence levels of various gait abnormalities. A variety of management practices can reduce walking impairments, including slowing growth early in life through manipulation of feed composition or supply.
Leg and foot conditions: In overseas studies, skin pathologies of the foot and leg are common welfare issues with foot pad dermatitis (FPD) being the most prevalent. Prevalence levels in Australia are unknown but the incidences observed in a very limited sample of flocks in NSW are not inconsistent with overseas data. Several methods are used to quantify and record the incidence and severity of FPD, but there is no universally-accepted system. Further, the thresholds for welfare impacts have not yet been identified scientifically. Litter wetness (and probably litter ammonia) has been identified as the main risk factors for FPD. Litter wetness is influenced by many different factors including ventilation rates, litter type, drinker type, dietary composition, water intake and strain of bird. Litter moisture levels between 20 and 25 % help prevent FPD. A practical scoring system for litter needs refinement. Reductions in FPD prevalence have accompanied formal FPD assessment in Scandinavia.
Stocking density: High stocking density is commonly believed to be a major risk factor risk impacting on meat chicken welfare, and this is reflected in animal welfare legislation in many countries, including Australia. A large number of scientific studies have examined the effects of stocking density on chicken welfare in laboratory settings but few in commercial production environments. A causal link between stocking density and chicken welfare is far from clear as many contradictory results have been reported across laboratory studies. An exception is the reasonably consistent increase in behavioural disturbance or associated conditions (such as scratches to the body) with increases in stocking density. In studies conducted under commercial conditions, stocking density has had little effect on several key welfare indicators (mortality, walking ability, skin conditions and jostling) at densities used in Australia. The absence of an effect of stocking density on mortality and an increase in behavioural disturbance at higher densities have been replicated in laboratory-based studies, although disturbance effects are reported to begin at lower densities in the laboratory. The reasons for the effect at lower densities in the laboratory are not clear and further replication in commercial production systems is required. In laboratory settings, it has been shown that birds kept at 40 kg/m2 showed a strong motivation to move to an area of lower density (23 or 32 kg/m2). Measures of the physical space requirements of birds indicate that they are compressed at densities above 40 kg/m2. It would be interesting to replicate studies on motivation for space in commercial houses to test the generalisability of these findings. Research on stocking density and chicken welfare has not been conducted recently under Australian conditions.
Broiler breeder feeding: The industry currently employs a range of different controlled feeding regimens, which differ in the frequency of feeding, quantity or type of food delivered. The welfare implications of the different feeding regimens for broiler breeders have yet to be fully examined. Attempts to develop a welfare methodology to assess feed motivation in broiler breeders have returned inconclusive results and the level of hunger experienced by breeders requires further research. Alternative feeding strategies investigated to date and aimed at maintaining body weight control while improving welfare have focused on diluting nutrient content, adding appetite suppressants or altering protein levels in diets. Neither these strategies nor environmental enrichment appear to offer clear benefits for reducing feeding motivation. Genetic selection to reduce the need for controlled feeding may provide an avenue for future research to reduce the need for controlled feeding.
Aust. Poult. Sci. Symp. 2016.....27
48
Thinning: There have been no formal experiments on the effect of thinning on chicken welfare. The few studies that have been conducted, mostly epidemiological investigations, showed major scientific limitations. It is not possible to ascribe cause-and-effect from epidemiological studies. The consequences of thinning have been associated with improvements, declines and no change in the welfare status of birds remaining in the flock. Further research using controlled experimental studies is required before the welfare impacts of thinning can be confidently assessed.
Light: Light exposure is a complex topic because it includes several characteristics: photoperiod, light intensity, wavelength and light source, which can have main or interactive effects. While constant or near-constant light (e.g. 23 to 24 hours) has been assumed to increase growth, birds under shorter photoperiod usually show compensatory growth and similar final body weight. Lower mortality, lower incidence of diseases from metabolic or skeletal origins, and behavioural changes are usually reported to be associated with shorter photoperiods. However, studies on photoperiods offering 14 hours of light or less often report activity during the dark periods. The distribution of the light cycle (e.g. alternate day and light periods of various durations) may be important but has received comparatively little attention. Some effects of photoperiod on welfare may be attributable to indirect effects of alterations in growth pattern rather than light per se. Lighting is not the only way to reduce growth rate. Interpretation of the literature on the effects of photoperiod is further complicated by the practice of step-down and step-up programs, which has received little scientific attention. There is still considerable discrepancy between studies on the effects of various light intensities on meat chicken behaviour and welfare. There is agreement that light intensity below 5 lux causes changes in eye morphology. The contrast in light intensity between light and dark periods appears important for welfare. However, this factor has not been well-controlled in experimental studies and thus makes interpretation of the results from some studies difficult. Determining an optimal light intensity for bird welfare is further complicated by the fact that birds seem to have different preferences at different ages. Few studies have investigated the welfare implications of behavioural changes induced by varying light programs, and whether this affects common welfare measures such as mortality, gait scores and leg health, FPD, hockburn or scratches on the body. Little is known about the influence of various methods to produce light, the welfare implications of providing progressive light program transitions at dawn and dusk, and the influence of natural light.
Environmental enrichment: There is limited evidence in the literature that the provision of perches unconditionally and strongly benefits meat chicken welfare. In general, perches appear poorly used, either because of their design, placement, the birds’ heavy weight or other factors. Other enrichment strategies such as the provision of straw bales or devices that birds can peck have had variable success in terms of use by the birds, and welfare benefits are unclear. Overall, the welfare implications of environmental enrichment programs require further investigation in commercial settings to account for the many variables that influence meat chicken behaviour and welfare.
Free range production: The use of the outdoor range by meat chickens is highly variable across farms and across flocks on the same farm. More data need to be collected in the different types of Australian local conditions, particularly because use of the range is affected greatly by weather conditions, and most of the studies to date have been conducted in Northern European conditions. Cover placed close to the shed can attract chickens onto the range, but they are generally reluctant to venture more than 10 to 20 m away from the shed, even when cover is provided. Comparative studies have shown that slow-growing strains range considerably more than fast-growing strains. Despite its practical relevance, the effects of outdoor access on immunology and disease prevalence have been the subject of little study, experimental or epidemiological. Overall, little research has been conducted on
Aust. Poult. Sci. Symp. 2016.....27
49

individual chickens in commercial flocks to understand the welfare implications of using the outdoor range. The findings from the little research conducted are somewhat contradictory.
Welfare monitoring: Internationally, welfare monitoring of meat chickens has been used for several different purposes such as assessing compliance with legislation, policies of producer groups (e.g. integrated producer companies), food supply companies (e.g. quick service restaurant chains or supermarkets) or welfare interest groups (e.g. non-governmental organisations (NGOs)). Surveillance programmes designed to ensure continuous welfare improvement should incorporate aspects that ensure ready engagement by farmers, timely and solution-orientated feedback, and may not require specific performance thresholds to be met. Measures of the risks to welfare associated with the production facility, birds and management together with an assessment of the welfare outcomes for the birds are desirable features of monitoring schemes as shown in the Swedish system for monitoring FPD. Designing a monitoring protocol that allows benchmarking by producers is potentially an effective way to achieve continuous improvements in welfare. Monitoring protocols used for compliance purposes require identification of thresholds for acceptable/unacceptable performance, yet validated thresholds do not yet exist. Nonetheless, sanction-based systems have had some success in improving welfare performance. Outcome-based welfare measures should be tested for validity, repeatability, reliability and standardisation, together with validation of flock sampling procedures. Time-efficient and cost-effective monitoring tools, possibly using novel automated recording systems are required to ensure ready adoption by producers.
Stockmanship is widely acknowledged as one of the most important determinants of an animal’s welfare, and on a general level is linked to all aspects of welfare covered in this literature review. Despite its importance, stockmanship has received little attention in scientific studies on chicken welfare, and little published information could be found on the topic.
IV. CONCLUSIONS
The review shows that there is much uncertainty about the types of management practices and housing conditions that impact adversely on welfare. Similarly, most measures of welfare and thresholds for acceptable welfare are not well validated. Thus, modifications to the Code will need to be considered carefully.
In the process of the review, it became clear that there is a paucity of published information on Australian housing and management practices and evaluation of chicken welfare under local conditions. In countries that use housing systems and breeds similar to those in the Australian chicken meat industry, several welfare topics are common (as identified in this report), although welfare outcomes vary between farms and countries. Thus, collecting scientific information under local conditions would help assess the extent and relevance of each of the topics (and associated risk factors) covered in this report to Australian meat chickens. It would also help to identify where improvements could be made. ACKNOWLEDGEMENTS: This review was partly funded by RIRDC-Chicken Meat (PRJ-009533).
REFERENCES Kestin S, Knowles T, Tinch A & Gregory N (1992) Veterinary Record 131: 190-194.
Aust. Poult. Sci. Symp. 2016.....27
50

EFFECTS OF LIGHT INTENSITY ON BROILER PRODUCTIVITY AND LEG HEALTH
J.-L. RAULT1, K.V. CLARK2, P.J. GROVES2 and G.M. CRONIN2 Light intensity may influence broiler behaviour and consequently affect welfare and productivity. However, there are discrepancies in the literature about the effects of various light intensities on meat chicken behaviour. Furthermore, few studies have investigated the welfare implications of behavioural changes induced by varying light programs. This paper reports the effects of light intensity on meat chicken leg health and productivity, as part of a larger project on the effect of light intensity on welfare and productivity.
A total of 1,872 Ross 308 broilers of mixed sex were studied across two replicates in an environmentally controlled shed, with 24 pens per treatment starting with 39 birds each (aiming for ≈34 kg/m2 of floor space stocking density at 35 days of age). Following placement, birds were kept at 30-50 lux on a 23L:1D photoperiod. Treatments started on day 8 with the birds exposed to one of two light intensity levels: 5 lux (industry standards) or 20 lux (RSPCA Approved Farming Scheme minimum standard), on a 16L:8D photoperiod with 30 min sunrise and sunset periods. Lighting was delivered through LED lights placed above each pen and light intensity was checked weekly 25 cm above the litter. The shed was divided lengthwise using light-proof curtain divided into two treatment sides, reversed between replicates. A pink noise was provided from day 1 and played continuously through playback recorders in order to cover possible vocal and activity noise effects between treatments. Production measures (body weight of four birds per pen, pen feed and water intakes) were taken weekly from 7 to 49 days of age. Leg and foot leg condition – foot pad dermatitis (Berg, 1998), hock burns, leg straightness - were assessed at 46 days (≈30 birds per pen). Continuous data were normally distributed and analysed using Proc MIXED in SAS, accounting for pen as the experimental unit and repeated measures when applicable. Categorical data were analysed using Chi-square tests. Body weight differed according to the interaction of treatment × sex × week (P < 0.01), with males under 5 lux being heavier than males under 20 lux by weeks 6 and 7, and females under 5 lux being heavier than females under 20 lux by week 7 (all P < 0.01). There were no differences in feed and water intakes. Foot pad dermatitis was more prevalent in birds under 5 lux than under 20 lux (0/1/2 scores: 67/22/11% vs. 76/8/16%, respectively, P < 0.001). Hock burn prevalence for birds under 5 lux was consistent across replicates (replicate 1: 49%; replicate 2: 51%) whereas birds under 20 lux had a lower prevalence in replicate 1 (24%, P < 0.001) but higher prevalence in replicate 2 (68%, P < 0.001). Litter moisture was higher in replicate 1 than replicate 2 (47% vs. 32%, P < 0.001). Leg straightness did not differ according to treatment.
Birds under 5 lux grew faster, but had a higher prevalence of foot pad dermatitis, whereas birds under 20 lux could be more or less susceptible to hock burn. Further analyses are on-going for welfare measures (behavioural activity and corticosterone concentrations).
ACKNOWLEDGEMENTS: Project partly funded by RIRDC-Chicken Meat (PRJ-009333).
Berg C (1998) Doctoral diss. Dept. of Animal Environment and Health, SLU (Acta
Universitatis Agriculturae, Sueciae, Sweden).
1 Animal Welfare Science Centre, University of Melbourne; [email protected] 2 Faculty of Veterinary Science, The University of Sydney; [email protected];
[email protected]; [email protected]
Aust. Poult. Sci. Symp. 2016.....27
51

THE IMPACT OF β-MANNANASE ENZYME ON THE INTESTINAL HEALTH OF POULTRY UNDER COMMERCIAL CONDITIONS
A.M. GRIEVE1, S. CERVANTES-PAHM2 and M.A. MARTINEZ3
Summary
A new group of enzymes, energy sparing enzymes, are now in the market. β-mannanases differs from other enzymes because it improves intestinal health of the birds by reducing intestinal inflammation caused by β-mannans found in many feed ingredients. During a commercial trial the use of a β-mannanase (Hemicell®) on top of phytase and xylanase showed an improvement in intestinal integrity by reducing mucus and water content in the small intestines. This resulted in an increase in the number of birds with cleaner vents, cleaner footpads and a more uniform flock.
I. INTRODUCTION
The majority of enzymes used today are considered energy releasing enzymes. These enzymes improve the animal’s efficiency to utilize energy from the feed by several mechanisms including the reduction of intestinal viscosity as in the case of xylanase in wheat-based diets. A new group of enzymes, considered as energy sparing enzymes, differs from other enzymes because it reduces intestinal inflammation caused by inherent components in the diet that could unnecessarily drain the animal’s energy pool for growth by diverting energy to support the immune system (Spurlock, 1997). By reducing the diet-induced intestinal inflammation, the energy drain is prevented and the spared energy is recovered to support the energy needs of the animal for growth. β-mannanase is considered an energy sparing enzyme.
β-mannan is a polysaccharide inherently found in soybean and other vegetable proteins (Table 1). The anti-nutritive effect of β-mannan in farm production animals includes its ability to be recognized by the immune cells as a pathogen associated molecular pattern (Duncan et al., 2002). The engagement of the intestinal immune cells causes intestinal inflammation which can impair the bird’s ability to efficiently utilise the feed and may reduce the capacity of the birds to resist stress and possible challenges in the intestinal tract (Klasing, 2007, Geniec et al., 2015). β-mannan –induced inflammation was estimated to cost 3% of the metabolizable energy in broilers (Daskarin et al., 2004, Hsiao et al., 2006).
We hypothesize that birds fed diets containing β-mannanase may have better intestinal health compared to bird fed diets in the absence of a β-mannanase. Therefore, the objective of this study is to evaluate the effects of a β-mannanase on the intestinal health of broilers under commercial production conditions.
II. MATERIALS AND METHODS A cohort study was conducted in two commercial farms, located in the same premises. Each of the farms consisted of four houses having a common structural design and following a similar management system. The trial was conducted between April and October 2014. During these six months, three fattening cycles were completed to an average slaughter age of 32 days. In the third cycle, only one farm was used for the study (Table 2).
1 Elanco Animal Health, Brisbane, QLD 4157; [email protected] 2 Elanco Animal Health, Philippines; [email protected] 3 Elanco Animal Health, Mexico; [email protected]
Aust. Poult. Sci. Symp. 2016.....27
52

The birds were raised under a typical EU production system. All-in/all-out was followed and fresh litter was used for all houses. To manage differences in broiler genetics, each farm within a cycle was provided with one genetic line (Table 3). A combination of wheat/corn and soybean meal diets without (control diet) and with β-mannanase (treatment diet; 110 ml/MT of Hemicell-L®) were prepared (Table 4). Each farm has its own control (2 houses) while the remaining 2 houses were treatment houses. β-mannanase was added ON TOP of xylanase and phytase without changing the composition of the diets.
Table 1 - Soluble β-mannan content in common feed ingredients (Ferrel et al., 2014).
Mannan % Ingredient Water Soluble Total Soybean meal 44% 1.45 1.60 Full fat soybeans 0.70 0.90 Soybean meal 48% 1.10 1.20 Rapeseed meal (canola meal) 0.39 0.68 Barley 0.02 0.27 Peanut meal 0.36 0.60 Wheat grain 0.21 0.26 Wheat bran 0.15 0.32 DDGS 0.10 0.15 Sorghum 0.00 0.00 Guar meal 40% 7.90 9.27
Table 2 - Number of cycles, farms, houses, and broilers involved during the conduct of the study.
Cycle Farms No. of houses No. of Broilers 1 2 and 4 8 299,220 2 2 and 4 8 292,125 3 4 4 152,000
Total 743,345
Table 3 - Genetics of broilers assigned to the commercial farms for the 3 production cycles.
Cycle Farm 2 Farm 4 1 Cobb 500 FF Ross 308 2 Cobb 500 FF Cobb 500 FF 3 - Ross 308
Table 4 - Dietary energy were equivalent to normal commercial situations.
Diet Energy Level Days on diet Starter 12.7 MJ ME/kg 0-10
Grower 1 13.1 MJ ME/kg 11-20 Grower 2 13.2 MJ ME/kg 21-29 Finisher 13.3 MJ ME/kg 29-35
Intestinal health of the birds was monitored using the Health Tracking System (HTS)
developed by Elanco Animal Health. The Health Tracking System is a data management system that monitors the health status of poultry flocks in a farm over time. This allows producers to make correlations between management practices and health outcomes, and between health status and flock performance. The system requires for an evaluation of 5 randomly selected healthy birds per house along time. Evaluation for the first two weeks
Aust. Poult. Sci. Symp. 2016.....27
53

consisted of vent and footpad examinations. Third week evaluation consisted of footpad examinations and a post-mortem examination of the randomly selected birds. At harvest, intestinal health evaluation consisted primarily of HTS post-mortem examinations. Overall, 152 healthy birds were randomly monitored for intestinal health, 952 birds for footpad examinations and 450 birds for vent examinations. At the completion of the three cycles, data was analysed using a Poisson regression model and contingency analysis.
III. RESULTS AND DISCUSSION Mortality did not differ between control and treatment diets however, there was 30% less rejected birds in the β-mannanase treatment group compared to the control group (P = 0.16; Table 6). Although not statistically significant, one probable reason for less bird rejects in the groups fed β-mannanase was because only 8.8% of the birds sampled had dirty vents (score 2 and 3) whereas 17.5% the birds sampled in control groups had 15.5% dirty vents. Two important parameters shaping the Intestinal Integrity Index (I2) scores were presence of excessive intestinal mucus (MC) and excessive intestinal watery content (WC). Both parameters point out for a better response (more birds with score 0) in the β-mannanase fed birds (MC, P < 0.10; WC, P < 0.01) compared with the control fed birds. The I2 score indicate that β-mannanase fed birds had 1.47 points advantage over the control fed birds suggesting better intestinal integrity. The improvements on intestinal integrity were also observed by Saki et al., 2005, corroborating the effect seen in this field trial. As a result of better intestinal integrity, birds fed β-mannanase had less high grade footpad lesions (P < 0.05), possibly because of better litter conditions.
Flock average live weight was also showing +10% more birds falling into the desired weight range of 1.70-1.75. This suggests that uniformity of the flock maybe more predictable with β-mannanase supplementation. Gabler et al., 2008 observed an interaction between immunity and the regulation of growth and efficiency. As a consequence of the suppression of unnecessary intestinal inflammation caused by FIIR, β-mannanase supplementation may not only allow for better uptake and utilisation of nutrients but also redirects nutrient resources back to growth, especially among the most challenged birds (Klasing et al, 1987; Anderson et al., 2006).This could explain the better uniformity of the flock, allowing impaired individuals to reduce their β-mannan-induced immune stress levels and grow better with β-mannanase supplementation.
Table 5 - Results on health effects of β-mannanase.
Control β-mannanase P-value Mortality % 2.33 2.30 NS Rejects % Vent pads (scale 0-2)^
0.86 0.15
0.60 0.08
P = 0.16 NS
Excessive intestinal fluid¥ Excessive intestinal mucus§
0.39a
0.14a 0.12b
0.05b P < 0.01 P < 0.10
Intestinal integrity index (I2) Footpad lesions (scale 0-2)*
95.2 1.20a
96.6 1.13b
NS P < 0.05
^ Scale, Elanco HTS: 0=Clean vent pads 1= Slightly dirty 2= Very dirty; ¥ Scale, Elanco HTS: 0=normal 1= excessive intestinal fluid; §
Scale, Elanco HTS: 0=normal 1= excessive mucus ; * Scale, Elanco HTS: 0 =Healthy 1=Superficial lesions 2= Deep lesions.
IV. CONCLUSIONS
The commercial trial demonstrated that β-mannanase liquid at a commercial concentration of 110 ml. per tonne of feed has beneficial effects on both intestinal health and animal welfare. As a consequence of the suppression of unnecessary intestinal inflammation caused by β-
Aust. Poult. Sci. Symp. 2016.....27
54

mannanase supplementation not only allows for better uptake and utilisation of nutrients but also redirects nutrient resources back to growth, especially among the most challenged birds. In conclusion, β-mannanase supplementation improved intestinal health by reducing excessive watery content and excessive mucus secretion on the intestines. Positive benefits include improved footpad lesions, less rejects in the slaughterhouse, and better uniformity of the flock.
REFERENCES Anderson D, Mathis G & Jackson (2006) Presented at the Poultry Science Meeting,
Edmonton, Alberta, Canada. Daskiran M, Teeter RG, Fodge D & Hsiao HY (2004) Poultry Science 83: 662-668. Duncan C, Pugh N, Pasco D & Ross S (2002) Journal of Agricultural and Food Chemistry
50: 5683-5685. Elanco Animal Health (2006) Health Tracking System (HTS) (Elanco Animal Health) Ref:
2596: 1-50. Ferrel J, Anderson D & Hsiao HY (2014) Journal of Animal Science 92: 328. Gabler N & Spurlock M (2008) Journal of Animal Science 86: E64-E74. Geniec NO, Alemi F & Klasing K (2015) 2015 International Poultry Scientific Forum,
Georgia World Congress Center, Atlanta, Georgia, pp. 54. Hsiao H, Anderson D & Dale N (2006) Poultry Science 85: 1430-1432. Klasing K (2007) British Poultry Science 48: 525-537. Klasing K, Laurin D, Peng R & Fry M (1987) Journal of Nutrition 117: 1629-1637. Saki AA, Matzugi MT & Kamyab A (2005) International Journal of Poultry Science 4: 21-
26. Spurlock ME (1997) Journal of Animal Science 75: 1773-1783.
Aust. Poult. Sci. Symp. 2016.....27
55

IMPORTANCE OF HATCH TIME AND ACCESS TO FEED ON BROILER MUSCLE DEVELOPMENT
D.J. POWELL1, S.G. VELLEMAN2, A.J. COWIESON1, M. SINGH1 and W.I. MUIR1
In commercial settings, hatching occurs over a 24-48 h window and chicks are held in the incubator until a majority have cleared the shell. Earlier hatching chicks therefore have a longer fasting period post-hatch within the incubator than later hatching chicks. Upon removal, hatchery procedures and transport to grow out farms delay access to feed and water to all birds by up to a further 48 h.
Delayed access to feed post-hatch impairs body weight gain and relative breast muscle weight (Halevy, et al., 2000). Chick hatch time has also been shown to influence breast muscle growth potential, although previous observations have only reported on 5 d (Wang, et al., 2014), and 18 d (Lamot, et al., 2014) birds, respectively, with conflicting results. To elucidate the relationship between hatch time and muscle growth potential, male chicks were identified as early (EH), midterm (MH), or late (LH) hatchers based on their time of hatch and were provided either immediate access to feed upon removal from the incubator, or were withheld from feed and water until 24 h after the end of the hatch period.
Fertile Ross 308 eggs (n=1307) were obtained from a commercial hatchery, and incubated at the University of Sydney (Camden, NSW). The incubator was inspected every 3 h from 468 to 517 h of incubation and hatched chicks were removed, feather sexed, weighed, and tagged. Female chicks were excluded from the study. The first 170 hatched male chicks were assigned to the EH group. The next 12 hatched male chicks were excluded from the study to separate the hatch time subpopulations. This procedure was repeated for the MH, and LH groups. Chick body weight was measured at the time of hatch, and 4, 7, 14, 28, and 40 d. Ten chicks per treatment were sacrificed at the time of hatch, 0, 1, 4, 7, 28, and 40 d and the breast muscle (including sternum) was weighed. Breast weight is reported relative to chick weight.
Average individual hatch time after onset of incubation was 497.7 h for EH, 508.8 h for MH, and 514.5 h for LH chicks. Hatch time did not affect body weight at hatch. From 1 through to 28 d of age immediate access to feed increased body weight gain. Early hatched birds gained the most weight through to 14 d, except at 1 d when MH birds had the highest body weight gain. Relative breast weight was also increased at 4, 7, and 28 d in birds that had immediate access to feed. Relative breast weight was increased in EH compared to LH birds at 4 d, and in EH and MH compared to LH birds at 7 and 28 d. Relative breast weight was increased in EH birds regardless of access to feed, and despite no difference in body weight at 28 d.
In conclusion, providing hatchlings immediate access to feed and water significantly increased bird growth until 28 d. A positive relationship was also observed in relative breast weight with EH chicks, regardless of access to feed. As the age of slaughter in broilers continues to decrease, the impact of hatch time and immediate provision of feed will become increasingly important contributors to efficient chicken meat production. ACKNOWLEDGEMENTS: This work was funded by the Australian Poultry CRC. Halevy O, Geyra A, Barak M, Uni Z & Sklan D (2000) J. Nutr. 130: 858-864. Lamot DM, van de Linde IB, Molenaar R, van der Pol CW, Wijtten PJ, Kemp B & van den
Brand H (2014) Poult. Sci. 93: 2604-2614. Wang Y, Li Y, Willems E, Willemsen H, Franssens L, Koppenol A, Guo X, Tona K, Decuypere
E, Buyse J & Everaert N (2014) Animal 8: 610-617.
1 The University of Sydney, Australia; [email protected] 2 The Ohio State University, USA.
Aust. Poult. Sci. Symp. 2016.....27
56

THE EFFECT OF A PLANT ALKALOID SUPPLEMENT ON PERFORMANCE OF
BROILERS UNDER NECROTIC ENTERITIS
G.D. XUE1, M. CHOCT
2, S.B. WU
1 and R.A. SWICK
1
Necrotic enteritis (NE) in broilers is caused by Clostridium perfringens. The disease may
result in significant economic loss and is currently controlled in Australia by feeding low
doses of antibiotic growth promotors (AGP). Alternatives to AGP have been sought since the
EU ban of AGP use in livestock. The phytogenic feed additive (Sangrovit® Extra) based on
quaternary benzophenanthridine and protopine alkaloids (QBA+PA) shows potential as an
AGP alternative that has been reported to be anti-inflammatory, anti-microbial and
immunomodulating (Khadem et al., 2014). A study was conducted to investigate the
effectiveness of QBA+PA in controlling NE in broiler chickens. Ross 308 male broilers (n =
714) were allocated to 42 pens in a 2 x 3 factorial arrangement of treatments. Factors were:
NE challenge - no or yes; additives - none, QBA+PA (Sangrovit® Extra) 0.15 g/kg from d 0
to 35, Zn bacitracin (Albac® 150) 0.33g/kg from d 0 to 35. The NE challenge procedure
followed the study reported previously (Wu et al., 2010) with modifications. Wheat, barley,
sorghum, soybean based starter (d 0 to d 10), grower (d 10 to d 24) and finisher (d 24 to d 35)
diets were formulated to meet the nutrient requirement suggested by Ross 308 nutrition
specifications (Aviagen, 2014). Live weight, feed intake and FCR were determined on d 10,
24 and 35. The results showed that dietary QBA+PA reduced NE lesion score in small
intestine. Weight gain and feed intake from d 0 to d 35 were increased through dietary
inclusion of QBA+PA as compared to controls. No challenge × additive interaction was
observed. It is concluded that QBA+PA partially protected birds against NE.
Table 1 - Performance of broilers upon the treatments at d 35 of age.
Main Effects Intake g/bird Weight gain g/bird FCR g/g
Challenge
No 3411a 2466
a 1.384
b
Yes 3167b 2216
b 1.429
a
Additives
None 3231b 2286
b 1.415
QBA+PA 3359a 2401
a 1.401
Zn bac 3278ab
2336b 1.404
SEM 26.3 23.5 0.0045
Source of variance P-value
Challenge <0.0001 <0.0001 <0.0001
Additives 0.015 0.001 0.110
Challange×Additive 0.681 0.353 0.600 a,b,cMeans within columns not sharing common superscripts are significantly different(P < 0.05)
ACKNOWLEDGMENTS: This study is supported by Phytobiotics Futterzusatzstoffe GmbH,
Germany. Eimeria inoculum was provided by Eimeria Pty Ltd, Australia.
Aviagen (2014) http://en.aviagen.com/assets/Tech_Center/Ross_Broiler/Ross308Broiler
NutritionSpecs2014-EN.pdf
Khadem A, Soler L, Everaert N & Niewold T (2014) Brit. J. Nutr. 112: 1110-1118.
Wu S-B, Rodgers N & Choct M (2010) Avian Dis. 54: 1058-1065.
1 Department of Animal Science, University of New England, Armidale, NSW 2351; [email protected]
2 Poultry Cooperative Research Centre, University of New England, Armidale, NSW 2351.
Aust. Poult. Sci. Symp. 2016.....27
57

IMPROVEMENT IN GROWTH RESPONSES OF BROILER CHICKENS WITH PROLONGED DIETARY SUPPLEMENTATION OF PROCESSED PLANT PROTEIN
A.A. OMEDE1,2, M.M. BHUIYAN1 and P.A. IJI1
The benefits of early nutrition have become a subject of interest to poultry nutrition researchers and the poultry industry. Since the first week accounts for about 20 % of the total production cycle of broilers (Bigot et al., 2003), providing birds with pre-starter/starter diets containing highly digestible amino acids within this period (1-10 days post-hatch) may be beneficial. This is suggested to support intestinal development and better growth performance (Bhanja et al., 2009). Whether these benefits are sustained till market weight is not well known. The present study therefore assessed whether long and short-term supplementation of a processed soy product, HPA (Hamlet Protein, AS, Denmark) produces the same benefits in terms of growth response of broilers.
A total of 350 day-old Ross 308 chicks (males) divided into 5 iso-caloric and iso-nitrogenous feed treatments, were fed either a control diet from 0-35 days or a diet containing 10 % of the test product for either 5, 10, 24 or 35 days. When birds were not on treatment diets during the starter, grower and finisher phases, they were fed a common diet during such period. Each group was replicated 7 times, each replicate with ten birds. Feed and water were provided ad libitum. Feed intake and body weights were recorded on day 10, 24 and 35. Significant differences in feed intake and weight gains were observed with prolonged supplementation of HPA. The results showed that supplementing HPA to 35 days increased weight gain by 35.31, 19.25 and 13.45 % when compared to no supplementation, 5 day or 10 day supplementation respectively. Table 1 - Effect of inclusion and feeding duration of HPA on response of broiler chickens on 10, 24 and 35
days of age.
HPA Level (%)
0 10
Age Duration of Feeding
35 5 10 24 35 SEM P-value
1-10d Feed Intake 225.7c 265.2b 292.8a 309.9a 301.8a 6.00 0.001 BWG 171.6c 223.3b 255.3a 264.7a 260.6a 7.03 0.001 FCR 1.31a 1.19b 1.19b 1.16b 1.15b 0.020 0.021
1-24d Feed Intake 1093.3d 1203.1c 1290.7b 1534.7a 1546.4a 33.00 0.001 BWG 854.0d 947.2c 1024.7b 1288.3a 1273.1a 31.10 0.001 FCR 1.28a 1.27ab 1.26ab 1.19c 1.22bc 0.011 0.021
1-35d Feed Intake 3040.7c 3103.9bc 3202.7b 3556.6a 3522.8a 42.00 0.001 BWG 1730.5c 2038.4b 2161.0b 2472.5a 2424.5a 52.20 0.001 FCR 1.76a 1.53b 1.49bc 1.44c 1.45bc 0.023 0.001
abc mean values along the same row not sharing a superscript are significantly different at the levels indicated.
Although early and short-term supplementation of HPA produced better responses during the starter phase, it seems that prolonged supplementation may still be needed to sustain the response obtained during the starter period. It would appear that the optimum duration of supplementing the product lies somewhere between 10 and 24 days. Bhanja SK, Anjala DC, Panda AK & Shyam SG (2009) Asian-Aust. J. Anim. Sci. 22: 1174-1179. Bigot K, Mignon-Grasteau S, Picard M & Tesseraud S (2003) Poult. Sci. 82: 781-788.
1 School of Environmental and Rural Science, University of New England, Australia; [email protected] 2 Department of Animal Production, Kogi State University, PMB 1008, Anyigba, Kogi State, Nigeria.
Aust. Poult. Sci. Symp. 2016.....27
58

HOCK BRUISES IN BROILERS ARE INDICATIVE OF LEG WEAKNESS.
P.J. GROVES1 and W.I. MUIR1.
A series of experiments in our laboratory have evaluated leg weakness in broilers using Latency-To-Lie tests (LTL; Groves and Muir 2014). In each case evaluations were also made of anatomical abnormalities including leg symmetry, foot pad dermatitis (FPD), hock bruising/ burns (HB), femoral head necrosis and tibial dyschondroplasia. A consistent association between the presence of low level HB and reduced LTL time was observed in several of these studies. A combined analysis was performed to characterize this association (Table 1) and to compare any concurrent association with FPD. All HB and FPD lesions were mild (score 1) in each study.
Table 1 - Median Latency-To-Lie times for birds with or without hock bruises.
Study No.
Hock Bruise score\1 0
Hock Bruise score 1
P\2=
1 Number birds 54 19
Median LTL\3 (secs) 300A 116B 0.034 % birds with FPD score 1 77.1 76.4 0.96
2 Number birds 84 60
Median LTL (secs) 135 112.5 0.41 % birds with FPD score 1 1.1b 23.3a <0.001
3 Number birds 77 42
Median LTL (secs) 109A 38B 0.0004 % birds with FPD score 1 15.5 21.4 0.07
4 Number birds 130 72
Median LTL (secs) 114.5A 93B 0.012 % birds with FPD score 1 0 0 1.00
\1 – HB score: 0 = no lesion, 1 = mild hock lesion. \2 – Probability difference due to chance, LTL: Kaplan-Meier survival analysis; FPD: χ2. \3 - Median value from a Latency-To-Lie test to a maximum of 300 seconds a,b – FPD score differ significantly (P<0.05) by χ2 analysis A,B – LTL times differ significantly (P<0.05) by Survival Analysis Birds with low HB scores had significantly shorter standing times than those with no lesions in three of the four studies. There was no significant association between FPD and LTL in any of the studies (data not shown). The only study in which FPD lesions differed with respect to HB, there was no significant difference in LTL between HB scores. Where FPD lesions are low, the occurrence of HB lesions are more likely associated with broilers with reduced mobility (spend more time sitting), whereas FPD is more closely associated with wet litter conditions. Thus, the reduced mobility may be responsible for increased HB rather than the HB contributing directly to reduced bird mobility. The presence of minor HB (score 1) may be a reasonable clinical guide to the overall mobility of the broiler flock, especially where litter is not excessively wet. ACKNOWLEDGEMENTS: Parts of this research were funded by Australian Rural Industries Research and Development Corporation, Chicken Meat. Groves PJ & Muir WI (2014) PLoS ONE 9: e102682.
1 Faculty of Veterinary Science, The University of Sydney; [email protected]
Aust. Poult. Sci. Symp. 2016.....27
59

RESIDUAL YOLK SAC CALCIUM AND PHOSPHORUS UPTAKE OVER THREE DAYS
R.L. HOPCROFT1, A.J. COWIESON2, W.I. MUIR1, J. FREILIKH1, M. JOVANOVSKI1
and P.J. GROVES1
Summary When considering the Ca and P content of a standard broiler starter diet and the residual yolk of chicks, intake of Ca from both the yolk and feed could result in an overabundance of Ca, and potentially decrease bone mineralisation. Using differing incubation temperature profiles, two groups of early and late (< 498 hours or ≥498 hours in incubator respectively) hatched chicks were produced. These birds were then placed into pens allocated either a standard diet, a lowered Ca:P ratio pre-starter diet, or equal access to both. Birds on the standard diet absorbed less Ca from their yolk by day 3 than those on the low Ca diet. The data indicated that chicks are able to regulate Ca intake from the yolk, especially after feed intake begins. Birds given a choice between the standard and low Ca diet ate more of the low Ca diet on day 1, but not day 3. This could indicate a selective preference by the chick to increase P intake without increasing Ca.
I. INTRODUCTION Chicken embryos are able to accrue Ca from the eggshell into their yolks during incubation, but are mostly limited to the amount of P originally present in the yolk (Rocky and Tamao, 1986). Hence a newly hatched chick has abundant Ca but limited P in the residual yolk. After 24 hours without feed, the chick’s serum Ca is elevated but serum P remains similar to levels at time of hatch (Groves and Muir, 2014). The chick is 0.5 to 0.7cm longer, but bone ash has been reduced compared to chicks that had access to feed. Bone mineralisation and the utilization of Ca may be inhibited due to the limitation of P. Ca:P ratio in the yolk is around 10:1 or greater at hatch, whereas the chick requires a 2:1 ratio for optimal bone mineralisation. It was theorised that if the yolk supplies about 16-20% of the chick’s nutrients over the first 3 days, the actual Ca: P ratio with standard starter feed is about 3-4: 1 (Groves and Muir, 2014).
II. MATERIALS AND METHODS Eight hundred and sixty-four fertile eggs of Cobb 500 non-feather-sexable broilers were obtained from a commercial broiler hatchery. The breeder stock from which the eggs originated was 36 weeks old at time of lay. The eggs were randomized amongst six Multiquip E3 incubators. Three incubators were maintained at an EST of 37.8°C throughout the first 18 days of incubation. The remaining three incubators started at 36.9°C EST and EST was gradually raised to 37.8°C by day 16 of incubation. Relative humidity was maintained between 50 and 60% throughout.
On day 18 of incubation, eggs were transferred into individual cells on hatching trays, and placed in a randomized fashion into one large AussieformTM incubator at an initial ambient temperature of 37.2°C and 60% relative humidity. Temperature was dropped to 36.0°C by 21 days of total incubation and relative humidity raised to 65%.
The time of hatch for each egg was observed from 468 hours (19.5 days) of total incubation, at 6 hour intervals. Birds were grouped according to “early” (EH) or “late” (LH) hatch time (< 498 hours or ≥498 hours total incubation respectively). At 516 hours of incubation, chicks were taken off from the hatcher. Each chick was weighed and individually wing tagged. Approximately 20 chicks per incubator were selected representatively across hatching times. These chicks were blood sampled (for PCV and serum Ca and P) and euthanized, weighed and
1 Faculty of Veterinary Science, The University of Sydney; [email protected] 2 DSM Nutritional Products, Kaiseraugst, Switzerland.
Aust. Poult. Sci. Symp. 2016.....27
60

their length measured (from middle toenail to beak), then their right legs were collected and frozen for later bone ash assay. Their yolk sacs were removed, weighed and frozen for later Ca and P analysis. Sex at post mortem was recorded.
The remaining 592 birds were grouped according to hatch time and randomly allocated between 88 small cages at 6-7 birds per cage. There were 361 early hatched chicks and 231 late hatched chicks, as actual hatch time rather than incubation profile was used. Within the hatch time groups, cages were randomly allocated one of three ration treatments-Standard (Std) (0.9% Ca:0.45% AvP), Low Calcium (LCa) (0.57% Ca:0.45% AvP), or Choice – equal access to both feeds. All rations were formulated by Dr Aaron Cowieson and produced by the Poultry Research Foundation feed mill, University of Sydney, Camden, as steam pelleted feeds. Starter rations were crumbled. Cages were offered this distribution of diets until day 3. Bird weight and feed intake were measured daily. On day 3, 210 chicks were randomly selected from the cages. These chicks were sampled in the same manner as birds sampled at take-off.
III. RESULTS Table 1 shows the results from the chicks which were sampled at take-off time by Early or Late hatching groups. EH chicks were significantly lighter and their remaining yolk sacs were significantly lighter than for LH chicks. The concentration of calcium in the residual yolk is significantly higher in EH chicks than LH, but the total calcium amount in the yolk is the same. The yolk concentration of phosphorus in both hatch groups remained the same, while total phosphorus was significantly reduced in the EH chicks. The packed cell volume (PCV%) of EH and LH chicks was not different.
Table 2 shows the measurements taken on chicks after feeding for 3 days on the three dietary treatments. EH chicks were significantly longer and had significantly lower remnant yolk sac weights and with lower total yolk calcium and phosphorus contents than the LH cohort. There was no effect of feed type on yolk weight at day 3. Chicks fed on the LCa diet had significantly higher serum and yolk phosphorus concentrations than those fed the Std starter diet or Choice fed.
Male LH chicks fed the LCa diet had day 3 bone ash percentages that significantly exceeded those of EH chicks that were Choice fed and LH chicks on the Std starter ration. The interaction effect is shown in Figure 1 where the provision of LCa to LH chicks improved bone ash over the Std birds with the Choice fed group intermediate.
Table 3 shows the intake of either Std or LCa feed by the Choice fed group only. Chicks of either hatch time consumed more of the LCa than Std ration on day 1 (P= 0.001, Student’s t-test) but the difference in consumption of each ration declined over days 2 and 3. EH chicks consumed significantly more LCa than the LH on day 1 but not thereafter.
Tibial bone ash at day 3Current effect: F(2, 112)=3.0671, p=.05048
Effective hypothesis decompositionVertical bars denote 0.95 confidence intervals
Early hatched <498 hrs Late hatched >= 498 hrs
Standard Lo Ca Choice
Feed
28
29
30
31
32
33
34
35
36
37
38
39
40
Tibi
al b
one
ash
%
Figure 1 - Tibial bone ash % for males at day 3 by hatch time and feed type.
Aust. Poult. Sci. Symp. 2016.....27
61

Table 1 - Data for chicks sampled at take-off (516 hours of incubation) by Early or Late hatch time.
Time of Hatch No. of chicks
sampled
Chick Wt g
Chick length
cm
Tibial Bone ash %
Yolk Wt g
PCV %
Serum Ca mmol/L
Serum P mmol/L
Yolk Ca mmol/L
Yolk P mmol/L
Total yolk
Ca mg
Total yolk P
mg <498 hrs (Early) 56 41.6 19.3 23.6 3.99 31.2 2.45 1.38 13.1 0.59 75.2 2.68 ≥498 hrs (Late) 61 43.0 19.5 24.3 4.91 31.9 2.42 1.35 10.9 0.54 78 3
P= 0.02 0.56 0.34 <0.001 0.27 0.21 0.58 0.016 0.12 0.44 0.008
Table 2 - Data from chicks sampled at Day 3 by hatch time and feed type.
Hatch Time Feed No.
Chicks sampled
Chick length d3 cm
Yolk Wt d3 g
Bone ash % d3 Males
PCV % d3
Serum Ca mmol/L
Serum P mmol/L
Yolk Ca mmol/L
Yolk P mmol/L
Total yolk Ca
mg
Total yolk P
mg <498 hrs Standard 43 22.3 0.76B 34.0AB 23.3 2.69 2.48 42.6 1.01 49.2 0.96
Lo Ca 40 22.3 0.72B 33.7AB 23.7 2.76 2.65 36.8 1.34 41.2 1.12
Choice 44 22.4 0.71B 31.9B 24.6 2.79 2.52 35.5 1.18 39.2 1
≥498 hrs Standard 26 21.9 0.95AB 32.1B 24.3 2.69 2.53 42.4 0.99 58.8 1.16
Lo Ca 28 22.0 0.88AB 36.3A 24.0 2.76 2.63 38.6 1.52 50 1.44
Choice 29 21.6 1.24A 34.4AB 24.2 2.67 2.49 38.1 1.32 56.8 1.52
P= 0.12 0.06 0.05 0.43 0.05 0.75 0.85 0.38 0.85 0.38 <498 hrs 127 22.3A 0.79B 33.2 23.9 2.75 2.55 38.3 1.21 43.2B 1.04B ≥498 hrs 83 21.8B 1.03A 34.3 24.2 2.71 2.55 39.7 1.28 55.2A 1.4A
P= 0.005 <0.001 0.23 0.50 0.23 0.99 0.07 0.45 0.07 0.45 Standard 69 22.1 0.86 33.1 23.8 2.69 2.51B 42.5 1.05B 54 1.08 Lo Ca 68 22.1 0.81 35.0 23.9 2.76 2.64A 37.7 1.43A 45.6 1.28 Choice 73 22.0 0.98 33.2 24.4 2.73 2.50B 36.8 1.25AB 48 1.28 P= 0.29 0.13 0.11 0.43 0.06 0.01 0.51 0.002 0.09 0.07
Table 3 - Selective intake of Standard and Low Calcium feeds by the Choice fed group.
Hatch time Std intake day 1
LCa intake day 1
Std intake day 2
LCa intake day 2
Std intake day 3
LCa intake day 3
Total Std intake
days 1-3
Total LCa intake days
1-3 <498 hrs EH 3.59 4.90A 5.08 6.60 8.87 7.99 16.4 19.7 ≥498 hrs LH 2.69 3.99B 4.55 5.62 8.29 8.10 16.8 17.4
P= 0.07 0.04 0.50 0.17 0.56 0.92 0.85 0.15
Aust. Poult. Sci. Symp. 2016.....27

IV. DISCUSSION The data from chicks sampled at take-off show that the yolk weight of EH chicks is lower than in LH. PCV and yolk P concentration are the same across hatch groups, as well as total yolk Ca. Total yolk P of EH is lower than in LH, and yolk Ca concentration is higher in EH. This indicates EH chicks have drawn water and P out of the yolk, leaving behind Ca – which increases in concentration as the rest of the yolk sac is utilised. The fasting chicks would have initially had elevated serum Ca levels which would inhibit secretion of parathyroid hormone (PTH) and stimulate secretion of calcitonin (CT) (Greco and Stabenfeldt, 1992). A diminished PTH level would decrease conversion of vitamin D to the active form (1,25-dihydroxycholecalciferol; Simkiss, 1991) in the kidney (Greco and Stabenfeldt, 1992). The lowered activated vitamin D would decrease yolk absorption of Ca (Moran, 2007). The stimulation of CT would decrease mobilization of Ca from bone and tend towards hyperphosphataemia. By day 3, EH birds are longer, continue to have a lower residual yolk sac weight, and correspondingly have lower Ca and P totals in the yolk. Yolk and serum Ca and P concentrations are not significantly different. The intake of feed allows the EH birds to utilise Ca and P more efficiently from the yolk, compared to the impaired uptake of yolk Ca in unfed EH birds.
The lower yolk and serum P concentration of Std fed birds on day 3 compared to birds fed the LCa diet indicate that the higher calcium content and lower phosphorus content of the Std diet caused the chicks to absorb less calcium and more phosphorus from the yolk sac. The higher feed level of calcium induced a negative feedback on the regulation of calcium uptake from the yolk sac. This regulation is controlled by the active form of vitamin D3 (1,25-dihydroxycholecalciferol; Simkiss, 1991). Similarly the lower Ca: P ratio in the LCa diet may have had a sparing effect on yolk P uptake by the chick. This would have been mediated through hormonal feedback mechanisms.
Bone ash at day 3 for the male Std fed birds were numerically lower than the LCa fed cohort and this was a significant difference for LH (Table 2). The Choice fed group were intermediate. The LCa pre-starter diet seems to have improved the Ca:P ratio of male LH birds, increasing bone mineralisation.
The feed intakes by the Choice fed birds show that the EH chicks (i.e. longer fasted birds) consumed more of the LCa feed in the first day. This may represent a purposeful choice to replenish their phosphorus reserves. This effect only lasted for the first day. The homeostatic capacity of the day old chick is well developed and there is a need to better understand the physiological effects of a prolonged period of fasting in a chick with a yolk nutrient reserve. The results from this study strongly suggest that the day old chick regulates calcium uptake based on both feed and yolk intakes. This needs to be considered when formulating pre starter rations, to enable the chick to have an optimal Ca:P ratio. ACKNOWLEDGEMENTS: RIRDC funded the operating costs of the project, Poultry CRC funded student scholarship, PRF team for their help.
REFERENCES Greco D & Stabenfeldt GH (1992) Textbook of Veterinary Physiology 2: 432-439. Groves PJ & Muir WI (2014) PLOS ONE 9: e102682 Moran ET Jr. (2007) Poultry Science 86: 1043-1049. Rocky TS & Tamao ONO (1986) Journal of Embryology 97: 63-74. Simkiss K (1991) Fluxes during embryogenesis, In: ‘Egg incubation: its effects on embryonic
development in birds and reptiles’ (Eds. DC Deeming & MWJ Ferguson, Cambridge University Press, UK) pp. 47-52.
Aust. Poult. Sci. Symp. 2016.....27
63

EFFECTS OF CRUDE ILEAL AND CAECAL FLORA MIX ON NECROTIC ENTERITIS
C. KEERQIN1, S.B. WU1, R. SWICK1, B. SVIHUS2 and M. CHOCT3
We investigated the effect of a cloacal administration of crude caecal or ileal contents from previous necrotic enteritis (NE) resistant birds to young broilers to determine whether this practice would provide protection against NE.
A 2 × 3 factorial design with birds challenged with or without NE, and given via the cloaca a crude caecal flora extract, a crude ileal flora extract, or sterile broth. Each treatment had six replicates of 13 birds each. A total of 468 male day-old Ross 308 birds were raised on floor pens for five weeks with feed and water provided ad libitum. All treatments received diets meeting the standard Ross 308 broiler nutrition specifications (starter diet d 0 to 13, grower diet d 13 to d 23 and finisher diet d 23 to d 35). Crude flora from the ileum and cecum were obtained from a previous NE challenge survivor birds (5 days post NE challenge). Crude flora was stored in anaerobic broth at -20ºC with 20% glycerol until a cloacal administration to birds at d 6. NE challenge was conducted per os Eimeria spp. challenge on d 9 followed by C. perfringens on d 14 and 15 as previously reported (Rodgers et al., 2015).
The NE challenge substantially increased FCR at d 24 (P < 0.001) while 4 points of difference remained at d 35 (P < 0.001). Lesion score among sampled birds on d 16 suggested a mean value of 0.174 in challenged groups compared with a mean value of 0.044 in unchallenged groups. Birds that received the crude caecal and ileal flora had significantly (P < 0.05) lower FCR than the sham treatment by d 35, suggesting that the crude microflora enhanced bird performance with the presence of NE in the flock.
Table 1 - Feed conversion ratio (FCR) of male broilers with or without challenge and three cloacal administration treatments.
Factor d13 FCR d24 FCR d35 FCR Main effects
Challenge - 1.046 1.257 b 1.383 b + 1.054 1.316 a 1.421 a
p-value >0.05 < 0.001 < 0.001
Contents of cloaca
administration
Sham treatment 1.051 1.291 1.418a Caecal flora 1.048 1.286 1.394b Ileal flora 1.052 1.282 1.394b p-value 0.890 0.723 0.037
Interactions (P values) challenge*reverse inoculation >0.05 >0.05 >0.05
Rodgers NJ, Swick RA, Geier MS, Moore RJ, Choct M & Wu S-B (2015) Avian Dis. 59: 38-
45.
1 University of New England, Australia; [email protected] 2 Norwegian University of Life Sciences, Norway. 3 Poultry Cooperative Research Centre, Armidale, NSW 2351, Australia.
Aust. Poult. Sci. Symp. 2016.....27
64

EFFECT OF ELEVATED DIGESTIBLE AMINO ACIDS IN HIGH CANOLA MEAL DIETS ON FEED CONSUMPTION AND PERFORMANCE OF BROILER CHICKENS
M. TOGHYANI1, G. CHANNARAYAPATNA2, S.B. WU1 and R.A. SWICK1
In a previous study, we observed that broiler chickens fed high canola meal (CM) diets had lower feed intake (FI) and body weight gain (BWG) compared to the birds fed a soybean meal (SBM) based diet (Toghyani et al., 2015a). The ME content and amino acids (AA) digestibility of the CM used, was determined through bio-assays (Toghyani et al., 2014, 2015b). Subsequently, diets were formulated to be iso-caloric and iso-nitrogenous and the glucosinolate content of CM diets were determined to be less than 4 μmol/g of diet. It was therefore of interest to determine if reduced FI of birds fed CM based diets accounts for performance decline and if this retarded growth rate can be mitigated by increased digestible AA levels in the diet. Accordingly, a feeding experiment was conducted with 5 diets formulated as follow: SBM diet, high CM diet with normal AA concentration and high CM diets with 3, 6 or 9 % additional AA concentration, keeping the same digestible AA ratio to lysine in all CM diets. Digestible AA to include were Lys, Met, Cys, Ile, Arg, Thr and Val. All diets were fed ad libitum over the grower (d 10-24) and finisher (d 24-35) periods. Another group of birds were paired-fed with SBM diet to the consumption of birds fed high CM diet with normal AA (105 % of previous day FI). Male broiler chicks (Ross 308) were fed a common commercial starter diet for the first 10 days of age, and then offered the grower and finisher experimental diets based on a completely randomised design with 6 replicate pens of 17 birds each. High CM in the diet resulted in a significant reduction of FI and BWG (P < 0.05) compared to SBM diet. The SBM paired-fed birds gained same weight with slightly lower FCR compared to the CM ad libitum fed birds. Higher AA in CM diet did not induce any significant impact on FI (P > 0.05) but additional 9 % AA improved FCR (P < 0.05) compared to SBM and CM diet with normal AA. Flock uniformity at day 35 of age was not affected by dietary treatments. These findings suggest that the observed growth retardation of birds fed high CM diets is primarily mediated through reduced FI. Lower palatability due to the presence of tannins and glucosinolate, and also the higher dietary fibre and NSP content of CM diet compared to SBM diet, could have depressed FI. In addition, birds fed CM based diets will benefit from higher supplementation of digestible AA in the diet by improved FCR albeit the body weight gain is not comparable to SBM fed chickens.
Table 1 - Growth performance of broiler chickens over the entire experimental period (day 10-35).
Treatments Feed intake (g/bird)
Weight gain (g/bird)
FCR (g/g)
Flock uniformity (%)
SBM ad libitum 3362 a 2357 a 1.425 a 94.1 SBM paired-fed 3016 b 2236 b 1.348 bc 94.5 CM normal AA 3023 b 2217 b 1.361 b 92.9 CM + 3% AA 3026 b 2257 b 1.340 bcd 93.3 CM + 6% AA 2984 b 2231 b 1.336 cd 93.3 CM + 9% AA 3004 b 2274 b 1.321 d 94.6 SEM 23.63 9.68 0.0059 1.01 P-value <0.001 <0.001 <0.001 0.142
a,d Means in a column not sharing a superscript differ significantly (Tukey test; P < 0.05) ACKNOWLEDGEMENTS: This study was funded and supported by Evonik (SEA) Pte. Ltd. Toghyani M, Rodgers N, Barekatain MR, Iji PA, Swick RA (2014) Poult. Sci. 93: 2227-2236. Toghyani M, Wu SB, Iji PA, Swick RA (2015) Proc. Rec. Adv. Anim. Nutr. 20: 81-82. Toghyani M, Rodgers N, Iji PA, Swick RA (2015) Poult. Sci. 94: 992-1002.
1 School of Environmental and Rural Sciences, University of New England, Armidale, NSW 2351; [email protected]
2 Evonik (SEA) Pte Ltd, Singapore.
Aust. Poult. Sci. Symp. 2016.....27
65

EVALUATION OF A LIGNOCELLULOSE-RICH FIBRE SOURCE AND PARTICLE SIZE ON BROILER GROWTH PERFORMANCE
S.K. KHERAVII1, R.A. SWICK1, M. CHOCT1 and S. WU1
Different strategies have been explored to improve broiler growth performance. Recently, the physical structure of feed ingredients and fibre has gained increasing interest as a nutritional tool to improve broiler performance especially feed efficiency. It is hypothesized that feeding larger particle sized raw materials and increased fibre may improve broiler health and growth performance by increasing gizzard and function (Choct, 2009; Svihus, 2011). However, published data regarding the effect of ingredient particle size, source and physical structure of fibre on broiler performance are inconsistent (Amerah et al, 2007, 2009; Sacranie et al, 2012; Svihus 2011). The present study assessed the impact of dietary lignocellulose and raw material particle size on growth performance up to 35 d in broilers fed a corn-based diet. The experimental design employed a 2 × 3 factorial arrangement of treatments. Factors were: corn particle size - coarse and fine and lignocellulose - 0, 10 and 20g/kg. Each treatment was fed to 6 replicate pens of 19 male Ross 308 broilers from 0-35 d.
Table 1 - Response of broiler performance to lignocellulose and particle sizes at d 24 and 35.
Main effect Feed intake (g/bird) Weight gain (g/bird) FCR d 24 d 35 d 24 d 35 d 24 d 35
Particle size (PS) Coarse corn 1875 3794 1511 2752 1.243b 1.379b Fine corn 1872 3770 1484 2698 1.262a 1.398a Lignocellulose (Lig) 0 g/kg 1873 3770 1505 2741 1.247 1.376 10 g/kg 1867 3778 1493 2716 1.251 1.392 20 g/kg 1882 3797 1494 2719 1.260 1.397 P value Particle size 0.832 0.423 0.092 0.095 0.007 0.023 lignocellulose 0.689 0.749 0.803 0.784 0.304 0.091 PS X Lig 0.522 0.437 0.544 0.555 0.490 0.907
a,b Within a column, values with different superscripts are significantly different from each other at P <0.05.
Birds fed coarsely ground corn had better FCR than those fed finely ground corn (P < 0.05). On day 24 and 35, weight gain of birds fed coarse corn tended (P=0.09) was greater compared to those fed finely ground corn. There were no significant grinding x fibre interactions observed for any performance parameter at d 24 and 35 (P > 0.05). These outcomes suggest that birds consuming coarsely ground corn perform better than those consume finely ground corn. However, lignocellulose did not show significant impact on broiler performance. The results suggest that coarse particle size of grain may improve performance and the effect is greater than addition of lignocellulose.
Amerah A, Ravindran V & Lentle R (2009) Brit. Poult. Sci. 50: 366-375. Amerah A, Ravindran V, Lentle R & Thomas D (2007) W. Poult. Sci. J. 63: 439-455. Choct M (2009) Brit. Poult. Sci. 50: 9-15. Sacranie A, Svihus B, Denstadli V, Moen B, Iji P & Choct M (2012) Poult. Sci. 91: 693-700. Svihus B (2011) W. Poult. Sci. J. 67: 207-224.
1 School of Environmental and Rural Sciences, University of New England; [email protected]
Aust. Poult. Sci. Symp. 2016.....27
66

STUDY ON BROILER PERFORMANCE AND CARCASS CHARACTERISTICS UNDER DIFFERENT BROODING SYSTEMS IN THE TROPICS
M.A. ZAMAN1
Summary
The experiment was conducted with five hundred forty (540) day old broiler chicks of Ross strain to compare performance and carcass characteristics of three brooding systems (charcoal, electric and gas brooding). Experimental birds were fed ad-libitum with starter, grower and finisher diet consisting of 220, 210 and 200 g/kg CP and12.56, 12.77 and 12.98 MJ/kg metabolizable energy (ME). Body weight under gas brooding was recorded the highest of1407gm at 5 weeks of age whereas the highest was 1301gm at 4 weeks of age under charcoal brooding. Body weight gain was highest in gas brooding 399 and 510g at 4th and 5th wk, respectively. Feed intake was significantly different during 2nd and 3rd week of age. Feed conversion ratio was determined same and significantly lower value at 4th and 5th week of age under gas brooding. Mortality was highest (4.93 %) under charcoal brooding (P<0.05). Percentage of blood was significantly different in male where female showed insignificant differences as well as feather. Dressing, cut up and abdominal fat percentage was different (P<0.05) which was insignificantly different by sex. The production cost was 80, 81 and 83taka per kg of live broiler at 4weeks of age and 101, 103 and 98 taka at 5 weeks of age under charcoal, electric brooder and gas brooding, respectively. It reveals that in relation to productivity and cost of production gas brooding was better compared to other two systems.
I. INTRODUCTION Brooding chicks is to efficiently and economically provide a comfortable, healthy environment for growing birds. Temperature, air quality, humidity and light are critical factors to consider. Failure to provide the adequate environment during the brooding period will reduce profitability, resulting in reduced growth and development, poorer feed conversion, and increased disease, condemnation and mortality. Air temperature varies with brooding systems. Researchers found that mortality increased with decreased air temperature during brooding period (Huston, 1965; Renwick et al., 1985; Deaton et al., 1996). Less than optimal brooding management decreased performance, increase feed conversion ratios (Edens et al., 1998).
Bangladesh is a tropical country where, electricity is commonly used in brooding, very rare gas and charcoal are not used. There is lack of electricity and gas in rural areas. But charcoal is available with burning of wood and can be used in brooding to be the most economic option in broiler production. Thus, this study was considered to investigate performance of broiler under three systems of brooding.
II. OBJECTIVES OF THE STUDY 1) To know the production performance of broiler under different brooding systems. 2) To compare carcass characteristics. 3) To estimate cost effectiveness.
1 Chittagong Veterinary and Animal Sciences University; [email protected]
Aust. Poult. Sci. Symp. 2016.....27
67

III. MATERIALS AND METHODS The experiment was conducted to compare brooding systems with five hundred forty (540) day old Ross broiler for 5 weeks. Three treatments of charcoal brooder (T1) which was locally made using tin, sand, iron pot and wood charcoal; electric brooder of 500 capacity (T2) and gas brooder of 60 capacity (T3). Each treatment was replicated thrice with 60 chicks each. Thermometer was hanged to record the temperature during brooding of the chicks. Feed formulated with 220, 210 and 200 g/kg of CP and12.56, 12.77 and 12.98 MJ/kg ME for starter, grower and finisher were fed ad-libitum and adequate fresh and clean water was supplied during the whole period of experiment. Growth promoter or feed additives were not used to promote growth during the experiment.
Standard schedule vaccination against Newcastle disease, infectious bronchitis and infectious Bursal disease was performed. Body weight, feed intake, weight gain was measured. Mortality was recorded and feed conversion ratio (FCR) was determined. To estimate cost effectiveness the cost per broiler production was determined by calculating of price of chick and cost of feed, fuel/cost of brooding, vaccine, medicine, disinfectant, labour and transport.
At the end of experiment 10% bird from each unit was slaughtered and their blood, feather, dressing and cut up percentage was measured.
All the recorded and calculated data were analyzed for ANOVA (Steel and Torie, 1980) using a completely randomized designed with the help of a computer package SPSS. Significant differences among the treatments were detected to compare mean by using Least Significant Difference (LSD).
IV. RESULTS AND DISCUSSION Results on body weight, feed intake, FCR and mortality are shown in Table 1.Body weight was 1301,1298 and 1264g/bird at 4 weeks of age and 1351, 1348, 1407g/bird at 5 weeks of age under T1, T2and T3, respectively. Body weight gains of 399 and 510g/bird in T3 were the highest at 4th and 5th wk. Comparatively lower weight gain in T1 and T2 may be due to higher fluctuation of the brooding temperature caused by inconsistent heat with burn of charcoal and load shedding of electricity. Further, smoke from charcoal burning caused air pollution in the rearing unit which may have affected growth of the chicken. Wood brooding of commercial broiler has previously shown to have lowest body weight (Ashraf et al., 1996).
At the 1st wk of age feed intake tended to be lower under charcoal brooding. However, significant differences in feed intake were observed at 2nd and 3rd wk although the overall feed intake from weeks 1 to 5 were not significantly different between all brooding systems. Hassanuzaman et al. (2003) reported lowest feed intake of a crossbred chicken under charcoal brooding which supports the findings of the present study.
There were no significant differences in overall FCR values from weeks 1 to 5. However, at their 4thand 5thwk of age FCR was significantly lower in T3 than T2 and T1. The production cost was 80, 81 and 83 taka per kg of live broiler at 4 weeks, 101, 103 and 98 taka at 5 weeks of age in T1, T2 and T3, respectively. Economic system was found in charcoal brooding at 4 weeks and gas brooding at 5 weeks of age.
At end of experiment the mortality was 4.93, 2.94 and 3.11 % for T1, T2 and T3 gas brooder, respectively. This result showed the highest mortality under charcoal brooding 4.93 and lowest mortality was under electric brooding 2.94. There was no significant difference between the electric and gas brooding systems but there was a highly significant difference between charcoal and the other two types of brooding (P<0.05). The highest mortality of chicks in the charcoal brooding may be due to the fluctuation of temperature at early age and undesirable gases produced by the charcoal brooder. Bruzual et al. (2000) reported higher
Aust. Poult. Sci. Symp. 2016.....27
68

mortality with fluctuation of air temperature. Table 2 shows significantly highest blood (3.7 %) in male for T2 and insignificantly highest 3.63 % in female for T3. The highest feather was 3.74 in male for T1 and lowest 5.28 in female for T1. There were no significant differences in the percentage of feather both for male and female among the treatment groups.
The average mortality was 4.93, 2.94 and 3.11 % for T1, T2 and T3, respectively. There was no significant difference between the electric and gas brooding systems but there was a significant difference between charcoal and the other two types of brooding (P<0.05). The highest mortality of chicks in the charcoal brooding may be due to the fluctuation of temperature at early age and undesirable gases produced by the charcoal brooder. Bruzual et al. (2000) reported higher mortality with fluctuation of air temperature.
Table 1 - Performance of broiler under different brooding systems.
Parameters
Age in week
Treatment means T1
Charcoal brooding T2
Electric brooding T3
Gas brooding Body weight (g/bird)
Age of 4 weeks Age of 5 weeks
1301a 1351b
1298a 1348b
1264b 1407a
Body weight gain (g/bird) 4thwk 5thwk
Feed intake (g/bird) 1st wk
370 463
145
392 498
149
399 510
150
2nd wk 306c 332a 323b 3rd wk 445c 457b 465a 4th wk 707 713 710 5th wk 908 913 908
Feed intake Age of 5 weeks
FCR Age of 5 weeks
FCR 4th wk 5th wk
2511
1.86
1.91a
1.96a
2564
1.90
1.82b
1.83b
2556
1.82
1.78c
1.78c Mortality%
Age of 5 weeks
4.93a
2.94b
3.11b
Cost per kg live broiler Age of 4 weeks Age of 5 weeks
80.00 101.00
81.00 103.00
83.00 98.00
a,b,c Values in the same row with the different superscripts differ (P<0.05) There were no consistent effects of brooding systems and sex on percentage of blood
content which varied from 3.7 % in male for T2 and 3.29 % in male for T1. The feather percentage appeared to be higher in female than that in male although there was no significant difference between male and female among the treatment groups.
There were no significant differences in dressing and Thai meat percentage among the treatment groups for female and male. Thai and Back meat were highest with insignificant difference in female 17.79 %for T2 and14.5% for T1.
Aust. Poult. Sci. Symp. 2016.....27
69

Breast meat, back meat, wing meat and giblet were significantly different (P<0.05) among the treatments in male. Breast meat and back meat was highest 18.41 and13.98 % for T3 and wing meat and giblet was highest 8.37 and 8.4% for T2. There were no significant differences in back meat and giblet percentage among the treatment groups for female. The highest back meat and giblet were 13.92 and 5.9 % for T3. The mean abdominal fat percentage was lowest in male for T1 (Table 2). However, the differences in abdominal fat percentages were not statistically significant.
Table 2 - Blood, feather and dressing and cut-up percentage of broiler by sex under different brooding systems.
Parameters (% of live weight)
Treatment means
T1 T2 T3 Male Female Male Female Male Female
Blood 3.29b 3.36ab 3.7a 3.59ab 3.46ab 3.63ab Feather 3.74 5.28 3.60 5.43 3.59 5.43
Dressing 71.69b 71.60ab 72.27a 71.54ab 72.67a 72.58ab Thai meat 17.98 17.25 17.79 17.79 17.93 17.19
Breast 16.34f 16.83e 17.56d 17.83c 18.41a 18.14b
Back meat 13.18b 14.5a 13.16b 13.39ab 13.98a 13.92ab Giblet 5.2b 5.2b 8.4a 5.6ab 5.4b 5.9ab
Wing meat 8.05f 8.82a 8.37b 8.28d 8.16e 8.31c
Abdominal Fat 1.26 1.47 1.38 1.44 1.40 1.47 a,b,c,d,e,f, Values in the same row with the different superscripts differ (P<0.05).
V. CONCLUSION The result of the study reveals that the gas brooding performed better compared to other brooding systems. Although all of the systems were shown good in brooding but charcoal brooding can be the most useful option in rural production system where electricity is not available. Further, it can be an efficient brooding system in production of lean meat of broiler with an issue of food safety.
REFERENCES Ashraf et al., (1996) Pakistan Poultry Science Journal 5: 103-107. Bruzual JJ, Peak SD, Brake J & Peebles ED (2000) Poultry Science 79: 1385-1391. Deaton JW, Branton SL & Lott BD (1996) Poultry Science 75: 1217-1220. Edens FW, Joyce KA, Parkhurst CR, Havenstein GB & Qureshi MA (1998) Poultry Science
77: 411-415. Hassanuzzaman M, Ahammad MU, Bulbul SMA, Nurul Alam MM & Islam MA (2003)
Asian-Australasian Journal of Animal Sciences 17: 1586-1590. Huston TM (1965) Poultry Science 44: 1032-1036. Renwick GM & Washburn KW (1982) Poultry Science 61: 1279-1289.
Aust. Poult. Sci. Symp. 2016.....27
70

ASSESSING OPTIMAL OUTDOOR STOCKING DENSITY IN FREE-RANGE LAYING HENS
D. CAMPBELL1,2, G. HINCH1 and C. LEE2
Consumer concern for laying hen welfare is leading to an increase in alternative housing systems that provide valued resources designed to cater to hens’ ethological needs. Free-range farming is growing throughout Australia as this system provides an outdoor area for hens to exhibit more natural behaviour such as dust bathing, foraging and sun bathing (Fanatico, 2006). However, there is currently public debate concerning the amount of outdoor space needed to constitute the ‘free-range’ label, and concurrently, a lack of scientific data defining the optimal outdoor stocking density for improved hen welfare. Furthermore, recent evidence shows not all hens choose to access the range daily, with some hens never venturing outdoors (Gebhardt-Henrich et al., 2014; Hinch and Lee, 2014, Richards et al., 2011); questioning the value of outdoor access to hens.
A compilation of behavioural and physiological methods, including RFID tracking of individual hens were used to evaluate range use and hen welfare in response to three different outdoor stocking density treatments (2 replicates/treatment) in an experimental free-range facility at the University of New England, Armidale: Stocking density treatment A: 2000 hens/ha; B: 10 000 hens/ha; C: 20 000 hens/ha. Nine-hundred ISA Brown hens were distributed evenly between six indoor pens (150 birds/pen) with an accompanying varying-sized outdoor range. From 22 – 30 weeks, individual hens’ (50% of population tagged) daily transitions between the indoor pens and outdoor range were recorded using microchip leg bands and an RFID tracking system (Microchips Australia Pty Ltd: Trovan® technology; Dorset Identification B.V., Aalten, Netherlands). False RFID readings were filtered out using custom-built software (Bryce Little, CSIRO) to provide precise records of daily hen movements for each stocking density. All data were analysed using General Linear Models in JMP 12 (SAS Institute, Cary, NC).
Results showed no difference between stocking density treatments in the average number of visits outside per day (P = 0.28), but on average, the hens in the lowest stocking density, spent significantly more time outside each day (P < 0.002). Across all stocking density treatments, hens varied in the proportion of days spent outside, from no range visits across the trial to daily range visits. The proportion of tagged birds that visited the range daily were 71%, 66% and 62% for the A, B and C stocking densities respectively.
These preliminary results show some variation in range use related to range stocking density, however ongoing data collection including behaviour exhibited by hens on the range, use of the entire range area, Welfare Quality® scores of all hens, albumen corticosterone measures and production variables will provide a more complete picture of the influence of outdoor range stocking density on free-range hen welfare. Fanatico A (2006) ATTRA Publication #IP300.
https://attra.ncat.org/attra-pub/summaries/summary.php?pub=222 Gebhardt-Henrich SG, Toscano MJ & Fröhlich EKF (2014) Appl. Anim. Behav. Sci. 155: 74-
81. Hinch G & Lee C (2014) Final Report: Project No 1.5.2. (Poultry CRC LTD). Richards GJ, Wilkins LJ, Knowles TG, Booth F, Toscano MJ, Nicol CJ & Brown SN (2011)
Vet. Rec. 169: 338.
1 University of New England, Armidale, NSW; [email protected] 2 CSIRO, Armidale, NSW; [email protected]; [email protected]
Aust. Poult. Sci. Symp. 2016.....27
71

FREE-RANGING BY LAYING HENS SOON AFTER THE POP-HOLES OPEN
G.M. CRONIN1, K.T.N. TRAN1, K.M. HARTCHER1 and P.H. HEMSWORTH2
Summary Sixteen groups of 50 ISA Brown laying hens were studied during the first 16 days after the pop-holes to their outdoor runs were opened at 26 weeks of age. While there were no differences due to rearing treatments involving beak trimming or environmental enrichment on birds’ initial responses to leaving the shed and progressing along the 10-m-long grassed runs, there were significant effects of pen aspect on range use. In pens with pop-holes opening onto the north / downhill side of the shed, proportionally more hens exited the shed compared to pens on the south / uphill side (Day 1: north v south aspect 16.6% and 7.6% of hens, P = 0.026; Day 2: 22.5% and 5.9%, P < 0.001). In addition, on Day 1 there was an Aspect × Zone interaction (P = 0.005), with more hens on the north /downhill side recorded further along the runs than on the south / downhill side. Although the findings are not conclusive, the observations suggest hens may have entered the range sooner, and progressed further from the shed sooner, initially based on their ability to see further into the range.
I. INTRODUCTION Opening the pop-holes provides laying hens the opportunity to leave the shed and ‘free-range’. However, a proportion of hens don’t leave the shed (Bubier and Bradshaw, 1998; Gilani et al., 2014). While low range use is interpreted by some as a sign of poor hen welfare, others disagree (Gilani et al., 2014). Nevertheless, understanding the motivation of hens to leave the shed, and return for food, water, egg laying and roosting, are probably equally important considerations for hen welfare and efficient egg production. Clearly, research is needed to build knowledge on factors motivating hens to leave the shed and disperse across the range, as well as the stimulus value of the shed interior compared to the outdoor range. The present study was part of a larger experiment investigating the effects of beak trimming (BT) and environmental enrichment (EE) applied during rearing on the development of severe feather pecking in adult free range laying hens. In this paper we describe the proportion of hens leaving the shed, and the distance they dispersed into the runs, in the early days after opening the pop-holes. While there were no effects of BT or EE on the proportion of hens exiting the pop-holes or distance travelled into the range, there was an effect of pen aspect, that is whether the pop-hole faced north compared to south. This paper aims to investigate the effects of pop-hole aspect on initial use of the range by hens.
II. MATERIALS AND METHODS Sixteen groups of 50 ISA Brown laying hens were observed on six days (D1, 2, 4, 6, 11 and 16) after the pop-holes to the outdoor runs were opened. The birds had been reared from day-old in the shed, in a 2 × 2 factorial experiment investigating the effects of BT and EE during rearing on the development of feather pecking behaviour and plumage damage. For detailed descriptions of the experimental treatments, bird management and findings of the main part of the experiment, see Hartcher et al. (2015). The experiment was blocked on side of the shed, and treatment combinations were allotted to pens at random within the sides. The pop-holes separating the shed interior and the outdoor runs were covered by
1 The University of Sydney, Faculty of Veterinary Science, Camden NSW. [email protected] 2 The University of Melbourne, Animal Welfare Science Centre, Parkville VIC. [email protected]
Aust. Poult. Sci. Symp. 2016.....27
72

vertical sliding doors in the rear wall of each pen. Pop-holes measured 0.4 m high × 0.6 m wide, and there was one pop-hole per pen. The sliding door could be opened (and secured) from the front of the pen via a rope and pulley system, meaning that experimenters did not enter pens to open pop-holes. Each pop-hole opened onto individual outdoor runs measuring 1.83 m wide × 10 m long. Runs were defined by 2.1 m high wire mesh fences and overhead cover of wire netting, to prevent hens flying out and aerial predators entering. The first 1.2 m of each run consisted of a metal-roofed verandah (Zone 1). However, the ‘ground’ in Zone 1 differed between the two sides of the shed: The north side consisted of river pebbles, whereas the south side was solid concrete for the first 0.3 m, then a sloped ramp made from (horizontal) metal slats rose up to connect with Zone 2 of the run. Zone 2 (1.2 m wide) had beige shade cloth overhead and on the ground some river pebbles butted up against the grass. The runs on the north side of the shed sloped downhill from the shed, while the runs on the south side sloped uphill (Figs. 1 and 2). Zones 2-5 were amply covered with grass.
Figure 1 - Side-on views of the north (left) and south (right) outdoor runs taken 5 days after the pop-holes were opened giving hens continuous access to the runs. The photographs show the slope of the ground.
Figure 2 - Schematic profile of the north- (left) and south-side (right) outdoor runs showing the slope of the ground across zones (Z1-Z5). The zones were used for estimating bird distance from the shed during observations. The vertical dashed lines represent the virtual boundaries between zones: Z1 was beneath a solid roof, Z2 was beneath shade-cloth, while Z3-Z5 were covered by light-gauge wire mesh. (Diagram not to scale).
In week 25, all 16 pens had achieved 80% hen-day egg production. The present trial
commenced in week 26 at 0900 h, with the pop-holes to the outdoor runs opened sequentially. Four experimenters simultaneously opened one pop-hole each, from a different quarter of the shed. The next four pop-holes were opened 1 min later, and so on until after 3 min the pop-holes of all 16 pens were open. The experimenters then quietly left the shed and sat in chairs located outside the range area adjacent to Zone 2. Each observer monitored the four closest pens of birds, recording the number of hens in the different zones at intervals timed using a stop watch. The distance from the shed was marked using plastic strips woven vertically within the mesh fences, from 1 m above ground. At designated times the number of hens in each pen-zone was counted and recorded. Thus, on Day 1 at 0910 h each observer recorded one pen (i.e. the pen in which the first pop-hole had been opened), and at each successive minute, the next pen was recorded until each observer had counted the number of hens in each
Aust. Poult. Sci. Symp. 2016.....27
73

zone of the four runs under their observation. On Day 1 there were three observation sessions: 8 observations from 0910-1020 h (D1 am), 6 observations from 1100-1150 h (D1 mid) and 12 observations from 1330-1520 h (D1 pm). On Days 2, 4 and 8, two observation sessions were conducted between 1000-1150 h (am) and 1400-1550 h (pm) with hens in each zone counted at 10-min intervals. On Days 11 and 16, a single experimenter conducted observations at 30-min intervals between 1000-1200 h and 1400-1600 h, while quietly and slowly walking around the outside of the free-range facility.
The proportion of hens per pen in each zone per observation day was analysed using a REML linear mixed model in GenStat (release 14.1; VSN International Ltd). Data were normalised using the angular transformation. Initial analyses found no differences due to the BT and EE main effects, and no BT × EE interactions, but there were differences due to the side of the shed (north versus south side: Aspect). REML linear mixed model analyses were then performed on the proportion of hens recorded outside the shed on the six observation days, as well as the proportion of hens recorded per zone, with Aspect and Zone as fixed effects and Pen as the random effect.
III. RESULTS On the first two days the pop-holes were open, proportionally more hens left the shed in pens with a north / downhill compared to south / uphill aspect (Table 1). After combining the data for the six observation days, there was no difference due to Aspect (P = 0.087). However, there were differences due to Day (P < 0.001) with the mean proportion of hens on the range increasing from Days 1 and 2 (~12.5% of hens) to Day 16 (30.8%), and significant Aspect × Day interactions (P < 0.001). In addition, on Day 1 there were proportionally more hens recorded further from the shed in pens with a north compared to south aspect (Aspect × Zone interaction; P = 0.005). For example, on Day 1 the back-transformed proportions of hens per zone in pens on the north were (from Zone 1-5, respectively) 9.5%, 3.7%, 1.6%, 0.4% and 0.7%, while for pens on the south there were 6.4%, 0.3%, 0.1%, 0.0% and 0.0%. Figure 3 shows the mean proportion of hens in the different zones according to side of the shed, in each observation session (Days 1, 2, 4 and 8) or per day (Days 8-11).
Table 1 - Proportion of hens on the range on Days 1, 2, 4, 8, 11 and 16 after opening the pop-holes. (Values shown are angular transformed means, with the back-transformed percentage in parentheses).
Day North aspect South aspect SED P value 1 24.05 (16.6%) 15.96 (7.6%) 3.239 0.026 2 28.27 (22.5%) 14.06 (5.9%) 3.116 <0.001 4 25.68 (18.8%) 22.37 (14.5%) 3.041 0.295 8 26.18 (18.8%) 31.09 (26.7%) 2.287 0.050 11 31.52 (27.3%) 25.60 (18.7%) 2.565 0.037 16 33.79 (30.9%) 33.58 (30.6%) 1.926 0.915
IV. DISCUSSION
While the rearing treatments applied in this experiment (BT and EE) did not influence the proportion of hens leaving the shed, an unexpected result was that more hens initially exited the pop-holes and progressed further into the outdoor runs in pens with a north / downhill compared to a south / uphill aspect.
Opening of the pop-holes exposes naïve hens to novel, fear-provoking stimuli, which might influence motivation to leave the shed. Murphy and Wood-Gush (1978) reported that birds exposed to a strange environment displayed fear and reduced exploration. In the present experiment, opening the pop-holes exposed hens to novel stimuli including brighter lux, wind
Aust. Poult. Sci. Symp. 2016.....27
74

and different ground surfaces. Since Hartcher et al. (2015) did not find differences in fear in these birds due to the BT or EE rearing treatments before the pop-holes were opened, it is not surprising that we also did not find differences between treatments in birds exiting the pop-holes. Grigor et al. (1995) reported that increasing familiarity with the environment by repeated exposure reduced hen latency to enter a novel area. These authors also found that after emerging into the novel area, birds tended to remain close to the (familiar) starting location. Our results support these findings, and on Day 1 of the present experiment proportionally more birds that exited the shed remained in Zone 1 (see Fig. 3). However, while fear responses may inhibit hens exiting the pop-holes or leaving the proximity of the shed to explore, hens may nevertheless ‘visually explore’ a novel area before venturing there. It is tempting to speculate that the differences recorded due to pen aspect were associated with the hens’ ability to see into the runs from the pop-holes. For example, from the pop-holes on the north side of the shed, hens could see further (downhill) into the range including (probably) ground-level at the end of the 10 m runs. Certainly, ground level at the end of the northern runs was visible from Zone 1. In contrast, hens standing in the shed at the pop-holes on the south side could not see the ground beyond Zone 1. Until south-aspect hens walked up the ramp and progressed to Zone 4, the end of the runs would not have been visible.
In conclusion, the findings suggest that pop-hole aspect may have influenced hens’ line-of-sight of ground-level in the runs, perhaps influencing their initial motivation to leave the shed and progress onto the range. Whether the differences were due to pen aspect per se or different ground surfaces in Zone 1 outside the shed (river pebbles compared to concrete and a rising metal ramp), cannot be stated conclusively due to possible confounding. However, by Day 4 after the pop-holes were opened, no consistent differences were detected due to aspect, suggesting hens adapted relatively quickly to the range design differences.
Figure 3 - Mean proportion of hens observed per session or day according to the aspect of the outdoor run (north versus south), in the different zones (Zone 1-5) used to estimate bird distance from the shed. Zone 1 was adjacent to the pop-hole while Zone 5 was 7-10 m from the pop-hole.
ACKNOWLEDGEMENTS: The experiment was funded by Australian Egg Corporation Ltd. We would also like to thank Mary Anne Cronin for assisting with the hen observations.
REFERENCES Bubier NE & Bradshaw RH (1998) British Poultry Science 39: S5-S18. Gilani A-M, Knowles TG & Nicol CJ (2014) British Poultry Science 55: 127-135. Grigor PN, Hughes BO & Appleby M (1995) Applied Animal Behaviour Science 45: 97-108. Hartcher KM, Tran KTN, Wilkinson SJ, Hemsworth PH, Thomson PC & Cronin GM (2015)
Applied Animal Behaviour Science 164: 64-72. Murphy LB & Wood-Gush DGM (1978) Biology of Behaviour 3: 39-61.
Aust. Poult. Sci. Symp. 2016.....27
75

IS RANGE USE RELATED TO FEARFULNESS AND PLUMAGE DAMAGE?
K.M. HARTCHER1,2, K.A. HICKEY1, P.H. HEMSWORTH3, G.M. CRONIN1, S.J. WILKINSON1 and M. SINGH1
Severe feather-pecking (SFP), a highly detrimental behaviour in the poultry industry, is thought to be negatively correlated with range use in free-range systems (Lambton et al., 2010). In turn, range use may be inversely associated with fearfulness (Grigor et al., 1995), where fearful birds are less likely to venture outside. However, very few experiments have investigated this association, and little is known about how fearfulness and range use may be related. This experiment investigated associations between range use (time spent outside), fearfulness, plumage damage (as an indication of the occurrence of SFP in a group), weather variables, and body weight.
Two pens of 50 ISA Brown laying hens (n = 100) were fitted with Radio Frequency Identification (RFID) transponders at 26 weeks of age. Range use data were then collected over a period of 13 days, and weather variables were obtained from the Australian Bureau of Meteorology. Ninety-five percent of birds accessed the outdoor run more than once per day, for an average duration of 6.1 h over 11 visits, per bird per day (51.5 min per visit). Two distinct subpopulations were then identified based on total time spent outside over 13 days: the top and bottom 15 range users (n = 30). At 29 weeks of age, these birds were feather-scored, weighed, and subjected to a tonic immobility (TI) test, a well-validated behavioural test used to estimate fearfulness.
Birds with longer TI durations spent less time outside (P = 0.01). Birds exhibited plumage damage, but there were no associations between range use and plumage condition or body weight (P > 0.1). Birds spent longer outside when some wind was present, compared to calm days, but there were no effects of temperature or wind speed on range use (P > 0.1). The small group sizes used in this experiment may have been conducive to the high proportion of birds utilising the outdoor range area. Although the technology presented some technical difficulties, a large amount of data was collected on range access. RFID technology provides a potential means for quantitatively assessing range use in laying hens.
The findings suggest that there may be a negative association between fearfulness and range use. The relationships between range use, fearfulness and SFP warrant further research. Data obtained from automatic tracking systems should be combined with other measurements including physiological, nutritional, and behavioural. In this way, automatic tracking systems such as RFID may be used to their full potential and a more holistic understanding of bird behaviour, welfare and productivity may be attained.
ACKNOWLEDGEMENTS: The authors gratefully acknowledge Mr Tugrul Durali, who originally acquired the RFID technology for his own PhD trials, for his generous help and advice. The authors also thank Associate Professor Peter Thomson and Dr Evelyn Hall for their advice on data analyses. This research was conducted within the Poultry CRC, established and supported under the Australian Government’s Cooperative Research Centres Program, with research funding provided by the Australian Egg Corporation Limited.
Grigor PN, Hughes BO & Appleby MC (1995) Appl. Anim. Behav. Sci. 44:47-55. Lambton SL, Knowles TG, Yorke C & Nicol CJ (2010) Appl. Anim. Behav. Sci. 123:32-42.
1 Poultry Research Foundation, University of Sydney, Camden, NSW 2570; [email protected] 2 Poultry CRC, PO Box U242, University of New England, Armidale NSW 2351. 3 Animal Welfare Science Centre, University of Melbourne, Parkville, VIC 3010.
Aust. Poult. Sci. Symp. 2016.....27
76

USE OF DIFFERENT OUTDOOR AREAS IN COMMERCIAL FREE-RANGE LAYERS USING RFID TECHNOLOGY
H. LARSEN1, G.M. CRONIN2, C.L. SMITH3, P.H. HEMSWORTH1 and J-L. RAULT1
There has been on-going debate between stakeholders in regard to ‘what defines free-range?’ However there is little scientific understanding about the way hens utilise the free-range area in commercial settings. Radio frequency identification (RFID) technology allows tracking individual hens to monitor use of the outdoor range. Such technology has been used previously on experimental (Richards et al., 2011) and commercial layer flocks (Gebhardt-Henrich et al., 2014), and has proved to be much more precise than observations at the flock level. However, this technology has not yet been used to assess range use on Australian commercial layer farms. Additionally, no study has used RFID technology to assess how far hens range from the shed.
This study determined the frequency and duration of use by individual laying hens of different zones in the outdoor environment based on RFID tracking technology; thereby providing an estimate of overall range use and distribution throughout the range. A commercial shed that housed 18000 40-wk old HyLine-Brown laying hens was subdivided to incorporate an area large enough for approximately 2000 hens, with a wintergarden extending 2m from shed, a close range area extending 9 m from wintergarden and a rotational paddock extending a further 35 m. Movement data between each area were obtained for 353 randomly chosen hens during range access (≈0950 h to 1900 h on 13 days in winter).
A total of 85.6% of the hens used the outdoor area on at least one of the days, and 68.8% entered the outdoor area on all days. Of the hens that entered the range, 3.3% only entered the wintergarden, 10.3% entered the wintergarden and close range, and 86.4% entered all three areas. Average time spent outside was < 3 h for 29.1%, > 3 h for 68.9%, and > 6 h for 2.0% (6 hens). For the hens that used all three areas of the range, 57.7% of the time was spent in the wintergarden, 26.0% in the close range, and 16.3% in the far range area. The average time spent during a single visit to each area was 21.4 min for the wintergarden, 12.4 min for the close range and 15.6 min for the far range.
These results show that the proportion of hens utilising the outdoor area is larger than suggested from previous observational studies of whole flocks, and that a large proportion of hens not only utilise the outdoor area, but do so on a daily basis. Additionally, the wintergarden is a highly preferred area, although most hens will also range at least 9 m from this area. Despite spending several hours in the outdoor range, hens are spending on average less than 22 minutes in each area at one time, suggesting multiple movements between areas. This study is the first to show individual ranging data on commercial Australian layer farms, and provides valuable insights into outdoor ranging behaviour. These results are part of a larger study that incorporates both behavioural and physiological welfare assessments. ACKNOWLEDGEMENTS: Project was partly funded by AECL and student support was partly funded by Poultry CRC. Gebhardt-Henrich SG, Toscano MJ & Fröhlich EK (2014) Appl. Anim. Behav. Sci. 155: 74-81. Richards GJ, Wilkins LJ, Knowles TG, Booth F, Toscano MJ, Nicol CJ & Brown SN (2011) Vet.
Rec. 169: 338-338.
1 Animal Welfare Science Centre, University of Melbourne; [email protected]; [email protected]; [email protected]
2 Faculty of Veterinary Science, The University of Sydney; [email protected] 3 Macquarie University, Sydney; [email protected]
Aust. Poult. Sci. Symp. 2016.....27
77

WANDERERS VERSUS STAY AT HOME: WHO HAS THE BETTER GUTS?
M. SINGH1,2, C.E. HERNANDEZ3,4,5, C. LEE4, G. HINCH5 and A.J. COWIESON6
Summary The aim of this study was to examine the differences in gut characteristics and digestibility of nutrients in birds that utilise the range differently. Two hundred, 63 week old, ISA brown birds at full lay were tagged with RFID (radio-frequency identification) transponders and studied for their use of the range over four weeks. Sixteen percent of the birds never accessed the range, while 63% of birds went out on the range every day. Birds that used the range were further characterised based on frequency and duration of visits to the range. Significant differences were seen, both for gizzard and gut weight, and digestibility of nutrients such as DM and energy between birds that never accessed the range and those that accessed it often. Birds that accessed the range more frequently but with shorter durations per visit showed improved gut characteristics, while birds that had a low frequency of visits but longer duration per visit showed better digestibility of nutrients.
I. INTRODUCTION
In free range systems, use of the range area is perceived to benefit hen welfare by lowering the density of birds indoors, increasing access to resources, allowing birds to perform natural behaviours and providing an enriched environment (Richards et al. 2011). It has been identified in many studies that a large proportion of hens use the range on a regular basis, while others rarely or never visit the range (Bubier 1998, Hegelund et al. 2005, Zeltner & Hirt, 2003). The challenge is how to feed an ‘average’ bird in this population. Birds with access to the range eat pasture, seeds, soil and insects and exhibit greater incidences of running, walking, and wing flapping reflecting greater freedom of movement (Lomu et al. 2004). However, this results in a change of nutrient availability and utilization. The consumption of different materials on the range may facilitate gizzard development, potentially resulting in better nutrient utilisation (Svihus 2012). Moreover, there are differences in the way birds access the range. This study aims to characterise populations based on the duration and frequency of visits to the range and evaluate the differences in gut characteristics and digestibility of nutrients between the non-users versus range users.
II. MATERIALS AND METHODS
All experimental procedures conducted in this study were in accordance with the CSIRO Chiswick Animal Ethics Committee and with the Australian code for the care and use of animals for scientific purposes (National Health and Medical Research Council, 2004).
A total of 200 ISA Brown laying hens, 63 weeks of age, were tagged with Radio Frequency Identification (RFID) tags. The birds were housed in an indoor barn with access to an outdoor area at the CSIRO, Chiswick facility in Armidale, NSW. Feed and water were provided ad libitum inside the barn. Hens were fed commercial layer pellets with 18% crude
1 Poultry Research Foundation, the University of Sydney, Camden, NSW 2570; [email protected] 2 Poultry CRC, Armidale, NSW 2351, Australia. 3 Swedish University of Agricultural Sciences, Department of Animal Nutrition and Management, Uppsala,
Sweden. 4 CSIRO, Agriculture, Locked Bag 1, Armidale, NSW 2350, Australia. 5 School of Environmental and Rural Science, University of New England, Armidale, NSW 2351, Australia. 6 DSM Nutritional Products, Kaiseraugst, Switzerland.
Aust. Poult. Sci. Symp. 2016.....27
78

protein, 3.5% fat and 5.5% fibre. An indigestible marker (acid insoluble ash; AIA) (Celite 281, Filchem Australia Pty Ltd, Castle Hill, NSW, Australia) was added to diets at a concentration of 20 g/kg to estimate the apparent ileal digestibility coefficients (AIDC) for dry matter, crude protein and energy, and their digestible content was calculated as per Ravindran et al. (2001). Individual body weight (BW), average feed intake (FI) and daily egg production (DEP) was measured for all birds during the trial.
Employing RFID technology, individual hen movement between the indoor and outdoor area was recorded using RFID antennas and light-beam sensors fitted to ‘pop-holes’. Data were collected daily from 09:30 to16:00h for 28 contiguous days to identify variation in outdoor use. The system was able to individually identify the birds as they passed through the pop-holes and also record the date and time. On day 28, based on the RFID data, birds were classified into non-range (NR) users and range users. Range users were further classified according to duration and frequency of visits (low frequency, long visits (LL) and high frequency, short visit (HS)). Thirty-six birds were selected (12 birds each in three sub-populations), weighed and euthanized and the contents of the distal half of the ileum collected. Ileal contents were immediately frozen at -18ºC prior to being freeze-dried and ground to pass a 0.5 mm screen. Gizzard pH, gizzard weight and gut weight were also recorded for each bird.
All data were exported to JMP v9.0 (SAS Institute, Cary, NC, USA) and subjected to analysis of variance. Means were separated by Tukey’s HSD and were considered significant at P < 0.05.
III. RESULTS
An average of 149 eggs were produced per day (74.5% hen-day production) with feed conversion efficiency (FCE) 2.17. and an average of three eggs per day being dirty, broken, or laid outside the nest box during the trial.
While 16% of the birds never went out on range, 84% accessed the range on at least one day. Sixty-three percent of birds went out on range every day. Birds visited the range on avearge 253 times and spent an average of 80 h on range. The maximum time spent on the range on a single visit was 0.58 h and the minimum was about 0.04 h.
Birds that accessed the range on all days were further classified according to duration and frequency of visits as in Table 1.
Figure 1- Selection of twenty four RFID-tagged hens from LL and HS categories.
Aust. Poult. Sci. Symp. 2016.....27
79

Table 1 - Characterisation of birds based on duration and number of visits to the range.
Classification of range users Average time outside (h)
Average duration per
visit (h)
Average frequency
of visits (n)
% of birds
Non-range users (NR) 0 0 0 16% Daily range users
Low frequency, Long visits (LL)
107
0.44
241
33% High frequency, Short visits (HS) 90 0.18 491 30%
A total of 36 birds were selected from the three categories specified in Table 1 (12 per
category). The twenty four range users from LL and HS categories were characterised on the basis of frequency and duration of visits as shown in Figure 2. The average body weight gain was significantly higher (P < 0.05) by 48 g in LL and 16 g in HS as compared to NR birds after 28 days of trial (Table 2). Gizzard pH, although not significantly different, was lower for HS birds as compared to LL or NR.
Table 2 – Performance and gut characteristics of sub-populations of hens based on range usage.
Sub-population BWG
(wk 63-67)
Gizzard pH
Gizzard weight (g)
Gut weight (g)
RGW RGuW
LL 79a 4.84 40.92b 72.85a 2.18%ab 3.87%a HS 47ab 4.77 46.45a 74.84a 2.41%a 3.89%a NR 31b 4.93 41.00b 67.01b 2.05%b 3.36%b Pooled SEM 0.011 0.15 1.35 1.73 0.088 0.12 P-value * NS ** ** * ** BWG=Average body weight gain, RGW=Relative gizzard weight (% of body wt, RGuW=Relative gut weight (% of body wt. Means in columns with no common superscript are significantly different *(P<0.05); **(P<0.01)
Gizzard weight was significantly higher (P < 0.01) for HS birds compared to the NR
and LL, while for gut weight, both LL and HS were significantly higher than NR (P < 0.01). HS birds also showed significantly higher RGW (relative gizzard weights as % of body weight) (P<0.05) and RGuW (relative gut weight as % of body weight) (P<0.01) as compared to LL and NR (Table 2). LL birds showed significantly improved apparent ileal digestibility coefficient (AIDC) of dry matter (DM) (P<0.05) and energy (ME) (P<0.05), followed by birds in HS and NR populations. Apparent digestible energy (ADE) was also significantly higher (P<0.05) in LL, followed by HS and NR. No effect was however evident for the digestibility of nitrogen (N) or digestible nitrogen content(DNC) between the categories (Table 3).
Table 3 - Influence of range usage on the digestibility of dry matter, energy and nitrogen.
AIDC (% ) ADE DNC Sub-population DM ME N (MJ/kg) (g/kg) LL 0.74a 0.75a 84.96 11.37a 1.86 HS 0.68ab 0.71ab 82.37 10.70ab 1.81 NR 0.63b 0.64b 78.31 9.69b 1.72 Pooled SEM 0.027 0.03 2.07 0.45 0.045 P-value * * NS * NS Apparent ileal digestibility coefficient (AIDC) of dry matter (DM), energy (ME), and nitrogen (N) and apparent digestible energy (ADE) and digestible nitrogen content (DNC). Means in columns with no common superscript are significantly different * (P<0.05).
Aust. Poult. Sci. Symp. 2016.....27
80

IV DISCUSSION Functionality of the digestive tract in birds is pivotal for optimal performance, and access to the outdoor range appears to influence digestive function. A multi-modal distribution of birds was observed, with a proportion of the flock using the range routinely and a proportion using the range rarely, if at all. Use of the range resulted in higher body weight gain compared to birds with no range access, probably due to increased gut modulation and nutrient utilisation. Increased frequency of visits on the range was directly related to increased gizzard and gut weights. Forage and grit stones ingested on range are structural components which strongly stimulate gizzard development (Steenfeldt et al. 2007, Hetland et al. 2003). Thus, it is logical to assume that birds in a free-range system will benefit from a more developed gizzard, which will potentially improve nutrient utilization and gut health. It is also possible that access to an outdoor area will increase retention time in the crop, and thus potentially improve efficacy of the digestion process (Svihus, 2012). Birds with lower frequency but longer duration of visits (LL) showed a significantly improved DM digestibility and ADE. However, the digestibility values for birds that had access to the range did not account for the ingestion of grass, soil, grit, insects and other components of the range. These might have a different AIA value to the 20 g/kg added in the complete diet and may therefore have some implications in the digestibility estimates reported in this study. Steenfeldt et al. (2007) found high rates of fibre digestibility in layer hens fed large amounts of roughage. The above-mentioned strong adaptive capacity of the caeca may also result in significant increases in fermentative capacity of layer hens kept for long periods with access to forage. In conclusion, increasing range access is a promising strategy to improve gut characteristics and digestibility of free-range layers, but the type of benefit may depend on the nature of range usage by the birds. ACKNOWLEDGEMENTS: The authors are grateful to the Poultry CRC for the financial support of this study and to the staff at CSIRO, Chiswick for all their help with rearing and sampling of the birds.
REFERENCES
Bubier NE (1998) British Poultry Science 39: 5-6. Hegelund L, Sørensen JT, Kjær JB & Kristensen IS (2005) British Poultry Science 46: 1-8. Lomu MA, Glatz PC & Ru YJ (2004) International Journal of Poultry Science 3: 728-732. Ravindran V, Selle PH, Ravindran G, Morel PCH, Kies AK & Bryden WL (2001) Poultry
Science 80: 338-344. Richards GJ, Wilkins LJ, Knowles TG, Booth F, Toscano MJ, Nicol CJ & Brown SN (2011)
Veterinary Record 169: 338-358. Steenfeldt S, Kjaer JB & Engberg RM (2007) British Poultry Science 48: 454-468. Svihus B (2012) Proceedings of the Australian Poultry Science Symposium 23: 7-13. Zeltner E & Hirt H (2003) British Poultry Science 44: 533-537.
Aust. Poult. Sci. Symp. 2016.....27
81

IDENTIFYING FEATHER PECKING AND FEATHER EATING ISA BROWN HENS USING ARTIFICIAL FEATHER PRESENTATION
K.M. PRESCILLA1, G.M. CRONIN, S. LIU and M. SINGH
Summary
A total of 202 individually housed Isa Brown hens were presented with feathers on an artificial substrate to determine their feather appetite. Behaviour observations were also conducted on 59 birds to measure latency to peck at the feathers, number of feather pecking bouts, and numbers of feathers pecked, pulled and eaten in a 30-s period. The majority of birds showed an apparent strong interest in the feathers, with approximately 70% removing all presented feathers on at least one day by the end of the trial. Sixty-six percent of the individually observed birds consumed at least one feather during the course of the trial, however feather eating behaviour varied. Latency to peck at presented feathers was lower (P < 0.05) in feather eating compared to non-feather eating birds. Significant differences between individual birds were found in relation to feather removal within 2 hrs and latency to peck (P < 0.001).
I. INTRODUCTION Feather pecking and subsequent cannibalism outbreaks are the two of the main welfare concerns associated with free range egg production. Both have been linked to dietary nutrient deficiencies with Wylie et al. (2003) suggesting that feather eating behaviour indicates an attempt by the bird to obtain something that the feather can provide. Although feather keratin typically represents 85% of feather protein, digestibility of keratin by the bird is very poor and it is unclear whether birds are able to digest feathers to any degree (Leeson and Walsh, 2004). However, consumption of feathers does suggest potential nutritional motivations behind the behaviour, either for a specific nutrient, or for insoluble structural fibre. The aim of this trial was to investigate the population dynamics of a layer flock regarding preference and appetite for feathers. It was hypothesised that feather eaters (FE) would show a much stronger interest in the feathers based on the number of feathers removed from an artificial substrate, number of feathers eaten, and latency to peck at the feathers, compared to non-feather eaters (NFE).
II. METHOD A total of 202 individually housed Isa Brown hens were obtained from a commercial supplier at 16 weeks of age and given four weeks to habituate. Hens were fed standard commercial mash diet provided ad libitum and water was provided from nipple drinkers located at the back of the cages. Clear plastic lids measuring 17 × 12 cm were drilled with a total of ten 1.8 mm-diameter holes and suspended in front of cages for 14 days to familiarise the hens to the device. Feathers were presented in the form of 4-6 cm long semi-plumes and downy feathers placed in the holes in the plastic lids and suspended in front of the cages on days 1, 3, 5, 8, 10, 15, and 17 of the trial. Hens were initially presented with 5 feathers, but this was later increased to 10 feathers for the final 3 days when feathers were presented in the trial. The number of feathers remaining on the substrate was counted after 30 min, 1 h, and 2 h. A total of 59 birds were randomly selected and individually observed upon presenting the feathers. Latency to peck, and number of pecking bouts, feathers pecked, feathers pulled and feathers
1 Poultry Research Foundation, The University of Sydney, Camden , NSW; [email protected]
Aust. Poult. Sci. Symp. 2016.....27
82

eaten were recorded. Latency to peck was limited to 30 s, with observations stopping if birds did not peck within 30 s. All other measurements were taken within a 30-s period after the first pecking bout was observed. Statistical analyses were computed using GenStat 16th Edition (VSN International Ltd, Hemel Hempstead, UK). Means were compared using ANOVA, and were considered significantly different at P < 0.05. Differences between means were compared using Fishers Protected Least Significant Difference Test.
III. RESULTS Significant differences were found between birds (P < 0.001) in relation to the proportion of feathers removed from substrate within 2 h of presentation on all days. Approximately 49.5% of the birds showed a strong interest in presented feathers, based on all feathers being removed from the substrate within 2 h on day 1. This proportion increased to 63.4% on day 17. Significant differences in the proportion of feathers removed were also observed between trial days with 55.7% feathers removed on day 1 of the trial, increasing to 76.2% by day 17 (Table 1). Table 1 – Mean proportion of feather removal 2 h after feather presentation and the proportion of birds
removing none or all of the feathers after 2 h.
Trial day 1 3 8 10 15 17 SEM P value Mean feathers removed (%) 55.74c 63.86bc 73.27ab 80.00a 76.98a 76.19a 0.026 < 0.001
a,b,c Means in a row not sharing a common superscript are significantly different Means compared using Fishers Protected Least Significant Difference test
Figure 1 - Mosaic plot of the proportion of total birds (n=202) removing feathers at each proportion level across
each trial day. Each fill pattern represents the proportion of feathers removed from presented substrates after 2 h of presentation.
Figure 1 shows the segregation of the population of birds based on the varying levels
of feather removal as the trial progressed. The proportion of birds that did not remove feathers was initially high, at 35.6% on day 1, but decreased to 9.4% on day 8, where levels
0%
10%
20%
30%
40%
50%
60%
70%
80%
90%
100%
1 3 8 10 15 17
Prop
orti
on o
f bir
ds
Trial day
1
0.9 0.8 0.7 0.6 0.5 0.4 0.3
Aust. Poult. Sci. Symp. 2016.....27
83

remained low for the remainder of the trial. In contrast, the proportion of birds removing all presented feathers increased gradually from 49.5% on day 1 to 63.4% on day 17 of the trial.
The average feather removal was significantly different (P < 0.001) with 7.2 feathers removed within the first 30 min of presentation of feathers, compared to only 0.330 feathers between 30 min and 1 h, and 0.287 feathers between 1 and 2 h. Sixty-six percent of birds ate at least one feather during the period of observation and these birds were classified as feather eaters (FE). Both the number of FE birds and the average number of feathers eaten on any given day increased linearly as the trial progressed (Figure 2).
Figure 2 - The average number of feathers eaten per hen per day within a 30 s period for individually observed
birds (n = 59) is plotted as columns (primary y-axis), and the total number of birds observed to eat at least one feather during observation periods is shown as a dashed line (secondary y-axis).
Figure 3 - Plot of Kaplan-Meier curve of survivor function estimate of latency to peck (s) of non-feather eating (NFE) and feather eating (FE) birds.
Comparison of survival curves using non-parametric tests indicated that latency to
peck at feathers was significantly lower (P < 0.001) for FE birds than NFE birds (Figure 3).
0
5
10
15
20
25
30
0
0.2
0.4
0.6
0.8
1
1.2
1.4
1.6
1.8
3 5 8 10 15 17
Num
ber o
f fea
ther
eat
ers
obse
rved
Ave
rage
num
ber
of fe
athe
rs e
aten
Trial Day
Aust. Poult. Sci. Symp. 2016.....27
84

The probability of FE birds to peck at the feathers was 0.5 after 1 s of presentation, and 0.75 after 2 s. In contrast, the probability of NFE birds to peck at feathers after 4 s of presentation was 0.25. Similarly, when considering latency to peck across all birds, significant differences were also found between days with latency to peck decreasing as the trial progressed (P < 0.05).
IV. DISCUSSION
This study identified feather peckers and feather eaters in the flock based on behavioural differences of individual birds. Significant differences between birds are expected due to the variability of hen behaviour. The higher proportion of birds removing no feathers on days 1 and 3 compared to subsequent days indicates neophobia to the presented feathers. However, as the number of birds removing no feathers decreased substantially on day 17, and remained low for the remainder of the trial, it is likely that neophobia was overcome. In contrast, the proportion of birds removing all feathers from substrates after 2 h increased as the trial progressed. The proportion of feathers removed in 30 min, 1 h and 2 h was significantly different. Based on the average number of feathers removed within each time period, it is clear that the majority of feathers were removed within the first 30 min, with an average difference of <1 feather between 30 min and 1 h, as well as 2 h. This is likely due to the majority of birds removing all feathers on the substrate, leaving no feathers for subsequent time periods, as well as a general disinterest in the feathers after 30 min.
Depending on the size and orientation of the feather, McKeegan and Savory (2001) observed that feathers typically required manipulation before being swallowed by the bird. In this trial, feather manipulation sometimes resulted in birds dropping feathers. In these cases, feathers were either picked up by the same bird, picked up by a bird in an adjacent cage, or feathers fell through the cage floor which probably affected the ability of the bird to eat the feathers.
Behaviour observations indicate that feather eating is not the final outcome for all pecked feathers. Although strong interest in feathers was observed, it is unlikely that all birds tested and selected for future trials will be feather eaters. However, due to the limited number of birds observed, the possibility that some unobserved birds are feather eaters cannot be ruled out.
Differences in feather interest and feather appetite between individual birds, as well as the latency to peck for known FE and NFE birds provides a behaviour-dependant basis for selection of FE and NFE birds in future research. Feather pecking and feather eating birds will be used in subsequent trials to determine potential nutritional motivations behind feather eating behaviour. ACKNOWLEDGEMENTS: I would like to thank the Poultry CRC for funding my project and the Poultry Research Foundation for technical support.
REFERENCES
Leeson S & Walsh T (2004) Worlds Poultry Science Journal 60: 42-51. McKeegan DEF & Savory CJ (2001) Applied Animal Behaviour Science 73: 131-140. Wylie LM, Robertson GW & Hocking PM (2003) British Poultry Science 44: 75-87.
Aust. Poult. Sci. Symp. 2016.....27
85

DEVELOPMENT OF A RELIABLE INFECTION MODEL FOR ASCARIDIA GALLI IN LAYING HENS
N. SHARMA1, P. HUNT2, B. HINE2, N.K. SHARMA1, R.A. SWICK1 and I. RUHNKE1
Parasitic infections of the gastrointestinal tract can have a negative impact on the health, welfare and productivity of laying hens (Gauly et al., 2007). A survey focusing on free-range layer farms in Australia suggested that the prevalence of intestinal parasites in Australian production systems is comparable to other developed countries (Singh et al., 2014 unpublished data). While there are methods for controlling internal parasites in commercial egg producing birds including the use of anthelmintics and targeted management procedures, the optimal use of such approaches requires the development of reliable monitoring systems and an awareness of the critical infection threshold at which interventions are required. This study was conducted to establish a reliable infection model that can then be used to develop and validate monitoring and treatment guidelines for free-range egg producers.
A total of 20 Lohmann brown laying hens were assigned to 4 treatment groups (n=5 per group) infected with A. galli eggs or in one group, adult worms. The infection models associated with each treatment group are shown in Table 1.
Table 1 - Treatment group models of infection with A. galli eggs or adult worms.
Details Group 1 Group 2 Group 3 Group 4 Mode of inoculation oral oral oral cloacal
Frequency of inoculation
3 times over 1 wk
3 times over 1 wk
6 times over 2 wks once
No. of embryonated eggs or adult worms
inoculated 1000 eggs 1000 eggs 500 eggs adult worms
Storage condition of eggs or adult worms prior to inoculation
26˚C for >10 weeks
4˚C for > 10 weeks post
embryonation and then 26˚C
for 2 wks
26˚C for 3 wks
Room temperature
Two hens from each treatment group were sacrificed 14 days post infection to observe
if immature parasites were present in the intestine. Immature worms were detected in the intestine of both hens from treatment group 3 (15 and 21 immature worms each bird, respectively). A single worm was detected in one bird in treatment group 1 and there were no worms observed in the hens from group 1 and group 4. Findings of this study suggests that the infection model used for treatment group 3 may provide a reliable model of A. galli infection in laying hens, and that cold storage of embryonated eggs is not conducive to subsequent infection. Further studies are underway to investigate egg counts in the excreta of birds from all groups, as well as serum antibody responses to A. galli in individual birds. ACKNOWLEDGEMENTS: We would like to thank Poultry CRC for financial support. Gauly M, Duss C & Erhardt G (2007) Vet. Parasit. 146: 271-280. Singh M, Ruhnke I, DeKoning C, Drake K, Glatz P, Walker T, Skerman T, Hunt P,
Sommerlad M & Choct M (2015) Poultry CRC report (unpublished data).
1 School of Environmental and Rural Science, University of New England, NSW 2351; [email protected] 2 CSIRO, McMaster Laboratory, Chiswick, Armidale, NSW 2350.
Aust. Poult. Sci. Symp. 2016.....27
86

ISA BROWN LAYING HENS ON THE RANGE ARE INITIALLY MORE ATTRACTED TO OVERHEAD COVER THAN PERCHES
R.A. DORAN1, R.L. HOPCROFT1 and G.M. CRONIN1
Summary
Lack of use of the outdoor range by laying hens may indicate the range is unattractive. We conducted a 2 × 2 factorial experiment involving 16 groups of 50 ISA Brown laying hens, to measure the comparative attraction of hens on the range to a designated location with or without structural features. The structural features were a pyramidal-shaped perch unit (1 × 1 m at the base) and overhead shade cover (1.2 × 1.2 m) suspended 2.1 m above ground (and perch unit if present), located 8 m from the shed pop-holes. The features were rotated weekly around the 16 runs in a randomised sequence, with a 4-week rotation cycle. After the hens had experienced the particular perch × overhead cover arrangement for 6 days, an observer counted the number of hens present in the designated location at 15-min intervals from 0900 to 1230 h. Between 24-27 weeks of age, more hens were located in the space when overhead cover was present compared to absent, but there was no difference due to perches present or absent and no cover × perch interactions. Single-day observations at 30 and 39 weeks recorded more hens present due to both overhead cover and perches than without the features. The results suggest hens were initially more attracted to overhead cover than perches on the range, but as hens aged, perches and cover were equally attractive.
I. INTRODUCTION Opening the pop-holes to the outdoors for commercially managed free range laying hens may occur once pullets are fully feathered (Singh and Cowieson, 2013). In general this occurs between 16 and 21 weeks of age. Although opening the pop-holes provides hens the opportunity to leave the shed, many hens don’t voluntarily enter the range (Richards et al., 2011; Hegelund et al., 2005; Bubier and Bradshaw, 1998). Further, hens that venture onto the range tend not to utilise the available space evenly. This contributes to rapid depletion of the pasture or forage in certain areas such as close to the shed, and under-utilisation of other parts of the range (Hegelund et al., 2005; Zeltner and Hirt, 2005, 2008). These issues are relevant since uneven utilisation, and poor dispersion across, the range are points of contention between stakeholders, for example those interested in ‘truth in labelling’ of free range eggs.
The modern laying hen was domesticated from the Red Jungle Fowl (Gallus gallus; Collias and Collias, 1967; Rubin et al., 2010) and retains innate behavioural responses such as predator avoidance (Newberry and Shackleton, 1997). It is not surprising then that relatively low proportions of commercial free range hens are reported to utilise range areas, especially in bright sunshine and when these environments lack ‘jungle-like’ structures. Hens on the range typically congregate under shade or near structures rather than in the open (Glatz et al., 2010; Rault et al., 2013; Gilani et al., 2014). While strategic placement of ‘attractive’ structures is reported to facilitate dispersion and more even use of pasture by free-ranging hens (Gilani et al., 2014; Zeltner and Hirt, 2003, 2008), little is known about the attractiveness of different features for hens on the range. The objective of this experiment was to investigate the preference of hens for overhead cover compared to perches on the range, and to determine whether preference changed over time. Preference was measured by the number of hens occupying a defined area (~1 m2) on the outdoor range.
1 The University of Sydney, Faculty of Veterinary Science, Camden, NSW 2570; [email protected]; [email protected]; [email protected]
Aust. Poult. Sci. Symp. 2016.....27
87

II. MATERIALS AND METHODS This trial was part of a larger experiment involving 800 ISA Brown hens that had been floor-reared on litter from day-old in the Free Range Research Facility at Camden. The main experiment had a 2 × 2 factorial arrangement to investigate the effects of added forage (straw in a plastic basket) from 6 weeks of age to the end of the experiment at 40 weeks, and transport/relocation/mixing at 16 weeks (TRM), on the development of feather pecking behaviour and plumage damage. There were 16 pens of 50 hens, with 8 pens on each side of a central aisle in the shed. Each pen measured 1.83 m wide by 3.25 m deep and contained a 10 hole nest box unit, a feeder, bell drinker and a 5-rung perch unit. The experiment was blocked according to the side of the shed (north vs south aspect). At 21 weeks the pop-holes were opened (0.4 m high × 0.6 m wide) providing hens with continuous access to individual outdoor ranges (1.8 × 10.0 m). Each range was defined by 2.1 m high wire mesh fences and overhead cover of light-gauge wire netting to prevent hens flying out and aerial predators entering. The first 1.2 m of each range consisted of a metal-roofed verandah, while the next 1.2 m was covered with beige shade cloth (70% UV block-out). Straw for the Forage treatment was also provided outdoors in a plastic basket at the end of each run (Forage treatment), whereas No Forage pens had an empty basket. The quantity of herbage in the runs was monitored weekly.
When the hens were 23 weeks, eight portable pyramidal-shaped perch units (Fig. 1) and eight overhead cover sheets made from dark green shade cloth (1.2 × 1.2 m) were placed in the outdoor runs. Perch units were free-standing, while overhead cover sheets were attached to the underside of the overhead wire mesh, along the midline of the runs 8 m from the pop-holes. When overhead cover was provided in combination with a perch unit, the cover was positioned above the perch unit. The perch units and overhead cover were rotated through the 16 pens at weekly intervals according to a randomised Latin-square arrangement. The present experiment had a 2 × 2 factorial arrangement, blocked on side of the shed (north vs south aspect). The rotation ensured that all pens of hens experienced all four treatment combinations for one week of each 4-week cycle. The treatment combinations were: (1) perch and overhead cover present, (2) perch present and overhead cover absent, (3) perch absent but overhead cover present or (4) perch and overhead cover absent; in treatment #4, hens were counted in same designated (virtual) 1 m2 area.
Figure 1 - A perch unit in an outdoor run. The lowest tier measured 1 × 1 m and was 0.31 m above the ground. The middle and top tiers were 0.62 and 0.93 m above the ground and measured 0.7 × 0.7 m, and 0.4 × 0.4 m.
Aust. Poult. Sci. Symp. 2016.....27
88

Observations were conducted in weeks 24 to 27, 30 and 39 of age, when the respective treatment combinations had been in place for 6 days. On observation days an experimenter observed the hens 15 times at 15-min intervals commencing at 0900 h and the number of hens occupying the 1 m2 area on the ground, or perched above ground on the perch unit, were counted. The experimenter stood outside the free range facility outer fence, at a distance of at least 5 m from the designated 1 m2 area. The experimenter moved slowly and quietly around the perimeter of the facility to record the observations. Data were analysed using REML Linear Mixed Models in Genstat (ver 14.1), with Perch, Cover, Forage and TRM as fixed effects, and Shed-block/Pen/Observation sequence as random effects. Non-significant terms were dropped from the models. Analyses were conducted within three time periods (24-27, 30 and 39 weeks of age) due to the potential confounding effects of hen age, depletion of herbage in the runs and weather conditions.
III. RESULTS There were no differences due to the Forage or TRM main effects, and no interactions (P > 0.05). By 24 weeks (3 weeks after access to the runs) all herbage in the runs had disappeared. In weeks 24-27, the presence of overhead cover resulted in more hens occupying the 1 m2 designated area compared to when the cover was absent (1.3 vs 1.1 hens, respectively; P = 0.003, sed 0.175). The presence or absence of the perch unit did not modify the number of hens located in the 1 m2 space (1.3 vs 1.2 hens, respectively), and there were no Perch × Cover interactions (P > 0.05). The observations were conducted in late winter/early spring, and the 0900 h ambient temperature ranged from 10-18°C and wind speed 7-19 km/h.
In week 30 there were differences in the number of hens in the 1 m2 area due both main effects (Perch unit: 1.2 v 0.7 hens for perch present and absent, respectively; P = 0.002, sed 0.20; Overhead cover: 1.4 v 0.6 hens for cover present and absent, respectively; P < 0.001, sed 0.20), but no interaction effects. The 0900 h temperature was 16°C and wind speed was 6 km/h. Similarly, in week 39 there were differences due to both main effects, but no interaction effects. When the perch unit was present compared to absent, there were 6.3 v 3.2 hens in the 1 m2 area (P = 0.03, sed 1.26), and when the overhead cover was present compared to absent there were 6.7 v 2.8 hens in the area (P = 0.009, sed 1.26). Although there were no Perch × Overhead cover interactions (P > 0.05), when both features were present there were 8.2 hens in the area compared to 1.1 hens if neither feature was present. The 0900 h temperature was 22°C and wind speed was 24 km/h.
IV. DISCUSSION Different features in the range environment are known to attract hens. For example, Hegelund et al. (2005), Glatz et al. (2010), Rault et al. (2013), Larson and Rault (2014) and Gilani et al. (2014) amongst others, provided various forms of natural (e.g. trees or shrubs) and artificial structures (tents, shade cloth in vertical and horizontal orientation) on the range, and demonstrated that hens preferentially congregate around such features. Although the findings of the present experiment were obtained in a small-scale research facility with groups of 50 hens accessing small range areas, understanding the principles of bird responses in outdoor environments is relevant, and may be cautiously considered for commercial-scale situations. While our results are in agreement with previous research on which features attract hens on the range, our results also suggest younger hens were more attracted to overhead cover than perches on the range. However, by 30 weeks hens were equally attracted to the overhead cover and perch units on the range. These findings may suggest that hens with relatively recent access to the range have a high primary motivation to seek overhead cover, perhaps until they habituate to the outdoor environment. Once habituated, hens potentially reduce
Aust. Poult. Sci. Symp. 2016.....27
89

their level of vigilance and may perform more of other activities within the chicken’s behavioural repertoire. While research is limited on the time budget of behaviour of hens on the range, Larson and Rault (2014) studied hens at two free range farms which incorporated sections of the Kangaroo Apple shrub on the range. Hens were found to use the shrubs at different times of the day for various behaviours including foraging, preening and perching. Hence, while hens’ innate seeking of structural features on the range may reflect avoidance of open space/sky, once hens habituate to their new environment, we predict that vigilance behaviour is reduced and other functionally-motivated behavioural systems such as foraging, maintenance (dust bathing, preening) and resting may increase (Hogan, 2015). Although limited, research suggests benefits from the provision of cover and structures on the range. For example, Bright and Joret (2012) reported the provision of range tree cover for free range flocks reduced total egg seconds and tended to lower hen mortality compared to equivalent flocks without range tree cover. Further research is clearly required on the design of the range to improve utilisation of the space and obtain production and welfare returns from the investment in providing structural features. An interesting observation from the current experiment was that at 39 weeks the absolute number of hens in the designated space had approximately tripled compared to earlier observation weeks. The week 39 observations occurred in late November, coinciding with higher ambient temperatures and humidity, and stronger sunlight. Thus, ambient seasonal conditions may also need to be considered when designing ranges for hens.
In conclusion, this experiment suggests that the design and management of the range area for laying hens should initially provide overhead cover to attract hens from the shed and assist their distribution across the range. ACKNOWLEDGEMENTS: The experiment was funded by Australian Egg Corporation Ltd.
REFERENCES Bright A & Joret AD (2012) Veterinary Record 170: 228. Bubier NE & Bradshaw RH (1998) British Poultry Science 39: S5-S18. Collias NE & Collias EC (1967) The Condor 69: 360-386. Cronin GM, Barnett JL, Storey TH, Thomson PC & Hemsworth PH (2012) Proceedings of the
Australian Poultry Science Symposium 23: 168-171. Gilani A-M, Knowles TG & Nicol CJ (2014) British Poultry Science 55: 127-135. Glatz PC, Rodda BK, Rimmington H, Wyatt SC & Miao ZH (2010) Proceedings of the
Australian Poultry Science Symposium 21: 135. Hegelund L, Sørensen JT, Kjaer JB & Kristensen IS (2005) British Poultry Science 46: 1-8. Hogan JA (2015) Behavioural Processes 117: 105-113. Larsen H & Rault J-L (2014) Proceedings of the Australian Poultry Science Symposium 25: 113-
116. Newberry RC & Shackleton DM (1997) Animal Behaviour 54: 387-395. Rault J-L, van de Wouw A & Hemsworth PH (2013) Australian Veterinary Journal 91: 423-426. Richards GJ, Wilkins LJ, Knowles TG, Booth F, Toscano MJ, Nicol CJ & Brown SN (2011)
Veterinary Record 169: 338. Rubin C-J, Zody MC, Eriksson J, Meadows JRS, Sherwood E, Webster MT, Jiang L, Ingman M,
Sharpe T, Ka S, Hallböök F, Besnier F, Carlborg O, Bed’hom B, Tixier-Boichard M, Jensen P, Siegel P, Lindblad-Toh K & Andersson L (2010) Nature 464: 587-593.
Singh M & Cowieson AJ (2013) Animal Production Science 53: 1202-1208. Zeltner E & Hirt H (2005) British Poultry Science 44: 533-537. Zeltner E & Hirt H (2008) Applied Animal Behaviour Science 114: 395-408.
Aust. Poult. Sci. Symp. 2016.....27
90

AN INVESTIGATION INTO THE INTERACTION BETWEEN DIETARY CALCIUM AND PHOSPHORUS ON EGG PRODUCTION AND QUALITY OF LAYING HENS
USING THE GEOMETRIC FRAMEWORK
C.J. O’SHEA1, S.J. WILKINSON2, S.Y. LIU1, Y. BAO1, N. DHAND1, P. SELLE1 and A.J. COWIESON3
Summary
An optimum inclusion rate of dietary total calcium (Ca) and non-phytate phosphorus (npP) for laying hen diets is not clear due to complex interactions between these two essential minerals and involvement with other digestive processes. Identifying appropriate inclusion rates and ratios for total Ca and npP is complicated further depending on the outcome variable of interest, for example; optimum feed utilisation may necessitate a lower dietary total Ca level when compared with that required for optimum eggshell quality. The effect of total Ca and npP levels on laying hen performance was investigated using 270 mid-lay Isa Brown birds in diets arranged in a geometric design. Birds were offered wheat-soybean based diets that differed only in total Ca and npP concentrations. Diets were clustered into low, medium and high total Ca + npP densities (30, 40 and 50 g/kg respectively) and at each density, five total Ca:npP ratios were formulated to generate a geometric nutrient space. Egg production and quality, and feed utilisation were assessed over an 8 week period and surface mapped using the Thin Plate Spline procedure of the fields package in R. Increasing total Ca concentrations and npP concentrations led to greater egg mass per day (P < 0.05) and greater shell weight (P < 0.05). There was an interaction between Ca and npP found for Haugh Unit (P < 0.05) and AME (P < 0.01). Increasing concentrations of npP resulted in a high egg Haugh unit at lower Ca levels, however this effect was not observed at higher Ca levels. AME increased in line with increasing npP concentration however this was only observed when within dietary total Ca parameters of 3.7 - 4.3% Ca. In conclusion, the results of this study suggest that egg mass and shell weight can be increased through higher levels of dietary Ca and npP. However achieving optimum Haugh Units and AME were more specific with high levels of Ca suppressing egg quality parameters and feed utilization.
I. INTRODUCTION The laying hen has a substantial requirement for calcium (Ca) and phosphorus (P) to support daily egg production. In particular, a high intake of Ca at approximately 4% of the diet is considered important to achieve optimum egg number and quality. Paradoxically, the amount of Ca required for optimum egg production can have negative consequences for other biological processes, such as digestion (Plumstead et al., 2008). This is partly because of the negative effect of Ca on phytate P solubility, through the formation of calcium-phytate complexes (Grynspan and Cheryan, 1983; Selle et al., 2009). Therefore, optimum inclusion rates and appropriate ratios for total Ca and non-phytate phosphorus (npP) are not yet clearly defined, and may differ depending on the production traits of interest. Calcium and P requirements are predominately provided by calcium carbonate and inorganic P. Adopting a Geometric Framework approach, in this study a series of total Ca and npP densities and ratios was used to generate a geometric nutrient space to
1 The University of Sydney, Poultry Research Foundation, Faculty of Veterinary Science, School of Life and Environmental Sciences; [email protected]
2 Feedworks Pty Ltd, Australia. 3 DSM Nutritional Products, Kaiseraugst, Switzerland.
Aust. Poult. Sci. Symp. 2016.....27
91

obtain wide ranging information on the effect of total Ca and npP inclusion rates on egg production and quality, and AME in laying hens. The objectives of this study were to identify optimum Ca and npP densities and ratios for important production traits in laying hens.
II. MATERIALS AND METHODS All experimental procedures in this study were conducted in accordance with the University of Sydney Animal Ethics Committee. A total of 270 mid-lay Isa Brown laying hens were randomly allocated to cages and fed for 8 weeks on 15 dietary treatment groups arranged in a Geometric Framework design. Each treatment group consisted of 18 birds (six replicates with 3 birds per replicate). Each bird was housed separately in cages measuring 25 x 50 x 50 cm2, with three adjacent cages forming the replicate unit located evenly throughout the experimental laying house. Birds were offered wheat-soybean based diets that differed only in total Ca and npP concentrations. Diets were clustered into low, medium and high total Ca+npP densities (30, 40 and 50 g/kg respectively) and within each density, five total Ca:npP ratios (15.7:1, 11.5:1, 9:1, 7.3:1, 6.14:1) were formulated to generate a geometric nutrient space. Feed and water were supplied ad libitum. The photoperiod regimen was 16 hours of light and 8 hours of dark.
Egg quality and feed conversion efficiency were assessed over an 8 week period. On day 28, a 48 h total collection procedure was undertaken for the 6 replicate groups whereby the feed input and faecal output were measured to determine energy retention. To estimate apparent metabolisable energy (AME), gross energy of feed and faecal output was determined using a Parr 1281 adiabatic bomb calorimeter (Parr Instrument Company, Moline, IL, USA). Throughout the 8 week trial all eggs were collected and weighed for each replicate group. In order to determine egg quality, eggs were collected 1 day per week, weighed and their egg yolks and egg shells weighed. Data were surface mapped using the Thin Plate Spline procedure of the fields package (R Development Core Team, 2011). Treatments were represented as dots overlaid on the contour plots. Interrogation of the data was performed using the PROC MIXED procedure of SAS (Littell et al., 1996). The fixed effects were total Ca and npP density, the ratio of total Ca to npP, and the interaction between the two. Treatment differences were considered significant at P<0.05.
III. RESULTS AND DISCUSSION While maximizing dietary Ca and npP intake are recognized as important targets for optimum egg production, high levels of Ca can impede other important production traits by interfering with nutrient and energy availability (Selle et al., 2009). In this study a geometric framework approach was taken to investigate the response of egg production and quality, and AME to a range of dietary Ca and npP densities and ratios.
The response of egg mass per day to Ca+npP densities (P<0.05) is presented in Figure 1. Broilers offered diets containing high densities of total Ca (4-4.5%) and npP (0.6-0.7%) had the greatest egg mass per day. This finding is in agreement with Safaa et al. (2008) who observed a similar improvement in egg mass with increasing dietary total Ca+npP. There was a quadratic relationship between egg mass and dietary Ca. However, dietary npP concentrations had a greater and linear impact on egg mass than Ca, whereby egg mass increased with dietary npP levels.
Aust. Poult. Sci. Symp. 2016.....27
92

The response of eggshell weight to Ca+npP densities (P<0.05) is presented in Figure 2. Birds offered diets containing high densities of total Ca (4-4.5%) and npP (0.65-0.7%) had the greatest eggshell weight. In this study the response for eggshell weight appears to be more sensitive to changes in dietary npP rather than in total Ca. There was an interaction between total Ca+npP densities and the ratio of total Ca to npP on egg Haugh Units (P<0.05; Fig. 3). Birds offered diets containing 0.5% npP and 3% total Ca had the highest Haugh Units, in contrast with birds offered 0.3% npP and 4.5% Ca resulting in the lowest Haugh Units. This finding is in contrast to those of Safaa et al. (2008) who observed no difference in Haugh Units at different total Ca + npP levels in laying hens. This observation may reflect the varying total Ca:npP in this study, which were kept constant across treatments in Safaa et al. (2008). Supporting this, Lim et al (2003) found that increasing npP improved Haugh Units in early lay while increasing total Ca reduced Haugh Units in late lay. Again, because the contour lines in Figure 3 are close to being horizontal, this suggests that dietary npP may influence Haugh Units to a greater extent than total dietary Ca concentration in the diets.
Results from the AME study showed there was an interaction between total Ca+npP densities and the ratio of total Ca to npP (P<0.01; Fig. 4). The greatest AME was observed in birds offered diets in a narrow range of total Ca between 3.75 and 4.25%. AME was less influenced by varying levels of npP suggesting Ca is important in achieving optimum AME. Taken together, this study suggests that higher levels of total Ca may be detrimental to optimum Haugh Units and AME.
In conclusion, the findings of this study suggest that collectively maximizing dietary total Ca and npP intake will support optimum egg mass production and eggshell traits,
Figure 3 - The effect of dietary total Ca and npP on Haugh Units of laying hens.
Figure 2 - The effect of dietary total Ca and npP on eggshell weight (g) of laying hens.
Figure 1 - The effect of dietary total Ca and npP on average egg mass per day (g) of laying hens.
Figure 4 - The effect of dietary total Ca and npP on AME of laying hens.
Total Ca (%) Total Ca (%)
Total Ca (%)
npP (%)
npP (%)
npP (%)
npP (%)
Total Ca (%)
Aust. Poult. Sci. Symp. 2016.....27
93

however this approach is in conflict with the appropriate inclusion rates for other important traits such as Haugh unit and AME. ACKNOWLEDGEMENTS: The authors are grateful to Australian Egg Corporation Limited for their financial support of this study. We would like to acknowledge the support of the technical team at the PRF, led by Joy Gill.
REFERENCES Grynspan F & Cheryan M (1983) Journal of the American Oil Chemists' Society 60: 1761-
1764. Lim H, Namkung H & Paik I (2003) Poultry Science 82: 92-99. Littell RC, Milliken GA, Stroup WW & Wolfinger RD (1996) SAS® Systems for mixed
models (Statistical Analysis Systems Institute Inc., Cary, NC, USA). Plumstead PW, Leytem AB, Maguire RO, Spears JW, Kwanyuen P & Brake J (2008) Poultry
Science 87: 449-458. R Development Core Team (2011) R A language and environment for statistical computing.
2.15 ed. (R Foundation for Statistical Computing, Vienna, Austria). Safaa HM, Serrano MP, Valencia DG, Frikha M, Jiménez-Moreno E & Mateos GG (2008)
Poultry Science 87: 2043-2051. Selle PH, Cowieson AJ & Ravindran V (2009) Livestock Science 124: 126-141.
Aust. Poult. Sci. Symp. 2016.....27
94

A NEW DOUBLE CHOICE MODEL DEVELOPED IN LAYING HENS REVEALS HIGH PREFERENCE FOR L-ALANINE.
S. CHO1, J.M. KIM1 and E. ROURA1
It has been well established that nutrient deficiencies or imbalances increase the risk of feather pecking in layer hens (Kjaer and Bessei, 2013). Marginal imbalances may occur under commercial conditions due to individual variations in feeding behavior and digestive and metabolic efficiencies in nutrient utilization. Our hypothesis is that these individual differences lead to nutrient specific appetites which, in turn, relate to the feather pecking habits. However, very little is known on nutrient preferences and appetites in commercial layer hens. Furthermore, there is currently a lack of a practical methodology that allows assessing taste perception and preferences in chickens. The main objective of this study was to develop a new double choice model for nutrients in laying hens.
Ninety-six 20 month-old laying hens were housed individually and assessed through two testing periods. Period one consisted of two days of training before being offered eight treatments defined as a factorial design with four potential taste active formulations (control with no tastants, 3.5% L-alanine (L-Ala), 10% calcium carbonate (Ca) or complete feed (positive control) where the active compounds were presented in two delivery matrices (starch or ground wheat –GW-). The second period involved the test of two additional tastants (2.3% NaCl and 6.8% MSG) administered using GW as the selected delivery matrix (based on results from period 1). All the treatments were offered in a double choice set using two foil containers with one of the containers holding the control matrix (without tastant) and the other container one of the four treatments assigned following a complete block design. Feed disappearance from each individual container was measured at 1, 2, 4, 8 and 24 hours. Preference values (test feed intake divided by total intake –i.e. the sum of the two containers) of each treatment were compared to the random choice value of 50% using SAS software. Differences were considered significant at P < 0.05.
The results of the first period showed that the GW was (P < 0.01) preferred as the delivery matrix over starch. In addition, after the 1st hour, a significant (P < 0.05) preference was found for L-Ala, whereas Ca addition was related to an aversion (consumption was significantly –P<0.05- lower than 50%). Our results are consistent with the findings of Baldwin et al. (2014) who reported an in vitro chicken taste receptor cell reporter system had a high affinity for L-Ala. We speculate that the avoidance of the Ca in our experiment was related to a potential imbalance with P as calcium appetite in chickens is highly related to the ratio with phosphorus (P) (Wilkinson et al., 2014). We did not observe significant preferences for NaCl or MSG. In conclusion, our data supports the use of GW as a delivery system for taste active compounds in a double choice model in chickens. It appears that in our new model one hour is sufficient to detect nutrient specific appetites and that L-Ala and Ca have the potential to become reference treatments of preference and avoidance, respectively, for future evaluations.
ACKNOWLEDGEMENTS: The Australian Egg Corporation Limited supported the study. Baldwin MW, Toda Y, Nakagita T, O’Connell MJ, Klasing KC, Misaka T, Edward SV &
Liberles SD (2014) Science 345: 929-933. Kjaer JB & Bessei W (2013) Archiv fur Geflugelkunde 77: 1-9. Wilkinson SJ, Bradbury EJ, Bedford MR & Cowieson AJ (2014) Poult. Sci. 93: 1695-1703.
1 The University of Queensland, St. Lucia QLD 4072; [email protected]
Aust. Poult. Sci. Symp. 2016.....27
95

NSP ENZYME COMPLEX IMPROVES PRODUCTIVE PERFORMANCE OF LAYING HENS
M. LE CRAPPER1, P. COZANNET1, R. MONTANHINI NETO2, D.WU3 and A. PREYNAT1
Cereals and soybean meal are widely used in poultry feed for their high nutritional values in term of energy and proteins. However, the presence of anti-nutritional factors such as non-starch polysaccharide (NSP) can limit nutrient utilization. Indeed, NSP can have a “cage effect” action on starch and protein (Simon, 2000) and they can decrease overall nutrient digestibility via modifications within the digestive tract. The addition of enzymes, especially carbohydrases to diets has been introduced in the feed industry as a potential way to increase digestion efficiency. The objective of this study was to investigate the effect on production performances of laying hens of a multi-enzyme complex, using a meta-analysis of 3 trials.
In 3 independent trials, 1440 laying hens were divided into two treatments: 1) Control (CTR), and 2) CTR + NSP enzyme (50g/ton; Rovabio® Advance P). Diets were fed from 20 to 47 weeks of age. All diets were analysed for xylanase and beta-glucanase activities and results were in agreement with expected levels. Feed formulation were standard including wheat, barley, wheat bran, triticale and soybean meal. Egg production, egg weight, feed intake, feed conversion ratio (FCR), body weight (BW), mortality and egg quality characteristics were used as response criteria to enzyme supplementation. Data were subjected to mixed procedure analysis. Block (n=16; 24; 24) and treatment (n=2) were used as fixed effect and study (n=3) as random effect. Performance results are shown in Table 1. On global period, Rovabio® Advance P had a significant positive effect on FCR by 2.3%, explained partially by a reduction in feed intake (-1.7%; P = 0.008). Rate of lay, as well as egg mass output tended to be increased by supplementation of the diet with the enzymes, with a numerical improvement of 0.8 and 1.1%, respectively (P = 0.07). In addition, eggshell weight was significantly increased (1.4%; P = 0.031).
In conclusion, multi-enzyme complex is effective in enhancing productive performance of layers fed wheat-based diet and can also increase quality of eggshell, through probably a better nutrient digestibility and particularly minerals.
Table 1 - Performance of laying hens on global period.
1 Mixed model, fixed effect: block (n=16; 24; 24) and treatment (n=2); aleatory effect: study (n=3). Values with a row not sharing a common superscript are statistically different (Tukey test: P>0.05).
Simon O (2000) Lohmann information 23: 7. 1 CERN, Centre of Expertise and Recherche in Nutrition, Adisseo France S.A.S. Malicorne 03600, France. 2 ADISSEO France S.A.S., Antony 92161, France; [email protected] 3 ADISSEO France S.A.S., Singapore 179360, Singapore.
Control diet Control + Rovabio Advance P
p-value1
Performance parameters Body weight gain (g) 429,9 437,5 0,553
Feed intake (g/hen/day) 121 119 0,008 FCR (g feed/g eggs) 2,09 a 2,04 b < 0,0001
Rate of lay (%) 93,7 94,5 0,060 Egg mass output (g/hen/day) 57,67 58,28 0,070
Mortality (%) 0,23 0,23 1,000 Egg quality parameters
Average egg weight (g) 61,5 61,6 0,566 Eggshell weight (g) 6,33 a 6,42 b 0,031 Egg yolk weight (g) 17,1 17,1 0,921 Albumen weight (g) 40,8 41,2 0,187
Egg yolk color 10,7 10,9 0,064
Aust. Poult. Sci. Symp. 2016.....27
96

EFFECT OF TWO DIFFERENT FIBRE SOURCES ON GROWTH AND IMMUNE FUNCTION IN GROWER LAYER-PULLETS
S.M. HUSSEIN1,2, J.S. YOKHANA1,2 and T.L. FRANKEL1
Summary
This study was conducted to evaluate the effect of two different fibre sources on pullet growth, gut immune tissue, and lymphocyte proliferation of Hy-line Brown strain pullets fed three different diets from 10-18 weeks of age. The diets were a basal grower pullet diet without fibre supplement (Control group), basal diet supplemented with 1.5% (Arbocel
® RC
fine) as insoluble dietary fibre (IF), and basal diet supplemented with 1.5% (OpticellC5) as a mixture of soluble and insoluble dietary fibre (MF). At 18 weeks of age, live body weight was significantly (P<0.05) increased in pullets receiving the IF dietary treatment compared to the control group. Both IF and MF significantly (P<0.05) increased the ex-vivo proliferation of T and B lymphocytes compared to the control group. The area of Peyer’s patches (Pp) relative to area of small intestine was significantly (P<0.05) higher in pullets fed the diet supplemented with IF compared to the control and MF groups, and IF supplemented pullets had significantly (P<0.05) more Pp along the small intestine compared to the control group. These results indicate that both IF and MF can improve development of the immune system of grower pullets.
I. INTRODUCTION
The European Union banned the use of antibiotics as non-therapeutic growth promoters for poultry in 2006 and in other countries, including Australia, there have been restrictions placed on their use (Świątkiewicz et al. 2014; Laxminarayan et al. 2015). As a result, there has been increased interest in finding alternative growth promoters and immunomodulators (Mateos et al. 2002). Finding new alternatives to antibiotics aimed at improvement of the immunity and productivity of poultry is important, especially for economic and sustainable production (Mateos et al. 2002; Mateos et al. 2012; Laxminarayan et al. 2015). As an effective alternative to antibiotics, different types of fibre have been suggested for use in the diet of layer pullets (Mateos et al. 2002). Various types of dietary fibre have been shown to enhance body weight gain, growth of lymphoid tissue and lymphocyte proliferation of broilers and ducks (Jiménez -Moreno et al. 2009; Shi-bin and Hong 2012). It has also been reported that a commercial insoluble fibre (Arbocel
® RC fine, JRS Co. Inc., Rosenberg,
Germany) and a commercial mixed soluble and insoluble fibre (OpticellC5, Agromed Austria GmbH) added to the diet of four week old layer strain pullets for four weeks can enhance innate immune function (Hussein et al. 2014). The aim of this study was to investigate whether supplementing the diet of 10 to18 week old layer-strain pullets with either an insoluble (IF) or a mixed soluble and insoluble fibre (MF) product would improve their body growth, gut lymphoid organ growth and lymphocyte proliferation.
II. MATERIALS AND METHODS
Fifty-four 10-week-old Hy-line Brown grower pullets were weighed and randomly placed, three per pen, in slatted floor pens (1.8 x 0.9 m, length x width), six pens per treatment. The
1 Department of Physiology, Anatomy and Microbiology, School of Life Sciences, La Trobe University, VIC, Australia; [email protected]
2 University of Duhok, Duhok, Kurdistan Region, Iraq.
Aust. Poult. Sci. Symp. 2016.....27
97

three dietary treatments were Control, a commercial grower pullet feed (Pullet Grower, Barastoc - Ridley Agriproducts) with no additive; Group IF (insoluble fibre), given the control diet with 1.5g/100g of a commercial lignocellulose supplement containing 65 – 70% crude fibre high in cellulose and 20% lignin (Arbocel
® RC fine). Group MF (mixed fibre),
given the control diet with 1.5g/100g of a commercial lignocellulose supplement containing 85% soluble and insoluble fibres, 30% lignin (OpticellC5).
After seven weeks on the diets, blood samples were taken from the brachial vein of eight pullets per treatment, 1-2 pullets/pen for isolation of lymphocytes using a modification of the method of Lavoie and Grasman (2005). After separation of lymphocytes using Histopaque® 1077 (Sigma-Aldrich) the number of viable cells was determined by staining with trypan blue. The lymphocytes were then plated into a sterile, clear, flat bottom 96-well plate (FalconTM, Becton Dickinson Labware). Mitogen induced proliferation of T- and B-lymphocytes was stimulated by adding either Concanavalin A (Con A, 2.5µg/ml, Sigma-Aldrich) or lectin from lipopolysaccharide (LPS, 3.125μg/ml, Sigma-Aldrich) to the incubation medium. Proliferation of lymphocytes unstimulated by mitogens acted as a proliferation control. After 2.5 days incubation at 37oC and 5% CO2 in a humidified incubator, AlamarBlue® (BUF012B, AbD Serotec) was added to each well according to the manufacturer’s directions and after 8 hours absorbance of the reduced dye was measured. In order to determine cell proliferation, the absorbance for mitogen stimulated T- and B- lymphocytes was calculated as a percentage of the absorbance of the unstimulated lymphocytes.
At 18 weeks of age all pullets were weighed and killed with intravenous pentobarbitone sodium. Specimens of small intestine (jejunum and ileum) were taken from eight pullets per treatment, opened lengthwise and stained with polychrome methylene blue (Amber Scientific, Australia) (Cornes, 1965). Then the number of Peyer’s patches (Pp) ≥1mm2 were counted and the area of Pp and the small intestine areas were measured using AutoCAD Software (Autodesk AutoCAD, 2014). The total area of Pp in each pullet relative to the areas of their jejunum and ileum was calculated (relative Pp area). The experiment was approved by the La Trobe Animal Ethics Committee. Data were analysed using one-way analysis of variance (ANOVA, SPSS, 22, USA) and statistical significance between means of different treatment groups was compared by Tukey’s test at P<0.05.
III. RESULTS AND DISCUSSION
Compared to Controls, live body weight of IF supplemented pullets was significantly increased (P<0.05) but there was no difference between IF and MF pullets or between MF and Control pullets, (Table 1). The positive effects of IF on body weight are consistent with published reports (eg Mateos et al., 2012; Incharoen and Maneechote, 2013). Proliferation of T-lymphocytes (Con A stimulated) and B-lymphocytes (LPS stimulated) of both IF and MF fed pullets were significantly (P<0.05) greater than those of the Control group (Table 1). The observed increase in lymphocyte proliferation indicates that both IF and MF have the potential to enhance the number of lymphocytes in Hyline-Brown pullets. Dietary fibre, both insoluble and soluble, from other sources has been shown to improve lymphocyte proliferation in poultry (Dong et al., 2007; Sato et al., 2012; Shi-bin and Hong, 2012).
Both Control and MF groups had significantly (P<0.05) lower relative Pp areas than the IF group. The number of Pp were significantly greater (P<0.05) in the IF supplemented pullets compared to Controls (Table 1). In mice, fibre in the form of fructo-oligosaccharides but not wheat bran has been shown to increase Pp number (Pierre et al., 1997; Hosono et al., 2003).
Aust. Poult. Sci. Symp. 2016.....27
98

The positive effects on growth, Pp and lymphocyte proliferation may have been the result of an effect on reducing pathogens or changing microflora in the gut (Cao et al., 2003). It is also possible that improved activity of proteolytic digestive enzymes (Yokhana et al., 2014) and digestibility of protein (Cao et al., 2003; Kalmendal et al., 2011) resulted in greater availability of protein to support immune system functions.
Table 1 - Mean live body weight, lymphocyte proliferation, total number and area of Peyer’s patches (Pp) relative to the area of the small intestine (jejunum + ileum), (mean and pooled SEM, N = 18 for live body
weight and N = 8 for other parameters ) of pullets fed different diets.
Treatment*
Live body weight
(g)
Lymphocyte proliferation (%)1 Peyer’s patches
T-cells B-cells Area (% small intestine area) Number
Control 1506.52a 79.40a 106.58a 1.55a 7.13a MF 1552.59ab 100.40b 122.42b 1.76a 8.00ab IF 1607.46b 103.09b 128.97b 2.36b 10.00b Pooled SEM 11.05 3.69 3.12 0.099 0.477
*Control - Pullet Grower, Barastoc - Ridley Agriproducts, with no additive; IF (insoluble fibre), Control diet with 1.5g/100g Arbocel® RC
fine, MF (mixed fibre), Control diet with 1.5g/100g OpticellC5 a-c Values with different superscripts in the same column are significantly different (P<0.05). 1- % increase of Con A and LPS stimulated cells relative to unstimulated cells.
IV. CONCLUSION
Addition of IF to the diets of pullets resulted in heavier body weights, higher T- and B-lymphocyte proliferation and increased numbers and sizes of Pp than observed in Control pullets: MF on the other hand only resulted in higher T- and B-lymphocyte proliferation. Therefore, increasing the concentration of IF in the diet of 10 week old pullets prior to point of lay, may be a useful alternative to antibiotics both as a growth promoter and to generate a greater number of B and T lymphocytes. ACKNOWLEDGEMENTS: The authors thank the Ministry of Higher Education and Scientific Research-Iraq for providing scholarships to Sherzad Mustafa Hussein and Johnny Shumuel Yokhana and the University of Duhok, Kurdistan Region, Iraq for giving them study leave. We also thank Rob Evans and the LARFT staff for help with care of pullets.
REFERENCES
Cao BH, Zhang XP, Guo YM, Karasawa Y & Kumao T (2003) Asian-Australian Journal of Animal Sciences 16: 863-866.
Cornes J (1965) Gut 6: 225-229. Dong XF, Gao WW, Tong JM, Jia HQ, Sa RN & Zhang Q (2007) Poultry Science 86: 1955-
1959. Hosono A, Ozawa A, Kato R, Ohnishi Y, Nakanishi Y, Kimura T & Nakamura R (2003)
Bioscience, Biotechnology and Biochemistry 67: 758-764. Hussein SM, Yokhana JS & Frankel TL (2014) Advances in Animal Biosciences 5: 049. Incharoen T & Maneechote P (2013) American Journal of Agricultural and Biological Sciences 8:
323. Jiménez-Moreno E, González-Alvarado J, González-Serrano A, Lázaro R, and Mateos G
(2009) Poultry Science 88: 2562-2574.
Aust. Poult. Sci. Symp. 2016.....27
99

Kalmendal R, Elwinger K, Holm L & Tauson R (2011) British Poultry Science 52: 86-96. Lavoie ET & Grasman KA (2005) Archives of Environmental Contamination and Toxicology
48: 552-558. Laxminarayan R, van Boeckel T & Teillant A (2015) OECD Food, Agriculture and Fisheries
Papers, No. 78 (OECD Publishing). http://dx.doi.org/10.1787/5js64kst5wvl-en Mateos G, Lázaro R & Gracia M (2002) The Journal of Applied Poultry Research 11: 437-
452. Mateos G, Jiménez-Moreno E, Serrano M & Lázaro R (2012) The Journal of Applied Poultry
Research 21: 156-174. Pierre F, Perrin P, Champ M, Bornet F, Meflah K & Menanteau J (1997) Cancer Research
57: 225-228. Sato K, Takahashi K, Aoki M, Kamada T & Yagyu S (2012) The Journal of Poultry Science
49: 86-93. Shi-bin Y & Hong C (2012) African Journal of Biotechnology 11: 3490-3495. Świątkiewicz S, Arczewska-Włosek A & Jόzefiak D (2014) World's Poultry Science Journal
70: 57-68. Yokhana JS, Hussein SM & Frankel TL (2014) Proceedings of the XIVth European Poultry
Conference, Stavanger, Norway, Summary P196.
Aust. Poult. Sci. Symp. 2016.....27
100

WORKING WITH THE EGG STRUCTURE TO MINIMISE SALMONELLOSIS
N. SPARKS1
Summary Eggs can be a significant cause of salmonellosis with the potential to harm both the consumer and, when consumer confidence is damaged, the producer. Measures used to control Salmonella in the in the UK-laying flock are used as exemplars of approaches that are and can be used in other countries. The importance of preventing translocation of surface contaminants such as Salmonella across the shell and the factors that may predicate this – in particular water – are highlighted and discussed in the context of production practices, such as egg washing.
I. INTRODUCTION Eggs are widely recognised as a food that provides high quality nutrients while being relatively inexpensive to purchase (Sparks, 2006). Eggs are also one of the few animal products that may be sold to the consumer without any form of processing, beyond a quality check and which the consumer may consume raw and with little or no additional preparation. It is testimony to the egg’s natural biological and chemical microbial defences that so few ‘nest-clean’ eggs are contaminated with either pathogens or spoilage organisms and that the product can remain safe to consume several weeks after the point of lay, not infrequently after what might be considered inappropriate storage. However, the egg’s defences against microbes are not infallible and the challenges that are being imposed on shell eggs are, if anything, increasing with time. Eggs are a commodity with all that this entails; many countries will trade shell eggs requiring harmonisation of production, storage and transport conditions and, with the continued growth in eating food prepared outside of the home the opportunities for contaminated products to affect more consumers increase (FOODmap, 2012).
This said, the consumers’ understanding of the risk of food poisoning is skewed by optimistic bias, even when the consumer has experienced salmonellosis (Parry et al., 2004; Redmond and Griffith, 2004). However, as was seen in the UK when, in the late 1980s, Salmonella Enteritidis was causing an increase in food poisoning cases associated with eggs, even with an optimistic bias, a tipping point can be reached resulting in a sudden loss of confidence in a product and a collapse in sales – in the case of the UK a fall in sales of 60% which led to the slaughter of four million hens and a 25 year wait for sales to return to pre-collapse levels (Elanco, 2015).
In the wake of public health concerns and the crisis facing the UK sector, Government legislation was introduced requiring regular testing for Salmonella and, if found positive, slaughter or, as an alternative in the case of parent broiler breeder flocks, treatment with antibiotics. However, despite the legislation, the number of cases of egg-associated salmonellosis resulting from Salmonella Enteritidis phage type 4 (SE PT4) continued to rise throughout the late 1980s and early 1990s (Figure 1). The number of eggs found to be positive for SE PT4 in the 1991 and 1995/6 egg surveys reflected this, with the percentage of eggs contaminated remaining at around 1% (Table 1).
Like Government, the UK egg industry, led by the British Egg Industry Council (BEIC), recognised the need for producers to put in place measures that would minimise the
1 Animal and Veterinary Sciences Research Group, Scotland’s Rural College, Roslin Institute Building, Easter Bush, Midlothian, EH25 9RG UK; [email protected]
Aust. Poult. Sci. Symp. 2016.....27
101

risk of a reoccurrence of the conditions that led to the collapse in egg sales in 1988. Acknowledging that a problem existed, the sector took ownership of it and revamped a quality assurance (QA) scheme that required adherence to a number of science-based control measures. These included vaccination as well as procedures aimed at reducing the transmission of Salmonella from vectors such as feed, rodents and insects. The combined effect of the Government and industry initiatives was a reduction in the number of eggs contaminated with Salmonella which was reflected in a reduction in the number of human cases of salmonellosis reported (Table 1, Figure 1).
Figure 1 - Laboratory reports of human Salmonella cases in the UK (1981–2010) (adapted from O’Brien, 2012). (CMO = Chief Medical Officer; BEIC = British Egg Industry Council; Egg survey = UK survey of eggs for Salmonella conducted by the UK’s Food Standards Agency).
Table 1 - Comparison between the percentage of samples positive for Salmonella subtypes isolated in the
1991, 1995/96 and 2003 retail surveys of UK-produced eggs (adapted from FSA, 2004).
Salmonella subtypes 1991* 1995/6** 2003** Salmonella Enteritidis
PT4 0.47 0.58 0.14 Other PTs 0.21 0.26 0.14 Total 0.60 0.82 0.28
Salmonella Typhimurium DT104 0.01 0.04 0.00 Total 0.09 0.04 0.00
Salmonella Infantis Total 0.04 0.00 0.04
Salmonella Livingstone Total 0.11 0.03 0.05
Other Salmonella types Total 0.04 0.09 0.00
Total Salmonella detected 0.92 0.99 0.32 *England and Wales; **England
The ability to use a live vaccine that was effective against S. Enteritidis as well as Salmonella Typhimurium was undoubtedly a, if not the, critical factor in the ability of the
Aust. Poult. Sci. Symp. 2016.....27
102

sector to reduce the incidence of Salmonella-contaminated eggs. However, the importance of preventing horizontal transmission as well as measures to prevent re-introduction or persistence of pathogens between flocks was crucial to the success of the overall strategy (FSA, 2004). Davies and Breslin (2004) noted that controlling disease on a modern laying unit can be more difficult than might be expected. The reasons for this include the large number of birds in modern laying units, the multi-stage nature of production facilities, the fixed nature of much of the equipment and the use of conveyors that link houses to move eggs and manure. These factors, combined with difficulties in controlling dust, pests and vermin, make effective cleansing and disinfection difficult and can lead to Salmonella persisting on units.
The egg survey that took place in 1991 reported that ‘the majority of the contamination [was] thought to be on, as opposed to in, the egg’ (FSA, 2005). Later surveys were more specific, discriminating between those Salmonella recovered from the shell and those from the contents. So, for example, in the 2003 eggs at retail survey Salmonella was detected on the shell but none of the eggs’ contents were positive; in a 2005/7 survey of catering eggs only one of the six positive samples was shell and contents positive while the others were shell positive; while in the 2005/06 non-UK egg survey only 10 of the 157 Salmonella-positive samples were found to be contents positive (ACMSF, 2007). These data reinforce the need to minimise the transfer of bacteria, and particularly pathogens such as Salmonella, through the eggshell and into the egg contents. It also highlights the importance of those in the food chain not inadvertently negating the egg’s natural defences.
II. THE EGG’S MAIN PHYSICAL DEFENCES AGAINST BACTERIA Like all bird eggs, the hen’s egg has evolved as a vessel that will enable a blastoderm to develop into a viable hatchling. The nutrients and protection that the developing embryo requires are provided by the egg. Respiratory gases are exchanged across the shell via the many pores that run across the shell. For the developing embryo it is imperative that these pores remain free of obstruction until the hatchling has broken through the shell and, hatching being energetically very demanding, the embryo’s requirement for oxygen is maximal at the time of hatching. Birds that incubate their eggs in wet or muddy conditions face two challenges. The first is that the outer region of the pore becomes blocked with organic material (mud, faeces, etc.) or water and the second is that water enters the pore canal. The first may restrict the diffusion of respiratory gases across the shell to such an extent that the embryo dies while the second can result in contaminants moving from the surface of the shell to the inner surface where they can infect and potentially eventually kill the developing embryo (Sparks, 1994). So, whereas birds that incubate their eggs in arid environments, such as the ostrich (Struthio camelus) have no need to protect the mouth of the pore where it emerges on the surface of the shell, birds that lay their eggs in muddy scrapes etc., such as the red junglefowl (Gallus gallus) from which the modern laying hen is descended, have evolved a porous cover – the bloom or cuticle – to protect the outer entrance to the pore canal.
The hen’s egg cuticle is organic in nature, consisting of an inner layer that is rich in sulphated polysaccharides and predominantly non-crystalline phosphates (e.g. ovocalyxin-32, osteopontin) while the outer layer has a similar composition except for having a higher concentration of protein (Rodríguez-Navarro et al., 2013). When the surface of the cuticle is viewed at high resolution it can be seen to have an irregular appearance, the surface riven by cracks of varying lengths and widths although most tend to be significantly less than 1µm. The cracks and fissures in the cuticle are sufficiently narrow that the surface tension of water prevents liquid water moving into the pore, tension that is lost when detergent is added to the water (Board and Halls, 1973).
Aust. Poult. Sci. Symp. 2016.....27
103

This dense, cracked appearance of the mature cuticle is in marked contrast to its appearance immediately after oviposition, when it has a more open appearance (Figure 2 and 3) (Sparks and Board, 1985). The ‘sponge-like’ appearance of the immature phase is characterised by the moist, slippery feel that an egg has immediately after it is laid, while the denser appearance of the mature cuticle is found on the egg once the cuticle is dry to the touch.
Figure 2 - Immature cuticle, immediately post-lay. Bar marker 10 µm.
Figure 3 - Mature cuticle, 1 h post-lay, also showing an open pore (arrowed). Bar marker 10 µm.
As the hen ages so there is tendency for the depth and uniformity of cuticle coverage
to deteriorate; however, even in eggs from birds < 30 weeks of age it is not unusual for the cuticle coverage to be uneven, often being thinner in and around the broad pole (Sparks, 1985; Rodríguez-Navarro et al., 2013).
The pores that traverse the shell are trumpet-shaped (Board et al., 1977) and in the hen’s egg it has been estimated that there can be upwards of 17,000 pores (Board et al., 1977). The diameter of the pores within one shell will vary considerably although the effective pore area (i.e. the sum of the pore areas) remains remarkably consistent across a clutch of eggs (Sparks, 1985). Typically the diameter of a pore in a hen’s egg will be in the range of 15–65 µm (Board et al., 1977), making the lumen of the pore significantly larger than most micro-organisms (typically 1–5 µm).
Any organism that reaches the inner surface of the shell will be faced with a matrix that consists of the inner and outer membrane fibres and, separating these fibrous membranes from the underlying albumen, the sheet-like limiting membranes. The inner and outer membranes differ insofar as the inner membrane accounts for only some 15% of the thickness of the inner and outer membranes combined and the constituent fibres tend to be thinner and packed more closely together (Tranter et al., 1983, Sparks, 1985). This said, the inter-fibre space, even within the more densely packed inner membrane, is significantly greater than that the dimensions of most bacteria (Sparks, 1985).
III. MECHANISM BY WHICH BACTERIA PASS ACROSS THE SHELL BARRIER The ability of an intact shell integument to prevent the movement of bacteria from the outer to the inner surface is primarily dependent upon water to move bacteria across the shell (Board and Tranter, 1995; Berrang et al., 1999). Condensation – so-called sweating – egg washing or wiping the egg with a damp cloth may all provide sufficient moisture to transport bacteria from the outer to the inner surface of the shell.
Aust. Poult. Sci. Symp. 2016.....27
104

In practice, if the egg is intact, the quality of the cuticle is a major determinant as to whether or not water and associated contaminants will penetrate the egg (Sparks, 1985). Sparks and Board (1983) reported that there was no correlation between the ability of an egg to resist water uptake (caused by warm eggs (37oC) being placed in cold (~4oC) water) and the shell’s porosity as measured by water vapour conductance. Furthermore eggs that lacked a cuticle took up on average almost three times as much water as those eggs with a cuticle. De Reu et al. (2006) noted that, specifically in the case of S. Enteritidis, shell thickness nor pore number were correlated with bacterial eggshell penetration, but that ‘cuticle deposition was lower for penetrated compared to non-penetrated eggshells’.
At the point of lay the cuticle has an open structure (see section II) and a high water content. Sparks and Board (1985) demonstrated that, at the point of lay, this moist open structure predisposed the egg to internal contamination, bacteria being drawn through the shell and into the membranes in large numbers. In contrast, once the cuticle had dried and ‘matured’ the integument presented a significant barrier to bacteria (Figure 4). The practical implications of this are significant and reinforce the need to ensure that eggs are laid into an environment free of pathogens and, preferably, spoilage organisms. Allowing the warm egg, with a wet, immature cuticle to come into contact with micro-organisms not only provides a rapid and efficient way for bacteria to be transported, along with potentially protective organic material, deep into the pore canal or the shell membranes. In addition, as the cuticle dries out and forms its protective cap over the pores, it is likely that the cuticle will prevent the sanitiser reaching the contaminants.
Figure 4 - Inner surface of an eggshell challenged with bacteria when the cuticle was immature (left) and mature (right). The presence of bacteria is shown by dye that has been metabolised by the bacteria (Sparks and Board, 1985).
Other means by which water may come into contact with the surface of the egg
include condensation which can form when an egg is taken from cool conditions, such as refrigerated storage, and placed in a warmer atmosphere, potentially allowing the dew point to be reached and water from the warmer air condensing out on the cooler surface of the egg.
Aust. Poult. Sci. Symp. 2016.....27
105

This can be prevented by those handling eggs ensuring that the conditions for contamination to occur are avoided. Water may also be introduced by wiping the surface of the egg with a damp cloth. Factors that increase the risk of this practice causing contaminants to move from the outer to the inner surface of the shell include: (i) using excessive amounts of water combined with not drying the shell after wiping; (ii) using water that contains insufficient sanitiser; and (iii) the temperature of the water being close to, or below, the temperature of the egg. It is notable that breeding companies recommend not using damp cloths for removing soiling from the egg, the risk of contaminating the egg content being considered to be too great (Tullett, 2009). Of all the reasons why the shell may become wet, egg washing is likely to be the most common and the most researched (see below).
Bacteria that are drawn down the pore canal by water will come to rest either in the lumen of the canal or in the shell membranes. Some authors have suggested that the shell membranes possess antimicrobial properties and/or are able to ‘filter’ out bacteria (Mayes and Takeballi, 1983) although others (Garibaldi and Stokes, 1958; Tung et al., 1979), the author included, consider the membranes’ ability to restrict the progress or viability of bacteria to be at best limited, it being more likely that the membranes provide a protective matrix for bacteria separating contaminants from the inimical environment of the albumen (Sparks, 1985).
IV. EGG WASHING The washing of table eggs is mandatory in some countries while in others, such as the UK, it can mean the egg having to down-graded. The reasons for the different approaches may stem from a combination of early (adverse) experiences with egg washing, concerns over egg washing being used as a panacea for poor husbandry, the nature of the dominant production and marketing systems and a means of protecting the home shell egg market (Hutchison et al., 2003, 2004; Messens et al., 2011). When carried out correctly egg washing can significantly reduce the microbial load on the egg; however, if now well-defined procedures and precautions are not taken, there is an increased risk of pathogens and spoilage organisms being transported into the egg and also some of the egg’s natural defences against bacteria, being negated (Hutchison et al., 2003).
Washing a soiled egg may improve its appearance, particularly if it is a white egg, but the microbiological benefits are more difficult to predict. While the microbial load on the shell of a nest-clean egg may be considerable, the majority of organisms are neither pathogenic nor spoilage organisms (Board and Tranter, 1995), so from a food safety perspective the benefit of washing a nest-clean egg may be negligible. Visible contamination of the shell is a poor indicator of the associated microbial load, similarly the number of organisms in faeces have been reported to be poorly correlated to the number of pathogens in an egg (Board, 1977; Mawer et al., 1989). The reasons for this are likely to be due to the complex interactions outlined above between the time the egg was challenged (including how mature was the cuticle), the quality of the cuticle that the contaminant came into contact with, the presence of water, and the temperature differential between the contaminant and the egg. Another factor that has not been touched on but which is crucial when trying to understand the relative importance of the mechanisms involved in eggs becoming contaminated is the quality of the experimental design/analytical modelling – it being likely that in some instances the failure to, for example, show causal relationships has resulted from too small a sample size. It is notable therefore that Henzler et al. (1998) reported that the only significant risk factors for eggs becoming S. Enteritidis-positive were heavily contaminated faeces (> 50% manure samples testing positive for S. Enteritidis). The authors concluded that a flock with a high level of manure contamination was 11 times more likely to produce S. Enteritidis-
Aust. Poult. Sci. Symp. 2016.....27
106

contaminated eggs than a flock with a low level (< 50% manure samples testing positive) (Henzler et al., 1998).
The requirements for successful egg washing have been well documented over the years and the ability of egg washing machines to control water temperatures and sanitiser concentrations has improved from the earliest days of egg washing (Hutchison et al., 2003). Critical though the various criteria are, it needs to be remembered that egg washing is unlikely to kill bacteria lodged in the shell membranes (so the benefits of washing eggs that were contaminated at the point of lay are likely to be aesthetic only) and maintaining the temperature differential between the egg and the wash water is critical in preventing wash water and any associated contaminants entering the egg (Hutchison et al., 2003, 2006).
Concerns have been expressed by some about the risk of the cuticle being damaged during egg washing (see Messens et al., 2011) and while some designs of egg washer can damage the cuticle (Sparks and Burgess, 1993) modern machines designed with this in mind are less likely to cause significant damage to the cuticle. Also the risk presented by a less-effective cuticle post-washing should be reduced, provided that the washing effectively removes contaminants from the shell surface, the egg is dried promptly after washing and contaminants and water are not subsequently re-introduced.
V. CONCLUSIONS While it could be argued that the consumer is relatively tolerant of a low level of Salmonella-contamination of table eggs, the failure to control salmonellosis can have severe consequences for consumers and producers alike. However, even with access to live vaccines, modern egg production facilities can make it difficult to control the spread and persistence of Salmonella. This said, there is good evidence that attention to detail can result in units with a history of persistent Salmonella infections becoming Salmonella-negative. However, while laying units that are positive for Salmonella exist, as generally far more Salmonella are detected on the shell rather than in the egg, the risk of contaminants moving from the relatively hostile environment of the shell into the egg contents is something that needs to be managed. Care needs to be taken to ensure that eggs are laid into a pathogen-free environment – preventing the transfer of contaminants across the shell while the cuticle is immature – and thereafter water needs to be kept away from eggs unless it is for the purposes of washing under tightly controlled conditions. While egg washing can efficiently and effectively remove contamination from the surface of the shell it will not normally reduce the microbial load within the egg. The key to preventing trans-shell contamination of the egg is the production of a nest-clean egg. ACKNOWLEDGEMENTS: It is a pleasure to be able to thank the AECL for enabling the author to attend the APSS 2016.
REFERENCES ACMSF (2007) Food Standards Agency surveillance programme on Salmonella
contamination in eggs available to the UK consumer. (Advisory Committee on the Microbiological Safety of Food). http://www.acmsf.food.gov.uk/sites/default/files/mnt/drupal_data/.../880eggs.pdf
Berrang M, Cox NA, Frank JF & Buhr RJ (1999) Journal of Applied Poultry Research 8: 499-504.
Board RG (1977) The microbiology of eggs, In: Egg Science and Technology (Eds. Stadelman WJ & Cotterill OJ, AVI Publishing Company Inc, Westport Connecticut) pp. 49-64.
Aust. Poult. Sci. Symp. 2016.....27
107

Board RG & Halls N (1973) British Poultry Science 14: 69-97. Board RG & Tranter HS (1995) The microbiology of eggs, In: Egg Science and Technology
4th Edition (Eds. Stadelman WJ & Cotterill OJ, Food Products Press, New York) pp. 81-104.
Board RG, Tullett, SG & Perrott HR (1977) Journal of Zoology 182: 251-265. Davies R & Breslin M (2004) Avian Pathology 33: 133-144. De Reu K, Grijspeerdt K, Messens W, Heyndrickx M, Uyttendaele M, Debevere J & Herman
L (2006) International Journal of Food Microbiology 112: 253-260. Elanco (2015) Salmonella 360o Bulletin Issue 5: Salmonella in poultry in the United
Kingdom - the public health burden and the lion code approach to its control and prevention. https://www.salmonella360.com/cms3/assets/fullsize/858
FOODmap (2012) http://www.agriculture.gov.au/SiteCollectionDocuments/ag-food/food/national-food-plan/submissions-received/FOODmap_-_an_analysis_of_the_Australian_food_supply_chain_REVISED_30_July.doc
FSA (2004) http://tna.europarchive.org/20110116113217/http:/www.food.gov.uk/multimedia/pdfs/fsis5004report.pdf
FSA (2005) http://www.food.gov.uk/science/research/foodborneillness/b15programme Garibaldi JA & Stokes JL (1958) Journal of Food Science 23: 283-290. Henzler DJ, Kradel DC & Sischo WM (1998) American Journal of Veterinary Research 59:
824-829. Hutchison ML, Gittins J, Walker A, Moore A, Burton C & Sparks N (2003) World’s Poultry
Science Journal 59: 233-248. Hutchison ML, Gittins J, Walker A, Sparks N, Humphrey T, Burton C & Moore A (2004)
Journal of Food Protection 8: 4-11. Hutchison ML, Walters LD, Gittins J, Drysdale L & Sparks N (2006) World’s Poultry
Science Journal 62: 259-267. Mawer SL, Spain GE & Rowe B (1989) Lancet i: 280-281. Mayes FJ & Takeballi MA (1983) Journal of Food Protection 46: 1091-1098. Messens W, Gittins J, Leleu S, Sparks N, Immerseel FV, Nys Y & Bain M (2011) Egg
decontamination by washing. In: Improving the Safety and Quality of Eggs and Egg Products Volume 2: Egg Safety and Nutritional Quality (Woodhead Publishing, Cambridge) pp. 163-180.
O’Brien SJ (2012) Clinical Infectious Diseases 56: 705-710. Parry SM, Miles S, Tridente A & Palmer SR (2004) Risk Analysis 24: 289-299. Redmond EC & Griffith CJ (2004) Appetite 43: 309-313. Rodríguez-Navarro AB, Domínguez-Gasca N, Muñoz A & Ortega-Huertas M (2013) Poultry
Science 92: 3026-3035. Sparks NHC (1985) The hen’s eggshell: a resistance network. (PhD thesis, University of
Bath). Sparks NHC (1994) Shell accessory materials: structure and function. In: Microbiology of the
Avian Egg (Eds. Board RG & Fuller R, Chapman & Hall, London) pp. 25-42. Sparks NHC (2006) World’s Poultry Science Journal 62: 308-315. Sparks NHC & Board RG (1984) British Poultry Science 25: 267-276. Sparks NHC & Board RG (1985) Australian Veterinary Journal 62: 169-170. Sparks NHC & Burgess AD (1993) British Poultry Science 34: 655-662. Tranter HS, Sparks NHC & Board RG (1983) British Poultry Science 24:537-547. Tullett SG (2009) Abor Acres Update: Investigating Hatchery Practice (Aviagen, UK). Tung MA, Garland MR & Gill PK (1979) Canadian Institute of Food Science and
Technology Journal 12: 16.
Aust. Poult. Sci. Symp. 2016.....27
108

THROUGH-CHAIN MANAGEMENT OF BACTERIAL PATHOGENS ASSOCIATED WITH POULTRY MEAT IN QUEENSLAND, AUSTRALIA
M. GROVES1, A. WILSON1 and L. CUTTELL1
Summary
Campylobacter and Salmonella are leading causes of foodborne illness globally. Clinical infection caused by these organisms is referred to as campylobacteriosis and salmonellosis and is characterised by symptoms including enteritis (inflammation of the small intestine) and diarrhoea. These illnesses are often associated with the consumption of primary produce that has been insufficiently cooked or other foods that have been cross-contaminated through incorrect handling. Poultry meat is a common vehicle of Campylobacter and Salmonella. In Australia, the safe and wholesome production of poultry meat has long been a requirement of legislation, including the Australian Standard for Construction of Premises and Hygienic Production of Poultry Meat for Human Consumption (AS4465). In 2012, the Primary Production and Processing Standard for Poultry Meat (Standard 4.2.2) of the Australian and New Zealand Food Standard Code was introduced to provide a nationally consistent approach to the safe production and processing of poultry meat, with a focus on managing through-chain risks presented by pathogenic bacteria. Safe Food Production Queensland (SFPQ) undertook a comprehensive engagement process to ensure that the requirements of Standard 4.2.2 could be sustainably and uniformly met by Queensland’s poultry meat industry. This implementation process coincided with a marked reduction in the incidence of Campylobacter in the community in Queensland. Since 2014, a change has been observed in the epidemiology of Campylobacter and Salmonella in the state. This has prompted a whole-of-Government response to better the understanding the causes of these epidemiologic changes and to assess and strengthen existing controls. The strategy is expected to deliver a platform of knowledge to help improve public health outcomes in Queensland.
I. INTRODUCTION Poultry is the most readily consumed fresh meat in Australia. Over the past decade consumption of chicken has increased almost 30% in Australia reaching approximately 45 kg per capita in 2014 (Hogan, 2015). Satisfying the high demand for poultry meat necessitates intensive farming and highly mechanised processing systems. Processing activities present considerable risk for the contamination of poultry carcasses with bacteria that are pathogenic for humans. Bacterial inhabitants of the skin and gastrointestinal tract of the bird and bacteria present in the processing environment can be introduced onto carcasses at this time. Such bacteria include Campylobacter, Salmonella, Escherichia coli, Listeria, Clostridia, Yersinia and Enterococcus, among others (Lindblad et al., 2006). In Australia, Campylobacter and Salmonella are the main microbiological hazards associated with poultry meat due to their high prevalence among poultry flocks and propensity to contaminate poultry carcasses (FSANZ, 2010). The control of pathogens associated with raw poultry meat has traditionally focused on interventions applied during processing. However, it is virtually impossible to prevent all microbial contamination of raw meat products. Therefore, upholding the safe and wholesome status of poultry meat and preventing illness due to cross contamination from raw meat products requires a concerted effort through the entire supply chain and in the community.
1 Food Incident Response and Science Team, Safe Food Production Queensland; [email protected]
Aust. Poult. Sci. Symp. 2016.....27
109

The regulatory approach for the control of foodborne hazards in Australia is founded on the implementation of standards published in the Food Standards Code by Food Standards Australia and New Zealand (FSANZ). State regulatory agencies implement and enforce the elements of the Code through various legislative instruments and monitor the effectiveness of these controls. In Queensland, the reduction of foodborne illness is a priority and is achieved through a legislative platform focused on through-chain, risk-based principles. For primary produce, the platform is comprised of several pieces of legislation, each addressing food safety at different levels of the food supply chain, and administered by three regulatory agencies. In short, the Department of Agriculture and Fisheries (DAF) administers the Stock Act 1915 (to be superseded by the Biosecurity Act 2014), addressing biosecurity and animal health at the primary production level; Safe Food Production Queensland (SFPQ) administers the Food Production (Safety) Act 2000 and Food Production (Safety) Regulations 2014, addressing food safety at the primary production and processing levels; and Queensland Health (QH), together with assistance from local councils, administers the Food Act 2006, which addresses food safety in the retail and food services sectors.
In May 2012, FSANZ’s Primary Production and Processing Standard for Poultry Meat (Standard 4.2.2) was adopted by the Queensland Government to strengthen food safety regulation in the poultry meat industry and introduce through-chain measures to control food safety hazards. To assist the implementation of Standard 4.2.2, SFPQ, in consultation with the Queensland poultry meat industry developed a framework comprising standardised procedures, food safety interventions and performance targets to support the requirements of Standard 4.2.2 and AS4465. These actions were shown to reduce the concentration of Campylobacter and Salmonella on poultry meat and coincided with a profound decline in the incidence of campylobacteriosis, and a subtle change in the incidence of salmonellosis (NNDSS, 2015). However, since 2014 there has been an increase in the incidence of campylobacteriosis in Queensland, and several large-scale salmonellosis outbreaks in the south east corner of the state. Poultry meat and eggs have been identified as the most likely sources of Campylobacter and Salmonella, respectively.(Queensland Health, 2015a, Queensland Health, 2015b).
The change in the epidemiology of campylobacteriosis and salmonellosis has prompted an inter-agency collaboration between SFPQ, DAF and QH with a coordinated, through-chain focus on the food pathogen combinations of Campylobacter and poultry meat and Salmonella and eggs. The key objective of the strategy in relation to poultry meat is to build upon previously implemented measures to improve the control of pathogens associated with poultry meat (namely Campylobacter but also including Salmonella) through the poultry meat supply chain and investigate other potential causes/factors. The following paper will discuss Campylobacter and Salmonella as foodborne pathogens; the implementation of Standard 4.2.2 in the Queensland poultry meat industry in 2012; an overview of the epidemiology of Campylobacter and Salmonella in Queensland prior to, and after the implementation of Standard 4.2.2; and the objectives of the newly developed Queensland Foodborne Pathogen Risk Reduction Strategy.
II. CAMPYLOBACTER AND SALMONELLA AS FOODBORNE PATHOGENS Campylobacter and Salmonella are gram negative, rod shaped bacteria. They thrive in low-oxygen environments, such as the gastrointestinal tracts of animals, where they can reach very high concentrations (Heres et al., 2004, Silva et al., 2011). Both organisms can survive, and in the case of Salmonella, reproduce, for protracted periods of time outside of animal hosts and in the presence of oxygen (Galis et al., 2013, Silva et al., 2011). Globally, Campylobacter and Salmonella are successful colonisers of domestic animals (e.g. food
Aust. Poult. Sci. Symp. 2016.....27
110

animals, pets) and wildlife, frequent contaminants of raw primary produce (e.g. raw meat, milk, eggs, vegetables) and common causes of foodborne illness.
Campylobacteriosis and salmonellosis represent a substantial economic and social burden for the Australian public and government (Kirk et al., 2014). The occurrence of these illnesses is often associated with the consumption of raw foods that have been improperly stored or handled and/or consumed undercooked or improperly treated. Clinical illness is typically characterised by nausea, vomiting, diarrhoea (sometimes haemorrhagic), abdominal cramps, headache and fever (Wassenaar and Blaser, 1999, Wallis and Galyov, 2000). Death and further complications are rare. However, under certain circumstances campylobacter can cause a neurodegenerative sequelae known as Guillain-Barre Syndrome (Wassenaar and Blaser, 1999). Symptoms of infection generally appear within a few days of consuming an infective dose which is estimated to be approximately 2.7-4.0 log10 for Campylobacter and approximately 1.0-2.4 log10 cells for Salmonella (Leggett et al., 2012, Food and Drug Administration, 2012). The low infective dose of both organisms means that effective disease prevention relies on studious management of food safety through-chain.
It is a well-established that by reducing the prevalence and concentration of foodborne pathogens on raw meat products the incidence of foodborne illness associated with the consumption of such foods can be similarly reduced. With regards to poultry meat, quantitative risk assessments suggest that a 1.0 log10 reduction of Campylobacter on poultry carcasses may be sufficient to reduce cases of campylobacteriosis in the community by 50-90%, assuming all other factors remain constant (EFSA Panel on Biological Hazards, 2011). Recent campaigns in Australia and overseas have demonstrated that significant reductions are practicable in this way.
III. FOOD SAFETY REGULATION AND THE QUEENSLAND POULTRY INDUSTRY
In Australia, it is a legislative requirement that microbiological hazards associated with poultry meat be controlled through the production and processing chain to achieve a product that is microbiologically safe and wholesome. To bring the elements of Standard 4.2.2 into effect in 2012, SFPQ undertook a systematic scientific and technical assessment of the Queensland poultry meat industry. The aim of the assessment was to ensure that food safety measures in place would satisfy the outcomes required in Standard 4.2.2. To achieve this, the following objectives were set:
1) Form a working-group partnership with the Queensland poultry meat industry to facilitate the exchange of dialogue and decision-making during and after the implementation period
2) Ascertain a baseline prevalence and concentration of Campylobacter and Salmonella on poultry meat at various points throughout the processing chain
3) Identify opportunities to reduce the presence of pathogens in poultry meat and develop standard operating protocols, including interventions and performance targets
4) Repeat the baseline survey to determine the effectiveness of the implemented framework
5) Continue to monitor compliance with legislative requirements, performance around agreed targets and make refinements to the framework as needed
The baseline survey was conducted between February and April 2012 with participation from all large and medium poultry meat processing facilities in Queensland (n=8), which together account for approximately 95% of all poultry meat produced in the state. Samples comprised caecal content (recovered post-slaughter) and whole carcasses collected: 1) post-evisceration; 2) post-washing/spin chilling; and 3) at the completion of
Aust. Poult. Sci. Symp. 2016.....27
111

processing (termed final product). All were analysed for the presence and concentration of Salmonella and Campylobacter using Australian Standard methodologies. Results compared favourably with those from a previous baseline survey performed by FSANZ (FSANZ, 2010). It was found that, on average, existing processing methods resulted in a net reduction in the concentration of Campylobacter and Salmonella on carcasses at the completion of processing. However, in some processing facilities the concentration of Campylobacter on carcasses actually increased marginally after spin-chilling.
Through consultation with industry, a set of new standard operating procedures (SOPs) were defined in order to provide greater in-process control of pathogenic bacteria through the processing chain. The design of SOPs was informed by data obtained from the baseline survey, a review of scientific literature, international best-practices, the requirements of Standard 4.2.2 and the Australian Standard for Construction of Premises and Hygienic Production of Poultry Meat for Human Consumption (AS4465:2005). SOPs were implemented at live bird receipt to reduce the presence of feed in-crop; evisceration to control physical contamination and ensure unacceptable carcasses do not proceed beyond final inspection; product decontamination/wash and spin-chilling to maintain sanitary conditions; and product chilling and storage to prevent contamination and proliferation of microbes. Each was written to provide a minimum amount of prescriptive direction, including expectations around target measures, corrective action procedures and overall food safety outcomes.
Following implementation of Standard 4.2.2, SFPQ repeated the microbiological baseline survey between September and November to examine the overall effect of these changes on the production system. Survey design was as per the initial baseline survey. Results demonstrated that the changes made during the implementation period eliminated the previously observed post-spin chill increase in Campylobacter and achieved a greater reduction in the number of cells per carcass through processing, achieving a state-wide mean concentration of 4.16 log10 CFU/final-product carcass. This represents, on average, approximately 25,000 less Campylobacter cells per carcass than achieved prior to the implementation of Standard 4.2.2. Improvements in the reduction of Salmonella were also noted, though the mean concentration for most processors was below the limit of detection of the testing methodology. The observed improvements are attributed to the implemented changes in process control measures, particularly the operation and monitoring of defined interventions.
During the implementation period, SFPQ and the Queensland poultry meat industry agreed to set microbiological targets to inform on the performance of process controls for pathogenic bacteria during production and processing. Targets were set for final product carcasses at <4.0 log10 CFU/carcass for Campylobacter and <2.0 log10 MPN/carcass for Salmonella. In order to consistently and sustainably achieve the agreed industry targets for these pathogens, further work was undertaken by industry to refine monitoring, verification and validation of food safety interventions. SFPQ has continued to engage with industry to assist these initiatives via the Poultry Meat Industry Consultation Group, by conducting regular, systematic assessments of processors, monitoring processing data around identified points within the industry and examining public health data on a regular basis. Recent regulatory assessments and performance data shows that the above framework remains effective in managing microbial contaminants on poultry meat and that processors are routinely achieving the industry-agreed targets.
Aust. Poult. Sci. Symp. 2016.....27
112

IV. EPIDEMIOLOGY OF CAMPYLOBACTER AND SALMONELLA IN QUEENSLAND Interrogation of epidemiological data captured by the National Notifiable Diseases Surveillance System (NNDSS) reveals that there was an increasing rate of campylobacteriosis in Queensland in the years leading up to the implementation of Standard 4.2.2 and the Queensland baseline framework in 2012. During the five years prior to 2013 (2008-2012), the mean number of notifications was 4704 cases per annum, with a maximum of 5131 notified cases in 2011 (NNDSS, 2015). Implementation of Standard 4.2.2 coincided with a substantial reduction in the incidence of campylobacteriosis cases in Queensland. The number of notifications in 2012 and 2013 fell by 18.5% and 25.3%, respectively, when compared with data for 2011 (NNDSS, 2015). The incidence reported in 2013 represented an 18 year low of approximately 82 cases per 100,000 population. The change in the incidence of salmonellosis in Queensland has been less pronounced (NNDSS, 2015). With the exception of 2012, the annual incidence of salmonellosis has risen by several hundred cases each year since 2008. This trend holds true when notification data is considered per 100,000 population. Considering that current performance data from Queensland poultry processors shows negligible concentrations of Salmonella on poultry carcasses, it seems unlikely poultry meat is a major source of salmonellosis in Queensland.
Over the past two years there has been an increase in the incidence of campylobacteriosis in Queensland. In 2015 the reported rate climbed to approximately 159 cases per 100,000 population (NNDSS, 2015). As previously mentioned, improvements that have been made in the primary production and processing sector during the implementation of 4.2.2 have largely been maintained and in some cases further improved, with the majority of processors regularly achieving performance targets. Understanding the reasons for the epidemiologic changes, and indeed the role that poultry meat processed in Queensland might be playing, has likely been complicated by a recent change in technologies used by diagnostic health laboratories. The molecular platforms now employed to identify causes of gastroenteritis in people have a much greater sensitivity than the traditional culture-based methods previously employed. It is not yet clear how widespread and uniform the uptake of this technology has been across diagnostic laboratories in Queensland. This and other factors will be investigated under the whole-of-Government risk reduction strategy.
V. QUEENSLAND FOODBORNE PATHOGEN RISK REDUCTION STRATEGY
In response to the recent changes in the epidemiology of Campylobacter and Salmonella in Queensland a whole-of-Government strategy has been launched by the relevant agencies SFPQ, DAF and QH. The overarching focus of the ‘Queensland Foodborne Pathogen Risk Reduction Strategy’ falls upon outbreak investigations and through-chain controls. The strategy will ensure that existing preventions and controls for Campylobacter and Salmonella at all levels of the supply chain are being upheld and continue to be strengthened. Further, it will investigate other possible causes for the increased incidence of these diseases. In short, this will include analysis of epidemiologic data to understand to what magnitude the use of PCR for the diagnosis of causes of gastroenteritis have exaggerated the reported incidence of campylobacteriosis and salmonellosis. Further, it will consider the ecology and virulence of Campylobacter species contaminating poultry meat, the origin and microbiological quality of poultry meat at the retail level in Queensland, the influence of climate and consumption patterns in areas of the state with exceedingly high reported incidence of foodborne illness. The specific actions to be carried out by each agency under the Queensland Foodborne Pathogen Risk Reduction Strategy are summarised in Table 1.
Aust. Poult. Sci. Symp. 2016.....27
113

Table 1 - Action plan for the Queensland Foodborne Pathogen Risk Reduction Strategy.
Agency: Objectives: DAF • Further increase awareness of on-farm biosecurity in relation to food safety risks
within poultry industry. • Enhance the passive general surveillance for Campylobacter.
SFPQ • Continue implementation of the through-chain national Primary Production and Processing Standard 4.2.2.
• Further engage with industry on food safety awareness and market forces affecting food safety, via a poultry industry working group and direct contact with businesses during regulatory work.
• Continued monitoring of compliance with regulatory requirements at the production and processing levels.
• Continued monitoring of the execution of food safety interventions and achievement of performance targets at the production and processing levels.
• Implementation of novel tools to monitor, in semi-real time, the achievement of food safety performance targets and public health outcomes.
QH • Review epidemiological data including prevalent genotypes to guide source attribution for human illness in North Queensland.
• Investigate the microbial quality and geographic origin of poultry meat sold at the retail level in Queensland.
• Consider the virulence and dose-response relationship of strains causing illness. • Determine the effect that new diagnostic methodologies have had on the
epidemiology food-borne illness in Queensland. • Improve environmental health officer risk assessment of food business activities
during inspections, particularly for businesses handling and preparing high risk foods.
• Examine and improve food hygiene and handling practices in the food services sector and community through strategic education initiatives
The strategy emphasises the continued exchange of information between regulators,
the general public and food businesses through-chain. Communication will focus on behaviours and responsibilities in order to foster continual improvements in food safety culture at each link in the chain. The success of the strategy will require poultry meat processors to continue to achieve the requirements of Standard 4.2.2 and the industry-agreed measures to manage the microbiological contamination of poultry meat. Similarly, businesses and consumers handling these products must acknowledge the hazards associated with raw poultry meat and maintain good food hygiene practices when handling these products during preparation. The strategy has been earmarked to run through to 2018. It is expected to deliver a platform of knowledge that will help improve public health outcomes in Queensland.
VI. CONCLUSIONS
The implementation of Standard 4.2.2 and the Queensland baseline framework, comprising food safety interventions, SOPs and performance targets, achieved an appreciable effect on the microbiological quality of poultry meat produced and processed in Queensland. Further improving the control of foodborne pathogens associated with poultry meat will require a better understanding of factors driving the occurrence of disease in the community and continual improvements in food safety management along the entirety of the supply chain. The Queensland Foodborne Pathogen Risk Reduction Strategy will assist in achieving these endeavours.
Aust. Poult. Sci. Symp. 2016.....27
114

REFERENCES EFSA Panel on Biological Hazards (2011) EFSA Journal 9: 2105-2246. US Food and Drug Administration (2012) Bad Bug Book: Foodborne Pathogenic
Microorganisms and Natural Toxins (Eds. K.A. Lampel, S. Al-Khaldi & S.M. Cahill, FDA, USA).
FSANZ (2010) http://www.foodstandards.gov.au/science/surveillance/pages/baselinesurveyonthep4998.aspx
Galis AM, Marcq C, Marlier D, Portetelle D, Van I, Beckers Y & Théwis A (2013) Comprehensive Reviews in Food Science and Food Safety 12: 155-182.
Heres L, Engel B, Urlings HA, Wagenaar JA & van Knapen F (2004) Veterinary Microbiology 99: 259-267.
Hogan J (2015) Agricultural Commodities 5: 129-133. Kirk M, Glass K, Ford L, Brown K & Hall G (2014) Foodborne illness in Australia: Annual
incidence circa 2010 (Australian Department of Health, Canberra). Leggett HC, Cornwallis CK & West SA (2012) PLoS Pathogens 8: e1002512. Lindblad M, Lindmark H, Thisted Lambertz S & Lindqvist R (2006) Journal of Food
Protection 69: 2875-2882. NNDSS (2015) Notifications for all diseases by State and Territory and year (National
Notifiable Diseases Surveillance System). http://www9.health.gov.au/cda/source/rpt_2_sel.cfm
Queensland Health (2015) Campylobacter outbreak prompts chicken prep advice (Queensland Health). https://www.health.qld.gov.au/townsville/media-releases/2015/150402-campylobactor.asp
Queensland Health (2015) Salmonella spike prompts health alert (Queensland Health). https://www.health.qld.gov.au/news-alerts/news/150313-salmonella-figures.asp
Silva J, Leite D, Fernandes M, Mena C, Gibbs PA & Teixeira P (2011) Frontiers in Microbiology 2: 200.
Wallis TS & Galyov EE (2000) Molecular Microbiology 36: 997-1005. Wassenaar TM & Blaser MJ (1999) Microbes and Infection 1: 1023-1033.
Aust. Poult. Sci. Symp. 2016.....27
115

SALMONELLA AND CAMPYLOBACTER IN POULTRY IN AUSTRALIA
M. SEXTON1
Summary
Salmonella and Campylobacter are major causes of foodborne illness in Australia and are readily found in poultry. Poultry meat and eggs are often implicated in outbreaks of salmonellosis and although Campylobacter only rarely causes outbreaks, the rate of sporadic cases is more than double the total cases of salmonellosis. A collaborative through chain approach needs to be applied to identify the risks throughout the whole chain and apply appropriate practices to reduce the burden of foodborne illness both to human health and cost to government, industries and the community in Australia. This paper presents some of the types of available data and its possible use.
I. INTRODUCTION
There are a number of organisms that can cause foodborne illness but their incidence is insignificant in comparison to Salmonella and Campylobacter which are the major causes of human foodborne illness in Australia (see Figure 1) and importantly, they are both readily found in poultry. Human foodborne illness causes a significant cost to the community through health care services and surveillance, regulation, food service and primary production areas. With the consumption of chicken in Australia up from 23.7 kg per person per year in 1990 to around 46 kg per person per year in 2015 (ACMF), and egg consumption going from 125 eggs per capita in 1990 (ABS) to 213 eggs per capita in 2014 (AECL), it is imperative that health services, regulators and industries work together to mitigate the frequency and severity of human illness associated with these organisms. It is vitally important that all of these sectors understand the dynamics of the primary production industries and their market drivers and also those of the food industries so that effective strategies can be developed to prevent food borne illness.
In Australia it is a requirement under each jurisdiction’s legislation that confirmed cases of human salmonellosis and campylobacteriosis are notified to the state or territory Health authorities (apart from sporadic Campylobacter infections in New South Wales). The data are collated and examined in each jurisdiction to determine if an outbreak is occurring. OzFoodNet (2015) is a national network of epidemiologists (managed centrally through the Commonwealth Department of Health) which investigates human foodborne disease to identify issues and potential ways to minimise foodborne illness in Australia. The data are collated nationally on the National Notifiable Disease Surveillance System (NNDSS 2015) and reported in OzFoodNet quarterly and annual reports. If an outbreak is detected this information is passed on to a State Food Safety regulator (which can vary between states) to investigate. Local Government authorities may also be involved. If it is suspected that a particular primary production sector is involved then another state government department which regulates that sector may also be involved.
In poultry Salmonella and Campylobacter readily colonise the gastrointestinal tract without usually causing clinical signs of disease. They also occur in other food producing animals and but more commonly produce disease in those species. This means that reducing Campylobacter and Salmonella is substantially more difficult from poultry because there are often no signs that a high load of these bacteria may be present, and there are minimal (or no) verification procedures to confirm if an intervention is efficacious in real-time. This means
1 Biosecurity SA, Primary Industries and Regions South Australia; [email protected]
Aust. Poult. Sci. Symp. 2016.....27
116

that the failure of an intervention can be identified via a human foodborne illness outbreak, if not identified through normal farm management.
Salmonellosis gains greater attention by human health authorities as it has been associated with large outbreaks of food poisoning in Australia. Campylobacteriosis is very rarely associated with outbreaks however the number of cases notified in Australia is at least double that of the total cases of salmonellosis (see Figure 1). To mitigate the risks associated with these two organisms causing foodborne illness it is important to understand and examine the existing data and issues and to also identify unknown variables so that appropriate control measures can be implemented throughout the entire food supply chain.
Figure 1 - Rate per 100000 of the population of the notifications of campylobacteriosis, salmonellosis, listeriosis, and STEC (Shigella Toxin producing Escherichia coli) in Australia, without campylobacteriosis data from New South Wales (NNDSS 2015).
II. SALMONELLA
Salmonella is a genus (sub family) of bacteria whose primary reservoir is in the intestinal tract of vertebrates but can grow in many different environments and survive in many harsh conditions (including freezing temperatures), can adapt itself to withstand desiccation, acid conditions and heat and in particular can grow with or without the presence of oxygen (Jay et al 2003). Approximately 10% of the known Salmonella serotypes have ever been found in poultry and only a few of these are common. The distribution of Salmonella serotypes in poultry varies geographically and changes over time, although several serotypes are consistently found at a high incidence (Gast, 2013).
Infections of poultry with Salmonellae can be divided into those infections which are generally avian host-specific and those infections with non-host-adapted serotypes (called paratyphoid Salmonellae). Those in the first group are S. Pullorum which causes pullorum disease (an acute systemic disease of chickens or poults), and S. Gallinarum which causes fowl typhoid (an acute or chronic septicaemic disease that most often affects mature birds). These diseases cause serious economic losses in poultry production but were eliminated in Australia (and many other countries) by extensive testing and eradication programmes.
Paratyphoid Salmonellae are found throughout the world and can infect a wide variety of hosts (vertebrate and invertebrate, mammals, reptiles, wildlife, domestic animals and
0
20
40
60
80
100
120
140
1991 1993 1995 1997 1999 2001 2003 2005 2007 2009 2011 2013
Rate
per
100
,000
of t
he p
opul
atio
n
Campylobacteriosis
STEC
Salmonellosis
Listeriosis
Aust. Poult. Sci. Symp. 2016.....27
117

humans) and can either cause asymptomatic intestinal carriage or clinical disease (Gast, 2013). These Salmonellae have emerged as leading agents of foodborne human disease and contaminated poultry meat and eggs are frequently implicated as vehicles for Salmonella transmission. As the poultry industry continues to improve its efficiency of production, poultry products have become a key source of animal protein throughout the world and of course no more so than in Australia, where consumption of chicken meat is now greater than any other meat supplied, and the consumption of eggs continues to increase per capita.
Typing Salmonella is a difficult process. The Salmonella subspecies enterica contains over 2600 different serovars (or serotypes) identified to date. Each serovar (often named from place of identification) is a unique combination of antigens (substances which stimulate the production of an antibody when introduced into a living animal or human), however, there are only a few serovars such as S. Typhimurium which are responsible for the majority of outbreaks of human foodborne illness. These serovars are further defined by a phage typing system which is determined by the sensitivity of the Salmonella cells to the lytic (destructive) activity of selected bacteriophages (viruses which infect and replicate in the Salmonella cells). An internationally recognised number is applied to the pattern of lysis and this system has been a useful tool to assist epidemiological studies and tracing foodborne outbreaks of salmonellosis (Bell and Kyriakides, 2002).
However, these typing methods are specialised, labour intensive, costly, confusing and slow. A more recent technique is MLVA (Multi Loci VNTR (Variable number tandem repeat) Analysis) which has been adopted in Australia since 2006 to define the Salmonella that cause problems in the human population, (usually S. Typhimurium). MLVA examines five different sections of genes from the organism and records the numbers of repeating patterns of the amino acids of the DNA and the patterns are used to determine whether isolates are related or not. However, the stability of the regions analysed appear to change rapidly which means two Salmonella that may be closely related can have different MLVA patterns. Over time it appears that the middle three gene loci assessed tend to change. Furthermore when surveys of chicken meat have been carried out and a minimum of three plate colonies are selected for typing from each isolate of Salmonella it has been found that a single piece of chicken meat may have three different phage types of S. Typhimurium but the same MLVA pattern. This suggests that neither phage typing nor MLVA are providing enough definitive information about the Salmonella, which make linking the Salmonella that caused human illness to a potential point source incredibly difficult and potentially subjective.
An even newer technique is Whole Genome Sequencing (WGS) which is a laboratory process that determines an organism’s complete genome sequence at a single point in time. By assessing and comparing entire genomes, variability issues with other typing methods can potentially be overcome to better identify related isolates. It is predicted that the use of this method will become more prevalent in the next few years.
Internationally S. Enteritidis and S. Typhimurium are the serovars responsible for the majority of human illness. This trend is reflected in the Australian data with one specific difference being that S. Enteritidis notifications in Australia are largely identified as being acquired overseas (although there are sporadic cases seen which are not associated with overseas travel). However S. Enteritidis is certainly not endemic in the poultry industry in Australia and it is extremely important that it remains so as eradication from poultry flocks overseas has been a very costly exercise, and the human health burden has been enormous.
In Australian human notifications there is a very interesting pattern observed between different regions (Figure 2). Both Tasmania and the Northern Territory (NT) have environmental Salmonellae as their most common serotypes (S. Mississippi and S. Ball respectively). In the other states by far the most common serotype is S. Typhimurium. In
Aust. Poult. Sci. Symp. 2016.....27
118

most parts of Australia the far distant second most prevalent serotype is S. Enteritidis (usually travel-acquired). The most commonly detected serotypes (in order of prevalence) also found in the Australian poultry industry are S. Infantis and S. Virchow however both of these can be found in a wide range of other commodities. Additional types found in the top human types vary between states but generally include S. Paratyphi B Var Java, S. Stanley, S. Newport, S. Saintpaul, S. Bovismorbificans, and S. Chester. Of the S. Typhimurium isolates detected in humans the most common phage types (PT) detected in the states where phage typing is still carried out (very little is done in NSW and less is being done in Qld) are PT 9, 108/170, 135, 135a and 44, which vary between states in their identifier numbers. PT 193, 197, 60, 141, 12A, 126 are frequently detected to varying degrees in each state. Surveys of retail poultry meat suggest that the average rate of S. Typhimurium detection on chickenmeat is around 0% – 7 % but varies considerably with all the above PTs being seen on occasions (Pointon et al 2008, SA Food Act Reports, ARSC Reports, NEPSS Non-Human Annual Reports).
Over time it has been observed that certain PTs of S. Typhimurium have become predominant in certain states particularly where climatic conditions are different. For example, between 2008 and 2012 in South Australia (SA) there were egg farms infected with PT 9, 29, 30, 44, 108, 126, 135, 135a and 193 but this has changed and since then PT 9 has become the predominant strain detected (two isolates with distinct MLVA patterns). At the same time there has been an obvious increase in SA human cases of PT 9 to the extent that during 2015 it has risen to over four times the rate of the next most common phage type. However, although one type of MLVA pattern is present when there is an outbreak, there is now an enormously diverse range of MLVA patterns detected in the sporadic human cases.
In SA all sectors of the Health and Food Safety authorities have examined ways of addressing the issue and are developing an Integrated Food Chain Surveillance working group with the idea of utilising expertise and data from all areas to share and communicate with the poultry and food industry. For example the South Australian Communicable Diseases Control Branch (CDCB) is carrying out a large case control study to try and determine factors involved in the escalating sporadic cases of S. Typhimurium PT9. The South Australian Food and Controlled Drug Branch (FCDB) has commenced surveys to look at the persistence and growth of S. Typhimurium in various raw egg foods with measurements correlating pH, aW (water activity), temperature and ingredient mixes. FCDB has also determined, from thorough outbreak investigations that there are problems with cross contamination from various types of mixing and vitamising equipment in food businesses where Salmonella has lodged and multiplied in the internal workings of the mixers. Further work is ongoing to examine possible control measures for these types of equipment, and additional training programmes are being conducted with local health authorities in the important risk factors to examine in food businesses and how to thoroughly investigate food businesses associated with foodborne illness. There are ongoing efforts to improve food safety programmes on farm to improve the efficacy of interventions and control measures where eggs are handled and/or washed, and/or graded with additional training and awareness in Salmonella provided to producers.
Surveys of retail chicken meat in SA have been undertaken in the last two years (SA Food Act Reports) Salmonella was present on 47% and 36% of the samples respectively, however in both surveys the presence of S. Typhimurium was not detected on chicken meat grown in SA and of the S. Typhimurium that was present on meat from interstate none of the PTs MLVA patterns matched the human cases notified in SA during the same period. However both S. Infantis and S. Virchow were present.
Aust. Poult. Sci. Symp. 2016.....27
119

Figure 2 - Rate (per 100000 of the population) of salmonellosis by state in Australia (1991 – 2014), omitting data for the Northern Territory (NNDSS 2015).
0
20
40
60
80
100
120
1991 1992 1993 1994 1995 1996 1997 1998 1999 2000 2001 2002 2003 2004 2005 2006 2007 2008 2009 2010 2011 2012 2013 2014
Rate
(per
100
,000
of t
he p
opul
atio
n)
ACT
QLD
SA
NSW
TAS
VIC
WA
Aust. Poult. Sci. Symp. 2016.....27

Layer farms in Australia are traditionally independent operations and to address market demand by maintaining a constant egg supply, they are usually multi-age (without strict biosecurity between the ages) and/or free range operations. This makes it very difficult to remove Salmonella from a farm once infected. On the other hand the broiler industry operates with an “all in- all out” system (ie single age on a farm) enabling cleanouts between batches and a period with no birds on the property which normally enables reducing the level of Salmonella (and Campylobacter).
III. CAMPYLOBACTER
The two dominant Campylobacter species which are associated with foodborne outbreaks in Australia are C. jejuni and C. coli but they both have very particular growth requirements and do not grow in normal air. They are both thermophilic, only growing between 30° and 45° C and requiring very specific microaerophilic conditions (5-6% oxygen and 10% carbon dioxide). They are both very sensitive to drying, especially at ambient temperatures. They can both be found in the intestinal tract of a wide variety of domestic and wild animals and show no sign of disease. (Wallace 2003). Campylobacter has been found on eggs but it is suspected that the dry environment of the shell is not conducive to its survival. As Campylobacter does not grow in the environment it is useful to count its presence on poultry meat products to estimate whether the concentrations are likely to pose a risk of cross contamination in the kitchen environment.
Although it is difficult to prevent colonisation of poultry flocks, there are many steps throughout the food chain which can reduce the levels of contamination on poultry meat, thereby reducing the risk of cross contamination to ready-to-eat foods.
Risk assessment modelling produced dose-response curves, which reflect the fact that the human infection process should be viewed as a probability of infection related to the dose ingested. These models seem to suggest a 5-50% probability for infection with a dose of 100 organisms, and a 50-80% probability for infection at 10000 organisms (Patrick et al., 2008). From this information, the Campylobacter counts detected as part of a SA retail survey of poultry meat in 2014 (SA Food Act Report 2014) were assessed and categorised into levels based on the perceived risk of portions of raw meat (approximately 500g) as being a source of cross contamination to food handling equipment, food handling surfaces and any ready-to-eat foods in a kitchen environment. For counts below 1000 colony forming units (CFUs) (the total count of Campylobacter on the whole portion of meat), the risk was considered to be low enough that it would be too difficult for a sufficient number of organisms to be transferred from the raw meat to a ready-to-eat food to cause food poisoning. On the other hand, counts over 5000 CFUs could transfer a sufficient number of organisms to cause food poisoning and hence would be a likely source of cross contamination to ready-to-eat foods. 76% of the samples fell into the low risk category and just 5% fell into the high risk category, with 80% of those being thigh meat. This information was of use to both regulators and industry to help provide an assessment of the effectiveness of control measures.
By examining the trends in rates of notifications of campylobacteriosis there are some interesting observations to be made. Figure 1 shows that from 1991 to 2000 rates rose from 80 to 120 cases per 100000 of the population, but since then there has been a steady trend of rates at 100 - 120 cases per 100000 of the population. If chicken meat is contributing significantly to campylobacteriosis then something has significantly changed somewhere through chain, especially considering that during this period of time the consumption rate of chicken meat in Australia has doubled and actual production has tripled. The most likely
Aust. Poult. Sci. Symp. 2016.....27
121

indication from this data is that control measures in the chicken meat industry have been effective, and further source attribution research is required.
Figure 3 shows the yearly rates for each state and territory except NSW and Figure 4 shows the monthly rates for Queensland, Victoria, South Australia and Western Australia (this is the type of data that is available through OzFoodNet). There is an interesting seasonal variation in rates between the states which suggests that more close examine is required on the effects of climate. For example, Tasmania has some very high rates of campylobacteriosis reaching peaks of over 200 to 250 but only during the summer months. South Australia tends to have an increase in the winter months when humidity is higher whereas the other states tend to have increases in the summer months, yet the NT has had lower rates than other states in the range of 50 to 100 cases but has recently been trending upward toward the 100 to 150 rate.
South Australia has begun to survey retail chicken meat at different times of the year and preliminary results suggest that there is a trend towards higher counts of Campylobacter on chicken meat during winter, which appears to align with higher rates of human notifications during this same period.
Figure 3 - Rates per 100000 of the population for campylobacteriosis in each state in Australia except for NSW.
IV. CONCLUSION
A collaborative through chain approach is required to address the burden of human foodborne illness. It requires open discussion of problems and issues faced by all stakeholders and a sharing of information between all sectors which will assist in understanding risks, and identification of appropriate, effective, interventions, that minimally impact on the productivity and profitability of the primary production businesses while significantly reducing the risk of human foodborne illness. ACKNOWLEDGEMENTS: I would like to thank all the OzFoodNet personnel in each state and OzFoodNet Central which contributed information from their databases to assist in this presentation.
0
50
100
150
200
250
300
1991
19
92
1993
19
94
1995
19
96
1997
19
98
1999
20
00
2001
20
02
2003
20
04
2005
20
06
2007
20
08
2009
20
10
2011
20
12
2013
20
14
Not
ifica
tion
s pe
r 10
0,00
0 of
the
pop
ulat
ion
ACT
NT
QLD
SA
TAS
VIC
WA
Aust. Poult. Sci. Symp. 2016.....27
122

Figure 4 - Rate (per 100000 of the population) of campylobacteriosis by month in Queensland, Victoria, South Australia and Western Australia from 2010 to 2014.
REFERENCES
ABS (1992) Cat No. 4306.0 - Apparent Consumption of Foodstuffs and Nutrients, Australia,
1989-1990. (Eds. R. Madden, Australian Bureau of Statistics, Canberra). http://www.ausstats.abs.gov.au/ausstats/free.nsf/0/32C0BE2461DE616ACA25791100178EFF/$File/43060_1989_90.pdf
ACMF (2013) http://www.chicken.org.au/page.php?id=4#Consumption AECL (2014) https://www.aecl.org/assets/Uploads/Annual-Reports/AECL-Annual-Report-
2014.pdf ASRC (2009) Australian Salmonella Reference Centre 2009 Annual Report (Ed. D Davos). Bell C & Kyriakides A (2002) Salmonella: a practical approach to the organism and its
control in foods (Blackwell Science Ltd). Gast R (2013) Paratyphoid infections. In: ‘Diseases of Poultry’ (Eds. D. Swayne, J.R.
Glisson, L.R. McDougald, L.K. Nolan, D.L. Suarez & V.L. Nair, Wiley-Blackwell) pp. 677-736.
Jay S, Davos D, Dundas M, Frankish E & Lightfoot D (2003) Salmonella. In: ‘Foodborne Microorganisms of Public Health Significance, 6th Edition’ (Ed. AD Hocking, Australian Institute of Food Science and Technology, Waterloo, Australia) pp. 207-266.
NEPSS (1997) National Enteric Pathogen Surveillance Scheme, Non-Human Annual Reports (Ed. J Powling).
NNDSS (2015) National Notifiable Diseases Surveillance System http://www9.health.gov.au/cda/source/cda-index.cfm
OzFoodNet (2015) http://www.ozfoodnet.gov.au/ Patrick M, Schlundt J & Braam HP (2008) In: ‘Control of Communicable Diseases Manual’
(Ed. D. Heymann) pp. 94-98. Pointon A, Sexton M, Dowsett P, Saputra T, Kiermeier A, Lorimer M, Holds G, Arnold G,
Davos D, Combs B, Fabiansson S, Raven G, McKenzie H, Chapman A & Sumner J (2008) Journal of Food Protection 71: 1123-1134.
0
20
40
60
80
100
120
140
160
180
200
Jan
Mar
M
ay
Jul
Sep
Nov
Ja
n M
ar
May
Ju
l Se
p N
ov
Jan
Mar
M
ay
Jul
Sep
Nov
Ja
n M
ar
May
Ju
l Se
p N
ov
Jan
Mar
M
ay
Jul
Sep
Nov
2010 2011 2012 2013 2014
Qld SA Vic. WA
Aust. Poult. Sci. Symp. 2016.....27
123

SA Food Act Reports (2015) http://www.sahealth.sa.gov.au/wps/wcm/connect/Public+Content/SA+Health+Internet/About+us/Legislation/Food+legislation/Food+Act+Reports
Wallace RB (2003) Campylobacter. In: ‘Foodborne Microorganisms of Public Health Significance, 6th Edition’ (Ed. AD Hocking, Australian Institute of Food Science and Technology, Waterloo, Australia) pp. 311-331.
Aust. Poult. Sci. Symp. 2016.....27
124

ON-FARM CONTROL OF CAMPYLOBACTER
N. SPARKS1
Summary
Campylobacteriosis, primarily caused by the consumption of contaminated chicken products, accounts for the majority of food poisoning cases in Europe and many other developed countries. The cost to the economy in terms of lost productivity and the treatment of the relatively small proportion of sufferers who receive medical attention is considerable, and is estimated to cost the European member states some 2.4 billion euros per annum. However, unlike less common forms of food poisoning such as salmonellosis or toxicity due to Escherichia coli 0157, consumers seem to be generally unaware and even unconcerned about campylobacteriosis. Despite this, many agencies responsible for food safety are concerned about the incidence of campylobacteriosis and many, the UK agencies included, are turning to the producers and retailers of chicken to take action that will reduce the incidence of Campylobacter-positive chickens and chicken products entering the food chain. With current European Union (EU) legislation limiting interventions that can be applied at the processing plant, inconsistent results when using feed- and drinking-water-based products to control Campylobacter and no vaccine likely to be available in the short term, on-farm biosecurity is one of the few areas that producers can focus on that may reduce the incidence of Campylobacter-positive chicken. The use of hygiene barriers to try and ensure that only designated footwear is worn inside the poultry house is discussed as is the use of flyscreens. The issues surrounding compliance by farm staff with biosecure procedures is discussed, in the context of studies of workers in the poultry and human health sectors that show that compliance may be as low as 50%. Incentives for personnel to comply with biosecure procedures when entering bird housing as a control measure for Campylobacter may be limited in many countries. However, recent findings show a highly significant association between Campylobacter-positivity and poorer feed conversion ratios (FCRs), possibly linked to studies that suggest that some types of Campylobacter may be more pathogenic than thought previously. So there may be a commercial incentive for personnel to comply with biosecurity procedures because it will reduce feed costs, while at the same time providing the wider benefits to consumers of Campylobacter-free poultry products. Routine and standardised testing of flocks for Campylobacter, combined with prompt feedback to the farm is recommended as a way of reinforcing good practice and so helping to reduce the number of flocks that become Campylobacter-positive.
I. INTRODUCTION In the UK, Europe and many other developed countries, Campylobacter associated with the consumption of chickens is the primary cause of food poisoning (EFSA, 2015). The cost of campylobacteriosis to the economy in lost productivity and health care has been calculated to cost European Union (EU) member states 2.4 billion euros per annum. A significant proportion of the health care cost is associated with sequelae linked to campylobacteriosis such as Guillain-Barre syndrome, reactive arthritis (ReA) and irritable bowel syndrome (WHO, 2013). Cost estimates are likely to rise further as functional gastrointestinal disorders (FGDs) are now recognised as being associated with gastroenteritis (albeit not just caused by Campylobacter) (WHO, 2013).
1 Animal and Veterinary Sciences Research Group, Scotland’s Rural College, Roslin Institute Building, Easter Bush, Midlothian, EH25 9RG UK; [email protected]
Aust. Poult. Sci. Symp. 2016.....27
125

It is notable that despite the societal and personal costs resulting from food poisoning and the long-running awareness campaigns by the UK’s Food Standards Agency (FSA), the UK consumer is generally less aware of Campylobacter than might be expected and, arguably, less concerned than could be expected. So, for example, a survey of UK consumers found that only just over 30% of people had heard of Campylobacter (cf. >90% for Salmonella and Escherichia coli) and, when told that a recent survey had shown 60% of chicken sampled were contaminated with Campylobacter (and the implications explained), only six out of 10 consumers were concerned about these results (Meat Info, 2015).
Although public awareness and concern may be limited, in Europe, both awareness and concern are evident among the government agencies with responsibility for food safety and there is increasing pressure on chicken producers to produce birds that are either Campylobacter-free or carry fewer Campylobacter in their digestive tract. In the UK the FSA, with other research funders, worked closely with both producers and retailers for many years, funding and co-funding with producers and others, studies and programmes of research with the ultimate aim of reducing campylobacteriosis in the UK population. Workshops were held at which experiences from countries that had successfully reduced Campylobacter carriage in the national chicken flocks, or appeared to have naturally low prevalence of Campylobacter in the national flock, were shared. More recently the FSA has started to publicise the percentage of birds testing positive for Campylobacter by retailer, accompanying the results with statements such as the following:
Steve Wearne, FSA Director of Policy, said: ‘These results show that the food industry, especially retailers, need to do more to reduce the amount of campylobacter on fresh chickens. Although we are only half-way through the survey, 18% of birds tested had Campylobacter over 1,000 cfu/g, the highest level of contamination, and more than 70% of birds had some Campylobacter on them. This shows there is a long way to go before consumers are protected from this bug. ‘There are signs that some retailers are starting to step up to their responsibilities. When more do, we will see the sustained improvements that will help prevent many of their customers getting ill.’
(FSA, 2014)
In a country where margins for the producer are low and food retailing is highly competitive it could be assumed that the FSA consider this approach to be one that more fully engages the whole food chain (FSA, 2014). Unlike some countries however, where penalties or differential payments are used to incentivise the production and sale of Campylobacter-free birds, there is as yet no similar motivation in the UK. This said, trials are now being conducted where some poultry farmers are being offered relatively small bonuses for the production of Campylobacter-free birds.
In Europe considerable emphasis is placed on the on-farm control of Campylobacter because legislation currently limits the ability to treat carcasses in the slaughter plant with products that can reduce the bacterial load. However, even outwith Europe it is recognised that effective control of Campylobacter is reliant upon pre- and post-harvest/slaughter interventions (WHO, 2013), so the on-farm control of Campylobacter also remains important in countries that can use interventions to reduce the bacterial load on the carcass.
In this paper interventions that have been used in an attempt to control Campylobacter-carriage in poultry will be considered, as will preliminary evidence that the presence of Campylobacter can be associated with poorer flock performance (i.e. food conversion efficiency [FCE]), possibly as a result of some Campylobacter being more pathogenic than the ‘commensal’ label commonly used to describe this organism would suggest. It is proposed that evidence that some Campylobacter may have an adverse affect on
Aust. Poult. Sci. Symp. 2016.....27
126

bird performance may affect the motivation of producers and farm workers to control Campylobacter.
II. TARGETS TO REDUCE CAMPYLOBACTER ON CHICKEN In 2010 the UK’s FSA, in collaboration with producers agreed targets for the reduction of Campylobacter on chicken. There is no compelling evidence for a ‘safe’ level of contamination and, given what we know about the infectivity of the various types of Campylobacter, minimum infectious doses will be type-specific; however, this aside, it is considered that the risk of campylobacteriosis increases as the number of Campylobacter on the bird increase (EFSA, 2009). So the UK target was based on enumeration rather than prevalence and was intended to reduce the number of the most highly contaminated chickens at the end of the slaughter process (post-chill). The target assigns chicken to one of three groups based on the number of Campylobacter per bird (i.e. < 100 cfu/g of neck skin, 100–1000 cfu/g and > 1000 cfu/g). The stated intent (FSA, 2010) was for:
a reduction in the percentage of chickens produced in UK poultry slaughterhouses that have the highest level of contamination, i.e. those with more than 1,000 cfu per gram, from a baseline of 27% in 2008 to 10% by 2015, measured post-chill. It is expected that the least contaminated chickens i.e. less than 100 cfu per gram, will get no worse or will improve upon the baseline of 42% by 2015.
The baseline was determined in 2008 by an EU survey of Campylobacter in chickens (EFSA, 2010).
III. IMPACT OF REDUCING CAMPYLOBACTER IN CHICKENS ON CAMPYLOBACTERIOSIS
Attempts to model the impact of the incidence of Campylobacter in the national chicken flock and the incidence of campylobacteriosis in those consuming chicken are fraught with uncertainty. We understand that exposure to sources other than chicken, the type of Campylobacter and the size of the susceptible population complicate predictions but still lack much of the knowledge to accurately model even these factors. It is not surprising therefore that figures ranging from 35% (FSA, 2009) to 80% (Wilson et al., 2008; Sheppard et al., 2009) of human campylobacteriosis cases have been proposed as being attributable to chicken sources. However, the UK’s FSA considered that reducing the percentage of carcasses entering the food chain with > 1000 cfu/g, from 27% to 10% could lead to a reduction of between 15% and 30% in human cases of campylobacteriosis (FSA, 2010).
IV. WAYS CAMPYLOBACTER CAN GET INTO THE FLOCK Typically birds will become positive for Campylobacter after 10 days of age. The reason(s) for this delay in birds becoming positive is (are) not fully understood but may include maternal immunity passed on from parent stock that are or were themselves Campylobacter-positive; possibly aided by the relatively dry litter in the poultry house that may limit the ability of Campylobacter to survive (at least in an infectious form) and the relatively small volume of excreta produced by birds in the first weeks of life.
Evidence for Campylobacter being transmitted vertically, while possibly occurring under some circumstances, is limited and is unlikely to play a significant role in anything other than the minority of instances (Newell and Fearnley, 2003; Cox et al., 2012; Agunos et al., 2014). Similarly while there is evidence for specific campylobacters circulating around a production company’s farms and slaughterhouse, the evidence for a specific Campylobacter being carried over from one flock to the next, assuming the poultry house is cleaned and
Aust. Poult. Sci. Symp. 2016.....27
127

disinfected effectively between flocks, is limited (Ellis-Iversen et al., 2012; Agunos et al., 2014). On the evidence to date therefore it is probable that most flocks become Campylobacter-positive due to Campylobacter being introduced into the flock following placement.
Drinking water has been suggested as a source of Campylobacter but, while some studies isolated Campylobacter genotypes from the drinking system and then from subsequent flocks, the evidence to date suggests that with the exception of untreated water, water is not a significant source of Campylobacter in commercial chicken production (Sparks, 2009; Agunos et al., 2014). Similarly feed and fresh bedding material (wood shavings), because of their low water content, are not considered to be potential sources of Campylobacter (Berndtson et al., 1996).
Some countries, notably Denmark and Iceland, have had considerable success in reducing the incidence of Campylobacter-positive flocks by fitting flyscreens to air inlets on the poultry houses (Hald et al., 2007, 2008; Lowman et al., 2009). Proponents of flyscreening (R Lowman, pers 4omm.) observe that the increase in the incidence of Campylobacter-positive flocks is often associated with the onset of the flies hatching out. However, for flyscreening to be effective it is critical that Campylobacter is prevented from entering the house on personnel and equipment, etc. It can be difficult to separate out the benefits of flyscreening and other, less specific, biosecurity measures.
Depending on the ambient environment, Campylobacter can be routinely recovered from the environment around poultry houses although it is not uncommon, up until the flock becomes positive, for the types isolated from the environment and from the flock to differ (Newell and Fearnley, 2003; Ellis-Iversen et al., 2012). This could be taken as evidence that the environment around the poultry house, although potentially contaminated with Campylobacter, is not a primary source of the types found in flocks. However, we know that in adverse climatic conditions (e.g. low temperatures approaching or below freezing), the incidence of flock positivity falls dramatically (Bryhni et al., 2001; Ellis-Iversen et al., 2012). We also know that Campylobacter vary considerably in their ability to infect different host animals (Strachan et al., 2016) so it would be expected that most of the Campylobacter identified in the environment around the poultry house are never detected in the birds. Furthermore the approaches and techniques used to isolate and type Campylobacter from the environment, more specifically the percentage of Campylobacter that are typed versus those in the environment, may simply be inadequate to identify the relevant Campylobacter from the environment.
Studies that have reviewed the reservoirs and sources of Campylobacter that are isolated from positive flocks highlight the importance of personnel and equipment as the means by which Campylobacter can be introduced into the poultry house (e.g. Newell and Fearnley, 2003; Agunos et al., 2014). Studies have highlighted direct effects such as the difficulties experienced in removing Campylobacter from the equipment used to catch chickens (e.g. module frames, module drawers, crates) as well as potentially indirect effects (e.g. the increased risks caused by catchers entering a building to thin birds; the increased risk associated with larger farms/increased house numbers on the farm) (Newell and Fearnley, 2003; Agunos et al., 2014). A potentially confounding factor, and one that is often not referred to directly when considering data from on-farm studies, is compliance by personnel with biosecurity procedures and the impact that compliance can have on various interventions. This is considered in more detail below.
Aust. Poult. Sci. Symp. 2016.....27
128

V. TYPICAL INTERVENTIONS USED TO PREVENT BIRDS BECOMING CAMPYLOBACTER-POSITIVE
Commonly used interventions to control Campylobacter can be broadly categorised as those designed to prevent Campylobacter entering the bird area and those aimed at preventing the Campylobacter multiplying in the bird.
Typically interventions used to prevent Campylobacter multiplying in the birds involve the use of feed or water additives that will adjust the pH in the digestive tract, making it unfavourable for Campylobacter, or will inhibit growth through some other mechanism, such as competitive exclusion, reducing the availability of nutrients required by Campylobacter to multiply, modulating the innate immune system and improving gut health (Mead, 2000; FSA, 2005; Skanseng et al., 2010; Thibodeau et al., 2015). Water treatments, which also have the potential to reduce the Campylobacter load of drinking water before it reaches the bird, tend to use organic acids, either singly or as combinations (Sparks, 2009). However, to date the results have been inconsistent.
Considerable efforts have been put into the development of a vaccine that would be effective against Campylobacter. However, to date an effective vaccine that could be suitable for use by commercial poultry producers has still to be brought to the market (Lin, 2009; Neal-McKinney et al., 2014; Chintoan-Uta et al., 2015).
So-called hygiene barriers (Figure 1), designed to remind those entering the bird area to change their footwear have been popular in Scandinavian countries for many years and are now mandatory for those growing birds using the main Quality Assurance scheme for chicken growers in the UK. Ensuring that footwear is changed prior to entering the bird area removes the risk posed by footwear that is worn outside the building not being properly disinfected in a footbath. Anecdotal reports from producers indicate that when used properly and consistently then the use of a hygiene barrier, irrespective of any changes of clothing, has a significant effect on the incidence of Campylobacter-positive flocks.
Figure 1 - Hygiene barrier in annex to bird area. (Note other designs are solid to prevent migration of litter material under the barrier).
As mentioned above, the use of flyscreens (Figures 2 and 3) over the air inlets has
been successful in some countries in reducing the incidence of Campylobacter-positive flocks. However, when used as part of a long-running trial (replicated study, sampling 192 commercial flock samples) in the UK there were no detectable significant benefits of using screens (Sparks et al., 2013).
Aust. Poult. Sci. Symp. 2016.....27
129

Figure 2 - Flyscreens being attached to the air inlet.
Figure 3 - Flyscreens in position on air inlet. The reasons why flyscreens may not have reduced the incidence of Campylobacter-
positive is open to debate. However, the failure of personnel to always comply with the requirement to adequately disinfect or change footwear prior to entering the bird area was considered to have been at least part of the cause. This highlights one of the most difficult challenges that producers probably face in controlling Campylobacter, what appears to be the need for rigorous compliance with basic biosecurity procedures.
VI. COMPLIANCE WITH BIOSECURITY PROCEDURES Compliance by poultry farm workers with standard biosecurity procedures has been reported to average 50% (Sparks et al., 2011; Racicot et al., 2011, 2012a, b). Experiences in Iceland indicate that under commercial conditions it can take several years for personnel to comply with biosecurity procedures in a way that predictably results in Campylobacter-negative flocks (R Lowman, pers 6omm.). This is not to suggest that farm workers are necessarily complacent regarding biosecurity procedures, but rather it is an indication of the difficulties involved in consistently implementing procedures under commercial conditions. In this context it is notable that a report on hand-sanitiser compliance (notable also ~50%) in the health sector showed poorer compliance in intensive care units (ICU) than in general wards, the reason given being the greater pressure on staff in ICU compared with general wards (Erasmus, 2012).
Sparks et al. (2013) noted that, in a longitudinal study involving 24 farms flocks on specific farms were negative or positive more frequently than would have been predicted by chance. Anecdotal observations of this type have been made before but this is the first time that statistically significant results were presented. For farms that were positive more frequently than would have been predicted if it were a chance event, there was no evidence to suggest that the environment was more heavily contaminated or that particular sequence types were persisting (e.g. a positive flock did not per se increase the risk of subsequent flocks becoming positive). The interpretation of these findings can be challenged but, taken alongside the other findings from this study, could be taken as evidence of the importance of the farm workers in particular in keeping flocks Campylobacter-negative.
Sparks et al. (2013) also reported for the first time that the feed conversion ratio (FCR) was significantly improved in flocks that were Campylobacter-negative. While the financial gain was relatively small (~£20/1000 birds) it is not insignificant and may act as a small incentive to comply with procedures. Also, while the effect may not be causal – Campylobacter-status may be acting as a proxy measure for say improved generic biosecurity or better generic management practices – it is supportive of a growing body of
Aust. Poult. Sci. Symp. 2016.....27
130

evidence (Gharib-Naseri et al., 2012; Awad et al., 2015; N Williams, pers 7omm.) that Campylobacter may not be the harmless commensal that it is often reported to be.
VII. CONCLUSIONS If biosecurity procedures are to reduce the Campylobacter status of flocks beyond what is achieved currently, then routine and standardised testing of flocks combined with active management of hygiene barriers or their equivalent is required. Routine testing combined with prompt feedback across all company farms will allow patterns of positive and negative flocks to be determined. In turn, this should enable biosecurity procedures on individual farms to be managed appropriately. ACKNOWLEDGEMENTS: It is a pleasure to be able to thank The Scottish Government, the UK’s BBSRC, Defra and FSA and the many production companies that have supported the author’s Campylobacter research programmes.
REFERENCES Agunos A, Waddell L, Léger D & Taboada E (2014) PLoS One 9: e104905. Awad WA, Molnar A, Aschenbach JR, Ghareeb K, Khaya, B, Hess C, Liebhart D, Dublecz K
& Hess M (2015) Innate Immunity 21: 151-160. Berndtson E, Emanuelson U, Engvall, A & Danielsson-Tham ML (1996) Preventative
Veterinary Medicine 26: 167-185. Bryhni K, Fabech B, Plym Forshell L, Georgsson F, Gry J, Thiim Hanssen B, Hallström H,
Holene E & Kapperud G (2001) TemaNord 2001: 538. Chintoan-Uta C, Cassady-Cain RL, Al-Haiderib H, Watson E, Kelly DJ, Smith DGE, Sparks,
NHC, Kaise, P & Stevens MP (2015) Vaccine 33: 6206-6211. Cox NA, Richardson LJ, Maurer JJ, Berrang ME, Fedorka-Cray PJ, Buhr RJ, Byrd JA, Lee
MD, Hofacre CL, O’Kane PM, Lammerding AM, Clark AG, Thayer SG and Doyle MP (2012) Journal of Food Protection 75: 1896-1902.
EFSA (2009) Scientific Colloquium Series of the European Food Safety Authority N° 12 – December 2008. (4-5 December 2008, Rome, Italy). www.efsa.europa.eu/sites/default/files/event/colloque081204-m.pdf
EFSA (2010) http://www.efsa.europa.eu/en/scdocs/scdoc/1503.htm EFSA (2015) http://www.efsa.europa.eu/en/topics/topic/campylobacter Ellis-Iversen J, Ridley A, Morris V, Sowa A, Harris J, Atterbury R, Sparks N & Allen V
(2012) Epidemiology and Infection 140: 916-924. Erasmus V (2012) Compliance to hand hygiene guidelines in hospital care: a stepwise
behavioural approach. (Erasmus University Rotterdam, Public Health Department, Rotterdam).
FSA (2005) http://tna.europarchive.org/20131001174833/http://www.food.gov.uk/science/research/foodborneillness/eggsresearch/b15programme/b15projects/b15010/
FSA (2009) http://www.foodstandards.gov.scot/molecular-epidemiology-scottish-campylobacter-isolates-human-cases-infection-using-multilocus
FSA (2010) www.food.gov.uk/sites/default/files/multimedia/pdfs/campytarget.pdf FSA (2014) https://www.food.gov.uk/news-updates/news/2014/13251/campylobacter-survey Gharib-Naseri K, Rahimi S & Khaki P (2012) Journal of Agricultural Science and
Technology 14: 1485-1496. Hald B, Sommer HM & Skovgard H (2007) Emerging Infectious Diseases 13: 1951-1953. Hald B, Skovgard H, Pedersen K & Bunkenborg H (2008) Poultry Science 87: 1428-1434.
Aust. Poult. Sci. Symp. 2016.....27
131

Lin J (2009) Foodborne Pathogens and Disease 6: 755-765. Lowman R, Reiersen J, Jónsson T, Gunnarsson A, Bisaillon JG & Daoadottir SC (2009)
Abstracts of the 15th International Workshop on Campylobacter, Helicobacter and related organisms (2-5 September 2009, Niigata, Japan).
Mead GC (2000) The Veterinary Journal 159: 111-123. Meat Info (2015)
http://www.meatinfo.co.uk/news/fullstory.php/aid/17653/Which__survey_reveals_consumer_concern_on_campylobacter.html
Neal-McKinney DR, Samuelson JM, Eucker TP, Nissen MS, Crespo R & Konkel ME (2014) PLoS ONE 9: e114254.
Newell DG & Fearnley C (2003) Applied and Environmental Microbiology 69: 4343-4351. Racicot M, Venne D, Durivage A & Vaillancourt J-P (2011) Preventive Veterinary Medicine
100: 193-199. Racicot M, Venne D, Durivage A & Vaillancourt J-P (2012) Preventive Veterinary Medicine
103: 201-207. Racicot M, Venne D, Durivage A & Vaillancourt J-P (2012) Preventive Veterinary Medicine
103: 208-218. Sheppard SK, Dallas JF, Strachan, NJC, MacRae M, McCarthy ND, Wilson DJ, Gormley FJ,
Falush D, Ogden ID, Maiden MCJ & Forbes KJ (2009) Clinical Infectious Diseases 48: 1072-1078.
Skanseng B, Kaldhusdal M, Moen B, Gjevre A-G, Johannessen GS, Sekelja M, Trosvik P & Rudi K (2010) Journal of Applied Microbiology 109: 1265-1273.
Sparks NHC (2009) World’s Poultry Science Journal 65: 459-474. Sparks N, Hardy M, Baker L & Milne C (2011) Assessing the effectiveness of biosecurity
training (S14055). (Report to FSA (Scotland), Aberdeen). http://www.foodbase.org.uk/results.php?f_report_id=729
Sparks N, Lawson J., Lowman R, Forbes K, Strachan N, Whyt, F, Hardy M, Humphrey T, Keevil W, Sherwin S & Pearson D (2013) BBSRC, FSA and Defra Campylobacter Strategy Workshop. (12-14 March 2013, Sutton Coldfield, UK).
Strachan NJC, Rotariu O, Whyte F, MacRae M, Lopes B, Perez-Reche F, Sparks NHC & Forbes KJ (2016) (in prep).
Thibodeau A, Fravalo P, Yergeau É, Arsenault J, Lahaye L & Letellier A (2015) PLoS ONE 10: e0131978.
WHO (2013) The global review of campylobacteriosis (Report of expert consultation, Utrecht, The Netherlands, 9-11 July 2012, WHO). www.who.int/iris/bitstream/10665/80751/1/9789241564601_eng.pdf
Wilson DJ, Gabriel E, Leatherbarrow AJH, Cheesbrough J, Gee S, Bolton E, Fox A, Fearnhead P, Hart CA & Diggle PJ (2008) PLoS Genetics 4: e1000203.
Aust. Poult. Sci. Symp. 2016.....27
132

EFFECT OF PRODUCTION SYSTEM AND FLOCK AGE ON EGG QUALITY
S. SAMIULLAH1, A.S. OMAR1, J.R. ROBERTS1 and K. CHOUSALKAR2
Summary Egg quality parameters were measured in eggs from flocks reared together and then allocated to different production systems. Eggs were processed for measurement of egg quality variables, scoring of ultrastructural mammillary layer features, completeness of cuticle cover and protoporphyrin IX (PPIX) quantification. There was a significant main effect (P<0.05) of production system on shell reflectivity, egg weight and egg internal quality and significant effects of flock age on most measurements. The mammillary layer ultrastructural variables showed no clear relationship with production system and flock age. Cuticle cover was significantly higher in barn eggs, followed by free range and cage eggs. Completeness of cuticle cover was significantly higher in eggs from the 44 week old flock than for 64 week and 73 week old flocks. There was a significant main effect of both production system and flock age, but no significant interaction for shell reflectivity, L* and amount of PPIX. There was no statistically significant difference for cuticle cover. In 1 g of shell with and without cuticle, there was more PPIX in cage eggs followed by free range and barn eggs. Similar trends were recorded for the amount of PPIX in 1 g of cuticle, but the difference was not statistically significant. The amount of PPIX decreased significantly with increasing flock age.
I. INTRODUCTION In Australia, the cage production system is the most efficient and cost effective and accounts for approximately 53% of the total table egg production (AECL, 2014). Modern cage production systems typically consist of multiple tiers of cages installed in environmentally controlled poultry houses. According to the current Australian Model Code of Practice (Primary Industries Standing Committee, 2002), a minimum floor space allowance of 550 cm2 per hen must be provided for 3 or more birds per cage where the birds weigh less than 2.4 kg. The barn system offers access to a deep litter system, automated feeding and drinking systems, perches, and stepping rails to automated egg collection nest boxes. The barn egg production system’s average contribution to total eggs produced in Australia is about 8% (AECL, 2014). Free range production is increasing in Australia, reported as being 38% of total egg production (AECL, 2014). In a typical free range production system, nest boxes, perches, feed and water are available in the house which is often very similar to the barn production system but birds also have access to a grassed outdoor free-range area. The main objective of the present study was to compare the performance of pullets reared together and then placed into three commercial production systems at different flock ages for traditional egg quality measurements, scoring of mammillary layer ultrastructural features, cuticle estimation and protoporphyrin IX quantification from eggshell.
II. MATERIALS AND METHODS Eggs were collected from Hy-Line brown egg laying flocks housed in conventional cage, barn and free range commercial production systems. Each of the three flocks was sampled at 44, 64 and 73 weeks of age. Each flock had pullets which were reared together and then allocated to one of cage, barn or free range commercial production systems. From each flock, at each age, 30 eggs were processed for the measurement of traditional eggshell and egg internal quality variables, 30 for estimation of the completeness of cuticle cover and 30 for the amount of PPIX present in the
1 School of Environmental & Rural Science, University of New England, Armidale, NSW 2351; [email protected]
2 School of Animal & Veterinary Studies, University of Adelaide, Roseworthy, SA 5005.
Aust. Poult. Sci. Symp. 2016.....27
133

shell. From the eggshells used for traditional quality measurements, 10 eggshells from each age group were randomly selected and processed for the scoring of eggshell mammillary layer ultrastructural features.
a) Eggshell and egg internal quality measurements Eggshell and egg internal quality parameters were measured using TSS equipment. Shell breaking strength (Newtons) and shell deformation (µm) were measured by quasi-static compression using TSS QC-SPA equipment. Shell weight (g) was measured on washed and dried shells. Shell thickness (µm) was measured by a Mitutoyo Dial Comparator Gauge. For the egg internal quality variables; albumen height (mm), Haugh unit and yolk color were measured using the TSS QCE-QCM equipment.
b) Microscopic observations of the shell mammillary layer ultrastructure The ultrastructural features of the shell mammillary layer were scored using a scanning electron microscope (SEM). Briefly, pieces of shell approximately 1 cm2 were cut from around the equator of the eggshell. The dried pieces were plasma etched for 4 hours to remove the outer shell membrane. Shell pieces were sputter coated in a Neocoater for 8 minutes, and viewed under the SEM at magnifications of 22~500. Mammillary ultrastructural variables were scored following the method of Solomon (1991).
c) Cuticle cover estimation For the cuticle cover estimation, shell color (L*a*b*) was measured on eggs before staining, using a Konica Minolta spectrophotometer. Eggs were soaked in MST cuticle blue stain for 1 minute, and rinsed in tap water to remove excess stain. Shell color was measured again on stained eggs. The amount of cuticle was estimated by converting the L*a*b* values into a single score. The single score, measures the L*, a*, and b* values, before and after staining, and calculates a single value as 𝛥𝐸𝑎𝑏∗ :
𝛥𝐸𝑎𝑏∗ = �[(𝛥𝐿∗)2 + (𝛥𝑎∗)2 + (𝛥𝑏∗)2]
A higher 𝛥𝐸𝑎𝑏∗ denotes a higher staining affinity and hence more cuticle coverage (Roberts et al., 2013).
d) Protoporphyrin IX quantification from eggshell with and without cuticle Shell reflectivity and shell color were measured on eggs before and after removal of the cuticle layer. From the L*a*b* values, only L* values were used for analysis, as this reflectance component indicates the difference between light and dark brown shell color. Each egg, individually, was soaked in an EDTA solution (0.34 M, pH 7.5) for 5 minutes, and the cuticle of the soaked longitudinal half side of the shell was carefully scrubbed off using a soft brush in running tap water. Shells were cut longitudinally into two halves (with and without cuticle). Shell membrane was removed manually and shells were allowed to dry thoroughly. Shell reflectivity and shell color (L*) were measured again on the shells with cuticle removed.
A 0.25 g sample was weighed into a 10 mL centrifuge tube into which 4 mL of methanol - HCl (2:1) solvent was added. The tubes were stored for 3 hours to allow the shell pieces to digest completely. The tubes were centrifuged at 800×g at 4°C for 0.5 hour, the supernatant solution was decanted into 4 mL cuvettes, and the absorbance of the supernatant read at 412 nm in a spectrophotometer.
Data were subjected to one-way and two-way analysis of variance (ANOVA) and General Linear Model (GLM) Procedures (SAS 2004) to test the probability of significant differences between the means values. The Level of Significance was assumed at 95% confidence (P<0.05).
Aust. Poult. Sci. Symp. 2016.....27
134

III. RESULTS
a) Eggshell and egg internal quality measurements For eggshell quality measurements, there was a significant difference among production systems for shell reflectivity and egg weight; however, there was no statistically significant difference in the other parameters of shell weight, shell percentage, shell thickness, shell breaking strength and deformation unit (Table 1). The egg internal quality was significantly affected (P<0.0001) by production system. The hens kept in cage and barn production systems laid eggs of darker yolk color as compared with the free range system.
Table 1 - Effect of production system and flock age on eggshell and egg internal quality variables.
Variable Production System Flock Age (week) P value Cage Barn Free range 44 64 73 P A
Shell reflectivity 25.2±0.46c 29.7±0.66a 27.3±0.62b 24.3±41c 27.3±0.48b 30.7±0.72a <0.0001 <0.0001 Egg weight 60.6±048a 58.6±0.41b 61.2±0.54a 59.1±0.39a 60.0±0.52b 61.4±0.53a 0.0003 0.0031 Shell weight 5.5±0.05 5.5±0.07 5.7±0.0 5.6±0.04 5.6±0.07 5.5±0.06 0.0765 0.3585
Shell Percentage 9.2±0.09 9.3±0.09 9.2±0.08 9.5±0.07P
a 9.2±0.1P
b 9.0±0.09P
b 0.2652 0.0002 Shell thickness 406.5±2.8 408.8±3.6 408.2±3.2 414.9±2.6P
a 405.5±3.5P
b 403.0±3.4P
b 0.8780 0.0221 Breaking strength 40.5±0.88 41.7±1.02 40.0±0.89 44.1±0.72P
a 38.4±0.99P
b 38.8±0.91P
b 0.3705 <0.0001 Deformation unit 262.8±4.07 279.4±10.3 274.9±8.69 284.1±3.71 265.0±8.79 267.9±10.3 0.3293 0.2030 Albumen height 6.1±0.14P
b 6.1±0.15P
b 7.4±0.15P
a 7.1±0.15P
a 6.4±0.15P
b 6.1±0.17P
b <0.0001 <0.0001 Haugh unit 76.9±1.04P
b 77.4±1.2P
b 85.5±1.43P
a 83.9±0.98P
a 79.4±1.03P
b 76.4±1.75P
c <0.0001 <0.0001 Yolk color 10.8±0.11P
a 10.6±0.09P
a 9.9±0.19P
b 10.7±0.11P
a 10.8±0.08P
a 9.8±0.18P
b <0.0001 <0.0001 P = production system; A = flock ag; Values are Means ±SE a,b,c Across a row, values with different superscripts among different production systems and age groups are significantly different (P<0.05)
b) UMicroscopic observations of the shell mammillary layer ultrastructure
For all the sixteen ultrastructural variables of mammillary layer observed, there was a significant main effect (P>0.05) of production system on the variability of mammillary cap size, amount of confluence, incidence of early fusion, changed membrane and erosion. The mammillary caps arise from the deposition of calcium carbonate into the membrane fibres such that the shell membranes are attached to the mammillary caps. Confluence results from the attachment of the mammillary caps to each other, thus forming a smooth blanket on the surface of the mammillary caps. A high incidence of early fusion increases the bonding strength between mammillary cones and has a positive effect on mammillary layer strength. Flock age significantly affected the incidence of early fusion and changed membrane. The interaction between production system and flock age was only significant for mammillary cap size, early and late fusion. The variability of the mammillary cap size increased with increased flock age and was significantly higher in cage eggs. The amount of confluence was significantly higher in cage eggs compared with barn and free range eggs. The incidence of alignment was not significantly different among production systems and its values were closer to “isolated” on the measuring scale. Other variables like type A bodies, type B bodies, aragonite, cubic, depression and erosion varied with production system and flock age.
c) UCuticle cover estimation When the completeness of cuticle cover was estimated by the single score value (𝛥𝐸𝑎𝑏∗ ), the barn production system showed a significantly higher amount of cuticle cover compared with cage and free range eggs. There was no significant interaction between production system and flock age for the amount of cuticle present on the eggshell surface. Comparing the three flock ages, the 44 week flock eggs had a significantly higher amount of cuticle followed by 73, whereas 64 and 73 week were not significantly different.
Aust. Poult. Sci. Symp. 2016.....27
135

d) Shell Reflectivity and L* measurements There was a significant effect of production system and flock age on shell reflectivity and L* values measured on shells with and without cuticle. When the values of shell reflectivity and L* were compared among different age groups, the 44 week flock eggs had significantly lower values and the values increased linearly with increasing flock age. A similar pattern was observed for shells from which cuticle layer had been removed.
e) Protoporphyrin IX quantification from shell with and without cuticle There was a significant main effect (P>0.05) of production system and flock age, but no significant interaction between the two, on the amount of PPIX in 1 g of whole eggshell and eggshell from which the cuticle layer had been removed (Table 2). Eggs from the cage production system showed significantly higher amounts of PPIX in 1 g of whole eggshell and shell without cuticle. The amount of PPIX in 1 g of whole eggshell was significantly higher in eggs from the 44 week flock, followed by the 64 and 73 week old flocks.
Table 2 - Effect of production system and flock age on protoporphyrin IX (mM x 10-8).
a,b,c Across a row, indicates significant difference among different production systems and age groups; P- Production system; A- Age; PPIX is protoporphyrin IX
IV. DISCUSSION When birds reared together were allocated to different production systems prior to the onset of lay, there were relatively few differences among production systems for egg quality measurements. Eggs from the cage production system had darker shell colour and contained more protoporphyrin mainly within the calcareous part of the shell. For the barn production system, the completeness of cuticle cover was higher and egg weight generally lower. The differences in egg quality in relation to flock age are similar to those reported previously (Sekeroglu et al., 2010; Samiullah et al., 2014). ACKNOWLEDGMENTS: This study was supported by funding from Australian Egg Corporation Limited.
REFERENCES
AECL (2014) Australian Egg Corporation Limited Annual Report. https://www.aecl.org/assets/Uploads/Annual-Reports/AECL-Annual-Report-2014.pdf
Primary Industries Standing Committee (2002) Domestic Poultry 4th Edition (CSIRO Publishing, Collingwood, Victoria, Australia).
Roberts JR, Chousalkar K & Samiullah (2013) Animal Production Science 53: 1291-1297. Samiullah, Roberts JR, Chousalkar K (2014) Journal of Applied Poultry Research 23: 59-70. Sekeroglu A, Sarica M, Demir E, Ulutas Z, Tilki M, Saatci M & Omed H (2010) Journal of
Animal and Veterinary Advances 9: 1739-1744. Solomon SE (1991) Egg and Egg Shell Quality (Wolfe Publishing Ltd., England) pp 149.
Variable Production System Flock age (week) P value Cage Barn Free range 44 64 73 P A
PPIX in whole shell 9.49 a 8.24 b 8.64 b 9.35 a 8.74 b 8.26 b <0.0001 0.0001 PPIX in shell without cuticle 7.90 a 6.90 b 7.28 b 7.84 a 7.36 b 6.88 c <0.0001 <0.0001 PPIX in cuticle 1.60 1.35 1.36 1.51 1.38 1.42 0.1603 0.6284
Aust. Poult. Sci. Symp. 2016.....27
136

BODY WEIGHT UNIFORMITY AND EGGSHELL QUALITY OF HENS IN A FREE-RANGE PRODUCTION SYSTEM
E.K. SUAWA1, J.R. ROBERTS1 and G. PARKINSON2
Summary
Birds from seven flocks of commercial free-range hens were weighed at the ages of 19, 26, 37, 50 and 60 weeks. Body weight increased with increasing hen age for all flocks. Flock uniformity varied among the ages and flocks, being most consistent in flocks 1 and 6. Eggs were collected from the flocks at the ages of 19, 26, 37, 50 and 60 weeks. Traditional egg quality measurements were determined using specialized equipment supplied by TSS UK. There was a significant effect of flock age for all egg quality measurements. With advancing hen age, egg weight increased and shell weight, percentage shell, shell thickness and yolk colour varied, whereas shell breaking strength, shell deformation, albumen height and Haugh units decreased. Cuticle cover was measured using MST cuticle stain and a hand-held Konica Minolta spectrophotometer. Cuticle cover varied with hen age, being highest at 37 weeks of age for all flocks combined. For all ages combined, cuticle cover was highest for flock 6. Maintaining high flock uniformity results in improved eggshell quality
I. INTRODUCTION Apart from strain, nutrition and disease, body weight uniformity is another factor that may influence overall egg quality. Maintaining high body weight uniformity is a major objective during the rearing period, and provides an estimate of the variability in a given flock at a given age. The more uniform the flock, the better the performance of that flock, and the more consistent the nutritional responses of a given flock. The conventional goal for flock uniformity is to have 80 per cent of the pullets within plus or minus 10 per cent of the average flock body weight. Flocks with high uniformity have been reported to reach peak egg production earlier and have higher peak production than flocks with low uniformity (Hudson et al., 2001; Kosbah et al., 2009). On the other hand, poor uniformity is associated with variation in the degree of sexual maturity of hens, and underweight pullets have delayed onset of egg production (Yuan et al., 1994). Problems that develop during the growing period cannot easily be corrected after egg production begins. It has been generally assumed that flock uniformity is more difficult to achieve in free range production than in cage production and these differences between conventional cage performance and free range seem likely to respond to additional research that defines the mechanisms for the performance differences.
II. MATERIALS AND METHODS
Seven flocks of Hy-Line Brown commercial layers (FR1-7), in commercial free-range production in NSW, were followed throughout the production cycle. At least 100 birds were weighed from each flock at different ages: 19, 26, 37, 50 and 60 weeks of age and body weight uniformity was calculated.
A total of 90 eggs was collected from each flock at 26, 37, 50 and 60 weeks of age. Thirty eggs were processed for the amount of cuticle with MST cuticle blue stain. A hand-held Konica Minolta spectrophotometer (CM-2600d) was used to measure the cuticle colour.
1Animal Science, SERS, University of New England, Armidale, NSW 2351; [email protected] 2Livorno Consulting, 86 Wilson St., Brunswick, VIC 3065.
Aust. Poult. Sci. Symp. 2016.....27
137

The colour of the eggshell cuticle, stained with MST cuticle blue dye was measured using the L*a*b colour space. L* has a maximum of 100 (white) and a minimum of 0 (black). Green is indicated by –a* and red by +a*. Blue is indicated by –b* and yellow by +b*. ΔE*ab was calculated as described by Leleu et al. (2011). Sixty eggs were used for determination of traditional egg shell quality measurements: shell reflectivity, egg weight, eggshell breaking strength, shell deformation, shell weight and shell thickness, using specialized equipment (Technical Services and Supply, TSS, UK). Egg internal was also measured in the form of albumen height, Haugh Units and yolk colour. The extent of cuticle cover and ultrastructural features of the mammillary layer were also analysed.
Data were analysed using Statview Software (SAS Institute Inc., Version 5.0.1.0). A two way analysis of variance was conducted taking flock age and flock as the independent variables and body weight, egg quality measurements, SCI a* after staining and single score (ΔE*ab) as dependent variables. Level of significance was indicated by probability of less than 5%. The Fishers PLSD test was used to differentiate between mean values.
III. RESULTS There was a significant difference among flocks for body weight at all ages recorded (Table 1) and body weight increased as hens aged. At 19 weeks of age, FR 1, FR2, and FR 5 were about 150 g below the breed standard, whereas FR 6 was 120 g above breed standard. At 60 weeks of age, only two flocks (FR2 and FR5) had reached the breed standard body weight of 1.96 kg.
Table 1 - Flock body weight in free-range systems from age 19 weeks to 60 weeks.
Flocks Hen age (weeks) Flock Uniformity (%) 19 26 37 50 60 19w
26w
37w
50w
60w
FR 1 1.45±0.01c 1.89±0.02a 1.97±0.02a 1.95±0.02ab 1.92±0.02bc 80.9 83.7 85.5 81.3 75 FR 2 1.48±0.01c 1.78±0.02b 2.0±0.01a 1.94±0.02ab 1.96±0.02b 80 79.1 72.2 78 76 FR 3 1.68±0.01a 1.86±0.01a 1.92±0.02b 1.98±0.02a 2.03±0.02a 77.5 84.9 76.7 78.9 79.4 FR 4 1.81±0.02b 1.92±0.01b 1.94±0.01ab 2.0±0.02 ab - 74 74.4 81.8 73.8 FR 5 1.48±0.01c 1.72±0.01c 1.77±0.01d 1.96±0.02ab 1.97±0.02b 68.2 83.1 77.4 80.4 77.3 FR 6 1.72±0.01a 1.85±0.01a 1.86±0.01c 1.91±0.02b 1.89±0.02cd 83.5 84.2 80 81 80.8 FR 7 1.62±0.01b 1.87±0.02a 1.84±0.02c 1.87±0.01c 1.86±0.01d 79.4 76.3 73.3 81 84.3 Breed std. 1.6 1.86 1.92 1.95 1.96
P
<0.0001 <0.0001 <0.0001 0.0001 <0.0001 a,b,c,d within a column, values with different superscripts are significantly different from each other. Values are Mean ± SE
Body weight uniformity of the flocks studied ranged from 62 to 89% (Table 1). There
was no clear pattern of body weight uniformity in relation to flock age. Flocks 1 and 6 maintained high uniformity between 19 and 50 weeks of age, relative to the other 5 flocks.
There were significant main effects (P<0.0001) of hen age (Table 2) and flock (P<0.0001) for all eggshell quality measurements. As hen age increased, egg weight increased; translucency, shell reflectivity, shell weight, percentage shell, shell thickness and yolk colour fluctuated; shell breaking strength, deformation, albumen height, and Haugh units decreased; shell reflectivity varied significantly among the age groups being lowest at 26 weeks of age. There was a significant difference among the flocks for egg shell and egg internal quality measures, with variation in albumen height, Haugh Unit and yolk colour score.
Aust. Poult. Sci. Symp. 2016.....27
138

Table 2 - Effects of hen age on the traditional measures of egg shell quality.
Measurement Hen age (weeks) P Value 26 37 50 60 Egg shell quality:
Translucency score 3.80±0.05a 3.47±0.05b 3.31±0.05c 3.57±0.05b <0.0001 Shell reflectivity (%) 28.01±0.20c 30.54±0.22a 29.85±0.27b 30.97±0.24a <0.0001 Egg weight (g) 58.66±0.21c 61.68±0.22b 63.47±0.24a 63.26±0.25a <0.0001 Breaking strength (N) 44.14±0.41a 43.52±0.39a 42.01±0.35b 40.32±0.39c <0.0001 Deformation (µm) 292.95±3.93a 287.19±2.31a 269.41±1.73b 260.74±2.05c <0.0001 Shell weight 5.57±0.03d 5.77±0.03c 6.05±0.03a 5.96±0.03b <0.0001 Percentage shell (%) 9.51±0.04a 9.37±0.04b 9.54±0.04a 9.45±0.04ab 0.0018 Shell Thickness (µm) 401.07±1.44b 404.19±3.73b 415.80±3.73a 407.89±1.32b 0.0001
Internal quality: Albumen height (mm) 8.96±0.06a 7.11±0.06b 6.87±0.07c 6.33±0.07d <0.0001 Haugh Units 94.52±0.28a 83.11±0.41b 80.92±0.45c 76.99±0.52d <0.0001 Yolk colour score 10.32±0.05b 9.99±0.06c 10.41±0.05ab 10.46±0.05a <0.0001
There was a significant difference among age categories for a* after staining for
cuticle cover. Means values for a* increased, with the most negative values at 37 weeks of age and was confirmed by single value ΔEab.
Table 3 - Spectrophotometric measurements of stained cuticle.
Measurement Hen age (weeks) P Value 26 37 50 60 a* 1.51±0.34a -0.65±0.36b -0.09±0.42b 0.05±0.39b <0.0001
ΔEab 18.52±0.43b 19.92±0.39a 18.75±0.45b 17.37±0.44c <0.0001 a,b Across a row, values with different superscripts are significantly different from each other. Values are Mean ± SE
IV. DISCUSSION
In this experiment, flock uniformity was not consistent within individual flocks across the ages sampled. FR1 had a lower pullet weight at 19 weeks, and the average growth rate between 19-37 weeks of age complied closely with the breed standard and maintained high uniformity between 19 and 50 weeks of age. For FR 6, on the other hand, pullet body weight at 19 weeks was 120 g above the breed standard and was lower than the breed standard at 37-60 weeks of age. However, FR 6 maintained 80% uniformity at the ages sampled. The poor performance of many of the other flocks illustrates the likely variation at a commercial level; poor compliance with average growth rates patterns and low uniformity standards.
Age has an important effect on egg shell and internal quality. With increasing hen age, egg weight, shell weight and yolk colour increased. On the other hand, shell breaking strength, shell deformation, percentage shell and albumen height decreased, which is in agreement with previous studies (Roberts and Chousalkar, 2012; Van Den Brand et al., 2004).
The results of this experiment demonstrated a significant interaction between flock uniformity and egg quality parameters. FR 6 was very consistent for flock uniformity and this flock also had higher shell breaking strength, shell weight, percentage shell, shell thickness and amount of cuticle cover. Body weight at point of lay is a major factor influencing subsequent growth, production, and egg size (Balnave, 1984) and may influence flock uniformity during egg production. Maintaining flock uniformity is very important for achieving good egg shell quality. Fiks-Van Niekerk (2005) reported that egg quality of non-cage eggs is very
Aust. Poult. Sci. Symp. 2016.....27
139

variable, possibly due to higher environmental variation which leads to more factors contributing to egg quality.
The results from a*value after staining with cuticle blue dye was lower at 37, 50 and 60 weeks of age as compared with 26 weeks, indicating that the mean cuticle cover on the shell was lowest at 26 weeks. The single score value showed a strong correlation with the a* value (R2 = 0.8644). Sparks and Board (1984) stated that cuticle thickness decreases significantly with increasing age of the hen. However, Roberts, Chousalkar and Samiullah (2013) found that there was no significant effect of flock age in a conventional cage production system on the extent of the cuticle cover. The cuticle is thought to play a role in controlling water exchange by repelling water or preventing its loss, and may function in limiting microbial colonization of the eggshell surface (Hincke et al., 2008). Together with the mineralized shell and shell membranes, the cuticle constitutes a physical barrier against microorganism invasion and contamination of the egg content. (De Reu et al., 2008).
It seems likely that the lower average body weight in free range flocks will result in lower average egg weights, and this may confer some advantages for shell quality. Body weight at point of lay does affect the overall eggshell quality. However, maintaining flock uniformity is more important for good eggshell quality.
ACKNOWLEDGMENTS: This study was supported by funding from Australian Egg Corporation Limited.
REFERENCES
Balnave D (1984) Crop and Pasture Science 35: 845-849. de Reu K, Messens W, Heyndrickx M, Rodenburg TB, Uyttendaele M & Herman L (2008)
World's Poultry Science Journal 64: 5-19. Fiks-van Niekerk TGCM (2005) The Proceedings of the XVII European Symposium on the
Quality of Poultry Meat and XI European Symposium on the Quality of Eggs and Egg Products (23-26 May 2005, Doorwerth, Netherlands) pp. 262-266.
Hincke MT, Wellman-Labadie O, McKee MD, Gautron J, Nys Y & Mann K (2008) Biosynthesis and Structural Assembly of Eggshell Components. In: ‘Egg Bioscience and Biotechnology’ (Ed. Y Mine, Wiley) pp. 97-128.
Hudson BP, Lien RJ & Hess JB (2001) Journal of Applied Poultry Research 10: 24-32. Kosba MA, Zeweil HS, Ahmed MH, Shabara SM & Debes AA (2009) Egyptian Poultry
Science 29: 1157-1171. Leleu A, Messens W, de Reu K, de Preter S, Herman L, Heyndrickx M, de Baerdemaeker J,
Michiels CW & Bain M (2011) Journal of Food Protection 74: 1649-1654. Roberts JR & Chousalkar KK (2012) Proceedings of the Australian Poultry Science
Symposium 23: 241-244. Roberts JR, Chousalkar KK & Samiullah S (2013) Animal Production Science 53: 1291-
1297. Sparks NHC & Board RG (1984) British Poultry Science 25: 267-276. van den Brand H, Parmentier HK & Kemp B (2004) British Poultry Science 45: 745-752. Yuan T, Lien RJ & Daniel GRMC (1994) Poultry Science 73: 792-800.
Aust. Poult. Sci. Symp. 2016.....27
140

THE EFFECT OF DIETARY SUPPLEMENTATION WITH CALCIUM PIDOLATE AND 25-HYDROXYCHOLECALCIFEROL ON EGG QUALITY IN COMMERCIAL LAYING
HENS
K. AL-ZAHRANI1 and J.R. ROBERTS1
Summary
Seven groups from a total of 147 Lohmann Brown laying hens were housed individually in cages from 21 to 80 weeks of age. Birds were divided into a control group and groups receiving layer mash formulated to commercial standards supplemented with either a single or double dose of supplemental calcium pidolate, with or without supplemental Hy-D at either a single or double dose. Egg quality was measured as shell quality, internal quality, shell colour and cuticle coverage. There was a significant main effect of hen age and treatment group on albumen height, Haugh unit, and yolk colour score. There was a significant main effect of hen age and treatment group on egg weight, eggshell weight, percentage shell, shell breaking strength, shell deformation, shell thickness, shell reflectivity before staining, a* after staining, difference in a* before and after staining, and cuticle single score value. There was a significant main effect only of hen age on translucency score. A significant interaction between hen age and treatment group was found for yolk colour score, shell weight, shell reflectivity, a* after staining, difference in a* before and after staining, and cuticle single score value. The results indicated that, with increasing hen age, there was a decrease in albumen height, Haugh unit, percentage shell, shell breaking strength, shell deformation and shell thickness. Yolk colour score and translucency score increased with increasing hen age The effect of treatment group on the measured variables was inconsistent although the addition of Hy-D appeared to have greater effects than the addition of calcium pidolate.
I. INTRODUCTION
Eggs represent an economical source of high quality nutrients for humans (Caner, 2005). The number of chicken eggs produced globally increased from 42.8 to 59.7 million metric tons between 1995 and 2005, representing a 39% increase (Scanes, 2007) and increased further to around 69.1 million tons in 2010 (Food and Agricultural Organization Statistical Yearbook, 2013). The eggshell protects the internal contents from microbial penetration and provides protection against mechanical impact (Parsons, 1982). Roberts et al., (2013) reported that, if the eggshell is of good quality, it is difficult for bacteria to penetrate and enter the egg contents. Calcium pidolate and vitamin D metabolite are two supplements that have been added to the diets of laying hens in attempts to improve shell quality. Calcium pidolate is a calcium salt consisting of 13% calcium and 87% pidolic acid and is reported to have high solubility (Laurenceau et al., 2002, 2011). 25-hydroxycholechaciferol is fat-soluble and represents the first metabolite of vitamin D3 (Browning & Cowieson, 2014). The present study investigated the effects on eggshell quality of dietary supplementation with either a single or double recommended dose of calcium pidolate, in combination with or without a single or double recommended dose of 25-hydroxycholechaciferol (Hy-D®).
1 Animal Science, University of New England, Armidale, NSW, 2351; [email protected]; [email protected]
Aust. Poult. Sci. Symp. 2016.....27
141

II. MATERIALS AND METHODS
Lohmann Brown laying hens (147) were housed in individual cages from 21 to 80 weeks of age and divided into 7 groups each of 21 birds. A typical commercial layer mash feed was formulated by a nutritional consultant and mixed by a specialist feed company. Calcium pidolate and 25(OH)D3 in the form of Hy-D® premix were then added to feed for the 6 treatment groups as outlined in Table 1. Birds were given ad libitum access to feed.
Table 1 - Experimental treatment groups (Gp).
Gp 1 Gp 2 Gp 3 Gp 4 Gp 5 Gp 6 Gp 7 Ca pidolate g/kg 0 0.3 0.6 0.3 0.3 0.6 0.6 25(OH)D3 µg/kg 0 0 0 68.9 137.8 68.9 137.8
Eggs (one per bird) were analysed weekly for egg internal quality (Haugh unit,
albumen height and yolk colour score), traditional eggshell measures (eggshell translucency score, egg weight, eggshell weight, percentage shell, shell breaking strength, shell deformation, shell thickness), shell colour (shell reflectivity before staining), and the amount of cuticle present on the eggshells (a* after staining, difference in a* before and after staining, single score value). Specialised equipment (Technical Services and Supply U.K. egg quality equipment, Konica Minolta Spectrophotometer, shell thickness gauge based on a Mitutoyo Dial Comparator gauge), available in the Egg Quality Laboratory at UNE, was used for these analyses. Cuticle cover was estimated using MST cuticle blue dye and a Konica CM-2600d hand-held spectrophotometer. A single score value was calculated after the method of Leleu et al. (2011).
Flock age was divided into three stages: early lay (21-40 wks), mid lay (41-60 wks), and late lay stages (61-80 wks), for the purposes of statistical analysis. An average of 420 eggs was analysed for each treatment group at each stage of lay. Data were analysed by ANOVA using StatView software. Differences between means were established using Fisher’s Least Protected Difference test.
III. RESULTS
There was a significant main effect (P ˂0.05) on internal and external egg quality measurements of hen age and treatment group except for translucency score which was affected only by hen age. For all groups, there was a decrease with increasing flock age for albumen height, Haugh unit, percentage shell, shell breaking strength, shell deformation and shell thickness (Table 2). Yolk colour score and translucency score increased with increasing flock age and egg weight increased and then remained relatively constant. Shell weight and shell reflectivity before staining increased from early to mid lay and then decreased in late lay. The amount of cuticle present on the eggshells was lowest in late lay (Table 2). For all ages, there were inconsistent results in the treatment groups on most egg quality measurements (Table 3) with the treatment groups being rarely better than the control.
IV. DISCUSSION
A previous study found that dietary supplementation of 137.8 µg/kg 25(OH)D3 resulted in improved shell weight, percentage shell and shell thickness but decreased shell deformation and shell colour (Al-Zahrani and Roberts, 2015). The decrease in albumen quality with increasing age, observed in the present study has been reported previously (Ledvinka et al., 2012; Roberts et al., 2013). Egg weight increased until the end of the early lay period (41-45 weeks), and then remained relatively constant until the end of the experiment. However, egg
Aust. Poult. Sci. Symp. 2016.....27
142

weight was highest in the group receiving a single dose of calcium pidolate, with or without Hy-D. The increase in egg weight was not matched by the increase in shell weight, resulting in decreased percentage shell. The increase in egg weight in birds receiving supplementary calcium pidolate has been reported previously (Anonymous, 2012). There was a decrease in average shell thickness, shell breaking strength and shell deformation with increasing flock age as has been described previously (Roberts & Ball, 2004; Travel et al., 2011). The control group had the highest average shell thickness, shell breaking strength and shell deformation. There was no consistent effect of calcium pidolate supplementation with or without Hy-D. Shell reflectivity before staining indicated that the lightest eggshell colour for all groups was in the mid lay period and became slightly darker in the late period of lay. The group which received the double dose of both additives and the group that received the single dose of calcium pidolate had the least negative value for a* after staining, suggesting they have the lowest amount of cuticle present on the eggshell, When Hy-D was incorporated with a single dose of calcium pidolate, the amount of cuticle was similar to that in the control group, as evidenced by the difference in a* before and after staining and cuticle single score value results.
In conclusion, the addition of calcium pidolate, with or without Hy-D to the diet of laying hens had relatively few beneficial effects on egg quality.
REFERENCES
Al-Zahrani K, Roberts J (2015) Proceedings of the Australian Poultry Science Symposium 26: 40-43.
Anonymous (2012) Retrieved from: Essai-UNIV-CHILI-PIDO-CONSO_V03-GB_2012-06-04.pdf pp.1-3.
Browning LC & Cowieson AJ (2014) Journal of the Science of Food and Agriculture 94: 1389-1396.
Caner C (2005) Journal of the Science of Food and Agriculture 85: 1897-1902. Food and Agricultural Organization Statistical Yearbook (2013)
http://www.fao.org/docrep/018/i3107e/i3107e.PDF Leleu S, Messens W, de Reu K, de Preter S, Herman S, Heyndrickx M, de Baerdemaeker J,
Michiels C, Bain M (2011) Journal of Food Protection 74: 1649-1654. Laurenceau R (2002) Composition for laying hens containing calcium L-pidolate. United
States Patent US06362215B1. http://patents.justia.com/inventor/remy-laurenceau Laurenceau R, Roulleau X, Garres P & Renac J (2011) Substitution of calcium carbonate by
calcium pidolate during the critical breeding phase (France) pp. 1-39. Ledvinka Z, Tůmová E, Englmaierová M & Podsedníček M (2012) Archiv für Geflügelkunde
76: 38-43. Parsons A (1982) Poultry Science 61: 2013-2021. Price R (2012) Poultry World 166: 39. Roberts J & Ball W (2004) Australian Egg Corporation Limited Publication 3: 19. Scanes C (2007) Poultry Science 86: 1057-1058. Roberts J, Chousalkar K & Samiullah S (2013) Animal Production Science 53: 1291-1297. Travel A, Nys Y & Bain M (2011) Effect of hen age, moult, laying environment and egg
storage on egg quality. In: ‘Improving the safety and quality of eggs and egg products: Volume 1’ (Eds. Y Nys, M Bain & F Van Immerseel, Woodhead Publishing Ltd., Cambridge, UK) pp. 300-329.
Aust. Poult. Sci. Symp. 2016.....27
143

Table 2 - The effects of stage of lay on egg quality parameters1.
Response variable Treatment stage Early lay stage Mid lay stage Late lay stage
Albumen height a7.58 b6.53 c6.16 Haugh unit a87.1 b79.2 c76.5 Yolk colour score c9.2 b9.3 a11.6 Translucency score c1.09 b1.17 a1.33 Egg weight (g) b59.2 a62.9 a63.0 Eggshell weight (g) b5.48 a5.57 c 5.41 Percentage shell (%) a9.27 b8.87 c 8.62 Shell breaking strength a42.4 b37.4 c33.0 Shell deformation (µm) a288.6 b264.8 c243.8 Average shell thickness (µm) a399.9 b392.6 c385.0 Shell reflectivity before staining (%) c21.19 a23.57 b23.24 a* after staining a-2.82 b-4.42 b-4.22 Difference in a* before and after staining
a21.16 a21.26 b20.07
Cuticle single score value a22.61 a22.61 b21.35 (1)a-e Within a row means: With no common superscript letters are significantly different (P ˂0.05).
Table 3 - The effects of dietary calcium pidolate and Hy-D on egg quality parameters1.
Measurement Treatment group
1 2 3 4 5 6 7 Albumen height f6.38 a7.15 d6.70 d6.71 e6.59 b6.93 c6.81 Haugh unit f78.7 a83.0 d80.4 d80.7 e79.7 b82.4 c81.5 Yolk colour score c9.80 a10.19 bc9.86 b9.94 a10.18 a10.16 a10.12 Translucency score 1.19 1.24 1.20 1.19 1.19 1.20 1.18 Egg weight (g) c61.1 a62.9 b62.0 b61.8 b61.7 c61.2 c 61.3 Eggshell weight (g) ab5.56 a5.61 c5.47 b5.52 d5.39 d5.38 c5.47 Percentage shell (%) a9.13 b8.93 c8.86 b8.97 d8.77 cd8.82 b8.96 Shell breaking strength
a38.7 bc37.4 d36.7 a38.5 d36.7 cd36.8 a38.3
Shell deformation µm)
ab268.7 d262.8 cd264.2 a270.7 cd263.3 cd263.9 bc266.4
Shell thickness (µm) a399.5 b397.1 d389.8 c394.3 e387.0 e386.1 c393.3 Shell reflectivity before staining (%)
bc22.62 b22.86 a23.13 b22.77 c22.46 b22.84 d22.05
a* after staining d-5.316 a-2.073 c-4.042 d-5.473 d-5.084 b-2.842 a-1.957 Difference in a* before and after staining
ab22.35 e19.055 c20.78 a22.62 b22.07 d19.66 de19.30
Cuticle single score value
ab23.88 e20.13 c22.30 a24.05 b23.53 d21.04 e20.42 (1)a-e Within a row means: With no common superscript letters are significantly different (P ˂0.05).
Aust. Poult. Sci. Symp. 2016.....27
144

EFFECT OF PASTURE AND FEED ADDITIVES ON PERFORMANCE AND EGG QUALITY IN RANGING LAYING HENS
Z. IQBAL1, N. SHARMA1, N.K. SHARMA1, S. M’SADEQ1,
R.A. PEREZ-MALDONADO2, S. RAMIREZ-CUEVAS3, J. ROBERTS1, M. HILLIAR1, M. SINGH4, S. WU1, R.A. SWICK1 and I. RUHNKE1
Free-range egg production is rapidly growing in Australia with an estimated retail value market share of 48 % (AECL, 2014). Laying hens exposed to pasture range may experience reduced performance, poor enteric health and increased mortality (Ruhnke et al., 2014). In addition, egg quality can also be affected, indicated by the increased number of damaged and misplaced eggs as well as decreased egg shell quality (Kijlstra et al., 2009). These effects may be related to excessive fiber digestion and reduced nutrient uptake. The addition of multi-enzymes or organic acids to free-range layer diets may improve the digestion of nutrients, thus increasing performance, gut health and egg quality. A study was conducted to investigate the effect of range types and feed additives on performance and egg quality of ranging laying hens.
Sixteen week old Lohmann Brown layers (n = 300) were fed with a wheat-soy based diet, and allocated to six treatments and five replicates of 10 birds each. The treatments were applied in a 2 × 3 factorial arrangement to test the effect of range types (R1 = gravel of average size 2 x 1 cm; R2 = pasture: Festuca arundinacea) and feed additives (T1 = phytase/xylanse; T2 = phytase/xylanse/betaglucane/xylo-glucanase/pectinase/protease; T3= phytase/xylanse/benzoic acid/essential oils). Birds were adapted for two weeks before allowing access to range at the start of 19 weeks of age. At the age of the 24th week, five hens per house were randomly selected and sacrificed to study the intestinal pH and visceral organ weight. In addition, six eggs from each hen house were collected to investigate egg quality.
Birds ranged on pasture had significantly heavier (P < 0.05) gizzards (36.7 g ± 1.06; mean ± SEM) than those on the gravel range (28.8 g ± 0.75). The crop pH was lowest (P < 0.05) in the birds fed diets added with T1 (4.88 ± 0.07) compared to T2 and T3 (5.10 ±0.04 and 5.03 ±0.049, respectively). There was no significant interaction (P > 0.05) in body weight, liver and pancreas weight, and ileum pH among any treatments. In the egg quality parameters, egg albumen height was significantly higher (P < 0.05) in birds fed T1 (8.52 mm ± 0.25) compared to T2 and T3 groups (7.90 ± 0.29; 7.52 ± 0.17). Birds on the gravel range had higher (P < 0.005) egg Haugh Unit (90.8 ± 1.17) compared to those on the pasture range (87.2 ± 0.91; but yolk color was darker (P < 0.05) for pasture ranged birds (6.90 ± 0.13) compared to gravel ranged birds (4.36 ± 0.07). There was no interaction of diet or range (P > 0.05) on egg weight, shell banding, shell reflection, shell strength, shell weight and shell thickness. In conclusion, gizzard weight, digesta pH, and some egg quality traits can be influenced by range types or feed additives. ACKNOWLEDGMENTS: We would like to thank Poultry CRC for providing financial support. AECL (2014) Annual Report (Australian Egg Corporation Limited, Sydney). Kijlstra A, Meerburg BG & Bos AP (2009) J. Food Prot. 72: 2629-2637. Ruhnke I, Cowling G, Sommerlad M, Swick R & Choct M (2015) Proc. Aust. Poult. Sci. Symp.
26: 242-244.
1 Animal Science, School of Environmental and Rural Science, University of New England, Armidale NSW 2351; [email protected]
2 DSM Nutritional Products, Singapore 117440, Singapore. 3 Fractal Farming, Nutrition Consulting, Brisbane QLD 4000. 4 Poultry Research Foundation, University of Sydney, Camden, NSW 2570.
Aust. Poult. Sci. Symp. 2016.....27
145

ALPHA D3 IN LAYERS WITH DIFFERENT LEVELS OF CALCIUM AT THE END OF PRODUCTION PHASE
D.E. SANCHEZ1, T.C. BETACOURT2, J. GÓMEZ2 and G.M. RESTREPO1
Layers eventually lose their ability to activate vitamin D. According to Abe, 1982, a loss of 58% was observed in the renal capacity to activate 1α-25-(OH)2-D3 when birds of the same genetic line were compared with 33 and 90 weeks of age. This may explain some of the reduction in the ability to metabolize calcium in older hens, resulting in a poor eggshell quality and reduction in bone density. Based on these results, a trial was performed using a 1 alpha vitamin D3 metabolite that has already the renal hydroxylation. In the kidney, the metabolite 25-OH-D3 is transformed into the active form of vitamin D (1,25-(OH)2-D3), by the action of the 1 alpha hydroxylase enzyme. PTH and Calcitonin regulate this enzyme. 1 alpha vitamin D3 has the hydroxylation at the carbon 1 alpha in the Cholecalciferol. This feature allows an increment of Ca and P absorption through the intestine. This condition is useful especially at the end of production cycle in layers due to a reduction of the natural capacity to activate the vitamin D. A 3 x 4 factorial arrangement was used with three groups of Babcock Laying hens. The interaction of three levels On Top of 1 alpha vitamin D3 (0, 2.5 µg, and 5 µg/kg) was measured against four levels of dietary Ca (3.48, 3.85, 4.22 and 4.59 g per bird per day). The level of available phosphorous was fixed (0,325 per bird per day) and vitamin D3 was at a level of 3.000 IU. After 12 weeks of evaluation (from week 68-80 of age), the groups receiving vitamin 1 alpha vitamin D3 (2.5 mg and 5 µg / kg) with the highest level of Ca (4.59 g per bird day) had an advantage of 5.2 and 4.14 egg per housed hen (EHH) respectively compared to the treatment that did not receive the vitamin D3 metabolite. This result coincided with the results obtained by Safaa, H, 2008 who concluded that increased consumption of Ca (from 4.08 to 4.64 g per bird daily) increased the percentage of production from 71.2 to 74.9%. Regarding the broken eggs, the best performance was obtained by the treatment that received 5 µg / kg of 1 alpha vitamin D3 going from 0.83% to 0.51% as an average during the 12-week evaluation.
1 alpha vitamin D3 is a good option to decrease the impact of deterioration in egg shell quality in older layers, which is one of the biggest problems in the egg industry, which not only leads to lost of broken eggs, but largely determines the exit time for layers.
Table 1 - Use of 1 alpha hydroxy-cholecalciferol with different levels of Ca in a 68 to 80 week old Babcock laying hens. (Betancourt T and Sanchez D, 2014 (unpublished)).
Treatment 1 α OH D3 Ca Intake Prod. Rate EHH Cum Broken (µg / Kg) (g/hen day) (%) (Units) (%)
1 0 3.4 67.11 55.46bc 0.98a 2 0 3.8 68.24 57.25b 0.90a 3 0 4.2 67.63 56.81bc 0.86ab 4 0 4.6 66.25 55.44c 0.83ab 5 5 3.4 66.53 55.93bc 0.60ab 6 5 3.8 67.61 56.83b 0.64ab 7 5 4.2 69.21 58.30ab 0.51c 8 5 4.6 70.93 59.58a 0.51c
Probabilities
Ca 0.6511 0.2841 0.5925
1 α OH D3 0.1377 0.0467 < 0.0001
Ca * 1 α OH D3 0.0936 0.1686 0.9697
* The average weight at the beginning of the experiment was 2000 grams with uniformity of 90%; ** Description of the diet: ME: 2780 Kcal/kg, CP 16%, Fat 4,194%, linoleic acid 1,768%, Fiber 3,2%, Ash 10,934%, Ca 3%, avaP 0,28%, Lys dig 0,7%, Met dig 0,404%, M+ C dig 0,644%, Tre dig 0,532%, TRP dig 0,146%.
Abe E, Horikawa H, Masumura T, Sugahara M, Kubota M & Suda T (1982) J. Nutri. 112: 436-446. Safaa HM, Serrano MP, Valencia DG, Frikha M, Jimenez-Moreno E & Mateos GG (2008) Poult. Sci. 87:
2043-2051. Mitchell RD & Edwards Jr. HM (1996) Poult. Sci. 75: 111-119.
1 Premex Inc.; [email protected], [email protected] 2 Faculty of Veterinary Science, Universidad de la Salle, Bogotá-Colombia.
Aust. Poult. Sci. Symp. 2016.....27
146

ADDITION OF OAT HULLS IN BROILER DIETS IMPROVES UTILISATION OF FULL FAT CANOLA SEED
M.R. BAREKATAIN1, M. TOGHYANI2 and R.A. SWICK2
A previous study revealed that full-fat canola seed (FCS) may replace supplemental oil in the diet of broiler chickens despite lower fat digestibility and feed consumption observed in steam-pelleted diets (Barekatain et al., 2015). It was also shown that grinding the seed prior to pelleting did not result in additional benefit in bird performance. In the present study, it was hypothesised that addition of insoluble fibre would restore feed intake by improving fat digestibility through gastrointestinal development leading to enhanced bird performance.
A 2 × 2 × 2 factorial arrangement of treatments was used to investigate the effect of canola source (FCS vs canola meal plus oil as control), oat hulls (0 or 30 g/kg) and pellet temperature (75 and 90 ⁰C). A total of 576 male day-old Ross 308 chickens were assigned to 8 experimental treatments, each replicated 6 times (12 birds per replicate). Canola meal and canola oil in the control diets were replaced with FCS at 116 g/kg and 135 g/kg in the grower (d 10-24) and finisher (d 24-35) diets, respectively. Diets were formulated to be isonitrogenous and isoenergetic. All birds were fed the same commercial starter diet for the first 10 d of age after which grower and finisher experimental diets were fed. On d 24 and 35, three birds per replicate were randomly selected for measurement of relative weight of gizzard and intestinal organs.
A significant interaction was observed between canola source and oat hulls led to improved body weight gain (P<0.01) and FCR (P<0.05) in birds fed the combination of FCS and oat hulls in grower phase of feeding. Inclusion of 30 g/kg oat hulls in the diet of broilers tended (P=0.078) to increase feed consumption in grower phase regardless of pellet temperature or FCS inclusion. Pelleting temperature at 75 vs 90 ⁰C did not affect performance of broiler for any of the parameters. Birds fed diets containing oat hulls had heavier gizzards at 24 and 35 d of age. Pelleting diets at 90⁰ C resulted in a heaver gizzard at d 24 and duodenum at 24 and 35 d. In conclusion, FCS can replace supplemental oil in broiler diets when an adequate source of insoluble fibre is included in diet which may increase utilization of FCS in broilers fed steam pelleted diets.
Table 1 - Growth performance of broiler chickens for grower phase of feeding (d 10-24).
Treatment Oat Hulls (%)
Pellet Temperature
Feed intake (g/bird)
Weight gain (g/bird) FCR
Control 0 75⁰C 1462 1036 1.415 Control 0 90⁰C 1450 1021 1.420 Control 3 75⁰C 1474 1023 1.442 Control 3 90⁰C 1451 1029 1.411
Canola seed 0 75⁰C 1410 1001 1.408 Canola seed 0 90⁰C 1416 1042 1.360 Canola seed 3 75⁰C 1445 1096 1.319 Canola seed 3 90⁰C 1454 1082 1.345
SEM 6.02 5.97 0.0066 P values
Canola 0.088 0.032 <0.001 Oat hulls 0.078 0.007 0.088 Canola × oat hulls 0.021 0.004 0.02
ACKNOWLEDGEMENTS: This research was supported by the Poultry CRC (2.1.10).
Barekatain MR, Wu SB, Toghyani M & Swick RA (2015) Anim. Feed Sci. Tech. 21: 26-35.
1 South Australian Research and Development Institute, Roseworthy Campus, University of Adelaide, Roseworthy, 5371, Australia; [email protected]
2 School of Environmental and Rural Sciences, University of New England, Armidale, NSW 2351.
Aust. Poult. Sci. Symp. 2016.....27
147
TOWARDS COMMERCIALIZATION OF OMEGA-3 ENRICHED CHICKEN MEAT
K. KANAKRI1, J. CARRAGHER1, B. MUHLHAUSLER1, R. HUGHES2, 3 and R. GIBSON1
Consumption of long chain omega-3 polyunsaturated fatty acids (n-3 LCPUFA), especially EPA and DHA, is essential for healthy human development. Seafood is a good source of n-3 LCPUFA; however the majority of people do not meet the recommended intake of 2-3 serves per week due to reasons of personal preference and price.
Chicken meat is the most consumed meat in Australia. Normally, chicken meat is poor in n-3 LCPUFA, leading many researchers to investigate approaches to increase the n-3 LCPUFA content of chicken products through feed formulation. Adding fish oil to chicken feed results in a significant increase in the n-3 LCPUFA levels in chicken meat, however, this can be accompanied by adverse flavour characteristics. To overcome the sensory disadvantage, a different approach has been developed using specific plant oils instead of fish oil in the chicken diet. Flaxseed oil contains a high level of short chain n-3 PUFA, alpha linolenic acid (ALA), which chickens can convert into the fish-type n-3 LCPUFAs which can then accumulate in tissues (eggs and meat).
Flaxseed oil is more expensive than the animal fats that are commonly used in commercial chicken diets, and while it can improve birds’ growth rate and lower feed conversion rate by 8.3% and 10%, respectively (Carragher et al., 2015), the cost of flaxseed oil is still a barrier to commercial adoption.
In order to make this process more economically viable, we have previously investigated the content of dietary flaxseed oil required to maximise the level of n-3 LCPUFA in meat. The results suggest that optimal levels of n-3 LCPUFA can be achieved by including 17.1g of ALA per kg of feed, with higher ALA levels only giving small additional increases in meat n-3 LCPUFA (Kartikasari et al., 2012). Optimizing the omega-6 linoleic acid to ALA (LA:ALA) ratio in the feed to close to 1:1 was also found to improve birds’ efficiency in converting ALA to n-3 LCPUFA (Kartikasari et al., 2012). In our most recent study we determined the minimum duration over which the high ALA diet needs to be fed to broilers to achieve an increase in n-3 LCPUFA levels in meat equivalent to a full six weeks of feeding. We found that the flaxseed diet only needed to be fed to the birds in the final three weeks prior to slaughter; this represents a 14% reduction in the amount of flaxseed oil required to produce the same increase in the n-3 LCPUFA content of meat (Kanakri et al., manuscript in preparation). In our current experiment we are determining whether feeding diets containing flaxseed or marine oils to broiler breeder hens, so that the embryos are exposed to high levels of ALA or n-3 LCPUFA prior to hatch, can increase the ability of the offspring to convert dietary ALA into n-3 LCPUFA and incorporate these fatty acids into tissues. This research program represents an important step towards the delivery of a sustainable high n-3 LCPUFA chicken meat at an affordable price. Carragher J, Muhlhausler B, Geier M, House G, Hughes R & Gibson R (2015) Anim. Prod.
Sci. (Published Online). http://dx.doi.org/10.1071/AN14743 Kartikasari L, Hughes R, Geier M, Makrides M & Gibson R (2012) Prost. Leuk. Ess. F. A.
87: 103-109.
1 FOODplus Research Centre, School of Agriculture, Food and Wine, University of Adelaide, Adelaide, South Australia, Australia; [email protected]
2 South Australian Research and Development Institute (SARDI), Pig and Poultry Production Institute, Roseworthy Campus, South Australia, Australia.
3 School of Animal and Veterinary Sciences, University of Adelaide, Adelaide, South Australia, Australia.
Aust. Poult. Sci. Symp. 2016.....27
148

HYDROXY-SELENOMETHIONINE CONTRIBUTES TO MAINTAIN COLOR STABILITY OF TURKEY MEAT
M. BRIENS1, M. FAURE2, F. COULOIGNER1, J. GARET3, T. MAUCOTEL3,
N. TOMMASINO3, P. GATELIER2, D. DURAND2, P.A. GERAERT1 and Y. MERCIER1
Summary
Selenium (Se) is a trace element involved in the cellular redox regulation and is active through selenoproteins, such as, glutathione peroxidases, thioredoxine reductases or methionine sulfoxide reductase B. The present study aimed to evaluate the effect of the Se source hydroxy-selenomethionine (HMSeBA) on the color stability of turkey’s red meat in packaging conditions (70% O2, 30% N2). A total of 72 male turkeys (Grade Maker) of 83 days old were divided into two treatments as follows: a control diet (20 mg/kg of vitamin E and 0.3 mg/kg of Se from sodium selenite) and a test diet (control diet supplemented with 0.2 mg/kg of Se from HMSeBA). After four weeks of dietary supplementation, thigh meat parts were processed the day after animal slaughtering. Antioxidant enzymatic activities including catalase (CAT), superoxide dismutase (SOD) and glutathione peroxidase (GPx) were measured as well as vitamin A and E contents; pHu and glycolytic potentials were also assessed. The meat malondihaldehyde (MDA) and protein carbonyl contents were measured at 8 and 13 days after slaughter. A visual score was daily attributed to the meat portions from 1 (no discoloration) to 4 (at least 1/3 of meat discolored) during 13 days. A score above 3 indicated a non-saleable product. The meat GPx activity was higher (P < 0.05) for the test group compared to control. The CAT activity, vitamin A and vitamin E content were not affected by the diets. After 13 days of storage, meat from test group had lower MDA content compared to control (P < 0.05), but the protein carbonyl content was not affected by dietary treatments. The mean visual score was lower (P < 0.05) for the test group compared to control group at 8 and 13 days of storage. Therefore the findings of this study indicate that the treatment group containing HMSeBA had improved meat storage capacity following 15 days of storage, as assessed by MDA and colour score, corresponding to 1.5 day more at higher quality grade and sellable. Those results indicated a positive effect of HMSeBA supplementation in turkey diet to contribute to improve meat color stability in standard storage conditions.
I. INTRODUCTION
Poultry meat can be largely influenced by oxidative reactions on lipids and proteins that can change its nutritional, sensory and / or visual quality. Antioxidant supplementations (mainly: Vit C, Vit E, selenium) have been demonstrated to alleviate those deleterious reactions (Surai 2002; Delles et al. 2014; Estevez 2015). Using European standards for meat packaging (70% O2 / 30% N2; 4°C), important discoloration defects are observed on thigh turkey meat along storage and characterized by green spots occurrence. Sanitary analyses demonstrated no microbial growth on those thigh meat products within the 14 days best before date, suggesting an oxidative phenomenon affecting lipids or proteins. The appearance of those green spots on meat around day seven of storage induces consumer rejections of those products and thus economical losses. Selenium is biologically active through SeCys present in a specific class of proteins named selenoproteins (Labunskyy et al. 2014). Those
1 Adisseo France S.A.S., 10 Place du Général de Gaulle, 92160 Antony, France; [email protected] 2 INRA, Centre de recherche de Clermont-Theix-Lyon, 63122 Saint-Genès-Champanelle, France. 3 L.D.C., ZI St Laurent, 72302 Sablé, France.
Aust. Poult. Sci. Symp. 2016.....27
149

selenoproteins are major actors of cellular Reduction-Oxidation reactions as part of the glutathione and thioredoxin systems. The selenium source hydroxy-selenenomethionine (HMSeBA) is a highly bioavailable selenium source compared to standard selenite and Se-yeast sources (Briens et al. 2014). Moreover, it increases both selenium forms for the animal, the storage form of selenium: selenomethionine (SeMet), and the active form of selenium: selenocysteine (SeCys) (Briens et al. 2013). Those improvements could protect animal and meat quality products against various oxidative stresses.
This study aimed to determine if a feed supplementation with the highly bioavailable selenium source hydroxy-selenomethionine could improve color stability during thigh turkey meat storage.
II. MATERIALS AND METHODS A total of 72 turkey males (Grade Marker) of 83 days of age previously fed a standard diet in a commercial farm were selected for the study. Animals were allocated to two treatments (four replicates of nine animals per treatment) in standard rearing conditions during the last four weeks preceding slaughtering. Animals of treatment one received a control diet containing 20 mg/kg of vitamin E and 0.3 mg/kg of selenium from sodium selenite (control group). Animals of treatment two received the control diet + 0.2 mg/kg of selenium from HMSeBA (test group). At the end of the animal phase, growth performances were recorded. Then, all birds were transferred to an industrial slaughterhouse in order to process all thigh meat in standard package (protective film of polyvinylchloride, 70% O2, 30% N2 atmosphere, 4°C). A total of 243 meat units were processed per treatment for visual grading under those conditions and other analyses. Meat visual grading was recorded daily during 13 days by an expert panel. The visual score started from one (no discoloration) to four (at least 1/3 of meat discolored); a score above 3 indicated a product rejected by the consumer.
Several biomarkers were assessed on thigh meat at various times on six meat unit replicates per treatment, randomly selected in the initial 243 meat units per treatment, thus ending with 12 meat units for biomarkers assessment and 231 for visual grading. Briefly, spectrocolorimetric techniques were used to assess glutathione peroxidase (GPx), superoxide dismutase (SOD) and catalase (CAT) activities, as well as protein carbonyl content, glucose, glucose-6-phosphatate and lactate. Ultimate pH was determined 24 h post-mortem using pH meter in homogenized tissue. HPLC coupled with UV or spectroscopic detections were used for vitamin E (α-tocopherol, α-tocotrienol) and vitamin A (retinol), malondialdehyde (MDA) quantifications. All data were analyzed using the GLM procedure of SAS.
III. RESULTS AND DISCUSSION Results of growth performance did not indicate significant differences between treatments during the last four weeks before slaughtering (data not shown).
Results of visual grading indicated significant differences between thigh meat of the control group and the test group (P < 0.05) (Figure 1). Indeed, on day eight of storage the average visual grading was assessed at 1.6 for the test group against 2.25 for the control group, indicating a lower occurrence of green spots on the meat and a better visual aspect for the test group. Daily scoring confirmed the kinetic degradation of meat products over time, however significant differences were maintained till day 13 between the control and test group and confirmed the better visual aspect observed in the test group. Other calculations using visual grading results enabled to estimate that consumer acceptance of the thigh meat product were improved by one and half day in the test group compared to the control group (data not shown).
Aust. Poult. Sci. Symp. 2016.....27
150

Figure 1 - Panel expert visual grading of thigh turkey meat conditioned in standard package (protective film of polyvinylchloride, 70% O2, 30% N2 atmosphere, 4°C). Grades were attributed according to the severity of meat discoloration and green spots occurrence from Grade 1: no meat discoloration to grade 2, 3 and 4: minor, moderate and major discoloration, respectively. Control group: turkey fed standard diet, Test group turkey fed the standard diet + 0.2 mg Se/kg feed of HMSeBA during four weeks before slaughtering. n=243 meat units per treatment, error bar= SEM, P < 0.05.
Several biomarkers were measured in order to assess oxidative mechanisms involved
in the described discoloration process. Ultimate pH of the thigh meat of the test group was significantly higher compared to the control group (6.38 and 6.28 respectively, P < 0.05) (Figure 2, A). Differences in the pH of the meat were supported by lactate levels in those samples: 17.9 µmol/g for the test group and 18.4 µmol/g for the control group (P < 0.05). Surprisingly, no difference in glycolytic potential (glucose and glucose-6-phosphate) were observed between both treatments (P > 0.05) but higher ultimate pH of the test group was observed and traditionally associated with preservation problems at those levels (Tesseraud et al. 2014), however, for elusive reasons those higher ultimate pH correspond to thigh meat with improved visual grading.
Figure 2 - Evaluation of different biomarkers on thigh turkey meat 24 h or after storage in standard package. Control group: turkey fed standard diet, Test group turkey fed the standard diet + 0.2 mg Se/kg feed of HMSeBA during four weeks before slaughtering. A) Ultimate pH. B) Glutathione peroxidase (GPx) activity, C) Malondialdehyde (MDA) content. n=6 replicate per treatment, error bar= SEM, P < 0.05.
Levels of vitamin E and vitamin A were also assessed 24 h post slaughtering; results
did not indicate significant differences between treatments of those two metabolites (data not shown). Nevertheless, specific differences in redox enzymatic activities were observed in those tissues. CAT activity did not result in significant differences between treatments (data
Aust. Poult. Sci. Symp. 2016.....27
151

not shown). However, lower SOD activity was observed in thigh of the test group (0.60 U/min/g muscle) compared to the control group 0.74 U/min/g muscle (P < 0.05). In contrast, higher GPx activity was observed for the test group compared to the control group (0.4 and 0.3 pmol NADP/min/mg muscle), (P < 0.05) (Figure 2, B). Most glutathione peroxidases are selenoproteins requiring selenium present in the SeCys catalytic site of those enzymes. Studies indicated an increased GPx activity after improvement of animal selenium status (Zoidis et al. 2014). Those results thus confirmed that highly bioavailable selenium forms can positively influence a selenoprotein activity as described here with GPx.
Levels of oxidative damage products were assessed through carbonyls and MDA contents after a 13 day storage time of the meat. No differences in carbonyl levels were observed between both treatments (data not shown) rejecting a major protein oxidation process involved in the meat discoloration process. However, lipid oxidation was assessed through MDA levels and revealed a significantly lower amount in the test group compared to the control group (P < 0.05) (Figure 2, C). Reactive oxygen species can induce lipid peroxidation processes and influence meat color (Xiao et al. 2011), and the glutathione system is one of the most important mechanism to protect the cell against those species (Jones 2008). Thus the lower lipid peroxidation level may be related to the higher glutathione peroxidase activity observed in the test group.
IV. CONCLUSION
Thigh turkey meat discoloration (green spots) occurring after the storage of the meat results in large economical losses. Selenium through selenoproteins is involved in several reduction-oxidation reactions that are connected to those defects. Results indicated that supplementation of a standard diet with a complementary addition of selenium with the source hydroxy-selenomethionine (HMSeBA) was efficient to slow down the meat discoloration observed on the meat. Indeed, tissues of those animals had higher glutathione peroxidase activity: a selenoprotein, preventing oxidative damages as observed by lower lipid peroxidation level in the meat.
REFERENCES
Briens M, Mercier Y, Rouffineau F, Mercerand F & Geraert PA (2014) Poultry Science 93: 85-93.
Briens M, Mercier Y, Rouffineau F, Vacchina V & Geraert PA (2013) The British Journal of Nutrition 110: 617-624.
Delles RM, Xiong YL, True AD, Ao T & Dawson KA (2014) Poultry Science 93: 1561-1570.
Estevez M (2015) Poultry Science 94: 1368-1378. Jones DP (2008) American Journal of Physiology. Cell Physiology 295: 849-868. Labunskyy VM, Hatfield DL & Gladyshev VN (2014) Physiological Reviews 94: 739-777. Surai PF (2002) World’s Poultry Science Journal 58: 431-450. Tesseraud S, Bouvarel I, Fraysse P, Métayer-Coustard S, Collin A, Lessire M & Berri C
(2014 ) INRA Productions Animales 27: 337-346. Xiao S, Zhang WG, Lee EJ, Ma CW & Ahn DU (2011) Poultry Science 90: 1348-1357. Zoidis E, Demiris N, Kominakis A & Pappas AC (2014) Animal: An International Journal of
Animal Bioscience 8: 542-554.
Aust. Poult. Sci. Symp. 2016.....27
152

GLOBAL PHOSPHORUS SCARCITY: A FOOD SECURE FUTURE?
D. CORDELL1,2
Summary
Like water or carbon, phosphorus underpins food security. Yet unlike other critical resources, research and management of phosphorus to ensure a secure and equitable supply-chain is seriously limited. The sustainability implications of global phosphorus scarcity for Australia and the world’s food system are wide-ranging, from geopolitics and inequality to water pollution and reduced agricultural productivity. As an essential nutrient in fertilisers and feed for food production, phosphorus has no substitute. While the use of phosphate fertilisers has contributed to feeding billions of people globally over the past half-century by boosting crop yields, Australia and the world are currently dependent on phosphorus sourced from finite phosphate rock reserves that have taken tens of millions of years to form. These reserves are now becoming more expensive, scarce, difficult to physically access and geopolitically concentrated in only a few countries.
I. PHOSPHORUS VULNERABILITY Phosphorus scarcity is a serious threat to food security. Recent studies indicate that phosphorus demand could outstrip finite supplies of high quality phosphate sometime between 2025-2084 if no fundamental changes are made to the current trajectory, while others argue we have ‘hundreds’ of years remaining (Cordell and White, 2014). Despite the uncertainty of the timeline, there is consensus that the remaining reserves are of lower quality, harder to physically access, require more energy to mine/process and are becoming more expensive (IFDC, 2010).
Geopolitical risks associated with the supply concentration of phosphate producers carry perhaps the greatest consequences for food security. While all countries and farmers need access to phosphorus, only five countries together control most of the world’s remaining phosphate. Morocco alone controls three-quarters of the world’s phosphate rock. Together with China, Syria, Algeria, and South Africa, these 5 countries control 89% of the world’s remaining phosphate (USGS, 2015; Figure 1). It is predicted that Morocco’s market share could increase to 80–90% by 2030 (HCSS, 2012). So few producers of a globally critical resource in potentially politically unstable regions creates a serious risk of disruption to supply and price fluctuations.
Further, Morocco’s occupation of the territory of Western Sahara (including its’ significant phosphate reserves) is vigorously contested and condemned by the United Nations. Importing phosphate from this region bears a huge social cost associated with the exploitation and displacement of the Saharawi people of Western Sahara (WSRW 2015), and, a reputational risk for Australian phosphate companies importing phosphate from the region. Further complicating the story, 80 per cent of phosphorus mined specifically for food production is lost or wasted along the supply chain due to inefficient practices. Much of this ends up in the world’s rivers and oceans, where it can, and is, causing widespread pollution in the form of toxic algal blooms that kill fish and pollute drinking water. This costs fisheries and recreation industries heavily, from China to the Great Barrier Reef to The Great Lakes of North America. The cost of algal blooms is estimated at US$2.2 billion in the US alone
1 Institute for Sustainable Futures, University of Technology Sydney; [email protected] 2 Global Phosphorus Research Initiative; http://phosphorusfutures.net
Aust. Poult. Sci. Symp. 2016.....27
153

(Dodds et al, 2009). A 2014 algal bloom saw the North American town of Toledo trucking in bottled drinking water from neighbouring states after their water supply was rendered toxic.
The 800% phosphate price spike in 2008 demonstrated the vulnerability of the global and Australian food system to even a short-term disruption in supply (Cordell, Turner & Chong, 2015). Hundreds of millions of farmers suffered, crop yields were compromised and food insecurity increased. In Australia, a Senate Inquiry investigated the potential presence of oligopolies and hording that led to short-term phosphate scarcity in this country.
Figure 1 - Distribution of the world’s remaining phosphorus reserves. Units are in million tonnes of phosphate rock (Data: USGS 2015; visualization: Uniview visualization software by SCISS AB).
II. THE SITUATION IN AUSTRALIA
A food secure future in this country is by no means guaranteed. Australia’s ancient weathered soils are naturally phosphorus-deficient and the application of phosphate fertilizers has been part of agriculture’s backbone. Very few producers control the domestic phosphate market, creating further supply risks. Incitec Pivot Limited controls Australia’s main phosphate mine in Queensland, where it is expected that supply will last a few decades. Despite being a net food producer, Australia is a net phosphorus importer – the world’s fifth largest– due to naturally phosphorus-deficient soils, and an export industry focused on phosphorus-intensive agricultural commodities like beef, wheat and live animals (Cordell, Jackson & White, 2013).
The consequences of phosphorus scarcity will be felt long before the last megatonne of phosphate is mined. Phosphorus scarcity would have drastic consequences for the productivity of Australia’s agriculture including increased farmer vulnerability through increased farm input costs, lack of fertiliser availability and accessibility, reduced crop yields and reduced food and agricultural exports which would flow on to the nation’s economic prosperity. There is a strong need to identify how Australia and other regions can cope, adapt or transform in response to this emerging global challenge. Fortunately, these risks can be transformed into opportunities. For example, by diversifying sources of phosphorus away from imported phosphate rock, Australia can buffer against a range of supply-chain risks and increase resilience in terms of agricultural productivity, food
Aust. Poult. Sci. Symp. 2016.....27
154

security, ecological integrity of waterways and farmer livelihoods (Cordell, Jackson & White, 2013). Phosphorus can be recovered from all waste sources in the food chain between mine and fork, including crop waste, animal manure, food waste, other green waste, wastewater and excreta. Further, the concentration of populations in cities creates ‘phosphorus hotspots’ of pollution risks and an opportunity for efficient recovery for reuse as renewable fertilisers in and around the Sydney Basin. Indeed, the Sydney Basin has fifteen times more phosphorus supply in poultry manure, urban wastewater and food waste than agricultural demand in the region (Metson and Cordell, forthcoming).
III. PHOSPHORUS SECURITY Phosphorus security means ensuring the resource is both available and accessible so that farmers can produce sufficient and nutritious food to feed the world while ensuring rivers and oceans are free from nutrient pollution. Achieving phosphorus security in Australia is likely to require an integrated approach, that might range from developing markets for renewable phosphorus fertilisers sourced from human and animal excreta, to efficient strategies for ‘unlocking’ soil phosphorus that has accumulated in agricultural fields over past decades. There is a whole ‘toolbox’ of technologies and options for phosphorus recovery and efficiency that together can meet future phosphorus demand (Cordell and White, 2013). Figure 2 indicates potential interventions in the livestock sector. Important will be to take a context-specific approach that considers the state of existing infrastructure and logistics, actual phosphorus flows and fate, current pressures and harnesses local opportunities and drivers.
Figure 2 - Potential sustainable phosphorus intervention points in livestock systems. Red = recycling measures,
blue = efficiency/demand management measures. (Cordell & White 2013).
Aust. Poult. Sci. Symp. 2016.....27
155

IV. OPPORTUNITIES Specific opportunities for a more phosphorus secure and sustainable poultry sector could include: • Phytase replacement: reduce phosphorus demand and pollution risk through the use of
phytase enzymes to replace phosphate feed additives and reduce phosphorus in manure (Afinah et al, 2010);
• Manure reuse: poultry manure has the highest phosphorus concentration of all manures, and its use as a renewable fertiliser can both reduce local pollution in addition to providing high-phosphorus locally available fertilisers (Szogi & Vanotti, 2009);
• Efficient feed grain production: increase phosphorus use efficiency in feed grain production through more targeted fertiliser application rate, timing, positioning, to reduce phosphorus demand and pollution (IPNI, 2015); and
• Dietary changes: different foods have different phosphorus footprints (i.e. the amount of phosphorus mined to produce a kilogram of food product); hence preferencing foods with lower phosphorus footprint can significantly reduce global phosphorus demand and extend the longevity of global reserves. Poultry’s phosphorus footprint is three times less than beef, but forty-eight times more than pulses (Metson et al 2012). Importantly, technologies and practices don't implement themselves: effective policy
instruments are required to stimulate and support innovative phosphorus strategies. Shifting the current unsustainable trajectory means that all stakeholders will need to play a role – from the agricultural & livestock industry to the sanitation sectors – to ensure agriculture is productive, all farmers have access to nutrients & fertilisers, over 9 billion people have access to healthy diets and our rivers and oceans are clean.
REFERENCES Afinah S, Yazid AM, Anis Shobririn MH & Shuhaimi M (2010) International Food
Research Journal 17: 13-21. Cordell D & White S (2013) Agronomy 3: 86-116. http://www.mdpi.com/2073-4395/3/1/86 Cordell D & White S (2014) Annual Review of Environment & Resources 39: 161-
188. http://www.annualreviews.org/doi/abs/10.1146/annurev-environ-010213-113300 Cordell D, Jackson M & White S (2013) Environmental Science & Policy 2: 87-102.
http://www.sciencedirect.com/science/article/pii/S1462901113000099 Cordell D, Turner A & Chong J (2015) Global Change, Peace and Security 27: 323-343.
http://www.tandfonline.com/doi/abs/10.1080/14781158.2015.1083540 Dodds WK, Bouska WW, Eitzmann JL, Pilger TJ, Pitts KL, Riley AJ, Schloesser JT
& Thornbrugh DJ (2009) Environmental Science & Technology 43: 12-19. http://pubs.acs.org/doi/full/10.1021/es801217q
Global Phosphorus Research Initiative (2015) www.phosphorusfutures.net HCSS (2012) Rep. No. 17/12/12, Hague Centre Strategic Studies (The Hague).
http://www.hcss.nl/reports/download/116/2053 IFDC (2010) World Phosphate Rock Reserves and Resources (International Fertilizer
Development Centre, Washington, D.C). http://pdf.usaid.gov/pdf_docs/Pnadw835.PDF IPNI (2015) 4R Plant Nutrition Manual: A Manual for Improving the Management of Plant
Nutrition (International Plant Nutrient Institute, Georgia) http://www.ipni.net/ipniweb/portal.nsf/0/231EA9CAE05F5D24852579B200725EA2
Metson G, Bennett E & Elser J (2012) Environmental Research Letters 7: 1-10.
Aust. Poult. Sci. Symp. 2016.....27
156

Metson G & Cordell D (2016) Mapping Sydney’s phosphorus supply and demand. (P-FUTURES project) (forthcoming) http://www.p-futurescities.net/sydney-australia/#MappingSydney
Szogi A & Vanotti M (2009) Bioresource Technology 100: 5461-5465. USGS (2015) Phosphate rock. Mineral Commodity Summary (US Geological Survey,
Reston, VA). http://minerals.usgs.gov/minerals/pubs/commodity/phosphate_rock/mcs-2013-phosp.pdf
WSRW (2014) Morocco’s Exports of Phosphates from Occupied Western Sahara 2012 & 2013 (Western Sahara Resource Watch, Melbourne). http://wsrw.org/files/dated/2015-03-11/p_for_plunder_2014_web.pdf
Aust. Poult. Sci. Symp. 2016.....27
157

BIOTECHNOLOGY IN THE DEVELOPMENT OF IMPROVED PHYTASES
R.E. SPEIGHT1
Summary Phytase enzyme supplements are now ubiquitous in the commercial production of a range of livestock, particularly chickens and pigs. Significant effort has been directed over the last two decades towards producing improved enzymes with higher activity, increased stability and at economic levels in industrial fermentations. As such, there are excellent products on the market, but there is a continuing demand for further improvements to drive down costs and for enzyme manufacturers to increase market share. The rapid development of DNA sequencing and gene synthesis technologies has provided ready access to a large number of new and uncharacterised potential phytases. Challenges remain however in identifying and developing those with improved properties.
I. INTRODUCTION Phosphate is essential for life and all organisms must have access to sufficient phosphate to survive and grow. Phytases are now routinely added to livestock feed for the removal of phosphate from the plant molecule phytate. Use of phytase reduces the addition of inorganic phosphate to diets and decreases the anti-nutritional effects of phytate. Phytase enzymes perform a variety of roles in nature in a variety of host organisms. For example, phytate is observed at high levels in seeds, typically at around 70-80% of total phosphorous in maize, wheat, sorghum and barley (Kornegay 2001, Selle et al. 2003). Phytase is present in these seeds to release phosphate and other nutrients bound to phytate, such as iron and zinc (Brinch-Pedersen et al. 2002) for plant growth. Microorganisms also produce phytases to access phosphate from phytate in environments where plant matter is present, including the gut and the soil (Pandey et al. 2001). Thus, nature provides a whole host of candidate phytases from a range of organisms that could be exploited as livestock feed supplements. Phytases have been identified in the past using traditional microbiology and biochemical approaches either from the environment or from culture collections (Pandey et al. 2001). The number of different candidates that can be accessed readily has increased dramatically in recent years due to the generation of vast amounts of genomic sequence data. With the continuing demand for ever-improved phytases coupled with competition for market share through best-in-class products, generating the most efficient methods for identifying and improving the best candidates for future economic large scale production is a constant endeavour.
The three main characteristics that define the best phytase enzyme supplements are high specific activity in the gut, high stability and high levels of production in industrial microbial fermentations. Ultimately, the most important factor is optimising the amount of enzyme catalytic activity that can be realised in the animal gut, therefore releasing the optimal amount of phosphate for the desired animal growth rate and feed conversion efficiency at an appropriate financial cost. The higher the specific activity of the enzyme, the less mass of enzyme is needed to realise the same catalytic activity and so the enzyme loading (by mass) can be lower, saving on manufacturing cost. The yield (g/L) and volumetric productivity (g/L/day) of enzyme in an industrial fermentation can be optimised through recombinant microbial strain development and bioprocess engineering but will reach an upper limit. As such, to fully optimise the number of units of enzyme activity that can be
1 Queensland University of Technology (QUT); [email protected]
Aust. Poult. Sci. Symp. 2016.....27
158

realised from an industrial fermentation, the enzyme should also display a high specific activity (U/g, where 1 unit (U) is defined as the conversion of 1 micromole of substrate per minute under specified assay conditions).
Once an enzyme has been manufactured and formulated, as much of the original enzymatic activity should be realised in the gut of the animal as possible. Activity can be lost through thermal denaturation during feed pellet production, where the enzyme may be exposed to temperatures of up to 95 ºC, during storage and transportation and through degradation by proteases and the acidic conditions encountered in the gut. Further, the enzyme should display high levels of activity at gut pH (and in the most relevant part of the gut with the pH changing throughout the digestive system) and gut temperature (around 37 ºC). The requirement for stability at high temperatures during pelleting coupled with optimal activity at the lower temperatures in the gut presents a major challenge as the molecular basis for increased thermal stability (such as increased structural rigidity) typically leads to a higher optimal temperature of activity (Giver et al. 1998). This phenomenon is often observed in enzymes from thermophilic organisms that are stable at very high temperatures but have relatively low or non-existent activities at gut temperature. In fact, due to reaction rates increasing with temperature generally and to achieve a compromise between activity and stability, many enzymes have optimal activities above gut temperature (Yao et al. 2012). Ultimately, regardless of the temperature activity profile, it is the number of units of enzyme (specific activity) in gut conditions (temperature and pH) that is important. This paper will review and discuss methods to identify and develop improved phytase enzymes for animal feed applications.
II. NEW ENZYME DISCOVERY
In order to discover and develop enzymes with desired characteristics a number of approaches are commonly employed. In the first instance, the enzymes that naturally display the best possible characteristics should be identified from nature, using environmental sampling and/or genomic/protein databases. The better these ‘wild-type’ or native enzymes are the more likely protein engineering, if required, will deliver a suitable livestock feed supplement. Nature provides a very large number of organisms or putative gene/protein sequences in databases that could be screened. Traditional approaches have relied on the direct identification and characterisation of phytases from organisms of interest, including during basic studies into phosphate metabolism in organisms such as Saccharomyces cerevisiae (Oshima 1997) and for elucidating enzyme function in commonly used organisms such as Escherichia coli (Greiner et al. 1993).
To take advantage of the wealth of available genomic information it is necessary to develop strategies to interrogate this resource in a meaningful and efficient manner to identify a subset or individual candidates that have an increased likelihood of displaying desirable properties. High throughput biochemical screening approaches can then be used to characterise as large a subset as possible. A search in November 2015 of the National Center for Biotechnology Information protein database with the search term ‘phytase’ revealed 26,388 hits, of which 23,716 were from bacteria (Figure 1). A very small proportion of these hits have actually been characterised and tested to prove that they are indeed phytases and to determine their properties, the remainder are assigned as putative phytases using algorithms based on homology to known phytase sequences. One tool for annotation and assigning function is the Clusters of Orthologous Groups of proteins (COGs) database. This database is focused on microbial proteins and was established in 1997 (Tatusov et al. 1997) and most recently updated in 2014 (Galperin et al. 2015). It uses whole genome sequences to assign orthologues and paralogues and assigns function based on characterised protein family
Aust. Poult. Sci. Symp. 2016.....27
159

members. However, assigning function in terms of the reaction that is performed does not provide information on the suitability of the enzyme for the intended commercial applications. Knowing that a protein is likely to be a phytase does not provide any information regarding stability or the catalytic efficiency in gut conditions. With such a large number of putative sequences available, it is significantly challenging to identify and test candidate enzymes that could be suitable for commercial application.
Figure 1 - Taxonomic group tree showing the origin of proteins labelled as phytase generated from the National Center for Biotechnology Information protein database (www.ncbi.nlm.nih.gov/protein) in November 2015 with the number of proteins represented in each group shown in brackets. *Cytophaga-Flavobacterium-Bacteroides group. Other sequences are Archaea (8), viruses (7) and others (219).
Along with the rapid development of DNA sequencing technologies that has led to
this large number of putative phytase sequences, the ability to ‘write’ DNA through gene synthesis and its ready commercial availability has made obtaining and testing sequences far easier and cheaper than ever before. Nevertheless the cost of gene synthesis is still in the order of US$0.20 per base pair at best meaning around US$200 per gene for a typical phytase gene of around 1000 base pairs. To access only 1% of the available sequences would cost around US$50,000. Even though the ability to readily purchase synthetic genes has already revolutionised molecular biology, for it to become a high throughput tool a reduction in cost of one or two orders of magnitude is required. This observation is not lost on a range of existing and emerging synthetic biology companies who are aiming to reduce the cost of writing DNA in a similar fashion to the dramatic cost reductions and increases in throughput observed with reading DNA (Kosuri and Church 2014).
Regardless of the cost, to obtain only 1% of the available sequences, 263 phytases would still need to be produced and tested. This testing remains a considerable effort using traditional enzyme production methods to generate and culture recombinant microbes and biochemical assays to test the enzymes. Even 10% would be a serious undertaking. Efforts to increase the throughput of protein synthesis and testing include the use of in vitro or cell-free transcription and translation. This method avoids the bottleneck of generating production strains through plasmid cloning and microbial transformation with the DNA. For example, a
Aust. Poult. Sci. Symp. 2016.....27
160

system has been designed for high-throughput parallel cloning using species independent promoters for cell-free synthesis in lysates from a variety of organisms (Gagoski et al. 2015). In addition, as little as 0.1 ng of plasmid DNA was required for detectable protein synthesis, providing the prospect of future miniaturisation and subsequent increases in throughput.
Given the cost of gene synthesis and an upper practical limit on the number of sequences that can be tested, it is currently necessary to be smart or lucky, or both, in the initial selection of candidate sequences as well as having an initial biochemical screening system that is as high throughput as possible. The use of in silico methods and bioinformatics tools could be used to interrogate the databases to produce a subset of sequences that are more likely to display desirable qualities (such as high stability and catalytic activity) compared to random selection. Such an approach was demonstrated successfully for the identification of (R)-transaminase enzymes. Enantio-preference was predicted through the rational design of mutated variants in related enzymes that may confer the desired specificity, followed by database searching to identify natural sequences already containing the predicted mutations (Höhne et al. 2010).
Using in silico approaches to reliably predict protein stability and the effects of amino acid variation in similar sequences remains a significant challenge. These challenges arise partly from the complexity of protein structure and the way proteins stably fold as well as the dependence of stability on external conditions such as buffer composition (e.g. pH and salt concentration). Four methods for predicting stability were evaluated that were based on the Gibbs free energy of protein folding and the change in Gibbs free energy upon mutation at specific positions (Thiltgen and Goldstein 2012). Each method showed limitations, especially where the mutation was at a position buried within the protein structure. The Rosetta approach (Rohl et al. 2004) was overall as good as or better than the other three but it is not ideally suited for screening databases for the prediction of the most stable orthologue. Recognising these limitations, new methods for predicting the effect of mutations on protein stability continue to be generated but these are also not yet suitable for database screening and are often limited to single mutations per protein, for example with the programmes DUET (Pires et al. 2014) and PoPMuSiC (Dehouck et al. 2011). Overall these tools are designed for the analysis of point mutations in specific proteins or to aid protein engineering strategies to improve stability through mutation. Approaches for determining catalytic efficiency and selecting sequences likely to lead to high enzyme activity are even more challenging. These approaches have mainly been targeted at designing and predicting sequence modifications for enzyme improvement (Damborsky and Brezovsky 2014). Further developments and new approaches are required to be able to reliably select sub-populations of putative enzyme sequences from databases that have increased likelihood of commercially desirable levels of stability and activity.
III. DEVELOPING EXISTING ENZYMES
a) Commercial Examples
The commonly used phytases in livestock production were developed using a variety of approaches, including enzyme isolation and biochemical characterisation coupled with recombinant expression. In addition, significant developments have been made to achieve economic levels of production in fermentations using a variety of recombinant microorganisms. Table 1 describes some examples of phytases that have been or are currently on the market, the list is not exhaustive and enzyme variants and manufacturing methods, including the production strain, are often updated and changed for various reasons. Also, although the donor organism is listed, a specific organism may have more than one phytase, such as the PhyA and PhyB phytases from Aspergillus niger (Ehrlich et al. 1993) with the
Aust. Poult. Sci. Symp. 2016.....27
161

Natuphos product derived from PhyA. Enzymes from certain donor organisms may also be modified through protein engineering to alter their sequences and therefore properties. As such, different products based on the same wild-type sequence, for example the E. coli phytase, will not necessarily all have the same performance.
Table 1 - Examples of commercial phytase products.
Company Trade Name Donor organism
Production organism Reference
BASF Natuphos Aspergillus niger
Aspergillus niger (EFSA 2006a)
DSM Nutritional Products
RONOZYME P, NP
Peniophora lycii
Aspergillus oryzae (EFSA 2010)
DSM Nutritional Products
RONOZYME HiPhos
Citrobacter braakii
Aspergillus oryzae (Guggenbuhl et al. 2012)
Adisseo Rovabio PHY
Penicillium funiculosum
Penicillium funiculosum
(EFSA 2007)
Danisco Animal Nutrition
Phyzyme XP
Escherichia coli
Schizosaccharomyces pombe
(EFSA 2006b, EUROPA 2007)
Huvepharma OptiPhos Escherichia coli
Pichia pastoris* (EFSA 2011)
AB Enzymes Quantum Escherichia coli
Pichia pastoris* (EFSA 2008)
AB Vista Quantum Blue
Escherichia coli
Trichoderma reesei (EFSA 2013)
The donor organism refers to the organism from which the gene encoding the phytase was derived. * Now renamed as Komagaetella pastoris.
In each case listed in Table 1, the production organism was genetically modified to generate suitably high levels of phytase, even where the production strain is listed as being the same as the donor organism. For example, for Rovabio PHY, the production organism is strain A1346 of P. funiculosum that was isolated from the soil and naturally produces three phosphatases, including a phytase, as well as beta-glucanase, xylanase and laminarinase. Strain A1346 was modified by mutagenesis and the gene encoding the phytase was isolated from this strain before being integrated onto the genome of the production strain A1346. An advantage of this approach is that the production organism was already known to produce and secrete this specific phytase. The disadvantage is that the strain had not previously been used for commercial production with associated data on safety and economic production and with no existing molecular biology tools for advanced genetic manipulations. In other cases, the gene encoding the phytase was transferred to an established protein production host such as P. pastoris that is well characterised, has genetic tools available and for which there are many examples of high yield production of a variety of recombinant proteins (Ahmad et al. 2014, Spohner et al. 2015). Using a well-characterised and understood expression host for which safe use is established and significant experience of industrial scale fermentations exist has clear advantages and each company will tend to favour their preferred production strains for this reason. A potential disadvantage is that not all genes and enzyme sequences are well matched to all production hosts due to issues with post-translational modification (such as disulfide bond formation and glycosylation) and secretory pathways for example. Nevertheless, unless there are significant issues, companies will tend to persist with their
Aust. Poult. Sci. Symp. 2016.....27
162

production organism of choice for operational reasons such as well-understood process engineering and the reduced risk of cross-contamination.
Regardless of the inherent specific activity of each phytase, the number of units of enzyme activity per unit mass of product can be manipulated during the enzyme formulation stage using more dilute or concentrated formulations. Enzyme stability on the other hand cannot be manipulated in this way although the enzyme can be added at larger doses to compensate for losses. One key stage for enzyme deactivation is during the feed pelleting process (Table 2). Thus significant research efforts are directed at obtaining enzyme formulations where as much of the enzyme activity as possible survives. Increased stability can either be achieved through protein engineering or through modifying the formulation of the enzyme product. For example, the OptiPhos CT formulation was more stable than the G formulation (Table 2). Where pelleting stability data are provided in The EFSA Journal reports, this usually refers to solid formulations, with liquid formulations generally intended for post pelleting application to avoid deactivation. The availability of liquid formulations and the data in Table 2 both indicate that increased stability phytases, which also retain high levels of activity at gut temperature, are still needed.
Table 2 - Pelleting stability of commercial phytase products.
Trade Name Formulation Pelleting Temp. (ºC)
Minimum residual activity (%)
Reference
RONOZYME P
Solid 70 80 90
100 86 80
(EFSA 2010)
Phyzyme XP Solid, 5000G∆ 80 82 (EFSA 2006c) OptiPhos Solid, G
Solid, CT*
65 75 85 65 75 85
77 78 48 83 89 85
(EFSA 2011)
Quantum Solid 80 90
87.5 70
(EFSA 2008)
∆ Formulated with wheat flour with calcium propionate and citric acid preservatives. Formulated with 23% solid enzyme concentrate, 1% pre-gelatinised starch and wheat flour. * Formulated with 30% solid enzyme concentrate, 1% pre-gelatinised starch, 13.5% monoglyceride, 13.5% palm oil, up to 20% corn grits and wheat flour.
In addition to pelleting stability, product registration documents also outline storage
stability at various temperatures (normally up to 40 ºC) over several months. Typically, enzyme preparations are stable at lower temperatures but many products lose significant activity if stored at or above 35 ºC.
Overall, the wide variety of testing methods and assay conditions used makes a direct comparison of enzyme properties reported in the literature problematic and interpretations should be treated with caution. A recent study however directly compared Ronozyme HiPhos, Ronozyme NP, as well as an E. coli and an A. niger phytase from Chinese suppliers to an A. niger phytase produced by the authors (Nielsen et al. 2015). The authors showed that Ronozyme NP (an optimised P. lycii phytase) was the most thermostable, followed by Ronozyme HiPhos. These enzymes however were the least stable in simulated gastric conditions of pH 2 in the presence of the protease pepsin. The authors also discussed the consistency of their results with previous studies, such as for pepsin resistance or pH stability (Igbasan et al. 2000), where different enzyme variants or changes in conditions (such as pH)
Aust. Poult. Sci. Symp. 2016.....27
163

may have been used and again concluded that the interpretation of results should be treated with caution. Whilst lab simulations of activity can be very useful guides to enzyme performance the only way to fully test efficacy is through enzyme formulation in feed pellets and subsequent feeding trials.
b) Optimising the E. coli phytase
There have been many attempts to improve the properties of the E. coli AppA phytase through mutagenesis. In a prominent example, scientists at Diversa Corporation (later Verenium and now part of BASF) produced an enzyme that was mutated at eight different amino acid positions to achieve increased thermostability (Garrett et al. 2004, Short et al. 2008). Mutagenesis of amino acids at each position in the protein sequence to every other amino acid (saturation mutagenesis) coupled with screening identified a range of beneficial mutations. These were then combined to produce a protein termed Phy9X that is also referred to as NOV9X in the patent literature (Lanahan et al. 2006) and Quantum phytase registration documents (EFSA 2008). Differential scanning colorimetry showed that the melting temperature was increased by 12 ºC to 75.7 ºC with a 3.5-fold increase in stability in simulated gastric fluid.
Recently, two additional mutations were added to Phy9X (Q258N and Q349N – note the numbering starts at different places in the protein between different papers) to introduce additional N-glycosylation sites when expressed in P. pastoris (Wang et al. 2015). These mutations resulted in an observed increase in melting temperature of 7.5 ºC compared to the wild-type enzyme, attributable to increases in α-helix content and surface hydrophobicity.
Increasing thermal stability through the incorporation of additional disulfide bonds is another common strategy in protein engineering and the basis of this effect has been examined using a range of phytases including that from C. braakii (Sanchez-Romero et al. 2013). The native E. coli phytase has four disulfide bonds and including three additional disulfide bonds increased the melting temperature by 8.5 ºC and shifted the optimal temperature for activity to 75 ºC (De Maria et al. 2013).
IV. CONCLUSIONS
There has been significant work over recent decades on the development and production of phytases for livestock feed applications. These enzymes have resulted in commercial products with significant benefits for producers. With the recent rapid advances in DNA sequencing technology, the availability of genomic data and the ready access to synthetic biology tools there exists an opportunity to develop phytases with further improved characteristics if these data and tools can be effectively harnessed.
REFERENCES
Ahmad M, Hirz M, Pichler H & Schwab H (2014) Applied Microbiology and Biotechnology 98: 5301-5317.
Brinch-Pedersen H, Sørensen LD & Holm PB (2002) Trends in Plant Science 7: 118-125. Damborsky J & Brezovsky J (2014) Current Opinion in Chemical Biology 19: 8-16. De Maria L, Skov LK & Skjoet M (2013) Thermostable Phytase Variants US 2013/0017185. Dehouck Y, Kwasigroch JM, Gilis D & Rooman M (2011) BMC Bioinformatics 12: 151. EFSA (2006) The EFSA Journal 369: 1-19. EFSA (2006) The EFSA Journal 350: 1-14. EFSA (2006) The EFSA Journal 404: 1-20. EFSA (2007) The EFSA Journal 471: 1-29.
Aust. Poult. Sci. Symp. 2016.....27
164

EFSA (2008) The EFSA Journal 627: 1-27. EFSA (2010) The EFSA Journal 8: 1862. EFSA (2011) The EFSA Journal 9: 2414. EFSA (2013) The EFSA Journal 11: 3433. Ehrlich KC, Montalbano BG, Mullaney EJ, Dischinger Jr. HC & Ullah AH (1993)
Biochemical and Biophysical Research Communications 195: 53-57. EUROPA (2007) Official Journal of the European Union L 175/5. Gagoski D, Mureev S, Giles N, Johnston W, Dahmer-Heath M, Skalamera D, Gonda TJ &
Alexandrov K (2015) Journal of Biotechnology 195: 1-7. Galperin MY, Makarova KS, Wolf YI & Koonin EV (2015) Nucleic Acids Research 43:
D261-269. Garrett JB, Kretz KA, O'Donoghue E, Kerovuo J, Kim W, Barton NR, Hazlewood GP, Short
JM, Robertson DE & Gray KA (2004) Applied and Environmental Microbiology 70: 3041-3046.
Giver L, Gershenson A, Freskgard PO & Arnold FH (1998) Proceedings of the National Acadademy of Science USA 95: 12809-12813.
Greiner R, Konietzny U & Jany KD (1993) Archives of Biochemistry and Biophysics 303: 107-113.
Guggenbuhl P, Torrallardona D, Cechova I, Wache Y, Nunes CS, Fru F & Broz J (2012) Journal of Animal Science Advances 2: 438-452.
Höhne M, Schätzle S, Jochens H, Robins K & Bornscheuer UT (2010) Nature Chemical Biology 6: 807-813.
Igbasan FA, Manner K, Miksch G, Borriss R, Farouk A & Simon O (2000) Archives of Animal Nutrition 53: 353-373.
Kornegay E (2001) Enzymes in farm animal nutrition 2001: 237-271. Kosuri S & Church GM (2014) Nature Methods 11: 499-507. Lanahan ML, Koepf E & Kretz K (2006) Microbially expressed thermotolerant phytase for
animal feed US 7,135,323 B2. Nielsen AV, Nyffenegger C & Meyer AS (2015) Journal of Agriculture and Food Chemistry
63: 943-950. Oshima Y (1997) Genes and Genetic Systems 72: 323-334. Pandey A, Szakacs G, Soccol CR, Rodriguez-Leon JA & Soccol VT (2001) Bioresource
Technology 77: 203-214. Pires DEV, Ascher DB & Blundell TL (2014) Nucleic Acids Research 42: W314-W319. Rohl CA, Strauss CEM, Misura KMS & Baker D (2004) Numerical Computer Methods, Pt D
383: 66-93. Sanchez-Romero I, Ariza A, Wilson KS, Skjot M, Vind J, De Maria L, Skov LK & Sanchez-
Ruiz JM (2013) PLoS One 8: e70013. Selle PH, Walker AR & Bryden WL (2003) Australian Journal of Experimental Agriculture
43: 475-479. Short JM, Gray KA, Barton NR, Garrett JB, O'Donoghue E & Robertson DE (2008) Phytases
and methods for making and using them US 7432098 B2. Spohner SC, Muller H, Quitmann H & Czermak P (2015) Journal of Biotechnology 202:
118-134. Tatusov RL, Koonin EV & Lipman DJ (1997) Science 278: 631-637. Thiltgen G & Goldstein RA (2012) PloS ONE 7: e46084. Wang X, Yao MZ, Yang BS, Fu YJ, Hu FY & Liang AH (2015) RSC Advances 5: 43863-
43872. Yao MZ, Zhang YH, Lu WL, Hu MQ, Wang W & Liang AH (2012) Journal of Applied
Microbiology 112: 1-14.
Aust. Poult. Sci. Symp. 2016.....27
165

THE ECONOMIC FEASIBILITY OF ELEVATED PHYTASE INCLUSIONS IN MAIZE-BASED BROILER DIETS
A.F. MOSS1, H.H. TRUONG1, D.J. CADOGAN2, G.G. PARTRIDGE, S.Y. LIU1
and P.H. SELLE1,3
Summary
The standard phytase inclusion is 500 FTU/kg; however, pursuant to its widespread acceptance, elevated inclusions are often implemented. Therefore, a feeding study to investigate responses generated by an elevated inclusion rate of 2000 FTU/kg phytase in maize-based diets for Ross 308 broiler chicks was completed. 2000 FTU/kg was found to enhance phosphoric and extra-phosphoric effects of phytase and improve growth performance with tangible reductions in feed ingredient costs to generate one kg of liveweight gain.
I. INTRODUCTION
Phytate is an anti-nutritive factor invariably present in all practical broiler diets. Thus, exogenous phytases are routinely added to modern poultry diets to degrade phytate and generate nutrient sparing effects. Inclusion of phytase in monogastric diets is now widely accepted and the practice of elevated phytase dosing is often applied. Therefore, it is relevant to evaluate graded doses of phytase to determine the magnitude of responses in broiler performance and the economic feasibility of this approach.
II. MATERIALS AND METHODS
Following characterisation of feedstuffs, positive control (PC) and negative control (NC) corn/soy diets were formulated as shown in Table 1. Nutrient specifications for energy density (12.98 to 12.70 MJ/kg), protein (214 to 210 g/kg), total phosphorus (7.0 to 5.4 g/kg) and calcium (8.0 to 6.7 g/kg) were reduced in NC diets resulting in a gross saving of $23.84 or 4.69% per tonne in feed ingredient costs. NC diets were supplemented with 0, 500 and 2000 FTU/kg phytase and compared with a non-supplemented PC diet. Each of the four dietary treatments were offered to 8 replicate cages (6 birds/cage), giving a total of 192 Ross 308 birds, from 7 to 28 days post-hatch. Growth performance, percentage toe ash, digestibility coefficients and disappearance rates of starch and protein (N) in four small intestinal segments were determined by standard procedures as outlined in Liu et al. (2014). Experimental data were analysed using the IBM® SPSS® Statistics 20 program (IBM Corporation. Somers, NY). The study complied with guidelines approved by the Animal Ethics Committee of The University of Sydney.
III. RESULTS
The effects of phytase inclusions in negative control maize-based broiler diets, relative to the non-supplemented positive control, on growth performance and percentage toe ash are shown in Table 2. Bird growth performance exceeded Ross 308 performance objectives.
1 Poultry Research Foundation, The University of Sydney, Camden 2570, NSW; [email protected] 2 Feedworks, Romsey 3434, VIC. 3 Danisco Animal Nutrition, Marlborough, UK.
Aust. Poult. Sci. Symp. 2016.....27
166

Table 1 - Dietary composition, nutrient specifications and feed ingredient costs of positive control (PC) and negative control (NC) diets.
Composition (g/kg) PC NC Nutrient specifications (g/kg)
PC NC
Maize Soybean meal Canola meal Sunflower oil Limestone Dicalcium phosphate Sodium chloride Sodium bicarbonate Lysine HCl Methionine Threonine Celite
Vitamin-mineral premix
537.3 296.0 75.0 35.0 9.1 15.5 2.1 2.5 2.2 2.5 0.8 20.0 2.0
581.6 280.0 75.0 14.0 10.7 6.9 2.1 2.3 2.3 2.3 0.8 20.0 2.0
AME (MJ/kg) Protein Starch Calcium Total phosphorus Phytate phosphorus Nonphytate phosphorus Sodium Lysine Methionine Threonine Tryptophan Cost of feed ingredients/ton1
12.98 213.7 359.1 8.0 7.0 2.9 4.1 1.8 12.2 5.6 8.5 2.4
$508.35
12.70 209.9 387.1 6.7 5.4 2.9 2.5 1.7 12.0 5.3 8.4 2.3
$484.51
1Prices as of 29/01/2015
Birds offered non-supplemented PC diets had 20.3% higher weight gains and 19.9% higher feed intakes than the Ross 308 objectives. There were significant treatment differences (P < 0.001) for weight gain as the transition from PC to NC diets compromised weight gain by 10.3% (1496 versus 1668 g/bird). However, phytase additions to the NC diets restored weight gains to levels supported by the PC diet. There were no significant differences between treatments for feed intake and FCR; although, the transition from PC to NC diets significantly compromised feed conversion efficiency by 6.57% (P < 0.05) on the basis of pairwise comparisons. Importantly, the inclusion of 2000 FTU/kg phytase in NC diets improved FCR by 6.87% (1.465 versus 1.573; P < 0.025), which was fractionally better than the PC diet. The transition from PC to NC diets significantly reduced toe ash by 11.5% but the addition of 2000 FTU/kg phytase to NC diets significantly increased bone mineralisation to a very similar extent (12.1%).
Table 2 - Effects of phytase inclusions in negative control maize-based broiler diets, relative to the non-
supplemented positive control, on growth performance and toe ash from 7 to 28 days post-hatch.
Treatment Weight Gain (g/bird)
Feed Intake (g/bird)
FCR (g/g)
Toe Ash (%)
PC NC NC + 500 NC + 2000
1668bc 1496a 1628b 1693c
2461 2353 2499 2477
1.476 1.573 1.537 1.465
12.36b 10.94a 11.01a 12.26b
0.1981 <0.001 0.574
SEM 19.716 44.396 0.0306 Significance (P=) P < 0.001 0.132 0.064 LSD (P < 0.05)
57.3
-
-
abc Means within columns not sharing common suffixes are significantly different at the 5% level of probability. Significance of pair-wise comparisons in FCR: PC versus NC P = 0.033; NC versus NC + 2000 P = 0.022.
Aust. Poult. Sci. Symp. 2016.....27
167

The effects of dietary treatments on starch and protein digestibility coefficients and accumulative disappearance rates from four small intestinal segments are shown in Table 3. Dietary treatments significantly increased starch digestibility in two segments and enhanced starch disappearance rates in all four segments. 500 FTU/kg phytase in NC diets significantly increased starch digestibility by 12.7% (0.879 versus 0.780) in the distal jejunum (DJ) and by 4.41% (0.947 versus 0.907) in the proximal ileum (PI). The addition of 500 FTU/kg phytase to NC diets significantly increased starch disappearance rates by 27.4% (32.11 versus 25.21 g/bird/day) in the proximal jejunum (PJ) and by 25.9, 16.6 and 14.6% in the DJ, PI and distal ileum (DI), respectively. The addition of 500 FTU/kg phytase to NC diets significantly influenced protein (N) digestibility by 6.08% (0.785 versus 0.740) and protein disappearance rates by 11.9% (19.27 versus 17.22 g/bird/day) in the PI.
IV. DISCUSSION Matrix values were attributed to phytase such that nutrient specifications of the PC diet were reduced to generate the NC diet, which resulted in lower feed ingredient cost. Without phytase addition, birds offered the NC diet experienced marked decreases in performance parameters including a 10.3% decrease in weight gain and an 11.5% reduction in toe ash. However, there were numerical improvements in weight gain and FCR for broilers offered the modified NC diet plus 2000 FTU/kg phytase in comparison to their counterparts offered standard PC diets. Additionally, following exogenous phytase addition toe ash and hence phosphorus bioavailability responded markedly to 2000 FTU/kg phytase in the NC diet, restoring bone mineralisation to that supported by the PC diet. The phosphorus sparing effects of phytase supplementation are undeniable and became increasingly evident at elevated concentrations as observed. While the phosphoric effect is valuable, it is not the only response to exogenous phytases.
In the present study extra-phosphoric starch/energy and protein responses were observed. Phytase significantly increased starch digestibility coefficients in two segments and starch disappearance rates in all four small intestinal segments. The likely genesis of these starch responses is enhanced glucose absorption via Na+-dependent transport systems driven by the sodium pump as phytase has been shown to enhance sodium pump functionality (Liu et al., 2008). Significant protein responses were confined to the proximal ileum in this study; whereas, protein responses are usually more robust than starch phytase responses.
The feed ingredient costs were $508.35 per tonne for the PC diet and $484.51 for the NC diet or $490.51 allowing for phytase addition. It may be deduced that 2000 FTU/kg phytase reduced feed costs from $0.750 to $0.719 to generate 1 kg liveweight gain. Thus on this basis 2000 FTU/kg phytase generated a net saving of 4.13% in feed ingredient costs as opposed to a 0.40% saving for 500 FTU/kg. In conclusion, using elevated doses of phytase generated improvements in growth performance sufficient to promote economic savings for sustainable chicken-meat production.
REFERENCES
Liu N, Ru YJ, Li FD & Cowieson AJ (2008) Journal of Animal Science 86: 3432-3439. Liu SY, Cadogan DJ, Peron A, Truong HH & Selle PH (2014) Animal Feed Science and
Technology 97: 164-175.
Aust. Poult. Sci. Symp. 2016.....27
168

Table 3 - Effects of phytase inclusions in negative control maize-based broiler diets, relative to the non-supplemented positive control, on apparent starch and protein (N) digestibility coefficients and accumulative starch and protein disappearance rates (g/bird/day) from four small intestinal
segments from 7 to 28 days post-hatch.
Starch Protein Treatment Proximal
Jejunum Distal
Jejunum Proximal
Ileum Distal Ileum
Proximal Jejunum
Distal Jejunum
Proximal Ileum
Distal Ileum
Digestibility Coefficient PC NC NC +500 NC + 2000 SEM Significance (P=) LSD Disappearance Rate PC NC NC +500 NC + 2000 SEM Significance (P=) LSD
0.663 0.637 0.730 0.754
0.0346 0.081
-
23.85a 25.21a 32.11b 30.86b
1.5499 0.001 4.490
0.836ab 0.780a 0.879b 0.871b
0.0194 0.002 0.0561
30.54a 30.80a 38.77b 36.06b
1.1157 <0.001 3.288
0.925ab 0.907a 0.947b 0.934b
0.0078 0.009 0.0227
33.75a 35.80b 41.76d 38.52c
0.6951 <0.001 2.014
0.950 0.945 0.970 0.958
0.0072 0.091
-
34.70a 37.32b 42.78d 39.55c
0.8082 <0.001 2.341
0.477 0.482 0.546 0.547
0.0316 0.227
-
11.56 11.22 13.32 13.56
0.8176 0.118
-
0.588 0.590 0.640 0.641
0.0274 0.335
-
14.24 13.72 15.71 15.86
0.7509 0.136
-
0.756ab 0.740a 0.785b 0.777b
0.0112 0.021 0.0324
18.32ab 17.22a 19.27b 19.12b
0.3970 0.004 1.150
0.824 0.817 0.843 0.823
0.0112 0.548
-
19.98 19.03 20.70 20.25
0.5051 0.144
-
abcd Means within columns not sharing common suffixes are significantly different at the 5% level of probability.
Aust. Poult. Sci. Symp. 2016.....27

PROTEIN AND ENERGY RATIOS INFLUENCE PERFORMANCE IN BROILER CHICKENS
S.Y. LIU1, D. RAUBENHEIMER2, P.H. SELLE1, R.M. GOUS3, G. HARGREAVE4,
S.J. SIMPSON2, D.J. CADOGAN5 and A.J. COWIESON1,6
Summary
The objective of this study was to measure the response of broiler chickens to dietary crude protein (CP): metabolisable energy (ME) ratios. Five diets based on maize, soybean meal and casein with different CP:ME ratios were offered to 120 male Ross 308 broiler chickens from 7 to 28 d post-hatch. Quadratic responses in the performance parameters measured indicated that feed intake increased as the CP:ME ratio declined and then decreased at the lowest CP:ME ratio and that weight gain and FCR reached a maximum and minimum, respectively, at a CP:ME ratio of 17.0 and 17.8 kg/MJ. N retention decreased with increasing CP:ME ratio. The decline in growth rate at the highest CP content was most likely due to an insufficiency of dietary energy.
I. INTRODUCTION
Despite the importance of nutrient availability in broiler diets, body weight gain in broiler chickens is predominantly determined by the amount of feed consumed. Both dietary energy density and protein concentrations have been reported to have an impact on feed intake and growth performance in broiler chickens. It is generally accepted that boilers offered high energy diets would have relatively lower feed intakes. Because protein is an important contributor to dietary energy, the objective of this study was to investigate the influence of ratios between protein and apparent metabolisable energy on growth performance and nutrient utilisations.
II. MATERIALS AND METHODS
Five diets based on maize and soybean meal were formulated to contain similar levels of effective energy in the order of 12.05 MJ/kg (Gous, 2010) but with both crude protein (CP) and metabolizable energy (ME) contents increasing such that the ratio of CP: ME increased throughout the series (Table 1). Diets were cold-pelleted and then crumbled. Each of the five feeds was offered to male Ross 308 broiler chicks in 4 cages (6 birds per cage), from 7 to 28 days post-hatch. Initial and final body weights were measured, feed intakes were recorded from which feed conversion ratios (FCR) were calculated. The incidence of dead or culled birds was recorded daily and their body weights used to adjust FCR. Total excreta were collected from day 25-27 for calculation of nutrient utilisation [AME, N retention, N-corrected AME (AMEn)] on a dry matter basis. Excreta were air-forced oven dried for 24 h at 80°C. The gross energy (GE) of diets and excreta were determined by bomb calorimetry using an adiabatic calorimeter (Parr 1281 bomb calorimeter, Parr Instruments Co., Moline, IL). Nitrogen contents of diets and excreta were determined using a N determinator (Leco Corporation, St Joseph, MI, USA). Appropriate regressions were fitted to the response data using JMP® 9.0.0 (SAS Institute Inc. JMP Software, Cary, NC).
1 Poultry Research Foundation, The University of Sydney, Camden, NSW 2570; [email protected] 2 Charles Perkins Centre, The University of Sydney, Sydney, NSW 2006. 3 University of KwaZulu-Natal, Pietermaritzburg, South Africa. 4 Baiada Poultry Pty Limited, PO Box 21, Pendle Hill, NSW 2145, Australia. 5 Feedworks, PO Box 369, Romsey, VIC 3434, Australia. 6 DSM Nutritional Products, Kaiseraugst, Switzerland.
Aust. Poult. Sci. Symp. 2016.....27
170

III. RESULTS The overall mortality from 7 to 28 days post-hatch was 3.33% which was not influenced by dietary treatments (P > 0.65). Growth performance and nutrient utilisation results are shown in Table 2. There were significant dietary influences on all growth performance and nutrient utilisation parameters. Average growth performance in the present study was superior to 2014 Ross 308 performance objectives by 10.1% (1526 versus 1386 g/bird, P = 0.012) in weight gain and by 8.0% (1.36 versus 1.48, P = 0.041) in feed conversion ratios by one sample t-test. It is noteworthy that birds offered diets 4 and 5 had a mean FCR of 1.150 from 7 - 28 d post-hatch. Figure 1 illustrates the quadratic relationships (P < 0.05) between CP:ME ratio and growth performance in broiler chickens from 7- 28 d post-hatch. Feed intake increased as the CP:ME ratio declined and then decreased at the lowest CP:ME ratio. N retention decreased with increasing CP:ME ratio.
Figure 1 - Quadratic effects of analysed dietary protein concentrations and measured AME ratios on feed intake, weight gain, feed conversion ratio and N retention.
IV. DISCUSSION
The experimental diets used in this study had similar fat concentrations with differences in energy density being derived from changes of dietary protein and starch concentrations. Although the ME content of the five feeds increased linearly across treatments they were all formulated to contain the same amount of effective energy (EE), thus this trial could be viewed either as a protein response trial at a constant EE or as a response to CP:ME ratio. Given that the amount of energy available to the bird for productive purposes is best described by EE (or net energy), these results might best be interpreted as a response to dietary protein.
y = -6.0357x2 + 175.08x + 820.38 R² = 0.374
1500
1600
1700
1800
1900
2000
2100
2200
2300
5 10 15 20 25
Feed
inta
ke (g
/kg)
Protein : AME ratios
y = -0.0949x2 + 1.7876x + 71.729 R² = 0.661
60
65
70
75
80
85
90
5 10 15 20 25
N re
tent
ion
(%)
Protein : AME ratios
y = -12.348x2 + 420.45x - 1785 R² = 0.913
800
1000
1200
1400
1600
1800
2000
5 10 15 20 25
wei
ght g
ain
(g/b
ird)
Protein : AME ratios
y = 0.0103x2 - 0.3675x + 4.3546 R² = 0.930
1
1.1
1.2
1.3
1.4
1.5
1.6
1.7
1.8
1.9
2
5 10 15 20 25
FCR
(g/g
)
Protein : AME ratios
Aust. Poult. Sci. Symp. 2016.....27
171
From 16 studies, Swennen et al. (2007) concluded that dietary protein concentrations were positively related to both weight gain and feed conversion efficiency and negatively related to body fat content. Indeed, in the present study, birds offered diets with low protein concentrations had significantly lower weight gains and feed intakes. The food intake theory of Emmans (1987) is based on the concept that birds eat to satisfy their requirement for the limiting nutrient in the feed, and this is evident in the linear increase in food intake observed in the study as the CP:ME ratio (or protein content) declines. Malheiros et al. (2003) compared growth performance of broiler chickens offered low protein, low fat or low carbohydrate diets and concluded that dietary protein concentrations had the most pronounced impact on growth performance. They found that chickens offered low protein diets had the lowest plasma T4 and uric acid levels, which indicated reduced protein breakdown and lower protein ingestion, but the highest plasma triglyceride levels, which was consistent with higher body fat deposition.
There were quadratic effects of CP:ME ratio on weight gain and FCR. The predicted maximum weight gain of 1794 g/bird and the minimum FCR of 1.08 g/g equated to a CP:ME ratio of 17.0 and 17.8, respectively. This suggests a balance between protein and energy utilization is required for efficient muscle protein deposition. It is supported by previous studies in the literature that showed that dietary protein concentrations are positively related to both weight gain and feed conversion efficiency; however, it is also possible that extremely high CP:ME ratios compromise growth performance because energy derived from glucose is required for digestion and absorption of nutrients and muscle protein deposition (Liu and Selle, 2015). Indeed, Kyriazakis and Emmans (1992) found that, at high dietary protein concentrations, protein retention in pigs depended on the rate of energy supply. It was evident in the present study that N retention decreased with increasing CP:ME ratios suggesting that the efficiency of N utilization was compromised when less energy was available in relation to protein, this being most likely to have caused the decrease in weight gain at the highest protein concentration.
In conclusion, it is certainly notable that birds offered diets 4 and 5 had a mean FCR of 1.150 from 7 to 28 d post-hatch. While this represents a 22.2% improvement in comparison to the current Ross 308 performance objective of 1.478. It also reveals the vast genetic potential of modern broiler genotypes. Thus diets with high CP:ME ratios exhibited superior feed conversion efficiency although, perhaps predictably, there were reductions in N retention. Nevertheless, consideration should be given to the balance of amino acids and the heat generated by catabolism of surplus protein when diets are formulated to contain extreme protein/amino acid levels (Morris et al., 1999). It is also likely that that the dietary energy density needs to exceed a critical ME:CP ratio in order to ensure the efficient utilisation of the dietary protein (Kyriazakis and Emmans, 1992). Obviously, the feasibility of using such high protein levels in practice requires economic assessments but the growth performance responses that can be generated by this strategy have been demonstrated.
REFERENCES
Emmans GC (1987) In: Computers in Animal Production (Occasional Publication No. 5. British Society of Animal Production) pp.103-110.
Gous RM (2010) Proceedings of the Australian Poultry Science Symposium 21: 36-43. Kyriazakis I & Emmans GC (1992) British Journal of Nutrition 68: 603-613. Liu SY & Selle PH (2015) Worlds Poultry Science Journal 71: 297-310. Malheiros RD, Moraes VMB, Collin A, Janssens GPJ, Decuypere E & Buyse J (2003) Nutrition
Research 23: 567-578. Morris TR, Gous RM & Fisher C (1999) Worlds Poultry Science Journal 55: 7-22. Swennen Q, Decuypere E & Buyse J (2007) Worlds Poultry Science Journal 63: 541-556.
Aust. Poult. Sci. Symp. 2016.....27
172

Table 1 - Diet compositions, calculated and analysed nutrient specifications in experimental diets for broiler chickens from 7-28 d post-hatch.
Diet (g/kg) 1 2 3 4 5 Diet (g/kg) 1 2 3 4 5 Maize 841 788 733 664 564 AME (MJ/kg) 13.13 13.25 13.36 13.53 13.82 Soybean meal 26 11 0 0 34 Calcium 9.0 9.0 9.0 9.0 9.0 Isolated soy protein 52 115 174 223 251 Av Phosphorus 4.5 4.5 4.5 4.5 4.5 Casein 0.0 0.0 1.8 15.5 59.0 Lysine1 7.3 10.4 14.0 17.0 20.0 Sunflower oil 6.7 8.8 10.8 13.3 16.6 Methionine 3.3 5.2 7.1 9.0 11.9 Limestone 9.4 9.2 9.0 9.0 9.4 Cysteine 2.4 2.8 3.3 3.7 4.3 Dicalcium phosphate 21.5 21.8 22.1 22.1 21.1 Threonine 4.9 7.0 9.1 12.0 14.0 Potassium bicarbonate 1.7 2.9 3.9 4.5 3.4 Tryptophan 1.2 1.7 2.2 2.8 3.7 Sodium bicarbonate 3.7 2.0 0.4 0.0 0.0 Valine 5.6 8.0 10.4 13.0 16.0 Choline chloride 60% 8.7 8.5 8.3 7.8 6.3 Arginine 7.7 11.0 14.3 18.0 21.0 L-lysine HCl 3.0 3.8 5.1 4.8 1.7 Isoleucine 5.0 7.2 9.3 12.0 14 DL-methionine 1.5 2.9 4.3 5.6 7.2 Sodium 1.6 1.6 1.6 1.9 2.3 L-threonine 0.9 1.6 2.3 3.5 2.8 Potassium 4.0 4.0 4.0 4.0 4.0 L-valine 0.3 0.9 1.4 1.6 0.5 Chloride 2.7 3.5 4.2 4.5 4.0 L-isoleucine 0.6 0.9 1.2 1.6 0.1 Analysed nutrient composition (g/kg as-is) L-arginine 0.8 0.9 1.1 1.7 1.0 Protein 137 181 226 268 355 Premix 2.0 2.0 2.0 2.0 2.0 Starch 605 460 420 447 359 Celite 20.0 20.0 20.0 20.0 20.0 Fat2 48.2 41.9 48.8 46.2 42.5
Dry matter 82.9 83.5 84.1 84.4 84.6 CP: ME 10.4 13.7 16.9 19.8 25.7
1Total amino acids; 2Soxhlet extraction
Table 2 - Effects of dietary treatment on growth performance [WG, weight gain (g/bird); FI, feed intake (g/bird); FCR, feed conversion ratio (g/g)] and nutrient utilisation [AME (as-is basis); AMEn, nitrogen-corrected AME (MJ/kg); N retention, nitrogen retention (%)].
Diet WG FI FCR AME AMEn N retention 1 998 1885 1.888 14.87 13.90 78.85 2 1543 2145 1.391 15.28 13.78 80.64 3 1675 2046 1.220 16.26 14.42 80.53 4 1726 2012 1.168 15.84 14.34 71.53 5 1688 1909 1.132 17.47 15.40 70.03
Quadratic regression R2 0.912 0.374 0.929 0.761 0.736 0.661 P-value <0.0001 0.019 <0.0001 <0.0001 <0.0001 <0.0001
1The ratios between analysed dietary protein concentrations (as-is) and formulated AME.
Aust. Poult. Sci. Symp. 2016.....27

PHYTATE DEGRADATION IN THE GIZZARD IS PIVOTAL TO PHYTASE RESPONSES IN BROILER CHICKENS
H.H. TRUONG1,2, S. YU3, A.F. MOSS1, S.Y. LIU1 and P.H. SELLE1
Summary
Positive control (PC) and negative control (NC) maize-based diets were supplemented with either 0 and 1000 or 0, 500 and 2000 FTU/kg Buttiauxilla phytase, respectively, and offered to broilers from 7 to 28 days post-hatch. Degradation of IP6 phytate was determined in five gastrointestinal segments (gizzard, proximal jejunum, distal jejunum, proximal ileum, distal ileum) using acid insoluble ash as the dietary marker. A phytate degradation coefficient of 0.955 was recorded in the gizzard of birds offered the NC + 2000 FTU/kg diet. Curiously, 0.527 phytate degradation was observed in non-supplemented NC diets, which suggests a net phytate degradation of 0.428 to exogenous phytase. Across all five treatments, however, gizzard phytate degradation coefficients were significantly correlated with weight gain and toe ash, which was not the case in four small intestinal segments. Therefore, this study demonstrates that phytate degradation in the gizzard is pivotal to the magnitude of responses generated by phytase.
I. INTRODUCTION
The capacity of exogenous phytases to hydrolyse phytate (IP6) and liberate P is established; nevertheless, precise clarification of this dephosphorylation is still required (Selle et al., 2015). A few studies have determined phytate degradation by exogenous phytases at the terminal ileum and on a total tract basis. However, the net phytate degradation reported in some of these studies appears ultra-conservative (Selle et al., 2012). These assays have effectively not recognised that exogenous phytase-induced phytate degradation takes place primarily in the crop and gizzard. Therefore in this study, phytate degradation was assessed in the gizzard and four small intestinal segments to determine the importance of sites and extents of phytate degradation along the gastrointestinal tract in relation to weight gain and toe ash, both indicative parameters of P status.
II. METHODOLOGY
The composition and specifications of the dietary treatments and the responses of broiler chicks to phytase supplementation in this study are reported in these Proceedings (Moss et al., 2015). The feeding study consisted of phytase-supplemented and non-supplemented maize-based dietary treatments with two levels of nutrient specifications. Both P and Ca concentrations were reduced in NC diets essentially by reducing dicalcium phosphate levels in NC diets. The diets were supplemented with 0, 500, 1000 or 2000 FTU/kg Buttiauxella phytase as shown in Table 1. Each dietary treatment was offered to eight replicate cages with six birds per cage. Diets were steam-pelleted at a conditioning temperature of 84°C and fed as crumbles. At day 28, all birds were weighed and euthanised and one toe from each bird was collected and pooled on a cage basis for determination of percentage toe ash. Digesta samples were taken in their entirety from the gizzard and four small intestinal segments [proximal jejunum (PJ), distal jejunum (DJ), proximal ileum (PI), distal ileum (DI)] and pooled for each
1Poultry Research Foundation within The University of Sydney, NSW, Australia; [email protected] 2 Poultry CRC, University of New England, Armidale NSW, Australia. 3 Enzyme R & D, Genencor, Danisco A/S, DK 8220 Brabrand, Aarhus, Denmark.
Aust. Poult. Sci. Symp. 2016.....27
174

cage. The extraction and determination of IP6 in these digesta samples by HPIC procedures has been described by Yu et al. (2012). Digesta and diet samples were agitated in HCl to extract IP6 and IP6 was detected using HPIC with the specified column (4 × 250 mm with a 4 × 50 mm pre-column; CarboPac Guard PA-100; Dionex, Sunnyvale, CA). Positive peaks were detected at 290 nm resulting from the formation of IP6-Fe3+-ClO4− complexes compared with standards. The apparent IP6 degradation coefficents in gizzard and four small intestinal sites were calculated from the following equation where acid insoluble ash (AIA) was the dietary marker:
IP6 degradation coefficient =
Experimental data were analysed as a one-way ANOVA of dietary treatments using the IBM® SPSS® Statistics 20 program (IBM Corporation. Somers, NY USA). Pearson correlations were obtained for IP6 degradation coefficients and relevant avian performance parameters.
III. RESULTS The effects of diet type and phytase supplementation on IP6 phytate degradation are shown in Table 1 where there were signicant differences (P < 0.001) between dietary treatments in all five gastrointestinal sites. In broilers offered PC diets 1000 FTU/kg phytase significantly increased phytate degradation from 0.552 to 0.931, in the gizzard which suggests a net phytate degradation of 0.379 by exogenous phytase. Similarly, there were significant increases in phytate degradation along the small intestine with net phytate degradations of 0.209, 0.509, 0.438 and 0.378, in the four segments respectively.
Table 1 - Effects of phytase inclusions in positive and negative control, maize-based broiler diets on apparent degradation/digestibility coefficients of IP6 phytate in the gizzard and four small intestinal
segments.
Treatment
Gizzard
Proximal jejunum
Distal jejunum
Proximal ileum
Distal ileum
PC PC + 1000 FTU/kg NC NC +500 FTU/kg NC + 2000 FTU/kg SEM Significance (P=) LSD (P < 0.05)
0.552a 0.931b 0.527a 0.850b 0.955b
0.0403
P < 0.001 0.1157
0.291a 0.500b 0.445b 0.479b 0.695c
0.0354
P < 0.001 0.1015
-0.036a 0.473c 0.308b 0.317b 0.615d
0.0461
P < 0.001 0.1323
0.085a 0.523c 0.455c 0.365b 0.679d
0.0274
P < 0.001 0.0786
0.108a 0.486b 0.461b 0.376b 0.657c
0.0500
P < 0.001 0.1435
abcd Means within columns not sharing common suffixes are significantly different at the 5% level of probability.
In broilers offered NC diets 2000 FTU/kg phytase significantly increased phytate degradation from 0.527 to 0.955, in the gizzard which suggests a net phytate degradation of 0.428. Again, there were significant increases in phytate degradation along the small intestine with net phytate degradations of 0.250, 0.307, 0.224 and 0.196, respectively. Interestingly, there was significantly greater phytate degradation along the small intestine in birds offered control NC diets in comparison to control PC diets; whereas, phytate degradation was nearly identical in the gizzard. Indeed, in PC control diets phytate degradation averaged 0.112 in the four segments as opposed to 0.417 in NC control diets; an increase by a factor of 3.72. Phytate degradation in broilers offered NC diets plus 500 FTU/kg phytase was robust in the gizzard but modest in the four small intestinal segments. Pearson correlations between IP6
[(IP6/AIA)diet – (IP6/AIA)digesta] (IP6/AIA)diet
Aust. Poult. Sci. Symp. 2016.....27
175

phytate degradation coefficients, toe ash and weight gain are shown in Table 2. Phytate degradation in the gizzard was significantly correlated with toe ash (r = 0.351, P < 0.03) and weight gain (r = 0.369, P < 0.025) but phytate degradation in four small intestinal segments was not significantly related to these parameters.
Table 2 - Pearson correlations between IP6 phytate degradation coefficients, percentage toe ash and weight gain from 7 to 28 days post hatch.
Toe ash Gain Gizzard PJ DJ PI DI Toe ash
Gain
Gizzard
PJ
DJ
PI
DI
1.00 0.482 0.001 0.351 0.026 0.040 0.809 -0.006 0.969 0.007 0.967 0.060 0.714
1.00
0.369 0.023 0.226 0.173 0.132 0.430 0.078 0.643 0.083 0.621
1.00
0.510 0.001 0.641
< 0.001 0.568
< 0.001 0.564
< 0.001
1.00
0.758 < 0.001 0.783
< 0.001 0.507 0.001
1.00
0.885 < 0.001 0.639
< 0.001
1.00
0.765 < 0.001
1.00
PJ: proximal jejunum, DJ: distal dejunum, PI: proximal ileum, DI: distal ileum
IV. DISCUSSION
On average, three phytase inclusions generated 91.2% IP6 phytate degradation in the gizzard based on dietary marker assessments. Similarly, in the Walk et al. (2014) study, 500 FTU/kg phytase inclusions in PC and NC maize-based diets degraded IP6 phytate by an average of 94.7%. Degradation was based on absolute concentrations of phytate in the gizzard as a marker was not used. However, in the present study 54.0% phytate degradation was observed in non-supplemented diets, for which there is not a straightforward rationale. Selle et al. (2003) reported that the addition of a proteolytic enzyme (papain) facilitated phytate extraction and analysis in lupins. This finding raises the possibility that the formation of protein-phytate complexes in the gizzard may have interfered with phytate extraction in non-supplemented diets. Clearly, protein-phytate complex formation would have been largely precluded in phytase supplemented diets.
Thus the 54.0% phytate degradation reported in non-supplemented diets is probably misleading and should be treated with caution as it is difficult to conceive how this degradation could have taken place. Nevertheless, the correlations in Table 2 are instructive as phytate degradation in the gizzard impacted on toe ash and weight gain which was not the case along the small intestine. The primary sites of phytate degradation by exogenous phytase are the gizzard and crop and this is pivotal to both the liberation of phytate-P and the prevention of protein-phytate complexes, the formation of which is favoured by the acidic pH of the gizzard and proventriculus. Protein-phytate complexes are almost certainly fundamental to the extra-phosphoric effects of phytase. Thus the average 91.2% IP6 phytate degradation in the gizzard generated by exogenous phytase is an important outcome. In an interesting discrepancy, phytate degradation averaged 11.2% in four small intestinal segments in the control PC diet but this increased to 41.7% in the control NC diet. The fundamental difference between PC and NC diets was the reduction in dicalcium phosphate from 15.5 to 6.9 g/kg, which translated to reductions in dietary levels of total P from 7.0 to 5.4 g/kg and Ca from 8.0 to 6.7 g/kg. Brush-border membrane mucosal phytase activity is present in chickens, its activity is maximal in the duodenum and progressively
Aust. Poult. Sci. Symp. 2016.....27
176

declines along the small intestine (Maenz and Classen, 1998). The likelihood is that higher P and Ca levels in PC diets impeded mucosal phytase activity and lower P and Ca levels in NC diets enhanced endogenous phytase activity. Lei and Stahl (2000) contended that phytase is more efficacious in diets with low levels of inorganic P because inorganic P, the hydrolysis product of phytate, strongly inhibits the catalytic activity of phytase. The profound effect of dietary Ca levels on mucosal phytase efficacy has been demonstrated by Tamim et al. (2004). Ca-phytate complexes become increasingly insoluble along the small intestine as pH 5.0 is exceeded; therefore, phytate is less readily degraded (Wise, 1983). Thus the real difference in phytate degradation along the small intestine between PC and NC control diets may be attributed to the combined impacts of P and Ca on mucosal phytase efficacy. Ostensibly, 2000 FTU/kg phytase in NC diets generated a net phytate degradation of 19.6% (0.657 – 0.461) in the distal ileum. However, a more realistic interpretation may be the impact of phytase addition coupled with the up-regulation of mucosal phytase activity (triggered by inadequate P levels) facilitated by reductions in dietary P and Ca levels generated a net phytate degradation of 54.9% (0.657 – 0.108). That is the difference in distal ileal phytate degradation coefficients between the non-supplemented PC diet and the NC + 2000 FTU/kg phytase diet. The diets in question contained 2.90 g/kg phytate-P so this 54.9% phytate degradation indicates an overall phytase-induced release of 1.59 g/kg P which is consistent with both the P reduction in NC diets in this study and P equivalence values claimed for bacterial phytases. Alternatively, 19.6% phytate degradation would generate 0.57 g/kg P, which does appear to be surprisingly low in comparison to values claimed for bacterial phytases.
REFERENCES
Lei XG & Stahl CH (2000) Journal of Applied Animal Research 17: 97-112. Maenz DD & Classen HL (1998) Poultry Science 77: 557-563. Moss AF, Truong HH, Cadogan DJ, Partridge GG, Liu SY & Selle PH (2015) Proceedings of
the Australian Poultry Science Symposium 27: (in these Proceedings). Selle PH, Walker AR & Bryden WL (2003) Australian Journal of Experimental
Agriculture 45: 475-479. Selle PH, Cowieson AJ, Cowieson NP & Ravindran V (2012) Nutrition Research Reviews
25: 1-17. Selle PH, Moss AF, Truong HH & Liu SY (2015) Proceedings of the Arkansas Nutrition
Conference (September 10 2015, Rogers, Arkansas, USA). Tamim NM, Angel R & Christman M (2004) Poultry Science 83: 1358-1367. Walk CL, Santos TT & Bedford MR (2014) Poultry Science 93: 1172-1177. Wise A (1983) Nutrition Abstracts and Reviews in Clinical Nutrition 53: 791-806. Yu S, Cowieson A, Gilbert C, Plumstead P & Dalsgaard S (2012) Journal of Animal Science
90: 1824-1832.
Aust. Poult. Sci. Symp. 2016.....27
177

INFLUENCE OF CALCIUM, AVAILABLE PHOSPHORUS AND PHYTASE ON BROILER GROWTH PERFORMANCE, FOOT ASH AND NUTRIENT RETENTION
C.L. WALK1, H. GRAHAM1 and M.R. BEDFORD1
Summary
This study was designed to identify the importance of the levels of calcium (0.80, 0.70, 0.60 or 0.50%) and phosphorus (0.50%) or the calcium to phosphorus ratio (2:1) on the response to phytase (500 FTU/kg) addition. There was no difference in body weight gain or feed conversion ratio in birds fed the test diets compared with birds fed the positive control. However, there are limits associated with feeding reduced calcium diets. For example, birds fed calcium below 0.60% with 0.30% available phosphorus had significantly reduced foot ash, regardless of the supplementation of inorganic phosphorus or phytase. Birds fed these same diets had the highest retention of calcium. Therefore, birds were able to increase calcium retention to ensure adequate growth, but not enough to improve foot ash comparable to the positive control. Conversely, when both calcium and available phosphorus was fed at 0.50%, calcium retention was not affected but phosphorus retention was significantly reduced. These results indicate the bird was able to reduce phosphorus retention out of synchrony with that of calcium in an effort to maintain an appropriate calcium and phosphorus balance in the body. In conclusion, performance and bone ash can be optimised in diets containing considerably less calcium and phosphorus than is current commercial practice. As the calcium levels fall, proportionately more available phosphorus (inorganic or phytase derived) is required for optimum performance and bone ash.
I. INTRODUCTION
Many factors influence the efficacy of a phytase in broiler diets but the most important are the dietary levels of phytate, calcium and phosphorus. When dietary calcium levels are increased, it not only reduces the availability of the phosphorus in the diet but also interferes with the ability of an added phytase to break down phytate and hence release phosphorus (Delezie et al., 2015; Fisher et al., 1992). More recent work has suggested that phosphorus may also reduce the efficacy of a phytase, presumably through end product inhibition (Zeller et al., 2015). Thus, when using a phytase there is a question as to whether the focus should be on the reduction of calcium, phosphorus or both to optimise response. This study was therefore designed to identify the relative importance of the levels of calcium and phosphorus or the calcium to phosphorus ratio on the response to phytase addition.
II. MATERIALS AND METHODS Seven hundred and fourteen male Cobb 500 broilers were obtained and housed in battery cages from hatch to 21 days post-hatch. Birds were allocated to 17 experimental diets with six birds per pen and seven replicate pens per experimental diet. The experimental diets were a positive control diet formulated to contain 1.0% calcium and 0.50% available phosphorus. No phytase was included in the positive control. The remaining 16 diets contained 0.80, 0.70, 0.60 or 0.50% calcium and available phosphorus at 0.50% or formulated to give a 2:1 calcium to available phosphorus ratio. Each diet contained 0 or 500 FTU/kg of phytase (Quantum Blue, AB Vista, UK).
1 AB Vista, Marlborough, UK; [email protected]
Aust. Poult. Sci. Symp. 2016.....27
178

Diets were fed in crumble form, composed of corn and soybean meal and were formulated to contain 22% crude protein, 3060 kcal/kg metabolisable energy, 1.22% digestible lysine and 0.90% digestible methionine and cysteine. Calcium in the diets was supplied from limestone or mono-calcium phosphate. Feed and water were provided ad libitum.
Birds and feed were weighed at the start of the experiment and again on day 21. Feed conversion ratio was calculated and adjusted for mortality. Excreta was collected daily from day 19 to 21 and pooled for determination of mineral retention. On day 21, two birds per pen of average body weight were euthanised and feet were collected for determination of foot ash.
Data were analysed using JMP Pro v12 using the fit model platform. The model included treatment and replicate pen. Significant means were separated using Dunnett’s test to compare each of the treatment means with the positive control. Significance was accepted at P < 0.05.
III. RESULTS AND DISCUSSION
Analysed calcium, total phosphorus and phytase in the diets were within 10, 8 and 2% of the formulated values, respectively. Overall mortality was 1.3% and not associated with experimental diets (data not shown). Feed intake was not influenced by diet (P = 0.31; data not shown). Body weight gain (P < 0.05; Table 1) and feed conversion ratio (P < 0.05; data not shown) were influenced by diet, but not significantly different than the positive control according to Dunnett’s test for multiple one-way comparisons. Foot ash (P < 0.05; Table 1) was influenced by diet; birds fed 0.60% calcium and 0.30% available phosphorus in the absence of phytase or birds fed 0.50% calcium and 0.25% available phosphorus without or with phytase had significantly lower foot ash than birds fed the positive control.
Previous studies have reported no effect of feeding 0.60% calcium and 0.25% available phosphorus on broiler performance in the presence or absence of phytase (Walk et al., 2012a). However, tibia ash was significantly reduced in birds fed the diets with 0.60% calcium (Walk et al., 2012a) and similar results were reported in the current trial when calcium was fed at 0.50% or 0.60% in the absence of phytase. The results indicate that reliance on growth alone may result in choice of calcium, phosphorus and phytase levels which are not optimal for bone ash. Calcium and phosphorus are the most abundant minerals in the body, with the majority stored in the bones. Thus bone ash should also be considered when evaluating calcium and phosphorus in broiler diets without or with the inclusion of phytase.
The current results also suggest dietary calcium may be reduced to 0.60% as long as available phosphorus is fed at requirement (i.e. 0.50%, which results in a very narrow calcium to phosphorus ratio), either with inorganic phosphorus supplementation or with the inclusion of phytase. This has been previously reported in broilers fed a highly soluble source of calcium (Walk et al., 2012b) or in broilers fed limestone with phytase at 500 or 5000 FTU/kg (Walk et al., 2012a). However, there are limits associated with feeding reduced calcium diets. For example, in the present study, when calcium was offered below 0.60% in diets with 0.30% available phosphorus, foot ash was significantly reduced, regardless of the supplementation of inorganic phosphorus or phytase. Birds fed these same diets had the highest retention of calcium (Table 2). Therefore, the birds were able to increase calcium retention to ensure adequate growth, but not enough to improve foot ash comparable to the positive control. Conversely, when both calcium and available phosphorus was fed at 0.50%, calcium retention was not affected but phosphorus retention was significantly reduced (Table 2). These results are interesting and may indicate the bird was able to reduce phosphorus
Aust. Poult. Sci. Symp. 2016.....27
179

retention out of synchrony with that of calcium in an effort to maintain an appropriate calcium and phosphorus balance in the body. Calcium concentration and to a lesser extent phosphorus, are tightly regulated in the plasma, which influence changes in the digestibility of calcium and phosphorus from the intestinal lumen (Proszkowiec-Weglarz and Angel, 2013).
In conclusion, these data suggest that performance and bone ash can be optimised in diets containing considerably less calcium and phosphorus than is current commercial practice. Strict adherence to the 2:1 calcium to available phosphorus ratio becomes less tenable (especially for bone ash) as the calcium and phosphorus levels are reduced. The data suggest proportionately more available phosphorus is required as the calcium levels fall if optimum performance and bone ash are to be maintained.
REFERENCES
Delezie E, Bierman K, Nollet L & Maertens L (2015) Journal of Applied Poultry Research 24: 115-126.
Fisher H (1992) Nutrition Reviews 50: 170-171. Proszkowiec-Weglarz M & Angel R (2013) Journal of Applied Poultry Research 22: 609-
627. Walk CL, Bedford MR & McElroy AP (2012) Poultry Science 91: 1371-1378. Walk CL, Addo-Chidie EK, Bedford MR & Adeola O (2012) Poultry Science 91: 2255-2263. Zeller E, Schollenberger M, Witzig M, Shastak Y, Kuhn I, Hoelzle E & Rodehutscord M
(2015) Poultry Science 94: 1018-1025.
Aust. Poult. Sci. Symp. 2016.....27
180
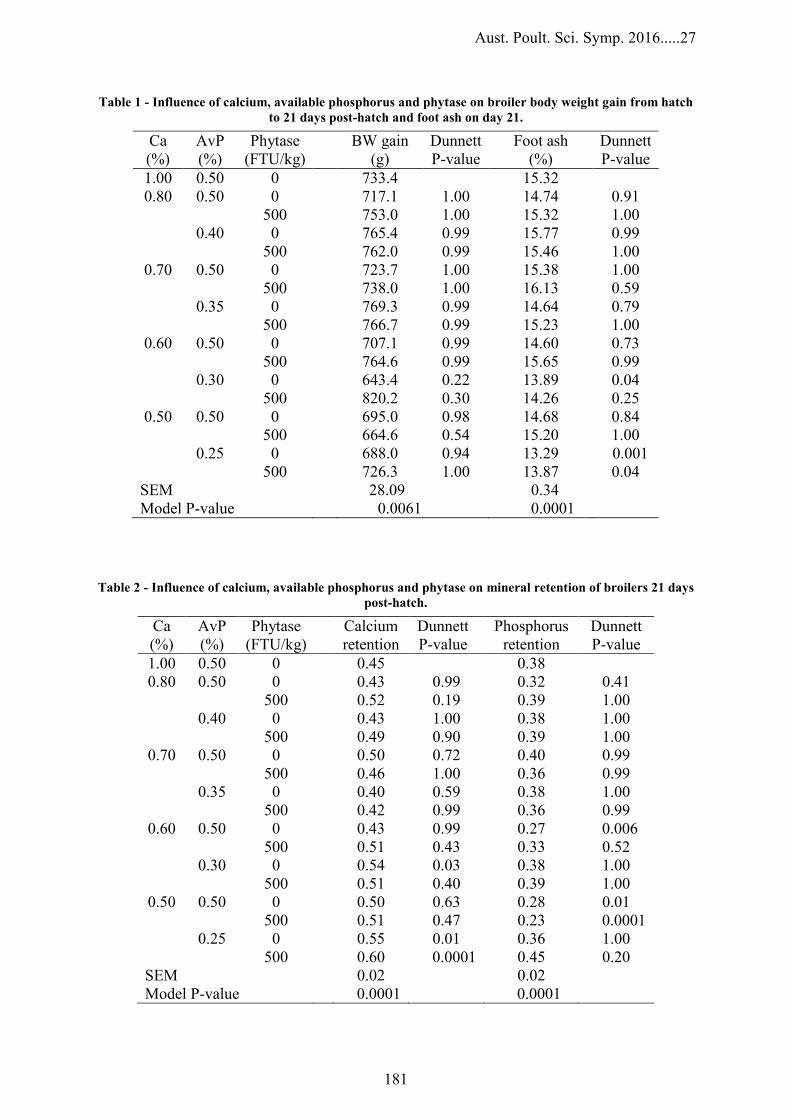
Table 1 - Influence of calcium, available phosphorus and phytase on broiler body weight gain from hatch to 21 days post-hatch and foot ash on day 21.
Ca (%)
AvP (%)
Phytase (FTU/kg)
BW gain (g)
Dunnett P-value
Foot ash (%)
Dunnett P-value
1.00 0.50 0 733.4 15.32 0.80 0.50 0 717.1 1.00 14.74 0.91
500 753.0 1.00 15.32 1.00 0.40 0 765.4 0.99 15.77 0.99
500 762.0 0.99 15.46 1.00 0.70 0.50 0 723.7 1.00 15.38 1.00
500 738.0 1.00 16.13 0.59 0.35 0 769.3 0.99 14.64 0.79
500 766.7 0.99 15.23 1.00 0.60 0.50 0 707.1 0.99 14.60 0.73
500 764.6 0.99 15.65 0.99 0.30 0 643.4 0.22 13.89 0.04
500 820.2 0.30 14.26 0.25 0.50 0.50 0 695.0 0.98 14.68 0.84
500 664.6 0.54 15.20 1.00 0.25 0 688.0 0.94 13.29 0.001
500 726.3 1.00 13.87 0.04 SEM 28.09 0.34 Model P-value 0.0061 0.0001
Table 2 - Influence of calcium, available phosphorus and phytase on mineral retention of broilers 21 days post-hatch.
Ca (%)
AvP (%)
Phytase (FTU/kg)
Calcium retention
Dunnett P-value
Phosphorus retention
Dunnett P-value
1.00 0.50 0 0.45 0.38 0.80 0.50 0 0.43 0.99 0.32 0.41
500 0.52 0.19 0.39 1.00 0.40 0 0.43 1.00 0.38 1.00
500 0.49 0.90 0.39 1.00 0.70 0.50 0 0.50 0.72 0.40 0.99
500 0.46 1.00 0.36 0.99 0.35 0 0.40 0.59 0.38 1.00
500 0.42 0.99 0.36 0.99 0.60 0.50 0 0.43 0.99 0.27 0.006
500 0.51 0.43 0.33 0.52 0.30 0 0.54 0.03 0.38 1.00
500 0.51 0.40 0.39 1.00 0.50 0.50 0 0.50 0.63 0.28 0.01
500 0.51 0.47 0.23 0.0001 0.25 0 0.55 0.01 0.36 1.00
500 0.60 0.0001 0.45 0.20 SEM 0.02 0.02 Model P-value 0.0001 0.0001
Aust. Poult. Sci. Symp. 2016.....27
181

IMPACTS OF DIETARY CALCIUM, PHYTATE AND NON-PHYTATE PHOSPHORUS CONCENTRATIONS, WITHOUT AND WITH PHYTASE, ON MYO-INOSITOL
HEXAPHOSPHATE (IP6) DEGRADATION IN BROILERS
W. LI1 and R. ANGEL2
Summary
The experiment was designed to determine the impacts of dietary calcium (Ca), phytate phosphorus and non-phytate phosphorus on myo-inositol hexaphosphate (IP6) degradation, in the presence and absence of phytase in broiler birds. The experiment was a 2×2×2×3 randomized block design with two Ca (0.7 and 1.0% from limestone), two phytate phosphorus (0.23 and 0.34%), two non-phytate phosphorus (0.28 and 0.45%, from mono-calcium phosphate) concentrations and three phytase inclusions (0, 500 and 1000 FTU/kg Butiauxella sp., phytase) resulting in a total of 24 treatments. Each treatment had 2 blocks with 3 replicate pens per block and 10 birds per pen. Broiler chicks were raised in floor pens and fed a commercial type starter diet from hatch to 10 d of age. At 11 d of age, birds were moved to battery cages and the experimental diets (mash) were offered ad lib for two days (11 to 13 d of age). Digesta samples from the crop, proventriculus plus gizzard and ileum were collected at 13 d of age. The IP6 concentrations were determined in all segments, whereas digestibility was only calculated in ileal samples. Despite the interactions observed between phytase and other dietary factors, decreases in IP6 concentration (crop, proventriculus plus gizzard) and increases in ileal IP6 digestibility were seen as a result of phytase inclusion (P < 0.05). On average, phytase at 1000 FTU/kg reduced IP6 concentration by 50% in the crop. IP6 degradation rate was up to 79% (62% above control) with 500 FTU/kg phytase and 91.5% (73% above control) with 1000 FTU/kg phytase at ileal level. In conclusion, adding phytase improved IP6 degradation but the degree of impact was dependent on dietary factors.
I. INTRODUCTION Dietary inclusion of microbial phytase has become an increasingly accepted practice to enhance phytate phosphorus utilisation which is poorly available to poultry offered practical diets (Amerah et al., 2014). The effectiveness of phytase is usually determined under phosphorus or both calcium and phosphorus deficient specifications. Phytase efficacy in terms of increasing available or digestible P and/or Ca are often determined without considering the impact of other dietary factors. Ravindran et al. (1995) reported that phytase was less effective in improving P utilisation when birds were offered diets with adequate non-phytate phosphorus as compared to those offered non-phytate phosphorus deficient diets. However, the implications of the potential interactions between calcium, non-phytate phosphorus, phytate phosphorus and phytase concentrations on phytate utilisation are not clearly understood.
Among the majority of the current commercial phytases, pH optima for maximum activity is between 3 and 5 (Brejnholt et al., 2011), suggesting that the upper segments of the gastrointestinal tract (GIT) namely the proventriculus (Prov), gizzard (Giz) and possibly the crop are the primary active sites for phytase activity. In addition, in vitro studies have demonstrated that phytate precipitates with Ca at a pH higher than 4 (Jackman and Black, 1951; Nolan et al., 1987; Tamim et al., 2004) resulting in decreased de-phosphorylation of
1 Danisco Animal Nutrition, DuPont Industrial Biosciences, Marlborough, UK; [email protected] 2 Department of Animal and Avian Sciences, University of Maryland, College Park, USA; [email protected]
Aust. Poult. Sci. Symp. 2016.....27
182

phytate by phytase. This highlights the importance of phytate degradation in the more acidic upper portions of the GIT in the presence of exogenous phytase and the potential implications in phytate phosphorus digestion and absorption in the lower gut. Although several studies published recently investigated IP6 degradation in different segments of the GIT, dietary impacts of calcium, phytate and non-phytate phosphorus concentrations are rarely mentioned. Therefore, the objectives of this study were to determine the impacts of dietary calcium, phytate and non-phytate phosphorus concentrations in the presence and absence of phytase on 1) IP6 concentrations in the crop, Prov plus Giz, and ileum; and 2) the apparent IP6 digestibility up to the distal ileum.
II. MATERIALS AND METHODS
The experiment was conducted twice (block) in time with three replicates (10 birds/replicate) of each treatment represented in each block (n=6). Birds were raised in floor pens and fed a commercial starter diet formulated to meet or exceed all NRC (1994) recommendations until 10 days of age. On day 11, birds were individually weighed, grouped to minimize within and between group weight variations and placed into battery pens which were preassigned to treatments. On day 13, all birds in a pen were euthanized by cervical dislocation and contents from crop, Prov plus Giz, and distal ileum were collected from each bird.
Two corn and SBM mash basal diets with either low or high phytate phosphorus were formulated based on analysed ingredient compositions, mixed and analysed for dry matter, macro-minerals, protein, ether extract and amino acids. Meat meal (5.7%) and rice bran (6.0%) were included in the low and high phytate phosphorus basal diets, respectively, to achieve the desired differences in phytate phosphorus concentration while maintaining similar concentrations of other nutrients. Based on analysed calcium and phosphorus concentrations in the basal diets, pre-analysed limestone and mono-calcium phosphate were added to achieve desired calcium and non-phytate phosphorus concentrations in treatment diets. Basal diets containing either low or high phytate phosphorus were included at 96.7% in the final diets, titanium dioxide was added at 0.3% as the inert marker and silicon dioxide was used as a filler to achieve 100%.
The experiment was a 2×2×2×3 randomized block design with two calcium (0.7 and 1.0%), two phytate phosphorus (0.23 and 0.34%), two non-phytate phosphorus (0.28 and 0.45%) and three phytase (0, 500 and 1000 FTU/kg) resulting in a total of 24 treatments. For each diet without phytase, a 6-phytase (Buttiauxella sp.) was added on top, at either 500 or 1000 FTU/kg to one of the three lots of the treatment and mixed. The starter and treatment diets were fed as mash throughout the trial. Data were analysed as a randomized complete block design using SAS. Tukey’s test adjustment was applied in all pair-wise comparisons. Significance was declared at P < 0.05.
III. RESULTS AND DISCUSSION
Decreased IP6 concentrations in all three segments of GIT and increased ileal IP6 disappearance were seen with phytase inclusion regardless of diet Ca, non-phytate phosphorus or phytate phosphorus concentrations (Table 1; P < 0.05). Increasing phytase inclusions improved IP6 degradation rate, addition of 500 and 1000 FTU/kg phytase degraded up to 79% (62% above control) and 91.5% (73% above control) IP6 respectively at the ileal level. Despite the interaction between phytate phosphorus and phytase (Table 1, P < 0.05), crop IP6 concentration was significantly reduced by an average of 53 and 46% with 1000 FTU phytase/kg at 0.23 and 0.34% phytate phosphorus, respectively (P < 0.05). Dietary Ca had a significant impact on IP6 degradation. Across all non-phytate phosphorus, phytate phosphorus and phytase concentrations, increasing Ca from 0.7 to 1.0% resulted in 7%
Aust. Poult. Sci. Symp. 2016.....27
183

increase in crop IP6 concentration (0.530 vs. 0.497; P < 0.05). Crop IP6 concentration was not affected by non-phytate phosphorus concentrations (P > 0.05). Prov plus Giz IP6 concentration was affected by non-phytate phosphorus, phytate phosphorus and phytase. There was an interaction between Ca and non-phytate phosphorus on Prov plus Giz IP6 concentration, where 14% higher IP6 concentration was seen in birds fed 0.45% than 0.28% non-phytate phosphorus diets at 1.0% Ca (P < 0.05). Ileal IP6 disappearance was 9% lower when diet non-phytate phosphorus increased from 0.28 to 0.45% with 500 FTU phytase/kg inclusion, but this reduction in IP6 disappearance was not seen when phytase dose was increased to 1000 FTU /kg. Recently, Zeller et al. (2015) also reported a similar interaction between added non-phytate phosphorus and phytase inclusion level, where adding non-phytate phosphorus from mono-calcium phosphate (0.09% non-phytate phosphorus) in the presence of 500 FTU of an E.coli phytase/kg resulted in a lesser degree of IP6 degradation in the ileum but added non-phytate phosphorus had no impact on IP6 degradation when phytase was increased to 12500 FTU/kg. Results from the present sudy and that of Zeller et al. (2015) support the concept that the impact of non-phytate phosphorus on phytate degradation is dependent on phytase inclusion levels. In conclusion, Buttiauxella phytase at 500 and 1000 FTU/kg improved IP6 degradation by up to 62 and 73 percentage points above respective controls, indicating a high phytase efficacy. IP6 degradation rate was associated with dietary factors, reducing dietary non-phytate phosphorus and Ca concentrations can have a positive effect on IP6 degradation in the presence of exogenous phytase.
REFERENCES
Amerah AM, Plumstead PW, Barnard LP & Kumar A (2014) Poultry Science 93: 906-915. Brejnholt SM, Dionisio G, Glitsoe V, Skov LK & Brinch-Pedersen H (2011) Journal of the
Science of Food and Agriculture 91: 1398-1405. Cowieson AJ, Acamovic T & Bedford MR (2006) Poultry Science 85: 878-885. Dersjant-Li Y, Awati A, Schulze H & Partridge G (2014) Journal of the Science of Food and
Agriculture 95: 878-896. Grynspan F & Cheryan M (1989) Journal of the American Oil Chemists' Society 66: 93-97. Jackman RH & Black CA (1951) Soil Science 72: 179-186. Menezes-Blackburn D, Gabler S & Greiner R (2015) Journal of Agricultural and Food
Chemistry 63: 6142-6149. Nolan KB, Duffin PA & McWeeney DJ (1987) Journal of the Science of Food and
Agriculture 40: 79-85. Ravindran V, Bryden WL & Kornegay ET (1995) Poultry and Avian Biology Reviews 6:
125-143. Rutherfurd SM, Chung TK, Morel PC & Moughan PJ (2004) Poultry Science 83: 61-68. Tamim NM, Angel R & Christman M (2004) Poultry Science 83: 1358-1413. Zeller E, Schollenberger M, Kühn I & Rodehutscord M (2015) Journal of Nutritional Science
4: 1-12.
Aust. Poult. Sci. Symp. 2016.....27
184

Table 1 - Effects of dietary calcium (Ca), phytate phosphorus (PP), non-phytate phosphorus (nPP) without and with exogenous phytase on inositol IP6 concentrations and digestibility in different
gastrointestinal segments of birds offered experimental diets from 11 to 13 d of age1.
Ca %
PP %
nPP %
Phytase FTU/kg
IP6 concentration, % of digesta content Ileal IP6
disappearance, %
Crop Prov plus Giz 0.70 0.23 0.28 0 0.584bc 0.323abc 18.4e 0.70 0.34 0.28 0 0.819a 0.361ab 26.1e 0.70 0.23 0.45 0 0.577bc 0.303abcd 32.0e 0.70 0.34 0.45 0 0.842a 0.386a 26.4e 1.00 0.23 0.28 0 0.565bc 0.326abc 16.7e 1.00 0.34 0.28 0 0.881a 0.369ab 20.0e 1.00 0.23 0.45 0 0.630b 0.346ab 30.7e 1.00 0.34 0.45 0 0.874a 0.369ab 26.1e 0.70 0.23 0.28 500 0.345fgh 0.191cdefg 78.0abc 0.70 0.34 0.28 500 0.550bcd 0.250bcdef 71.0bcd 0.70 0.23 0.45 500 0.371efhg 0.173defg 76.6abc 0.70 0.34 0.45 500 0.497bcdef 0.196cdefg 66.2cd 1.00 0.23 0.28 500 0.330fgh 0.157ef 78.8abc 1.00 0.34 0.28 500 0.556bcd 0.168efg 66.3cd 1.00 0.23 0.45 500 0.379defgh 0.152efg 67.9cd 1.00 0.34 0.45 500 0.562bc 0.267abcde 57.6d 0.70 0.23 0.28 1000 0.206h 0.111g 91.5a 0.70 0.34 0.28 1000 0.452cdefg 0.132fg 87.7a 0.70 0.23 0.45 1000 0.286gh 0.123fg 91.4a 0.70 0.34 0.45 1000 0.440cdefg 0.135fg 82.1abc 1.00 0.23 0.28 1000 0.303gh 0.127fg 90.4a 1.00 0.34 0.28 1000 0.430cdefg 0.153efg 75.4abc 1.00 0.23 0.45 1000 0.321fgh 0.163efg 84.1ab 1.00 0.34 0.45 1000 0.533bcde 0.185cdefg 76.3b SEM 0.033 0.024 3.2 P-values <0.01 <0.01 <0.01 Main effect means Ca, % 0.7 0.497b -- 62.3a 1.0 0.530a -- 57.5b nPP, % 0.23 0.502 -- -- 0.34 0.526 -- -- PP, % 0.28 -- 0.208b -- 0.45 -- 0.248a -- Phytase,FTU/kg 0 -- 0.348c -- 500 -- 0.194b -- 1000 -- 0.141a -- Main effects and interaction P-values1 Ca 0.02 0.44 <0.01 nPP 0.08 0.30 0.86 PP <0.01 <0.01 <0.01 Phytase <0.01 <0.01 <0.01 Ca×nPP 0.28 0.05 0.65 Ca×PP 0.66 0.99 0.22 Ca×Phytase 0.58 0.15 0.38 nPP×PP 0.30 0.54 0.17 nPP×Phytase 0.47 0.78 <0.01 PP×Phytase 0.02 0.39 0.002
13 or 4-way interactions were not significant. a-l Means within a column with different superscript letters differ (P < 0.05).
Aust. Poult. Sci. Symp. 2016.....27
185

SUPER-DOSE LEVELS OF PROTEASE AND PHYTASE ENABLE UTILIZATION OF RAW SOYBEAN MEALS IN BROILER DIETS
M.M. ERDAW1,2, R.A. PEREZ-MALDONADO3, M.M. BHUIYAN1 and P.A. IJI1
Summary
A 3 x 3 +1 study was conducted to assess the super-dosing effect of protease in combination with various phytase levels in broiler diets containing moderate levels of raw full-fat soybean meal. Full-fat raw soybean meal (RSBM) replaced 25 % commercial SBM in the diet. A diet containing no RSBM or protease enzyme was used as control. The average trypsin inhibitor (TI) content of the diet containing RSBM was around 10193.4 TIU/kg. Protease was supplemented at 0, 200 or 400 mg/kg diet while phytase was included at 1000, 2000 or 3000 FYT/kg. During the starter period (1-10 d), increasing supplementation of microbial protease significantly (P < 0.05) improved bird feed intake (FI). Increasing inclusion rate of phytase in diets also improved (P < 0.05) FI. The FI of birds fed on the control group was the highest (P < 0.01) during 1-10 d. The body weight gain (BWG) of birds was also improved (P < 0.05) due to supplementation with protease in the starter period. At 24 d BWG was also improved (P < 0.01) by phytase supplementation. Except during the starter period when BWG tended (P = 0.06) to increase, the interactions between protease and phytase had no effects on FI and FCR in all assessed periods. Adding protease did not significantly (P > 0.05) improve the yields of meat parts but thigh weight was increased (P < 0. 05) as a result of phytase supplementation. Increasing protease enzyme from 0 to 400 ppm reduced the weight of both the pancreas (P < 0.001) and duodenum (P < 0.05). This research indicates that RSBM could have the potential to replace some commercial SBM in broiler diets when supplemented with protease and phytase. A full economic analysis will need to be completed prior to a final recommendation.
I. INTRODUCTION Commercial soybean meal (SBM) is generally expensive due to its position as the premier vegetable protein ingredient for livestock. About 80 % of the world’s soybeans are produced in the USA, Brazil and Argentina, which are also the major suppliers of SBM. There are pockets of soybean production in other parts of the world, where the technologies to further process the beans is lacking. In the latter regions, the beans are either heat-treated on a small scale prior to feeding or fed as raw. Animal productivity on diets containing raw soybean meal (RSBM) is negatively affected by antinutritional factors (ANF), particularly protease inhibitors (Chen et al., 2013; Faruk et al., 2013; Erdaw et al, 2015a). Uncontrolled processing could result into under- or over-heating, both of which reduce the nutritional value of SBM for birds (Perilla et al., 1997). The development of novel microbial enzymes particularly exogenous proteases to alleviate this mentioned ANF impaired performance requires more investigation. Exogenous enzymes offers an opportunity for the exploration of improving RSBM in poultry feeding, deliberately to reduce feed cost or reduce ANF effect due to lack of processed SBM. Supplementing diets with protease derived from Nocardiopsis prasina in which RSBM replaced commercial SBM at up to 20 % has been shown to support satisfactory bird growth to near similar level as feeding the control diet without RSBM (Faruk et al., 2013; Erdaw et al., 2015b). The objective of the current research was to assess
1 School of Environmental and Rural Sciences, University of New England, Australia; [email protected] 2 DSM Nutritional Products, 30 Pasir Panjang road #13-31, 117440 , Singapore. 3 Ethiopian Institute of Agricultural Research, Debre-Zeit Centre, Ethiopia.
Aust. Poult. Sci. Symp. 2016.....27
186

the benefits of super-dosing novel exogenous protease and phytase enzymes in broiler diets containing a higher level of RSBM.
II. MATERIALS AND METHODS The experiment was a 3 x 3 + 1 factorial design involving three levels of protease (0, 200 or 400 mg/kg diet) and three levels of phytase (1000, 2000 or 3000 FYT/kg) (DSM Nutritional Products, Singapore) in diets in which RSBM replaced commercial SBM at 25 %. All diets contained a back ground phytase supplementation equivalent to 1000 FYT/kg feed. The control diet group was RSBM-free and was not supplemented with protease. Each of the 10 dietary treatments was replicated six times, with nine male birds per replicate. Birds were placed in cages, in a climate-controlled house and offered starter (1-10 d), grower (11-24 d) and finisher (25-35 d) corn-soybean based diets, which were formulated to Aviagen standards for Ross 308.
III. RESULTS AND DISCUSSION On average the concentration of trypsin inhibitors (TI) in diets containing 25 % of RSBM was around 10,193 TIU/kg. Increasing levels of microbial protease significantly (P < 0.05) improved bird feed intake (FI) in the 1-10 d period, but not (P > 0.05) in the 1-24 or 1-35 d periods. Increasing the inclusion rate of phytase also improved (P < 0.05) FI of birds during 1-24 d, but not (P > 0.05) in the 1-10 d or 1-35 d periods. The FI of birds fed on the control group was higher (P < 0.01) than birds in the other groups, during 1-10 d, but was similar during 1-24 and 1- 35 d periods.
At 0-10 d of age, when compared with the zero protease treatment, the body weight gain (BWG) of birds was improved (P < 0.05) by increasing supplementation of protease, while phytase supplementation increased (P < 0.01) the BWG between 1 and 24 d of age. When compared with the control (zero RSBM inclusion), the overall feed conversion ratio was not affected during all growth periods. Yield of meat parts was not significantly (P > 0.05) affected by protease supplementation, but phytase supplementation increased (P < 0.05) the weight of thighs. Except in the starter phase when the interaction between protease and phytase tended to be significant (P = 0.06) for BWG, the interaction between the two enzymes was not significant. Increasing supplementation of protease enzyme (from 0 to 400 mg/kg) in the diets reduced the weight of pancreas by 32.4 % (P < 0.001) and duodenum by 9.8 % (P < 0.05) compared to the un-supplemented RSBM group.
Hong et al. (2004) reported that diets with a TI concentration above 0.77 mg/g (1463.0 TIU/kg equivalent), could mildly negatively affect the performance of non-ruminant animals. However, in the present study the final FI, BWG and feed efficiency of birds were not significantly reduced by the high level of TI in the diets. The two enzyme combination tested in the current study may combine to ameliorate the negative effects of TI, as evident from the change in reducing the weight of pancreas. Our results agree with those of other workers (Jacela et al., 2013; Barletta, 2011) who reported that microbial proteases can break down both stored proteins and proteinaceous anti-nutrients and improve the nutritional values of feed. To explain why protease helped to maintain acceptable bird performance particularly during the early growth period, Pettersson and Pontoppidan (2013) clearly demonstrated the ability of exogenous protease derived from Nocardiopsis prasina to degrade Kunitz trypsin inhibitors and lectin present in RSBM. When feeding birds up to 20 % RSBM, a similar protease helped to maintain bird performance (Faruk et al., 2013). Although analyses of ANF in the digested meals were not conducted, the reduction in weight of pancreas is an indirect indication of ANF reduction to
Aust. Poult. Sci. Symp. 2016.....27
187

maintain a normally functioning organ. A healthy pancreas would ensure adequate secretion of proteases and other enzymes that are required to digest protein and other nutrients.
IV. CONCLUSION The results suggest that inclusion of up to 25% RSBM in broilers in diets supplemented with Nocardiopsis prasina protease in combination with phytase may be feasible as FI and BWG were improved during the early growth period (1-10d) relative to the RSBM diet supplemented with phytase alone. The economic parameters of feeding RSBM in association with these levels of microbial enzymes used in this study are under evaluation. Also, the mechanisms behind the positive responses will be investigated further. ACKNOWLEDGEMENT: This study was supported by the University of New England & DSM, Animal Nutrition and Health, for which we are grateful.
REFERENCES
Barletta A (2011) In: Enzymes in Farm Animal Nutrition (2nd Edition), CABI , UK. Bedford MR & Partridge GG (Eds) pp.1-11.
Chen Y, Duan W, Wang L, Zhang S & Zhou Y (2013) International Journal of Poultry Sciences 12: 441-444.
Jacela JY, de Rouchey JM, Tokach MD & Robert D (2009) Journal of Swine Health Production 17: 325-332.
Erdaw ME, Perez-Maldonado RA, Bhuiyan MM & Iji PA (2015) Proceedings of the 20th European Symposium on Poultry Nutrition. 24–27 Aug 2015, Prague, Czech Republic pp.179-180.
Erdaw ME, Perez-Maldonado RA, Bhuiyan MM & Iji PA (2015) Proceedings of the 20th European Symposium on Poultry Nutrition. 24–27 Aug 2015, Prague, Czech Republic pp.202.
Faruk MU, Aureli R, Schlifka W, Pontoppidan K, Nielsen P & Broz J (2013) Poster at International Poultry Scientific Forum, Atlanta Georgia USA.
Perilla NS, Cruz MP, de Belalcazar F & Diaz GD (1997) British Poultry Science 38: 412-416.
Pettersson D & Pontoppidan K (2013) Soybean Bio-Active Compounds, In: Intech Open Science/Open Minds, El-Shemy Hany A (Ed). pp.2887-3307.
Shi SR, Lu J, Tong HB, Zou JM & Wang KH (2012) Journal of Applied Poultry Research 21: 367-374.
Aust. Poult. Sci. Symp. 2016.....27
188

Table 1 - Effects of super-dosing of diets with microbial phytase (FYT/kg) and protease (mg/kg diet) on the FI (g/b), BWG (g/b) and FCR of broiler chickens between hatch and 10, 24 and 35 days of age.
Protease levels
Phytase levels
Feed intake Body weight gain FCR 1-10d 1-24d 1-35d 1-10d 1-24d 1-35d 1-10d 1-24d 1-35d
0 1000 215.0bc 1416.3b 3107.8 189.6bc 1083.0ab 2117.6 1.137 1.307 1.469 2000 222.1bc 1410.2b 3116.3 180.1c 1034.2b 2151.5 1.187 1.365 1.448 3000 206.8c 1448.1b 3047.0 185.6bc 1141.9ab 2179.0 1.129 1.268 1.403
200
1000 217.8bc 1421.9b 3012.6 196.6ab 1079.5ab 2174.2 1.113 1.320 1.389 2000 226.2bc 1470.3ab 3214.6 194.5b 1125.2ab 2228.5 1.165 1.307 1.443 3000 234.8b 1603.5a 3294.2 214.2a 1213.7a 2225.4 1.095 1.320 1.489
400 1000 221.7bc 1437.0b 3033.4 187.5bc 1087.3ab 2139.0 1.182 1.322 1.419 2000 225.9bc 1463.2b 3076.0 198.2ab 1101.5ab 2243.3 1.163 1.330 1.374 3000 238.2b 1533.6ab 3091.9 202.2ab 1136.7ab 2214.2 1.179 1.351 1.399
Control1 1000 240.7a 1521.7ab 3341.6 204.4ab 1180.8a 2309.8 1.177 1.288 1.448 Pooled SEM 2.5 15.92 29.3 2.3 10.63 18.5 0.01 0.05 0.01 Sources of variation Protease levels * NS NS * NS NS NS NS NS Phytase levels NS * NS NS ** NS NS NS NS Protease x phytase NS NS NS 0.06 NS NS NS NS NS
a,b,c Means bearing uncommon superscript within a column are significantly different; 1 control = normal diet without the raw soybean meal; NS = not significant; * P < 0.05; **P < 0.01.
Aust. Poult. Sci. Symp. 2016.....27

2015 USA HIGHLY PATHOGENIC AVIAN INFLUENZA OUTBREAK REVIEW AND LESSONS LEARNED
T. SCHAAL1
Summary
The highly pathogenic avian influenza (HPAI) outbreak from December 2014 through June 2015 has been declared the worst animal health emergency in the history of the United States. Eurasian strain HPAI viruses (H5N2 and H5N8) were detected in commercial poultry, backyard flocks, captive falcons, and wild birds in 21 states including: AR, CA, IA, ID, IN, KS, KY, MI, MN, MO, MT, NE, ND, NM, NV, OR, SD, UT, WA, WI, and WY (see Figure 1). A total of 232 premises, including 211 commercial and 21 backyard flocks, were depopulated including 7 “dangerous contact” premises. In total it is estimated that 49.6 million commercial birds were depopulated, including 7.5 million turkeys and 42.1 million chickens (commercial layers, broiler breeders). It is interesting to note that no commercial broiler flocks were infected during the outbreak. Local, state, and federal emergency response resources were quickly overwhelmed as the virus rapidly spread between flocks. Efforts to diagnose infected flocks, depopulate and indemnify flock values, and eventually clean and disinfect infected premises cost the U.S. government more than 800 million dollars. Total financial impact to the poultry industry, including lost exports markets, is estimated at 3 billion dollars. Many lessons were learned throughout the eradication process and new strategies will be implemented at the farm, local, state and federal levels in an effort to contain any future HPAI outbreaks more efficiently.
I. INTRODUCTION The spread of highly pathogenic avian influenza (HPAI) from Southeast Asia to North America via wild waterfowl migration has been anticipated for over a decade. Highly pathogenic avian influenza of the Eurasian H5 lineage arrived in North America in December 2014, initially infecting commercial poultry in British Columbia, Canada. Subsequent detections were made in falcons, wild birds, and backyard flocks along the west coast in the following weeks. In January 2015, the first US commercial poultry flock infection was detected in California. Two HPAI viruses were circulating on the west coast, H5N2 and H5N8. Both viruses contained the Eurasian highly pathogenic hemagglutinin with a North American neuraminidase.
On March 4th 2015, a commercial turkey breeder flock in Minnesota was found to be infected with highly pathogenic H5N2 virus, with subsequent findings in turkey flocks in Missouri, Arkansas, and backyard flocks in Kansas. The timing appeared odd for the Minnesota case as winter weather and cold conditions were still in effect. Cases in Missouri and Arkansas were correlated to large numbers of snow geese visiting fields near turkey farms on their northern spring migration. Eventually the HPAI viruses would affect some 232 poultry premises across 21 states, resulting in depopulation and disposal of 49.6 million birds. The states of Iowa and Minnesota were the worst affected, with 75 and 101 cases, respectively. This resulted in depopulation of 31,723,300 birds in Iowa and 8,987,050 birds in Minnesota.
1 Hy-Line International; [email protected]
Aust. Poult. Sci. Symp. 2016.....27
190

Figure 1 - USDA HPAI Incident Map https://www.aphis.usda.gov/animal_health/downloads/animal_diseases/ai/hpai-incident-map.pdf
II. DISCUSSION
Sudden, elevated mortality was the primary indication that a flock was infected with HPAI. Necropsy of infected birds revealed hemorrhages in the serosal fat, proventriculus, and pericardial fat. Astute managers on egg layer farms were able to identify infected flocks based on multiple dead birds in a single cage or in adjacent cages. As the outbreak progressed, rapid diagnosis at state labs via rt-PCR was critical to identify infected premises. There appeared to be an age association with infection, with increased mortality in older chicken and turkey flocks. Several egg layer pullet flocks tested positive by PCR without clinical signs or increased mortality in pre-move surveillance testing. Turkey poults did not appear as susceptible to infection as older birds closer to market age.
Based on genetic sequencing of the HPAI viruses, USDA has determined that the initial infections in turkey and chicken flocks were a result of direct exposure to virus from wild waterfowl sources. Epidemiologic investigations have determined that 40 of the infected Minnesota flocks were spontaneous introductions of HPAI virus directly from a wild waterfowl source. Within such a short time frame, these numerous introductions resulted in more “index cases” than state and USDA incident command could adequately control. Presumably, the HPAI viruses were able to spread so rapidly throughout the upper Midwest due to a mild, wet, and windy spring which provided an optimal environment for the virus to survive for at least several days. In Iowa, introduction of the HPAI virus to commercial flocks from waterfowl sources was only determined in two cases by genetic analysis. Lateral spread occurred after infection
Aust. Poult. Sci. Symp. 2016.....27
191

of large, multi-age, caged layer complexes which produced rapid and enormous viral amplification. Egg layer complexes struggled with timely depopulation, disposal, and cleaning and disinfection of their premises due to limited staffing and equipment availability. USDA contracted with a commercial service to provide 3,000 workers as quickly as possible to assist with farm depopulation, cleaning and disinfection efforts; however, logistics of managing and training such a large workforce resulted in many delays and added cost. A USDA epidemiology report based on questionnaires from infected and non-infected case-controlled farms concluded that cross-contamination between infected and non-infected farms were major potential sources of HPAI spread. The study revealed inadequate biosecurity practices, including: 1) sharing of equipment between farms, 2) employees moving between farms, 3) lack of cleaning and disinfection of vehicles moving between farms, and 4) reports of rodents and/or small wild birds inside poultry houses.
It should be noted that many farms may have been protected from infection if more timely bird depopulation and disposal had occurred. Primary means of depopulation was foaming for turkey flocks and CO2 - Modified Atmospheric Kill (MAK) carts for caged egg layers. Two foaming units were being used per turkey barn due to frequent breakdowns and mechanical issues. One small Minnesota town drained their entire water tower to produce enough foam to depopulate local turkey flocks. MAK carts proved to be a very slow means to depopulate an entire layer complex; a crew of 20 can only depopulate a single house of 100,000 birds per day if properly trained. Depopulation took longer than two weeks on some large layer complexes with more than 1 million birds. In several affected layer and turkey houses, nearly all birds died due infection with HPAI virus before depopulation could be completed.
Disposing of dead birds became an incredibly difficult task due to the massive scale of the outbreak. Carcasses were incinerated, composted, buried on site, or taken to approved landfills in sealed bio-bags. All methods of disposal were met with regulatory and financial limitations. Large scale incinerators were difficult and expensive to source, and once installed did not burn the volume of carcasses originally estimated. Composting requires addition of a large amount of cellulosic material (corn stover, hay bales, wood chips, etc.). A layer complex that depopulated more than 3 million hens produced a compost pile almost 6 miles in length. Burial of carcasses requires approval from environmental agencies to protect ground water and future land values. Soil type and nearby waterways also affected some premises from using burial. Most landfills in the US are privately owned which allowed for denial of infected materials due to perceived risks to employees and neighboring properties. Planning for bird disposal by commercial operations should be seen as a critical component to a farm’s biosecurity and emergency response plan.
The scope of the outbreak revealed deficiencies in industry and government response plans and capabilities. States are required to have HPAI response plans approved by USDA, but it became apparent no written plan can fully prepare an industry or responders for a real catastrophic event. Communication by government officials to stakeholders to allow for alternative trucking routes was a major area that can be improved for future events. Permitted movement of poultry and products from unaffected farms in HPAI control zones was very resource intensive. A program developed by industry, university and government input known as the “Secure Food Supply Plans” (Secure Egg Supply, Secure Turkey Supply, and Secure Broiler Supply) was instrumental in providing continuity of business for negative operations within HPAI control zones. The Secure Food Supply Plans involve pre-determined risk analyses that allow permitted movement of poultry and poultry products from negative flocks/premises within a control zone. With routine testing by rt-PCR, negative operations were able to continue moving products both inter- and intrastate. Unfortunately, some
Aust. Poult. Sci. Symp. 2016.....27
192

individual states adopted interim regulations for movement of poultry from affected states or regions complicating the ability to move clean birds or products.
Use of vaccination to assist in controlling any future HPAI outbreak has been a contentious issue, but USDA has determined vaccination to be a necessary tool in the event of a “worst case” HPAI outbreak scenario. Vaccination may reduce viral production and shed into the environment, but vaccinated birds that become infected must be identified quickly via routine testing. A DIVA strategy to differentiate vaccinated birds from infected is a critical requirement. USDA has also stated that vaccinated birds that become infected must be depopulated, focusing on HPAI eradication.
Avian influenza vaccine use in the United States can only be approved by USDA with oversight by state officials. A proposal for using HPAI vaccine has been presented by USDA and it outlines the potential initiation of vaccine use and role of state approval and oversight. USDA has stated that vaccine may be authorized in cases of future HPAI outbreaks if there is a large regional proliferation of virus, if one segment of the poultry industry is severely affected, or if valuable stocks (pedigree lines) are at risk of infection. Individual states need to prepare their own vaccine use plans, including an exit strategy, to gain final approval for use by USDA. Individual states may also deny the use of vaccination.
Potential limitations of using vaccine for HPAI include a lack of homology to new viral isolates due to reassortment, and the intensive labor and significant expense required to apply vaccine. Additionally, movements of vaccinated pullets from grow farms to laying complexes or movement of birds to slaughter may be hindered by interstate regulations. The largest limitation to a HPAI vaccination strategy is that the United States does not accept poultry imports from countries vaccinating for avian influenza at present. Therefore, negotiations with trading partners on use of vaccine would be necessary to maintain U.S. exports of poultry genetics and products.
The last HPAI detection in the US was reported on June 17, 2015. Since then, all infected birds have been depopulated and disposed of. Infected flock depopulation and disposal, along with the benefit of warm summer weather, appeared to control the virus. Restocking of affected farms in both Iowa and Minnesota began as early as August 4th, after cleaning, disinfection and negative environmental testing was confirmed. Several infected premises are still currently awaiting final environmental confirmation to release for restocking. December 23rd has been proposed as the date Iowa will be able to declare HPAI freedom in commercial poultry.
III. REVIEW OF LESSONS LEARNED
• Industry, along with local, regional, state and federal governments must plan for catastrophic HAPI events and must cooperate and coordinate with each other. a. Must have transparent communication between all parties involved. b. Address limitations of staff, funding, equipment, expertise – know weaknesses
and adapt accordingly. • Site specific company biosecurity plans need to be an industry priority.
a. Management and workers need to participate and “buy-in” to the plan. b. Short-cuts can cause major consequences. c. Tracking and addressing all farm inputs and outputs is a difficult but important
task d. Use HACCP style interventions to reduce risk of pathogen introduction.
• Individual companies and farms should prepare emergency response plans. a. Know potential staffing sources and needs. b. Have supplies on hand, prepare contingency plans for trucking routes
Aust. Poult. Sci. Symp. 2016.....27
193

c. Focus on ability to keep HPAI out or contained. • Rapid HPAI diagnosis is paramount to eradication.
a. Trained staff to perform sample collection. b. Reference lab staffing and capabilities to increase work load. c. System for quickly reporting accurate results to stakeholders.
• Depopulate affected farms rapidly. a. Requires prior site specific planning. b. Consider staffing to execute depopulation plans. c. Consider equipment needs. d. May need government approval on method to receive indemnity.
• Disposing of a million (or more) birds is very difficult! a. Need to know environmental laws regarding burial b. Know availability of cellulosic material for composting c. Pre-negotiate with land fill for space and acceptance of product d. Incineration or other capabilities such as rendering are options.
• Must learn from past events and improve. a. Although large outbreaks may occur once per decade, we cannot afford to
reinvent the wheel at each event. • Vaccination may be considered a “tool” in HPAI eradication.
a. Specificity and protection against future outbreak viruses is unknown. b. Must be part of an eradication effort. c. DIVA strategy to discover infected flocks that have been vaccinated. d. Regular testing interval of vaccinated flocks. e. An exit strategy and effects on export of poultry products must be considered.
REFERENCES
Secure Broiler Supply Plan (2015) http://www.securebroilersupply.com Secure Egg Supply Plan (2015) http://www.secureeggsupply.com Secure Turkey Supply Plan (2015) http://www.secureturkeysupply.com USDA APHIS (2015) Epidemiologic and Other Analyses of HPAI-Affected Poultry Flocks:
June 15, 2015 Report. https://www.aphis.usda.gov/animal_health/animal_dis_spec/poultry/downloads/Epidemiologic-Analysis-June-15-2015.pdf
USDA APHIS (2015) Epidemiologic and Other Analyses of HPAI-Affected Poultry Flocks: July 15, 2015 Report. https://www.aphis.usda.gov/animal_health/animal_dis_spec/poultry/downloads/Epidemiologic-Analysis-July-15-2015.pdf
USDA APHIS (2015) Epidemiologic and Other Analyses of HPAI-Affected Poultry Flocks: September 9, 2015 Report. https://www.aphis.usda.gov/animal_health/animal_dis_spec/poultry/downloads/Epidemiologic-Analysis-Sept-2015.pdf
USDA APHIS (2015) Fall 2015 HPAI Preparedness and Response Plan https://www.aphis.usda.gov/animal_health/downloads/animal_diseases/ai/hpai-preparedness-and-response-plan-2015.pdf
Aust. Poult. Sci. Symp. 2016.....27
194

USDA APHIS (2015) Highly Pathogenic Avian Influenza A Guide To Help You Understand the Response Process. https://www.aphis.usda.gov/publications/animal_health/2015/poster-hpai-guide-to-understanding-the-process.pdf
USDA APHIS (2015) Update on Avian Influenza Findings Poultry Findings Confirmed by USDA’s National Veterinary Services Laboratories. https://www.aphis.usda.gov/wps/portal/aphis/ourfocus/animalhealth/sa_animal_disease_information/sa_avian_health/ct_avian_influenza_disease/!ut/p/a1/lVFNc4IwEP0tHnpkEgH5OPrRCla0U6cquWTWAJIpBAaCjv31DWo79iBtc9vd97L73kMEbRERcOB7kLwQkLU1sehs6en9Edb96cp9xP5i_RQ4c9tYeqYChAqA77wh_slfPvtWy3_FI2_SxysDbRBBhAlZyhSFUKa8pqwQMhaSZnxXQXV6wDXQoqloUrCmPlcgeA4ZTWPIZHrbiXgdQx1TLpKiys8iLuMDB_GNZ_LaULCsicUHfBHbY0rGIxTudDfBlh5rhtMHzWQ7Q4MBDDR9ECVRxJhtGPZVfIe6X8w7i1eQ8XTomfZcGWY6OvYnim67Aca-dQV0-BuqG-y7S1wTrf4pavaHyPUqGAd79S3IVGvNRtvOEC7jmxDQtiOEzQiRQ3NcT46ozN9yxzhp78lioZHwxR_2ep_RA_Y1/?1dmy&urile=wcm%3apath%3a%2Faphis_content_library%2Fsa_our_focus%2Fsa_animal_health%2Fsa_animal_disease_information%2Fsa_avian_health%2Fsa_detections_by_states%2Fct_ai_pacific_flyway
Aust. Poult. Sci. Symp. 2016.....27
195

ON-FARM SURVEYS TO INFORM AVIAN INFLUENZA RISK ASSESSMENT MODEL
A.B. SCOTT1, M. SINGH1, M. HERNANDEZ-JOVER2, B. BARNES3, K. GLASS4, B. MOLONEY5, A. LEE5, P. GROVES1 and J-A. TORIBIO1
Summary
Consumer-driven expansion of free-range poultry products has led to significant increases in the number of free-range poultry farms and the total percentage of the national flock dedicated to free-range production. Free-range management increases the risk of contact between commercial poultry and wild birds, thus potentially increasing the likelihood of avian influenza (AI) outbreaks. On-farm surveys were conducted to better understand the risks posed by free-range management on commercial chicken farms in relation to AI outbreaks compared to other management systems. The data collected will be used to inform mathematical models which will quantify risk reduction that may be achieved by actions implemented on-farm to mitigate AI virus entry. Main findings from the on-farm surveys include; 88% of farms have seen waterfowl on water bodies near the sheds. Overall, farms have an average of 1.5 dams on the property. Fifty-four percent of farms overall reported seeing wild birds inside chicken sheds of which all report to be small birds such as sparrows and finches. Fifty-four percent of farms stated that wild birds inside sheds occurred commonly. 94% of farms use treated water for the chickens. For biosecurity practices, 64% of layer farms and 95% of broiler farms had visitor recording systems in place.
I. INTRODUCTION
a) Avian influenza virus and history in Australia AI has caused enormous losses in poultry production worldwide, including Australia. In most cases of highly pathogenic avian influenza (HPAI) virus infection, gallinaceous poultry are found dead prior to the observation of any clinical signs. Morbidity and mortality rates are very high (50-89%) and can reach 100% in some flocks (Saif et al., 2009). Australia has experienced seven HPAI outbreaks in poultry farms in Victoria (three separate outbreaks), Queensland (one outbreak), and New South Wales (three separate outbreaks) since 1976. The latest outbreak affected two farms in Young, NSW in 2013. Most of these outbreaks were limited to one farm and all involved chickens, either layer (four farms), broilers (two farms) or broiler breeders (four farms). Three outbreaks affected farms of other poultry species, specifically ducks and emus. In all farms there was opportunity for direct or indirect contact with waterfowl. All viruses were of subtype H7 and of Australian lineages. Most outbreaks occurred during spring and summer (October to January), with the exception of the Bendigo, Victoria outbreaks in 1985 and 1992 which occurred in late autumn and winter (May and July) respectively. Four of the last seven outbreaks have occurred in the last 10 years, suggesting outbreaks are occurring more frequently (Swayne, 2008).
1 Faculty of Veterinary Science, University of Sydney; [email protected] 2 School of Animal and Veterinary Science, Charles Sturt University; [email protected] 3 Quantitative Sciences, Department of Agriculture; [email protected] 4 College of Medicine, Biology and Environment, Australian National University; [email protected] 5 NSW Department of Primary Industries; [email protected]; [email protected]
Aust. Poult. Sci. Symp. 2016.....27
196

b) AI and the expansion of free range poultry production in Australia Australia has experienced a significant expansion of free-range poultry production due to consumer demand in recent years. In 2006 the Australian Chicken Meat Federation (ACMF) regarded free range chicken meat production as a cottage industry. However in only five years free range chicken meat production grew significantly to about 15% of the total market in 2011 (ACMF, 2011). Similarly, the retail market share of free range eggs has increased from 10% in 2000 to 40% in 2013 (AECL, 2014). Theoretically the expansion of free range production systems increases the likelihood of AI virus introduction into poultry flocks due to greater opportunities for contact between wild and domestic birds. However the change in probability of outbreak occurrence with increased proportion of free range farms has not been quantified. On farm actions to reduce AI virus introduction and spread have also not been quantified. There is a need to better understand AI outbreak risk to inform the industry on preventative actions that can effectively reduce risk.
c) Conduct of on-farm surveys relevant to AI introduction and spread A research project commenced in 2015 to address these knowledge gaps. The research team is developing mathematical models to quantify the probabilities of AI introduction and spread in both layer and broiler production systems of all types (cage, barn, free range), and to quantify risk reduction that can be achieved by various on-farm preventive actions. These models require inputs relating but not limited to farm management practices, virus behaviour and wild bird ecology. Data on these inputs is being obtained from the literature, expert opinion elicitation and conduct of on-farm surveys. This paper describes the on-farm surveys conducted during 2015 with the objective to document current farm layout and management practices relevant to AI introduction to a farm and then spread farm-to-farm on layer and broiler farms of all types in the Sydney basin region.
II. METHODS
a) Sampling frame A comprehensive farm list sourced from various corporations, integrators and private consultants was created which listed most, if not all, chicken farms in the Sydney basin region, which extends from Seaham to Bateman’s Bay. This region was selected because it has had an AI outbreak in the past (Maitland in 2012) and it contained all farm types of interest. As AI risk is considered greater in layer chickens rather than broilers, a greater number of layer farms were surveyed compared to broiler farms (60% vs 40%). Farms were randomly selected from the comprehensive list. Farmers were contacted by telephone, the project explained to them and they were invited to participate in the project.
III. PRELIMINARY RESULTS Sixty-four chicken farms were visited; nine cage layer, nine barn layer, 25 free range layer, 15 non-free range broiler and six free range broiler farms.
a) Water source and treatment Sixty-nine percent of farms use town water as the source of drinking water for the chickens. The next most common source was bore water (19%), followed by a natural nearby water body (8%) and then the farm dam (4%). Ninety-four percent use treated water and this includes farms using town water which is assumed to be treated. Eighty-one percent of farms
Aust. Poult. Sci. Symp. 2016.....27
197

that treat their own water use chlorination. Water used for environmental control methods such as foggers, cooling pads and irrigation of the range area is usually from the same source as the drinking water, however 13% use a different source, and of these 91% do not treat this source.
b) Animals on farm, farm distances and movements The mean distance to the next poultry farm is 3.5 kilometers. The mean minimum distance from a waterbody to shed is 191 meters. Eighty-eight percent of farms have seen waterfowl on water bodies near the sheds, where farms have an average of 1.5 dams on the property. An average of 0.88, 1.11, 1.36 dams are present on cage, barn and free range layer farms respectively and an average of 1.4 and 2 dams are present on non-free range and free range broiler farms respectively. Fifty-four percent of farms reported seeing wild birds inside chicken sheds of which all report to be small birds such as sparrows and finches. The breakdown per farm type was 56% cage and barn layer farms, 52% free range layer farms, 47% non-free range broiler farms and 83% free range broiler farms. Overall, 54% of farms stated that the wild birds inside sheds occurred commonly. Seventy-nine percent of farms have seen wild birds on top of or around feed storage areas, which in most cases are silos. More than half (58%) report wild birds present during feed spills, where farmers that do not report wild birds during this instance explain that it is due to prompt cleaning of the feed spill.
Most farms (63%) have dogs and/or cats on the property and 44% of farms have ruminants. No farms sell live birds at markets but 6% of layer farms sell chickens on the property as backyard hens. One company delivers the majority (97%) of pullets. One company takes the majority (84%) of spent hens from layer farms. For broilers, the delivery of day old chicks and the removal of chickens for processing are performed by the same delivery companies within that broiler company.
c) Information sources and biosecurity
Farmers were asked where they get information from regarding poultry health and industry news, what methods of information delivery were used and to rate these sources and delivery methods in terms of reliability. Eighty-three percent of farmers use a veterinarian as an information source and all rated veterinarians with the highest level of reliability. Newsletters were the most common form of information delivery (60%) and were rated on average as ‘moderately’ reliable.
Farmers were asked to indicate the biosecurity practices they followed on farms and rate them on a scale of importance. Ninety-percent of farms had a biosecurity manual and this practice gained an average rating of ‘extremely important’; the highest rating level. The average rating for visitor recording systems was ‘very important’. It was found that 74% of farms overall had a visitor recording system in place with the prevalence being the highest in free range broiler farms (100%), followed by non-free range broiler (93%), free range layer (80%), barn layer (56%), and cage layer (25%). More than half of farms disinfect vehicles (64%) and equipment (71%) between farms. There is little disinfection of vehicles (28%) and equipment (29%) between sheds and these were both rated ‘moderately important’. Ninety-two percent of farms do not allow animals inside sheds and rated this as extremely important. Most farms remove manure (88%) and provide fresh littler/shed sanitization (96%) between batches and these were rated as ‘extremely important’. Seventy-eight percent of farms have workers that do not come into contact with other birds or poultry farms and this was rated as ‘extremely important’.
Aust. Poult. Sci. Symp. 2016.....27
198

IV. IMPLICATIONS AND CONCLUSIONS Waterfowl commonly visit water bodies on poultry farms that are in close proximity to chicken sheds which is a concern in terms of avian influenza introduction. Most farms follow basic biosecurity practices but actions can be put into place to increase the proportion of farms doing so. This can be through the implementation of biosecurity audits and/or through a series of workshops to educate farmers. ACKNOWLEDGEMENTS: This research was conducted within the Poultry CRC established and supported under the Australian Government’s Cooperative Research Centres Program with support from Woolworths Limited. Thanks also to egg and chicken meat companies and producers for their participation.
REFERENCES ACMF (2011) The Australian Chicken Meat Industry: An Industry in Profile. (Australian
Chicken Meat Federation (ACMF) Inc). AECL (2013) Australian Egg Corporation Limited Annual Report. (Australian Egg
Corporation Limited). Saif YM, Fadly AM, Glisson JR, McDougald LR, Nolan LK & Swayne DE (2009) Diseases
of Poultry (Blackwell Publishing, Iowa, USA). Swayne DE (2008) Avian Influenza (Blackwell Publishing, Iowa, USA).
Aust. Poult. Sci. Symp. 2016.....27
199

PROBIOTICS AS AN ALTERNATIVE TO ANTIBIOTICS FOR TREATING LAMENESS DUE TO BACTERIAL INFECTIONS IN BROILERS
R.F. WIDEMAN JR.1
Summary
Tight junctional complexes comprise a key component of the intestinal barrier by sealing the apical surfaces of adjacent epithelial cells. “Leaky” tight junctions provide paracellular portals through which bacteria cross the intestinal epithelium and enter the systemic arterial circulation. This process, known as bacterial translocation, can trigger a form of lameness known as bacterial chondronecrosis with osteomyelitis (BCO) when hematogenously distributed pathogenic bacteria infect osteochondrotic micro-fractures in the epiphyseal-physeal cartilage of the proximal femora, proximal tibiae and flexible thoracic vertebrae of susceptible broilers. Osteochondrotic micro-fractures develop at sites where mechanical stress and torque are imposed on rapidly growing columns of structurally immature chondrocytes. Indeed, lameness attributable to characteristic BCO lesions can be reproduced by rearing broilers on wire flooring to create persistent footing instability and physiological stress, without the need to inoculate the birds with pathogenic bacteria that presumably are routinely present but quiescent within the bird’s microbial communities or in the environment. We used the wire flooring model to test the efficacy of probiotics for reducing the incidence of BCO. Probiotic bacterial species reduce bacterial translocation and promote improved intestinal barrier function by stimulating tight junction protein synthesis and enhancing the formation of occlusive tight junctional complexes. The results of multiple independent experiments conducted over a period of several years consistently demonstrated that commercially available probiotics administered prophylactically can provide an effective alternative to antibiotics for reducing BCO lameness.
I. PATHOGENESIS OF BCO The pathogenesis leading to BCO appears to be initiated by mechanical microfracturing of susceptible growth plates, followed by colonization of osteochondrotic clefts or voids by hematogenously distributed opportunistic bacteria. When compared with mammalian growth plates, the avian growth plate is much thicker and the chondrocyte columns are unevenly aligned. These differences have been attributed to high longitudinal growth rates associated with very rapid growth plate turnover times in birds (estimated at 21 hours) when compared with rats (4 days) and humans (20 days). Mechanical stress chronically exerted on the growth plates creates osteochondrotic clefts or microfractures between and within the cartilage layers (e.g., physeal osteochondrosis or osteochondrosis dissecans). Osteochondrotic clefts often transect local blood vessels, thereby causing focal ischemia and necrosis. Osteochondrosis dissecans has been observed in the leg bones and flexible thoracic vertebrae of apparently healthy broilers exhibiting no symptoms of infectious or traumatic lameness, suggesting that lameness is not necessarily caused by direct mechanical damage or osteochondrosis per se but rather by an ensuing bacterial infection (Wideman and Prisby, 2013; Wideman, 2015). Bacteria transmitted to chicks from breeder parents, contaminated eggshells or hatchery sources, or that enter the chick's circulation via translocation through the integument, respiratory system or gastrointestinal tract, spread hematogenously and can reach both sides of the growth plate via numerous terminal epiphyseal and physeal vascular plexuses. These plexuses are formed when the central arteriole within a cartilage canal divides into a tuft of
1 Center of Excellence for Poultry Science, University of Arkansas, USA; [email protected]
Aust. Poult. Sci. Symp. 2016.....27
200

capillary loops that have a discontinuous or fenestrated endothelium, with openings large enough to permit cellular elements in the blood to pass into the cartilaginous matrix. Hematogenously distributed bacteria possessing the specific ability to bind to exposed bone collagen appear in some cases to be more virulent in their capacity to trigger osteomyelitis. The translocated bacteria can form obstructive bacterial emboli in the epiphyseal and metaphyseal vascular plexuses, adhere directly to the exposed cartilage matrix, and colonize osteochondrotic clefts and zones of necrosis. Bacterial foci and sequestrae within infected bone tissue are notoriously inaccessible to antibiotics and cellular components of the immune system. Bacterial sequestrae rapidly expand into focal zones of necrosis or large fibrinonecrotic abscesses in the metaphysis of infected bones. Terminal BCO presents as necrotic degeneration and bacterial infection primarily within the proximal ends of the femora and tibiae, as well as in the growth plates of the flexible thoracic vertebrae. The distal ends of the femora and tibiae are affected less frequently. High incidences of femoral, tibial and vertebral BCO lesions have been observed in lame broilers from commercial flocks. Multiple opportunistic organisms have been isolated from BCO lesions, including Staphylococcus aureus, Staphylococcus spp., Escherichia coli, and Enterococcus cecorum, often in mixed cultures with other bacteria including Salmonella spp. (McNamee and Smyth, 2000; Wideman, 2015). Recently Jiang et al. (2015) used molecular profiling of 16S ribosomal RNA gene sequences to comprehensively analyze the structure and diversity of microbial communities in the proximal femora and tibiae from clinically healthy broilers and from lame broilers with obvious BCO lesions. Complex microbial communities were detected in all samples, including bones that appeared to be macroscopically normal. The likelihood exists that numerous bacterial species routinely translocate into the blood stream and are sequestered in the growth plates, where they form a complex microbial community. The obvious source of these translocating bacteria is likely to be the intestinal microbiome (Jiang et al., 2015), although complex microbial communities also are present within unabsorbed yolks, the conducting airways, and the lower respiratory tract of clinically healthy poultry (Cox et al., 2006; Shabbir et al., 2015; Sohail et al., 2015).
II. MECHANICAL MODEL FOR EXPERIMENTALLY TRIGGERING BCO The etiology, pathogenesis, and treatment strategies for BCO have been difficult to investigate because the incidence can be low or nonexistent in research flocks. Experimental models for triggering BCO are needed to confirm key triggering mechanisms and stressors, reveal innate limitations or susceptibilities, and provide a reliable test bed for evaluating practical prophylactic and therapeutic strategies. Mechanical models reliably trigger BCO without the need to purposefully inoculate the birds with known pathogens. Our assumption is that the offending pathogens routinely are present but quiescent within the bird or in the environment, waiting for an effective triggering scenario (e.g., stress, immunosuppression; Wideman and Pevzner, 2012) and attainment of sufficient body mass to create a conducive wound site (e.g., osteochondrotic clefts, focal necrosis). Pathogenic bacteria may be vertically transmitted from breeder hens, introduced in the hatchery, or transmitted as an aerosol or via the drinking water or feed, and then harbored subclinically at sites that have yet to be identified (e.g., intestinal, respiratory or physeal-metaphyseal microbial communities) until appropriate predisposing conditions converge. Our mechanical models were designed to create sustained footing instability and thereby persistently exert excessive mechanical stresses on susceptible leg and vertebral joints. Based on our current understanding, these amplified forces cause micro-trauma and osteochondrosis of the epiphyseal-physeal cartilage, followed by hematogenous bacterial colonization. For example, we developed portable obstacles known as "speed bumps" that consistently trigger moderate incidences of BCO in
Aust. Poult. Sci. Symp. 2016.....27
201
broilers (Gilley et al., 2014). The speed bumps are constructed in the shape of an isosceles triangular prism and are designed to be installed between feeders and waterers in litter flooring facilities, thereby forcing the birds to climb up and then down the slopes as they move back and forth to eat and drink. Speed bumps trigger 3-fold higher incidences of BCO when compared with broilers reared on litter flooring without speed bumps (Gilley et al., 2014). For the majority of our experiments the entire surface of the pen floor was covered with flat wire panels, thereby denying the birds access to litter and subjecting them to chronic footing instability as well as to behavioral stress. Incidences of lameness between 20% and 60% are reliably induced by this challenge, depending on the genetic susceptibility and hatchery source of the broilers being evaluated (Wideman et al., 2012, 2013, 2014, 2015a,b; Gilley et al., 2014; Prisby et al., 2014; Jiang et al., 2015). This model consistently triggers pathognomonic BCO lesion progression, with most of the lameness developing after 5 weeks of age, as has been reported for field outbreaks of BCO. Lameness progresses very rapidly in broilers that appeared to be healthy during the preceding 24 to 48 h. Broilers tend to exhibit relatively mild BCO lesion when they are euthanized at the earliest onset of clinical symptoms (hesitancy to stand, eagerness to sit, slight wing-tip dipping), whereas birds permitted to live until they become fully immobilized (unable to eat or drink) exhibit much more severe lesions. It also is apparent from necropsying survivors of a wire flooring experiment that severe lesions may occasionally be present in very large, apparently robust individuals that exhibit no signs of lameness or leg weakness (Wideman et al., 2012, 2014). We speculate that broilers may purposefully avoid exhibiting overt symptoms of lameness in order to avoid being victimized by the predatory behavior of their flock mates. Indeed, gait scoring does not accurately predict obvious skeletal pathologies or abnormalities detectable at postmortem examination (Naas et al., 2009; Sandilands et al., 2011; Wideman, unpublished observations). The pathogenesis of BCO cannot be instantaneous and therefore apparently healthy broilers often possess sub-clinical lesions primarily consisting of the earliest macroscopic BCO lesion pathology. Sub-clinical lesions are equally likely to develop in males and females, in left and right legs, and the status of the proximal femur does not determine the status of the ipsilateral or contralateral proximal tibia and vice versa (Wideman et al., 2012, 2013, 2014, 2015a,b; Gilley et al., 2014). These observations are consistent with the interpretation that sub-clinical mechanical damage to one or more proximal leg bones need not trigger overt lameness until the damaged area becomes infected. The resulting bacterial proliferation, immunological assault by responding phagocytes (macrophages and heterophils), and widespread lysis and necrosis of the metaphyseal trabecular bone and vasculature then culminate in intolerable discomfort and terminal lameness (Wideman and Prisby, 2013).
III. EFFICACY OF PROPHYLACTIC PROBIOTIC ADMINISTRATION Bacterial translocation and bacteraemia are essential features of our hypothesis for the pathogenesis of BCO. Tight junctional complexes comprise a key component of the intestinal barrier by sealing the apical surfaces of adjacent epithelial cells. “Leaky” tight junctions provide paracellular portals through which pathogenic bacteria can cross the gastrointestinal epithelium and ultimately enter the systemic arterial circulation. This process of bacterial leakage across the intestinal epithelial barrier, known as bacterial translocation, can lead to the hematogenous distribution of pathogenic bacteria that infect the bone. Factors known to modulate the integrity of existing tight junctions and influence the dynamic synthesis of new tight junction proteins include physiological stress and “crosstalk” (direct cell to cell signaling) between gastrointestinal epithelial cells and commensal or pathogenic bacteria of the intestinal microbial community (Saunders et al., 1994; Ando et al., 2000; Steinwender et
Aust. Poult. Sci. Symp. 2016.....27
202

al., 2001; Ulluwishewa et al., 2011; Pastorelli et al., 2013). Heat stress and enhanced intestinal microbial challenges can impair the integrity of tight junctions and facilitate bacterial translocation across the epithelium of the small intestine in broilers (Quinteiro-Filho et al., 2010, 2012a,b; Murugesan et al., 2014). It also has been demonstrated that probiotics alone or in combination with prebiotics can attenuate intestinal barrier dysfunction in broilers challenged by heat stress or pathogenic bacteria (Sohail et al., 2010, 2012; Murugesan et al., 2014; Song et al., 2014). Commensal and probiotic bacterial species that enhance intestinal barrier integrity by stimulating tight junction protein expression and the formation of occlusive tight junctional complexes also are effective in preventing bacterial translocation (Ulluwishewa et al., 2011; Pastorelli et al., 2013). In view of concerns regarding the development of antibiotic resistance in bacteria commonly associated with osteomyelitis (McNamee and Smyth, 2000), probiotics potentially can provide a plausible alternative for prophylactically reducing the incidence of BCO. Probiotics may interfere with the development of osteomyelitis by attenuating intestinal populations of pathogenic bacteria, by improving gut health and integrity to reduce bacterial leakage (translocation), or by priming the immune system to better eliminate translocated bacteria. Probiotics are not antibiotics and are unlikely to be effective if administered therapeutically only after lameness has developed in a flock. Indeed, administering probiotics in the feed beginning at 1 day of age, but not after the onset of BCO lameness, significantly reduced the incidence of lameness attributable to BCO in five independent experiments conducted over the course of two years and using four different broiler lines (Wideman et al., 2012). The first four of these experiments evaluated a proprietary probiotic containing Enterococcus faecium, Bifidobacterium animalis, Pediococcus acidilactici, and Lactobacillus reuteri. The fifth experiment evaluated a proprietary single microbe probiotic containing Enterococcus faecium. Prophylactically providing these probiotics in the feed consistently reduced the incidence of BCO lameness by at least 50% and without attenuating growth performance when compared with broilers that also were reared on wire flooring but were not provided probiotics in their feed (Wideman et al., 2012). In subsequent studies a proprietary probiotic containing Bacillus subtilis significantly delayed the age of onset and reduced the cumulative incidence of BCO lameness in broilers reared on wire flooring, whereas experiments conducted with a different proprietary Bacillus subtilis probiotic had no significant impact on the incidence of BCO lameness (Wideman et al., 2015a). Accordingly, although the specific biological mechanism remains to be determined, these experiments provide the first evidence that some, but not all, probiotics can significantly interrupt the pathogenesis of lameness attributable to BCO. Trials conducted on accumulated litter in commercial broiler facilities also have demonstrated the practical efficacy of probiotics for reducing the incidence of BCO (Wideman, personal observations).
IV. CONCLUSIONS It is our hypothesis that susceptibility to BCO is minimized by probiotics that attenuate the translocation of pathogenic bacteria into the blood stream. Based on recent evidence that the epiphyses, physes (growth plates) and metaphyses of rapidly growing bones can harbor complex microbial communities, and that major differences exist in the microbial communities in different bones and different lesion categories (macroscopically normal versus gross BCO lesions), it is intriguing to speculate that effective probiotics may improve bone health by modulating the composition and diversity of the microbial communities within the bones. Probiotics potentially might influence growth plate microbial communities by reducing pathogen translocation, by enhancing the immune response to translocating microbial species, or via translocation of the probiotic species to the bones followed by direct
Aust. Poult. Sci. Symp. 2016.....27
203

modulation of a local microbial community in situ. Probiotics are not antibiotics and are unlikely to be effective if administered therapeutically only after lameness has developed in a flock. Indeed, administering probiotics in the feed beginning at 1 day of age, but not after the onset of BCO lameness, significantly reduced the incidence of lameness attributable to BCO in multiple independent experiments conducted over a period of several years. These experiments consistently demonstrate that some but not all commercially available probiotics can, when administered prophylactically, provide an effective alternative to antibiotics for reducing lameness attributable to BCO.
REFERENCES Ando T, Brown RF, Berg RD & Dunn AJ (2000) American Journal of Physiology Regulatory
Integrative and Comparative Physiology 279: R2164-R2172. Cox NA, Richardson LJ, Buhr RJ, Northcutt JK, Fedorka-Cray PJ, Bailey JS, Fairchild BD &
Mauldin JM (2006) Journal of Applied Poultry Research 15: 551-557. Gilley AD, Lester H, Pevzner IY, Anthony NB & Wideman Jr. RF (2014) Poultry Science
93: 1354-1367. Jiang T, Mandal RK, Wideman Jr. RF, Khatiwara A, Pevzner I & Kwon YM (2015) PLoS
ONE 10: e0124403. McNamee PT & Smyth JA (2000) Avian Pathology 29: 253-270. Murugesan GR, Gabler NK & Persia ME (2014) British Poultry Science 55: 89-97. Naas IA, Paz ICLA, Baracho MS, Menezes AG, Bueno LGF, Almeida ICL & Moura DJ
(2009) Journal of Applied Poultry Research 18: 432-439. Pastorelli L, De Salvo C, Mercado JR, Vecchi M & Pizarro TT (2013) Frontiers in Science (Frontiers in Immunology) 4: 280. Prisby R, Menezes T, Campbell J, Benson T, Samraj E, Pevzner I & Wideman Jr. RF (2014)
Poultry Science 93: 1122-1129. Quinteiro-Filho WM, Ribeiro A, Ferraz-de-Paula V, Pinheiro ML, Sakai M, Sa LRM,
Ferreira AJP & Palermo-Neto J (2010) Poultry Science 89: 1905-1914. Quinteiro-Filho WM, Rodrigues MV, Ribeiro A, Ferraz-de-Paula V, Pinheiro ML. Sa LRM,
Ferreira AJP & Palermo-Neto J (2012) Journal of Animal Science 90: 1986-1994. Quinteiro-Filho WM, Gomes AVS, Pinheiro ML, Ribeiro A, Ferraz-de-Paula V, Astolfi-
Ferreira CS, Ferreira AJP & Palermo-Neto J (2012) Avian Pathology 41: 421-427. Sandilands V, Brocklehurst S, Sparks N, Baker L, McGovern R, Thorp B & Pearson D
(2011) Veterinary Record 168: 77-83. Saunders PR, Kosecka U, McKay DM & Perdue MH (1994) American Journal of Physiology
267: G794-G799. Shabbir MZ, Malys T, Ivanov YV, Park J, Shabbir MAB, Rabbani M, Yaqub T & Harvill ET
(2015) Poultry Science 94: 612-620. Sohail MU, Ijaz A, Yousaf MS, Ashraf K, Zaneb H, Aleem M & Rehman H (2010) Poultry
Science 89: 1934-1938. Sohail MU, Hume ME, Byrd JA, Nisbet DJ, Ijaz A, Sohail A, Shabbir MZ & Rehman H
(2012) Poultry Science 91: 2235-2240. Sohail MU, Hume ME, Byrd JA, Nisbet DJ, Shabbir MZ, Ijaz A & Rehman H (2015) Avian
Pathology 44: 67-74. Song J, Xiao K, Ke YL, Jiao LF, Hu CH, Diao QY, Shi B & Zou XT (2014) Poultry Science
93: 581-588. Steinwender G, Schimpl G, Sixl B & Wenzl HH (2001) Pediatric Research 50: 767-771.
Aust. Poult. Sci. Symp. 2016.....27
204

Ulluwishewa D, Anderson RC, McNabb WC, Moughan PJ, Wells JM & Roy NC (2011) Journal of Nutrition 141: 769-776.
Wideman RF (2015) Poultry Science 00: 1-20. (published online) http://dx.doi.org/10.3382/ps/pev320
Wideman RF & Pevzner I (2012) Poultry Science 91: 2464-2474. Wideman RF & Prisby RD (2013) Frontiers in Science (Frontiers in Endocrinology) 3: 183. Wideman RF, Hamal KR, Stark JM, Blankenship J, Lester H, Mitchell KN, Lorenzoni G &
Pevzner I (2012) Poultry Science 91: 870-883. Wideman Jr. RF, Al-Rubaye A, Gilley A, Reynolds D, Lester H, Yoho D, Hughes Jr. JD &
Pevzner IY (2013) Poultry Science 92: 2311-2325. Wideman Jr. RF, Al-Rubaye A, Reynolds D, Yoho D, Lester H, Spencer C, Hughes JM &
Pevzner IY (2014) Poultry Science 93: 1675-1687. Wideman Jr. RF, Al-Rubaye A, Kwon YM, Blankenship J, Lester H, Mitchell KN, Pevzner
IY, Lohrmann T & Schleifer J (2015) Poultry Science 94: 25-36. Wideman Jr. RF, Blankenship J, Pevzner IY & Turner BJ (2015) Poultry Science 94: 1821-
1827.
Aust. Poult. Sci. Symp. 2016.....27
205

LIFE WITHOUT ANTIBIOTIC GROWTH PROMOTERS – A UK PERSPECTIVE
S. PRITCHARD1
Summary It is 15 years since the voluntary removal of antibiotic growth promoters (AGP’s) from broiler diets in the UK. After an initial period where the withdrawal of AGP’s resulted in an increased usage of therapeutic antibiotics, the industry is still working to minimise their use with the ultimate goal of zero therapeutic antibiotic usage. The pressure from government and the retail sector to make continued progress on this issue is immense. Whilst there are a plethora of products claiming to be the alternative to AGP’s the reality is that growing broilers without the use of antibiotics requires rigorous attention to detail, particularly in terms of animal husbandry and management techniques along with sound nutrition and health management. Nutritional additives need to be evaluated in their own right on the basis of their quality, safety and efficacy rather than as a replacement for AGP’s or as a shortcut to improving management. In practice products that improve the digestibility of the feed have tended to become established as part of an overall nutritional strategy.
I. INTRODUCTION In 2013 the UK Chief Medical Officer described antibiotic resistance in humans as being ‘as big a risk as terrorism.’ Such statements make great headlines and are often then associated with antibiotic usage in livestock farming. Whilst the link between antibiotic usage in farm animals and its impact on resistance in the human population is still being debated it is clear that the issue of resistance needs to be tackled from numerous angles. Concern about antibiotic resistance has led to a number of initiatives including the establishment of a ‘European Antibiotic Awareness Day’ now in its 8th year, ‘Get Smart with Antibiotics’ in the United States and in 2015 the first World Antibiotic Awareness Week. These initiatives are aimed at increasing public awareness and promoting responsible use of antibiotics in the human population. From a livestock perspective the Review on Antimicrobial Resistance (2015) published its report on antimicrobials in agriculture in December 2015 setting out a series of recommendations that include a global target to reduce antibiotic use in food production to an agreed level per kilogramme of livestock and fish, along with restrictions on the use of antibiotics important for humans. In addition the report called for improved surveillance to monitor progress against global targets.
a. AGP’s in Europe
In the livestock sector, concern about the use of antibiotics has been on the agenda for some time with Sweden imposing a unilateral ban on the use of AGP’s in 1986. Sweden joined the European Union (EU) in 1995 and as a result antibiotic usage in livestock moved higher up the agenda. Denmark banned the use of Avoparcin in 1995 (Castanon, 2007). In the UK, where avilamycin was widely used in the poultrymeat sector, one of the leading broiler companies took the decision to remove all AGP’s in 1999. This move effectively forced the rest of the industry to follow suit. AGP’s were officially banned from use in the EU on the 1st January 2006. At this time only avilamycin and flavophospholipol were still licensed for use in broilers and turkeys. The measure was described at the time as being in line with the
1 Premier Nutrition, UK; [email protected]
Aust. Poult. Sci. Symp. 2016.....27
206

Commissions overall strategy to combat the threat to human, animal and plant health posed by anti-microbial resistance (European Commission, 2005).
II. THE UK EXPERIENCE Practical experience at the time of the voluntary ban in the UK was that broiler performance in the cycle immediately after removal was comparable to the performance before removal. However subsequent crop performance showed a steady decline. The impact of this performance drop was summarised by Ross (one of the leading genetics companies) at the time (Table 1).
Table 1 - Effect of AGP removal on broiler performance.
Perfomance measure After AGP removal Liveweight (g) - 50.0 Coefficient of variation (%) + 1.80 FCR + 0.04 Mortality (%) + 0.10
Ross Tech 99/37
In many cases the impact on performance was greater and the consequences in terms of carcass quality were more serious. The integrated poultry companies found that the spread in performance from good to bad farms was wider and also the challenges of growing broilers in the winter were greater. At the time the industry was using a chemical/ionophore shuttle programme to control coccidiosis. This was typically 100 mg/kg nicarbazin to 25/28 days followed by 100 mg/kg monensin. Once AGP’s had been removed the incidence of necrotic enteritis (NE) increased dramatically and problems of factory rejects also increased as a result of cholangiohepatitis. These issues were initially dealt with by an increase in use of therapeutic antibiotics, typically amoxicillin, penicillin and chlortetracycline (Casewell et al., 2003). This use of therapeutic antibiotics was clearly not a viable or defendable long term strategy and the industry had to adapt to life without the support of AGP’s. The experience in Sweden had shown that for the first 4 years after the AGP ban there was an increase in antibiotic usage (Wierup, 2001) but that by implementing a number of interventions that eventually overall antimicrobial usage could be reduced.
a. Coccidiosis control In the UK one of the main changes made by the industry was to switch from straight chemical anti-coccidial products at the front end of the shuttle programme to a combined chemical/ionophore product. There is only one licensed product available for broilers containing a 50:50 mix of nicarbazin and narasin (trade name Maxiban). Initially this product was used at an inclusion rate to provide 40 mg/kg each of nicarbazin and narasin and subsequently the typical inclusion was increased to 50 mg/kg of each. The use of this product as part of a shuttle programme has given both effective coccidiosis and necrotic enteritis control. Good coccidiosis control is seen as a major part of the strategy for good performance in AGP free diets (Williams 2010). Today, whilst this combined product is the mainstay of coccidiosis control, the industry has also used straight chemical anti-coccidials (robenidine, diclazuril, deccoquinate, halofuginone) where rotation policies are practised as part of a shuttle programme. There has also been a limited reintroduction of nicarbazin in some starter diets following its relicensing in the EU.
Aust. Poult. Sci. Symp. 2016.....27
207

III. ALTERNATIVE GROWTH PROMOTERS At the time that AGP’s were removed the category of ‘alternative growth promoters’ was established. Human nature dictated that if you have taken something out of the feed then you need to put something else back in its place. This was in part to reassure chicken growers that performance and therefore financial returns would not be adversely affected. Initially, the range of alternatives was fairly limited but mannan oligosaccharide (MOS), organic acid and essential oil products were the most commonly used. Since that time the number of potential alternative products that are available to the industry has grown to a bewildering list that has been reviewed by various authors (Huyghebaert et al., 2011, Dahiya et al., 2006, Bedford 2000) as summarised in Table 2. This should not be taken as an exhaustive list.
Table 2 - Summary of categories of ‘alternative growth promoters’ and potential modes of action.
Product category Mode of action Organic acids (including salts and/or partial esters)
- Short chain - Medium chain - Coated
- Antibacterial effects - Potential energy source for gut epithelial cells - Anti-inflammatory effects
Probiotics (direct fed microbials) - Colonising - Non colonising
- Influence on gut microflora - Increasing digestive enzyme activity - Effects on feed intake and digestion
Prebiotics - Stimulate specific gut microbial species - Block pathogen binding - Immunomodulatory effects
Plant extracts & Essential oils - Antibacterial effects - Antiprotozoal effects - Stimulation of digestive enzymes
Feed enzymes - Reduction in viscosity of gut contents - Improved nutrient digestibility - Influence on gut microflora
Hen egg antibodies - Blocking toxin binding - Reducing intestinal colonisation of pathogens
Vaccination against C. perfringens - Production of antibody titres Anticoccidial vaccination - Prevention of interaction between coccidiosis
and clostridiosis Betaine - Limit nutrient availability to microflora
- Improved coccidiosis control Bacteriophages - Lysis of targeted bacteria Omega 3 fatty acids - Influence on gut microflora Feed lectins - Effects on enteric fluid loss
One of the key roles that AGP’s played was to maintain a consistent microbial
population in the gut (Torok 2011). Under commercial conditions no single product or intervention strategy has been able to consistently replicate the effect that AGP’s had on gut health and subsequent performance. Over time the products that were first used to ‘replace’ AGP’s have subsequently been reassessed and in many cases removed. Today the market looks at feed additives in their own right and tries to evaluate them on the basis of safety, quality and efficacy. Products should ideally have a defined mode of action and be able to demonstrate clear and repeatable performance benefits under commercial conditions. As with
Aust. Poult. Sci. Symp. 2016.....27
208

the experience in Scandinavia an increased use of therapeutic medication was seen in the years after the withdrawal of AGP’s. Over time the realisation that there is no single alternative to AGP’s has meant that a more fundamental multifactorial approach has been put into place with the long term aim of zero use of therapeutic antibiotics.
IV. INTEGRATED APPROACH When problem solving the solution can always be found in one or a combination of four simple categories:- Breed, Feed, Disease and Husbandry (management). For an integrated approach to work all four areas need to be addressed with a fundamental back to basics mentality.
a. Breed
Whilst disease susceptibility can be influenced by breed (Williams 2010) and anecdotal evidence exists of differences in how different breeds respond to management inputs, the ability to influence the genetic make-up lies in the hands of the major breeding companies, who have made good progress in terms of the robustness of the bird and its ability to deal with the challenges of a wide variety of global environments, nutritional and management inputs as well as disease challenges.
b. Feed The UK market predominately uses wheat, soya and whole rapeseed based diets with some use of combined products containing whole rapeseed cooked with field beans. Wheat based diets have been shown to increase the risk of mucosal damage and alter the gut microbial composition (Williams 2010, Tierlynck et al., 2009). Whilst some producers have attempted to use maize in diets, the cost of maintaining this over a prolonged period of time is prohibitive. The use of commercial cereal based enzymes is universal in conventional broiler diets and had been in place prior to the removal of AGP’s. More recently there has been greater interest in the use of other exogenous enzyme activities to improve diet digestibility and promote good gut health. Excess dietary protein has also been clearly demonstrated to have an adverse impact on gut health and necrotic enteritis risk as reviewed by Dahiya et al., (2006). From a general nutritional standpoint the focus has been on trying to optimise the amino acid balance and keep protein levels as low as practicable.
Quality of fats is known to be important (Dahiya 2006) and is therefore monitored closely. There is widespread use of in feed emulsifiers in an attempt to improve digestibility of the diet. Only vegetable oils are used in broiler feed. Whilst there has been some interest in the antibacterial effects of omega 3 fatty acids (Dahiya 2006) they are not widely used at a commercial level.
The key nutritional parameters have also been widely reviewed (Collett 2012, Huyghebaert et al., 2011, Yegani & Korver 2008, Dahiya et al., 2006, Bedford 2000) and are summarised in Table 3. Again this is not an exhaustive list.
Aust. Poult. Sci. Symp. 2016.....27
209

Table 3 - Summary of nutritional interventions
Intervention Mode of action/dietary effect Cereal type - Influence on gut microflora
- Reduction in viscosity of gut contents Protein level and source - Influence on necrotic enteritis risk Amino acid addition - Reduced protein diets Exogenous protease - Reduced protein diets Exogenous phytase superdose - Reduction in mucin production Fat quality - Influence on necrotic enteritis risk Fat source/fatty acid composition - Antibacterial effect
- Influence on necrotic enteritis risk Mycotoxin control - Influence on necrotic enteritis risk Feed processing - Impact on rate of digestion
- Impact on viscosity of gut contents Particle size - Increased gizzard size
- Influence on gut microflora Whole wheat feeding - Increased gizzard size
- Influence on gut microflora Electrolyte balance - Influence on water intake Water composition/quality - Influence on water intake
c. Disease
Disease challenges will always be a part of livestock production. It is not within the remit of this paper to deal with the detail of disease control other than to say that in the modern poultry production environment the setting out and regular review of a comprehensive health plan is an essential part of the integrated approach required. Control of coccidiosis and the general monitoring of gut health is a vital part of successful broiler growing. The use of anti-coccidial products with good anti-clostridial properties has been an important part of this strategy.
d. Husbandry This is probably the most influential area that sadly receives the least attention. One of the observations when AGP’s were removed was that along with a general downturn in performance there was an increase in the spread of performance from best to worst farm. In many cases both farms have received the same chicks from the same hatchery and the same diets from the same feedmill and yet one farm will still consistently under perform compared to another. Differences of over 100 points on the European Efficiency Factor (EPEF) are not unusual, with the good farm making two to three times the return of the poor farm. Unfortunately understanding exactly what elements of management that make the good farm perform consistently well and the bad farm perform consistently poorly are not always easily apparent. Hygiene and biosecurity are certainly a factor. The build-up of micro-organisms in the environment is thought to be one of the predisposing factors for wet litter and performance problems in broilers (Hermans 2006). Broiler producers have made increased efforts to improve the hygiene standards at turnround and also the level of in-crop biosecurity. This has been further emphasised by the desire to control Campylobacter (Strydom 2015). Good farms will also tend to have a clear and well managed water sanitising system.
Aust. Poult. Sci. Symp. 2016.....27
210

Brooding set up and environmental control throughout the life of the flock should be part of the back to basics philosophy. Getting birds off to a good start has long been recognised as an important factor in overall broiler performance (Butcher 2002). The benefits of early feeding for example have been demonstrated on a number of occasions (Noy & Sklan 1999, Lamot 2014) and the interaction between incubation, brooding conditions and nutrition were highlighted by Molenaar et al., (2014). The use of competitive exclusion products in the hatchery is now becoming more commonplace than the use of therapeutic medication during the first days of a chick’s life. A good stockman is the most important asset within a broiler growing operation. They safeguard the welfare of the bird and the financial return of the farm. Ensuring that good stockmanship is a central part of any livestock operation is vital to the success of the industry in the light of the challenges that lay ahead.
V. CONCLUSIONS Removal of AGP’s from broiler diets needs to be carefully planned and executed. The European experience has shown that there is a danger of increased usage of therapeutic antibiotics in the absence of AGP’s. In Scandinavia it was felt that the ban was implemented too quickly and that insufficient time was allowed to adjust to the new situation (Wierup 2001). In the UK a similar rise in therapeutic antibiotic use was seen and broiler performance declined in the months following AGP removal. The term alternative growth promoter is unhelpful. Alternatives, or in reality feed additives need to be evaluated on the grounds of quality, safety and efficacy in their own right and not thought of as AGP replacers. Producing broilers in a non AGP environment requires an integrated approach that encompasses sound nutrition, good coccidiosis control and health management and above all good stockmanship.
REFERENCES Bedford M (2000) World’s Poultry Science Journal 56: 347-365. Butcher GD, Nilipour AH & Miles RD (2015) University of Florida IFAS Extension Report. Casewell MC, Friis E, Marco E, McMullin P & Phillips I (2003) Journal of Antimicrobial
Chemotherapy 52: 159-161. Castanon JIR (2007) Poultry Science 86: 2466-2471. Collett SR (2012) Animal Feed Science and Technology 173: 65-75. European Commission (2005) Press release database: http://europa.eu/rapid/press-
release_IP-05-1687_en.htm#fnB1 Hermans PG, Morgan KL, Fradkin D & Muchnik IB (2006) Veterinary Record 158: 615-622. Lamot DM, van de Linde IB, Molenaar R, van der Pol CW, Wijtten PJA, Kemp B & van den
Brand H (2014) Poultry Science 93: 2604-2614. Molenaar R, Gooding T, Lamot D, Wijtten PJA, van der Pol CW, Maatjens CM & van
Roovert-Reijrink IAM (2014) Australian Poultry Science Symposium 25: 17-20. Noy Y & Sklan D (1999) Journal of Applied Poultry Research 8: 16-24. Review on Antimicrobial Resistance (2015) Antimicrobials in Agriculture and the
Environment: Reducing Unnecessary Use and Waste http://amr-review.org/sites/default/files/Antimicrobials%20in%20agriculture%20and%20the%20environment%20-%20Reducing%20unnecessary%20use%20and%20waste.pdf
Ross Tech 99/37 (1999) Antibiotic Growth Promoters. Strydom W (2015) Nuffield Farming Scholarship Trust Report.
Aust. Poult. Sci. Symp. 2016.....27
211

Torok VA, Allison GE, Percy NJ, Ophel-Keller K & Hughes RJ (2011) Applied and Environmental Microbiology 77: 3380-3390.
Tierlynck E, Bjerrum L, Eeckhaut V, Huygebaert G, Pasmans F, Haesebrouck F, Dewulf J, Ducatelle R & van Immerseel F (2009) British Journal of Nutrition 102: 1453-1461.
Wierup M (2001) Microbial Drug Resistance 7: 183-190. Williams RB (2010) Avian Pathology 34: 159-180. Yegani M & Korver DR (2008) Poultry Science 87: 2052-2063.
Aust. Poult. Sci. Symp. 2016.....27
212

BIOMARKERS OF INCREASED INTESTINAL PERMEABILITY IN CHICKENS
S.S. GILANI1,4, R.E.A. FORDER1, G.S. HOWARTH1, R.J. HUGHES2, S.M. KITESSA3 and C.D. TRAN3
Summary
Lipopolysaccharide (LPS) was utilized to increase intestinal permeability (IP) in chickens, whilst lactulose, rhamnose and mannitol sugars (LMR) were investigated in two separate studies as potential biomarkers to assess IP. LPS at 0.5mg/kg body weight (BW) was injected intra-peritoneally at 16, 18 and 20 days of age. Blood samples were collected from 0 to 180 minutes following 19.5 hours fasting and oral sugar gavage. As no LPS effect was detected, a second study with higher LPS dose was conducted (1 mg/kg BW). In both studies, the effect of LPS on IP was not statistically significant whilst LMR in plasma peaked at 90-120 minutes. It was concluded that LMR sugars can be detected in chickens’ blood plasma. Further studies are required to determine if LMR is capable of detecting changes in IP.
I. INTRODUCTION
Increased intestinal permeability (IP) allows pathogens and toxins to pass through the tight junctions (TJ) of intestinal epithelial cells (Schokker, 2012). Lipopolysaccharide (LPS), a glycolipid found in the outer coat of mostly Gram-negative bacteria (Tran and Whitfield, 2009), has successfully induced systemic inflammation (SI) and increased IP in rats (Ruan et al., 2014), mice (Williams et al., 2013) and pigs (Zhu et al., 2013) through activation of nuclear factor kappa-β and tumour necrosis factor-α via toll like receptors. Chickens show a similar pattern regarding SI (Hu et al., 2012); however, information regarding IP in chickens is limited. LPS administered to chickens has been demonstrated to down-regulate ZO-2 mRNA (Zonula Occludens 1 & 2 – integral components of TJ proteins) (Wang et al., 2014) and to increase diamine oxidase (DAO) in serum (Wu et al., 2013) suggesting that LPS can be used to increase IP in chickens. The non-metabolisable sugars lactulose, rhamnose and mannitol (LMR) have been used as biomarkers of increased IP in rats (Ruan et al., 2014) and humans (Wang et al., 2015). Deficiencies in the literature regarding the impact of LPS in chickens and the associated utility of LMR sugars, has prompted the two studies reported here. Since ZO-1 and ZO-2 are integral components of TJ proteins, their presence in plasma could potentially be measured to assess increased IP. The aims of the current studies were to determine whether LPS at a dose of 0.5-1 mg/kg body weight could increase IP in chickens; and secondly, whether increased IP could be quantified by determining levels of LMR sugars in blood.
II. MATERIALS AND METHODS
Two separate studies were conducted (n = 36 birds each). In both studies, Ross 308 male chickens were reared in a floor pen and transferred to individual cages at day 16 of age (following two days’ adaptation). Peritoneal injection of LPS (E.coli O55:B5 – 0.5 to 1 mg/kg) or sterile saline were administered into the test and control groups, respectively.
1 The University of Adelaide; [email protected]; [email protected]; [email protected]
2 South Australian Research & Development Institute; [email protected] 3 Commonwealth Scientific and Industrial Research Organisation; [email protected];
[email protected] 4 Poultry CRC, PO Box U242, University of New England, Armidale, NSW 2351, Australia
Aust. Poult. Sci. Symp. 2016.....27
213

Following 19.5 hours of fasting (but access to water), birds were given an oral gavage of LMR sugar solution (2 ml/bird containing 0.5g L, 0.1g M and 0.1g R). A 2 ml blood sample was collected at 3 – 6 time points depending on each study. In the first study 36 birds were distributed into control and LPS groups and each group was further distributed into six time points (0, 30, 60, 90, 120 and 180 minutes; n = 3 birds/time point). In the second study 36 birds were distributed into three time points (60, 90 and 120 minutes; n = 6 birds/time point) as described above. LPS at 0.5 and 1 mg/kg was used in the first and second studies, respectively at 16, 18 and 20 days of age. Blood plasma samples were analysed using Dionex ICS-400 capillary HPIC system (High Performance Ion-exchange Chromatography) at the CSIRO laboratory (Adelaide, South Australia) for LMR. Additionally, ZO-1 proteins were analysed using an ELISA kit (MyBioSource Inc.), at 450nm wavelength. One way analysis of variance was used to analyse body weights and ZO-1 proteins; whilst analysis of covariance was used for LMR sugars.
III. RESULTS AND DISCUSSION
Table 1 shows the body weights of control and LPS treated birds in two phases of two separate experiments (16-18 days and 18-20 days of age as birds were weighed prior to the administration of treatments). The significant decrease in body weight (>25%) due to LPS treatment was consistent with previous studies in poultry (Hu et al., 2011) and pigs (Hou et al., 2010). Recent studies in poultry (Tan et al., 2014, Wang et al., 2014, Wu et al., 2013,) have shown that LPS induced systemic inflammation, which might cause reduced feed intake and hence reduced body weight. In the second phase of the study (18-20 days) LPS at a dose of 1mg/kg resulted in a numerically lower mean body weight; although this failed to achieve statistical significance.
Table 1 - Body weights in grams of 16 to 20 days old chickens (weighed every two days).
LPS (0.5 mg/kg) LPS (1 mg/kg) 16-18 days 18-20 days 16-18 days 18-20 days Mean + SD Mean + SD Mean + SD Mean + SD
Control 177.4 + 20.9 a 174.9 + 16.6 a 154.9 + 19.1 a 167.6 + 24.4 a LPS 143.4 + 28.8 b 157.0 + 14.9 b 114.7 + 28.5 b 152.7 + 30.3 a
Different superscripts within columns for control and LPS treatment show the statistically difference P < 0.05 The results of the LMR sugars analysis are shown in Figure 1. This was the first study
to utilise LPS in an attempt to increase IP and utilise LMR sugars as a biomarker of permeability in chickens, hence, there are no other studies to compare. However, the sugar method has been used in other species such as rats (Ruan et al., 2014), dogs (Sørensen et al., 1997), pigs (Wijtten et al., 2011) and humans (Wijck et al., 2011). In the current study, the results of the individual sugars for control and LPS treated groups did not differ statistically, presumably due to the low numbers of animals used in the treatment groups of this preliminary proof-of-concept study. Alternatively, LPS at doses of 0.5-1 mg/kg may have been insufficient to increase IP in chickens. On the other hand, recent studies have shown that fasting can increase IP in chickens (Kuttappan et al., 2015, Vicuna et al., 2015) suggesting that fasting in the current protocol may have masked any LPS effects (by increasing IP of the controls as well as of LPS group). Additionally, LMR sugars were readily absorbed from 30 minutes and decreased after 120 minutes. Results in Figure 1 also suggested that 90-120 minutes post oral gavage could be used in further studies using more blood samples at each time point to compensate for high variation in LMR. In time-course experiments in dogs and humans, these sugars peaked at 120 minutes comparable to the lactulose results in the current
Aust. Poult. Sci. Symp. 2016.....27
214

study, but not for rhamnose and mannitol. This suggested that rhamnose and mannitol could be more rapidly absorbed in chickens compared to dogs and humans.
Figure 1 - Sugars levels in chicken blood plasma analysed through HPIC
The mean + SD values for ZO-1 proteins for control (137.7 + 101.1) and LPS (129.5 + 68.8) did not differ (P > 0.05). ZO-1 and ZO-2 are the integral part of TJ and can be measured in blood. The blood samples were pooled for these analyses giving n = 15 birds/treatment, suggesting, that either LPS at 0.5-1 mg/kg did not increase IP or fasting masked the effects. This was the first time that ZO-1 was measured in chicken blood. Although ZO-1 can be detected in chicken blood plasma, further studies are needed for this test to be used in future.
IV. CONCLUSIONS
These preliminary studies revealed that LMR sugars and ZO-1 proteins could be measured in plasma of chickens. Additionally, the level of these sugars peaked at 90-120 minutes after oral gavage. However, LPS at a dose of 0.5-1 mg/kg failed to increase IP in chickens. Further work to test the hypothesis that fasting may be masking the effects of LPS is in progress. ACKNOWLEDGEMENTS: The authors would like to thank the Australian Poultry CRC for sponsoring this PhD project, SARDI for use of the animal facility and CSIRO (Adelaide, South Australia) for the HPIC analysis.
REFERENCES:
Chow JC, Young DW, Golenbock DT, Christ WJ & Gusovsky F (1999) Journal of Biological Chemistry 274: 10689-10692.
Denno DM, Vanbuskirk K, Nelson ZC, Musser CA, Hay Burgess DC & Tarr PI (2014) Clinical Infectious Diseases 59: S213-219.
Hu C, Song J, You Z, Luan Z & Li W (2012) Biological Trace Element Research 149: 190-196.
Hu X, Guo Y, Li J, Yan G, Bun S & Huang B (2011) Canadian Journal of Animal Science 91: 379-384.
0 5
10 15 20 25 30 35 40
0 50 100 150 200
Control
LPS Su
gars
in b
lood
pla
sma
in µ
mol
es
Time in minutes
Aust. Poult. Sci. Symp. 2016.....27
215

Kuttappan VA, Berghman LR, Vicuna EA, Latorre JD, Menconi A, Wolchok JD, Wolfenden AD, Faulkner OB, Tellez GI, Hargis, BM & Bielke LR (2015) Poultry Science 94: 1220-1226.
Ruan Z, Liu S, Zhou Y, Mi S, Liu G, Wu X, Yao K, Assaad H, Deng Z, Hou Y, Wu G & Yin Y (2014) PLoS ONE 9: e97815.
Schokker D (2012) PhD thesis (Wageningen University, The Netherlands) pp. 13-24. Sørensen SH, Proud FJ, Rutgers HC, Markwell P, Adam A & Batt RM (1997) Clinica
chimica acta 264: 103-115. Tan J, Liu S, Guo Y, Applegate TJ & Eicher SD (2014) British Journal of Nutrition 111:
1394-1404. Tran AX & Whitfield C (2009) Lipopolysaccharides (Endotoxins). In: Encyclopedia of
Microbiology (3rd ed.) (Eds. M Schaechter) pp. 513–528. Vicuna EA, Kuttappan VA, Tellez G, Hernandez-Velasco X, Seeber-Galarza R, Latorre JD,
Faulkner OB, Wolfenden AD, Hargis BM & Bielke LR (2015) Poultry Science 94: 1353-1359.
Wang L, Llorente C, Hartmann P, Yang AM, Chen P & Schnabl B (2015) Journal of Immunoogical Methods 421: 44-53.
Wang X, Shen J, Li S, Zhi L, Yang X & Yao J (2014) International Journal of Biological Macromolecules 69: 146-150.
Wijtten P, Verstijnen J, van Kempen T, Perdok H, Gort G & Verstegen M (2011) Journal of Animal Science 89: 1347-1357.
Williams JM, Duckworth CA, Watson AJ, Frey MR, Miguel JC, Burkitt MD, Sutton R, Hughes KR, Hall LJ, Caamano JH, Campbell BJ & Pritchard DM (2013) Disease Models and Mechanism 6: 1388-1399.
Wu QJ, Zhou YM, Wu YN, Zhang LL & Wang T (2013) Veterinary Immunology and Immunopathology 153: 70-76.
Zhu HL, Liu YL, Xie XL, Huang JJ & Hou YQ (2013) Innate Immunity 19: 242-252.
Aust. Poult. Sci. Symp. 2016.....27
216

DIETARY SUPPLEMENTATION OF CATHARANTHUS ROSEUS STIMULATES GUT PROTECTIVE MECHANISMS IN BROILERS
H. ZANEB1, S. ANWAR1, S. MASOOD1, A. IJAZ2, M.S. YOUSAF2, S. ASHRAF1
and H REHMAN2 Sub-therapeutic inclusion of antibiotic growth promoters has been used to promote growth and disease protection in broilers, a practice that may lead to development of antibiotic resistance and residues. Researchers, therefore, are exploring dietary phytogenic alternatives to promote broiler growth with the view to ensure food security. Such alternatives are selected for their antimicrobial, antiviral, antioxidant and immunomodulatory properties. Catharanthus roseus (CR) is one such plant that is widely grown around the world. Various parts of this plant have been positively evaluated for their antibacterial potential (Patil and Gosh, 2010). In this report, we assess in vivo protective effects of dietary C. roseus on broiler gut.
Day-old broilers (n = 112) were randomly divided into four groups, with four replicates (n=7) and kept at 26±2ºC and relative humidity of 65±5 %. One control and three treatment groups were fed antibiotics-free feed supplemented with 0, 0.05, 0.1 and 0.2 gm/kg leaf extract of C. roseus, respectively. On day 42, two birds from each replicate were decapitated and their intestines and bursa of Fabricius were collected. Tissues were processed through paraffin embedding technique and 4µ thick sections were stained with H&E for intraepithelial lymphocytes (IEL), counting and morphometry of cecal tonsillar nodules and bursal follicles. Another set of intestinal segments was stained with Alcian Blue-Periodic Acid Schiff technique for goblet cell differentiation. Data were analysed using ANOVA and Duncan Multiple Range test (P < 0.05) and presented as mean ± SD.
Body weights and FCR did not vary among groups. In ileum, count of acidic or mixed mucins was not affected by supplementation. However, when compared to control group, number of acidic mucins increased (P < 0.05) in all the supplemented groups in jejunum and in 0.05 and 0.1 mg/kg CR supplemented groups in duodenum. In duodenum, number of mixed mucins increased (P < 0.05) in 0.1 and 0.2 mg/kg CR supplemented groups when compared to control and 0.05 mg/kg CR groups. As the luminal goblet cells mature, their mucin undergoes a transition from being neutral to mixed to acidic in character, the later offering better protection against pathogenic microbes (Ashraf et al., 2011). In our study, supplementation appears to have stimulated goblet cell maturation and therefore enhanced protection in duodenum and jejunum. There was no effect of supplementation on count of IELs in any of the intestinal segment. Length of bursal follicles increased (P < 0.05) in 0.05 mg/kg CR supplemented group compared to the control group. In cecum, lymphatic nodular width and area increased (P < 0.05) in 0.2 mg/kg CR supplemented group when compared to other groups, an observation that may mean stimulation of local protective mechanisms.
Dietary supplementation of Catharanthus roseus presented a stimulus to protective cellular components of the broiler gut. Resultant acidic environment in the gut may better protect the mucosa from entry of pathogenic bacteria. However, bursal follicles were minimally simulated which may indicate a weak systemic effect. Ashraf S, Zaneb H, Yousaf MS, Ijaz A, Sohail MU, Muti S, Usman MM, Ijaz S & Rehman H
(2011) J. Anim. Physiol. Anim. Nutr. 97: 68-73. Patil PJ & Ghosh JS (2010) Brit. J. Pharm. Toxicol. 1: 40-44.
1 Department of Anatomy & Histology, University of Veterinary and Animal Sciences, Lahore, Pakistan; [email protected]
2 Department of Physiology, University of Veterinary and Animal Sciences, Lahore, Pakistan.
Aust. Poult. Sci. Symp. 2016.....27
217
bgei7997
Cross-Out

BACILLUS SUBTILIS IMPROVES PERFORMANCE OF BROILERS FED MEDICATED OR NON-MEDICATED FEED
L. RHAYAT1, V. JACQUIER1, E. DEVILLARD1 and P.A. GERAERT2
Animal digestive health is key to obtain optimal performance. Antibiotic growth promoters (AGPs) have long been shown to be very effective to develop and stabilize a healthy gastro-intestinal tract. Other types of additives are being increasingly documented for their effects on gut health and animal performance. Bacillus-based direct-fed microbials (DFMs) are of particular interest due to their ability to modify gut microbiota, act as a probiotic, and their ability to remain viable after pelleting.
The objective of the present experiment was to investigate the effect of Bacillus strain DSM 29784 on the performance of broilers compared to or in combination with bacitracin methylene disalicylate (BMD). A total of 2400 day-old male broiler chickens, Cobb 500, were randomly allocated according to a factorial design with four treatments (12 replicates of 50 birds) and reared until 35 days in floor pens. The experimental treatmentswere: T1, negative control (basal diet, corn-based); T2, T1 + BMD at 55 ppm; T3, T1 + Bacillus strain DSM 29870 at 5.108 CFU/kg of feed; T4, T1 + Bacillus strain DSM 29870 + BMD (5.108 CFU/kg of feed and 55 ppm, respectively). Feed intake (FI) and body weight gain (BWG) were measured at 21 and 35 days and feed conversion ratio (FCR) calculated.
Results, presented in Table 1, showed that at 21 days, the three treatments (groups T2, T3 and T4) significantly improved BWG and FCR (P < 0.05). There was also a numerical improvement when T4 was compared to T2 and T3. At d35, all treatments increased BWG, significantly (P < 0.05) for T3 and T4 with an improvement of 7.7% and 6.8%, respectively. T2 and T3 improved significantly (P < 0.001) the FCR by 3.3% and 3.7%, respectively. For T4, there was also a significant (P < 0.001) FCR improvement of 4.1%, with a numerical (P > 0.05) increase compared to T2 and T3.
Table 1 - Animal performances (0-35 days).
Performance Parameters
0-21 days 0-35 days T1 T2 T3 T4 T1 T2 T3 T4
FI, g/bird 1007a 1048a 1062a 1047a 3027a 3029a 3139a 3098a BWG, g/bird 615b 673a 672a 682a 1743b 1804ab 1878a 1861a FCR 1.63a 1.56bc 1.58b 1.54c 1.74a 1.68b 1.67b 1.66b
Data (n = 48) were subjected to an ANOVA, with complete randomized block design using the ANOVA procedure of XLSTAT (Addinsoft 1995-2014) to establish differences between diets. Pen was considered as the experimental unit. The model included diets (n=4) and block as fixed effect. Results are reported as least square means. LS means were assumed to be different at P < 0.05. Values with different letters (a, b, c) are significantly (P < 0.05) different from each other.
These results showed that Bacillus subtilis strain DSM 29784 improves broiler
performance, and the level of improvement is similar to that obtained with BMD. There were no antagonistic interaction between the two products and a trend for performance increase was obtained with the combination. In conclusion, Bacillus subtilis strain DSM 29784 can be added to non-medicated as well as medicated diets to improve broiler chicken performance.
1 Adisseo France S.A.S. CERN, Commentry, France; [email protected] 2 Adisseo France S.A.S. Antony, France.
Aust. Poult. Sci. Symp. 2016.....27
218

NOVEL BACILLUS SUBTILIS STRAIN BRINGS CONSISTENT IMPROVEMENT OF PERFORMANCE IN BROILERS
E. DEVILLARD1, P. NIELSEN2, A. NELSON3, L. RHAYAT1, V. JACQUIER1
and P.-A. GERAERT4
Summary The present study reports the results of a screening for novel natural Bacillus strains with relevant probiotic properties. Thus, a novel strain selected Bacillus subtilis DSM29784, was characterized phylogenetically and then studied for its effects on broiler performance. The phylogenetic studies suggest that this strain belongs to a new fourth subspecies within Bacillus subtilis. The specificity of Bacillus subtilis DSM29784 was further showed in broiler trials. When compared to strains belonging to the same species, Bacillus subtilis DSM29784 showed clearly different effects on broilers raised in standard or challenging conditions.
I. INTRODUCTION Gut health is a major factor to be taken into consideration for the optimum performance of birds. In broilers, as well as in all animal species and in humans, it is becoming increasingly clear that the intestinal microbiota mediates key physiological processes and by doing so are beneficial to their host. Probiotics are defined as live microorganisms that, when consumed in adequate amounts, confer a health benefit on the host. Bacillus is evolutionary relatively closely related to Lactobacillus (both groups are part of the Firmicutes phylum) (Vos et al., 2009). Both groups of bacteria are used as probiotics for animals as well as for humans. In contrast to Lactobacillus, the ability to form endospores makes Bacillus very attractive as probiotics. Indeed, the endospores are stable to passage of the stomach and tolerate bile salts and chemical and physical stresses allowing pelleting and storage over longer time. In poultry production different strains of Bacillus subtilis, Bacillus amyloliquefaciens and Bacillus licheniformis have been used for several years. Recently the first genome sequence of a gut strain of Bacillus subtilis was published (Schyns et al., 2013). It is now well accepted, that the probiotic effect of Bacillus probiotics is strain dependent. In the present study, we investigated the specificity of bacterial strains in term of phylogeny as well as effects on broilers raised in different conditions.
II. MATERIALS AND METHODS For the screening, strains from Novozymes extensive culture collection were used. More than 800 strains QPS and American GRAS/AAFCO listed were considered. Primarily Bacillus subtilis, Bacillus licheniformis, Bacillus amyloliquefaciens and Bacillus pumilus, which were independently isolated, were tested. The first selection criterion was the absence of beta-hemolysis assessed as previously recommended by EFSA on Tryptic Soy Agar + 5% sheep blood (EFSA, 2011). Second criterion was a radial diffusion assay testing for limitation of growth of a Clostridium perfringens.. The third criterion was compliance to EFSA guideline for antibiotic resistance (EFSA, 2012).
To study the phylogeny of the selected strain (Bacillus subtilis DSM29784), a comparative analysis of the gyrB gene sequences was performed. This was done essentially
1 Adisseo France S.A.S. CERN, Commentry, France; [email protected] 2 Novozymes A/S, Bagsvaerd, Danemark. 3 Novozymes Biologicals, Inc., Salem, VA, USA. 4 Adisseo France S.A.S. Antony, France.
Aust. Poult. Sci. Symp. 2016.....27
219

as previously for Bacillus subtilis and related strains using about 1200 nt partial gyrB gene sequences (Wang et al., 2007). For two strains of interest (Bacillus subtilis DSM29784 and Bacillus subtilis A), internal Novozymes gene sequences were used. Reference strains were included as valid subspecies of Bacillus subtilis (Bacillus subtilis subsp. spizizenii, Bacillus subtilis subsp. inaquosorum and Bacillus subtilis subsp. subtilis) and additional strains of the Bacillus subtilis group: Bacillus mojavensis, Bacillus amyloliquefaciens and as outgroup Bacillus licheniformis was used. The sequence of the gyrB genes of the reference strains were retrieved from the EMBL database. The sequences were aligned using the Clustal W and a phylogenetic tree was made based on distance matrix calculated with the Kimura distance formula using MegAlign (default settings, DNA STAR 7, Lasergene vers. 7.2.1).
Additionally, three broiler performance studies were conducted in three different research facilities in order to test different experimental environments and different broiler strains. The study design was the same for all studies, with three treatments (control group, control group supplemented with Bacillus subtilis A and control group supplemented with Bacillus subtilis DSM29784). The diets were similar between the studies and based on corn-soybean meal, but they differed by the presence or absence of animal by-products and of phytase. Diet nutrient levels were calculated to meet the minimum requirements of the animals, according to the relevant breeder recommendations. For each study, at day 0, male broilers were randomly assigned to pens and numbers of broilers per pen and pens per treatment were determined to allow statistical analyses. Animal performance was measured at day 28 and day 35. Moreover, the Bacillus strains were also tested in a performance study in challenging conditions. Chicks were first challenged with Eimeria maxima on day 14 and then challenged with Clostridium perfringens on days 19, 20, and 21. The diet used was an un-medicated commercial corn-soybean meal diet. Birds were housed in battery cages (8 birds each) and each treatment was replicated eight times. Four treatment groups included control (unchallenged, non-medicated), challenged and non-medicated, challenged + Bacitracin BMD50, and challenged + Bacillus subtilis DSM29784. Animal performance (feed intake, body weight and feed conversion) were determined at day 14, 21 and 28 of the study. At day 21, three birds from each cage were sacrificed, and examined for the lesion scores in the small intestine.
III. RESULTS
From more than 800 strains initially included in the screening, 32% were non haemolytic and about 10% of the isolates showed an anti-Clostridium perfringens activity, as measured in the in vitro assay. In fine, 26 isolates fulfilled both of the above criteria. When tested for susceptibility to antibiotics according to EFSA’s guideline only six strains met the criteria. One of these strains, Bacillus subtilis DSM29784 was selected for further testing.
The gyrB gene sequence analysis showed that Bacillus subtilis DSM29784 is different from the type strain of Bacillus subtilis at a level similar to the already known and described subspecies; Bacillus subtilis subsp. spizizenii, Bacillus subtilis subsp. inaquosorum. Bacillus subtilis DSM29784 showed highest degree of identity to Bacillus subtilis subsp. inaquosorum. Bacillus subtilis A showed close relatedness to the type strain of Bacillus subtilis. The gyrB gene analysis suggests that Bacillus subtilis DSM29784 is a novel subspecies of Bacillus subtilis.
Aust. Poult. Sci. Symp. 2016.....27
220

Figure 1 - Phylogenetic tree showing the relationship of Bacillus subtilis DMS29784 to reference strains of
Bacillus species. The three performance studies were analysed independently. In all studies, the effects
of the different Bacillus subtilis strains were more developed at day 35 than at day 28. Noticeably, at 35 days, depending on the study, the strains did not show the same efficacy to improve performance data (Table 1). Bacillus subtilis DSM29784 significantly improved the performance in the 3 studies, with an average improvement of 3.8% on BWG and 3.2% on FCR. Bacillus subtilis A was able to improve significantly BWG and/or FCR in only one of the studies (average improvement in the 3 studies: 1.7% for BWG and -2.2% for FCR).
Table 1 - Broiler performance at 35 days.
Trial 1 Trial 2 Trial 3 FI
(g) BWG
(g) FCR FI (g)
BWG (g) FCR FI
(g) BWG
(g) FCR
Control 3573a 2361b 1.513a 3217a 2019b 1.598a 3242a 1984ab 1.635a B. subtilis A 3541a 2398ab 1.477ab 3246a 2103ab 1.544b 3203a 1973b 1.624ab B. subtilis
DSM29784 3542a 2416a 1.467b 3288a 2162a 1.521b 3256a 2026a 1.607b
When tested in the well-established challenge animal model, Bacillus subtilis DSM29784 showed potential to restore animal performance, with no significant difference to the unchallenged animals, and to the level of the antibiotic treatment for BWG and FCR.
IV. DISCUSSION The screening showed that only a very low percentage of naturally occurring Bacillus strains fulfil the three criteria of the in vitro screening: lack of hemolysis indicating low negative interference with the host, anti-Clostridium perfringens activity, and safety regarding antibiotic resistance.
Bacillus subtilis is a bacterial species that covers quite extensive diversity, which have been acknowledged in a comparative analysis of genome sequences (Earl et al., 2008). As a consequence the species have currently been divided into three subspecies Bacillus subtilis subsp. subtilis, Bacillus subtilis subsp. spizizenii and Bacillus subtilis subsp. inaquosorum (Rooney et al., 2009). Bacillus subtilis A included in this study appears to belong to the fairly well described subspecies subtilis. The phylogenetic studies of Bacillus subtilis DSM29784 suggest that this strain belongs to a new fourth subspecies within Bacillus subtilis, but this will require further taxonomic and phylogenetic studies. The consistency
Aust. Poult. Sci. Symp. 2016.....27
221

seen in in vivo trials with Bacillus subtilis DSM29784 could suggest that this new subspecies of Bacillus subtilis behaves more naturally in the intestinal system of broiler chicken than already known strains of this species.
REFERENCES
Earl AM, Eppingerb M, Fricke W, Rosovitzc MJ, Raskob DA, Daugherty S, Losick R, Koltera R & Ravel J (2012) Journal of Bacteriology 194: 2378-2379.
EFSA Journal (2011) 9: 2445. EFSA Journal (2012) 10: 2740. Rooney AP, Price NPJ, Ehrhardt C, Swezey JL & Bannan JD (2009) International Journal of
Systematic and Evolutionary Microbiology 59: 2429-2436. Schyns G, Serra CR, Lapointe T, Pereira-Leal JB, Potot S, Fickers P, Perkins JB, Wyss M &
Henriques AO (2009) In: Bergey's Manual of Systematic Bacteriology Vol 3: The Firmicutes. (Eds. Vos P, Garrity G, Jones D, Krieg NR, Ludwig W, Rainey FA, Schleifer KH & Whitman W).
Wang LT, Lee FL, Tai CJ & Kasai H (2007) International Journal of Systematic and Evolutionary Microbiology 57: 1846-1850.
Aust. Poult. Sci. Symp. 2016.....27
222

INFLUENCE OF WHOLE WHEAT INCLUSION AND EXOGENOUS ENZYME SUPPLEMENTATION ON GROWTH PERFORMANCE AND NUTRIENT
UTILISATION IN BROILER STARTERS
M.R. ABDOLLAHI1, A.M. AMERAH2 and V. RAVINDRAN1
Summary The present experiment investigated the interaction between method of wheat inclusion and exogenous enzyme supplementation on growth performance and nutrient utilisation of broiler starters. A 3 × 3 factorial arrangement of treatments was used with three methods of wheat inclusion (622 g/kg ground wheat [GW], 250 g/kg whole wheat replaced GW (wt/wt) pre-pelleting [PRP] or post-pelleting [PSP]) and three enzymes (xylanase, phytase, and xylanase plus phytase). Birds fed PRP diets gained more (P < 0.05) weight than those fed GW and PSP diets. Birds fed diets supplemented with xylanase + phytase had weight gains similar (P > 0.05) to those fed phytase added diets but higher (P < 0.05) than xylanase added diets. Feeding PSP diets reduced (P < 0.05) feed intake compared with GW and PRP diets. A significant (P < 0.01) interaction between method of wheat inclusion and enzyme was observed for gain per feed. Post-pelleting whole wheat inclusion increased (P < 0.05) nitrogen (N) and fat digestibility. Feeding GW and PSP diets resulted in the lowest and highest apparent metabolisable energy (AME) values, respectively, with PRP diets being intermediate. Combination of the enzymes resulted in higher (P < 0.05) N and fat digestibility and yielded more (P < 0.05) AME than that of individually added xylanase or phytase. Overall, the current results suggest that combination of whole wheat inclusion and fibre degrading enzymes and phytase, can be applied to enhance nutrient utilisation in wheat-based pelleted diets.
I. INTRODUCTION Despite increasing commercial adoption of feeding whole grains, usually whole wheat (WW), to broilers, its effects on growth performance remain contradictory because of conflicting data that has been generated. These inconsistent outcomes are due to differences in experimental methodology, including differences in feed form, inclusion level of WW, age of birds at introduction of WW, previous training and quality of grain (Singh et al., 2014). The benefits associated with WW feeding are mediated largely by the development and functionality of the gizzard. Xylanase and phytase are the most commonly used enzymes in poultry feeds, with the former being able to cleave the non-starch polysaccharides (NSP) in viscous cereal grains and the latter with the ability to hydrolyse phytate complexes in plant feedstuffs (Selle and Ravindran, 2007). However, the activity of these enzymes within the digestive tract of broilers is subject to physiological limits imposed by the pH and digesta retention time (Ravindran, 2013). The present study was therefore designed to investigate whether combination of techniques by which upper gut development may improve, and the inclusion of exogenous enzymes, would be more beneficial in improving nutrient utilisation. An experiment was conducted to determine the influence of WW inclusion and NSP-degrading enzymes and/or phytase on the growth performance, nutrient digestibility and energy utilisation in broilers.
1 Institute of Veterinary, Animal and Biomedical Sciences, Massey University, Palmerston North 4442, New Zealand; [email protected]
2 Danisco Animal Nutrition - DuPont Industrial Biosciences, Marlborough, Wiltshire, SN8 1XN, UK.
Aust. Poult. Sci. Symp. 2016.....27
223

II. MATERIALS AND METHODS The experimental design was a 3 × 3 factorial arrangement of treatments with three methods of wheat inclusion (622 g/kg ground wheat [GW], 250 g/kg whole wheat replaced GW (wt/wt) pre-pelleting [PRP] or post-pelleting [PSP]) and three enzymes (xylanase, phytase, and xylanase plus phytase). Xylanase (Danisco Xylanase; activity, 40000 XU/g) and phytase (Axtra PHY® 10000 TPT; activity, 10000 FTU/g) were supplied by Danisco Animal Nutrition-DuPont Industrial Biosciences, Marlborough, UK. Xylanase and phytase were in powder and granular forms, respectively, and both added at the level recommended by the manufacturer (50 g/t of feed). Whole wheat was ground in a hammer mill to pass through a screen size of 4.0 mm. A basal diet based on wheat plus soybean meal, was formulated to meet the Ross 308 strain recommendations for major nutrients for broiler starters (Ross, 2007). All diets contained titanium dioxide as an indigestible marker. Each diet was steam-conditioned at 70 ºC and pelleted using a pellet mill equipped with a die ring with 3-mm holes and 35-mm thickness. Each of the nine dietary treatments was offered ad libitum to six replicate cages (eight birds per cage). To ensure that the birds were able to ingest WW, the birds in PSP treatment were fed the PRP diets for the first 10 d and then were offered the PSP diet (11 to 21 d). Body weights and feed intake (FI) were recorded on a cage basis at d 10 and 21. From d 17 to 20 post-hatch, FI and excreta output was measured quantitatively per cage for the determination of apparent metabolisable energy (AME). On d 21, ileal digesta were collected for determination of apparent ileal digestibility (CAID) of N, starch and fat, and the empty weight of proventriculus and gizzard of individual birds were determined.
III. RESULTS AND DISCUSSION Birds fed PRP diets gained more (P < 0.05) weight than those fed GW and PSP diets (Table 1). Weight gain of birds fed diets supplemented with xylanase + phytase was similar (P > 0.05) to those fed phytase added diets, but higher (P < 0.05) than xylanase added diets. Feeding PSP diets reduced (P < 0.05) FI compared with GW and PRP diets. Birds fed phytase or xylanase supplemented diets had the highest and lowest FI, respectively, with those fed xylanase + phytase supplemented diets being intermediate. A significant (P < 0.01) interaction between method of wheat inclusion and enzyme was observed for gain per feed (G:F). In GW diets, xylanase or xylanase + phytase added diets showed similar G:F but higher than phytase added diet. In PRP diets, the highest G:F was achieved with combination of the enzymes, followed by xylanase or phytase added diets, respectively. Enzyme combination resulted in similar G:F in PSP diets.
Post-pelleting WW inclusion increased (P < 0.05) N and fat digestibility compared to GW and PRP diets. Combination of the enzymes resulted in higher (P < 0.05) CAID of N and fat than those of individually added xylanase or phytase. In GW diets, combination of xylanase and phytase resulted in similar (P > 0.05) starch digestibility to xylanase added diet but higher (P < 0.05) than phytase supplemented diet. In PRP diets, the highest (P < 0.05) CAID of starch was observed with combination of the enzymes. Different enzyme mixtures resulted in similar (P > 0.05) CAID of starch in PSP diets. Feeding GW and PSP diets resulted in the lowest and the highest AME values, respectively, with PRP diets being intermediate. Combination of xylanase and phytase enhanced AME (P < 0.05) compared to the diets with individual addition of xylanase or phytase. Birds fed PSP diets had higher (P < 0.05) relative proventriculus and gizzard weights than those fed GW and PRP diets.
Feeding PSP diets decreased FI and, as a consequence, weight gain was reduced compared to PRP diets. The depression in FI of birds fed PSP diets was associated with significant increases in proventriculus (10.3%) and gizzard (95.2%) weights, compared to GW diets. A review of available literature (Singh et al., 2014) indicates that post-pelleting
Aust. Poult. Sci. Symp. 2016.....27
224

WW inclusion either had no effect on FI or decreased the FI. In the present study, G:F responses to the enzyme mixtures were influenced by the method of WW inclusion. Xylanase and phytase combination, although improved G:F in both GW (only when compared to phytase addition) and PRP diets, but the effect was more pronounced in the latter diets. In PSP diets, different enzyme mixtures resulted in similar G:F. In contrast, Wu et al. (2004) reported that xylanase supplementation improved feed efficiency, irrespective of wheat form used (GW, 200 g/kg pre- or post-pelleting WW inclusion).
The lack of response of proventriculus and gizzard size to PRP diets in the current study is in agreement with the report by Wu et al. (2004) and corroborates the assumption that the increase in proportion of coarse particles in PRP diets was not enough to stimulate gizzard development, at least in size. In contrast, Jones and Taylor (2001) and Taylor and Jones (2004), found that pre-pelleting inclusion of 200 g/kg WW increased relative gizzard weighs by 11 and 8.0%, respectively, with no effects on weight gain and feed efficiency. The WW inclusion level, particle size of GW diets (which pre-pelleting WW diets have been compared to), and the hardness of WW may be, in part, responsible for these equivocal results.
Pre-pelleting WW inclusion had no effect but PSP improved CAID of N and fat. Whereas replacing GW with WW, either pre- or post-pelleting, improved AME; greater responses were observed with PSP diets (14.51 MJ/kg) compared to PRP diets (14.02 MJ/kg). Higher feed efficiencies in xylanase + phytase supplemented PRP and PSP diets showed that combination of WW inclusion, and NSP-degrading enzymes and phytase, by which upper gut development and the soluble NSP degradation may improve, can be applied to enhance nutrient digestibility and energy utilisation in wheat-based pelleted diets. A reduction in FI, however, is the possible disadvantage of post-pelleting WW inclusion.
REFERENCES
Jones GPD & Taylor RD (2001) British Poultry Science 42: 477-483. Ravindran V (2013) Journal of Applied Poultry Research 22: 628-636. Ross (2007) Ross Breeders Limited (Newbridge, Midlothian, Scotland, UK). Selle PH & Ravindran V (2007) Animal Feed Science and Technology 135: 1-41. Singh Y, Amerah AM & Ravindran V (2014) Animal Feed Science and Technology 190: 1-
18. Taylor RD & Jones GPD (2004) British Poultry Science 45: 237-246. Wu YB, Ravindran V, Thomas DG, Birtles MJ & Hendriks WH (2004) British Poultry
Science 45: 385-394.
Aust. Poult. Sci. Symp. 2016.....27
225

Table 1 - Influence of different method of wheat inclusion and enzyme mixture on weight gain (g/bird), feed intake (g/bird), gain per feed (g/g), apparent ileal digestibility coefficients (CAID) of nitrogen (N), starch and fat, apparent metabolisable energy (AME; MJ/kg dry matter), and relative empty weight of
proventriculus and gizzard (g/kg body weight) in broiler starters (0-21 d)1.
Wheat inclusion Enzyme Weight Gain
Feed Intake
Gain per Feed
CAID of N
CAID of Starch
CAID of Fat AME Proventriculus
Weight2 Gizzard Weight2
Ground wheat Xylanase 1064 1389 0.760d 0.780 0.911cd 0.834 13.68 3.61 7.65 Phytase 1070 1450 0.737e 0.776 0.888d 0.843 13.39 3.80 8.26 Xyl + Phy 1097 1425 0.762cd 0.798 0.931c 0.882 13.78 3.64 7.91 Pre-pelleting Xylanase 1096 1422 0.770bc 0.771 0.895d 0.820 13.89 3.73 8.18 Phytase 1098 1454 0.754d 0.773 0.890d 0.780 13.87 3.75 8.47 Xyl + Phy 1117 1411 0.784a 0.813 0.963b 0.886 14.29 3.85 8.86 Post-pelleting Xylanase 1033 1317 0.773b 0.823 0.994a 0.890 14.54 4.22 15.2 Phytase 1078 1390 0.771bc 0.821 0.992a 0.889 14.48 4.00 15.6 Xyl + Phy 1076 1377 0.776ab 0.830 0.993a 0.888 14.52 3.96 15.8 Pooled SEM 10.8 15.5 0.0033 0.0093 0.0088 0.0212 0.088 0.130 0.476 Main effects Wheat inclusion
Ground wheat 1077b 1421a 0.753 0.785b 0.910 0.853b 13.62
3.68b 7.94b Pre-pelleting 1104a 1429a 0.769 0.785b 0.916 0.828b 14.02
3.77b 8.50b
Post-pelleting 1062b 1362b 0.773 0.825a 0.993 0.889a 14.51
4.06a 15.5a Enzyme
Xylanase 1064b 1376c 0.768 0.791b 0.933 0.848b 14.04
3.85 10.3 Phytase 1082ab 1431a 0.754 0.790b 0.923 0.837b 13.91
3.85 10.8
Xyl + Phy 1096a 1404b 0.774 0.814a 0.962 0.885a 14.20
3.82 10.8 Probabilities, P ≤ Wheat inclusion *** *** *** *** *** ** *** ** *** Enzyme ** *** *** ** *** * ** NS NS Wheat inclusion x Enzyme NS NS ** NS *** NS 0.07 NS NS
a,b,c,d,e Means in a column not sharing a common superscript are significantly different (P < 0.05). NS, not significant; * P < 0.05; ** P < 0.01; *** P < 0.001. 1Each value represents the mean of six replicates (eight birds per replicate). 2Each value represents the mean of six replicates (two birds per replicate).
Aust. Poult. Sci. Symp. 2016.....27

INFLUENCE OF FEED INGREDIENTS ON PHYSICAL PELLET QUALITY AND GROWTH PERFORMANCE IN BROILER CHICKENS
A. MORADI1, S. MORADI1 and M.R. ABDOLLAHI2
Summary
An experiment was conducted to evaluate the effects of feed ingredients on pellet quality and growth performance in broiler chickens from 1 to 42 days of age. A total of 504, one-day-old male broilers (Ross 308) were allocated to 42 pens (12 broilers per pen). Treatments were as follow: control group (based on maize and soybean meal), sodium bentonite (10 and 20 g/kg), wheat gluten (10 and 20 g/kg) and wheat (100 and 200 g/kg). All diets were equivalent in respect of metabolisable energy, protein and amino acids. All ingredients significantly increased (P < 0.05) pellet durability index (PDI) compared with control diet. Wheat gluten and wheat at either inclusion were more efficient than sodium bentonite in improving pellet hardness, and the highest PDI and pellet hardness achieved with inclusion of 20 g/kg wheat gluten. Over the entire trial period of 42 d, chickens fed diets containing 10 g/kg wheat gluten and 100 and 200 g/kg wheat gained significantly more (P < 0.05) weight than control. In conclusion, inclusion of 10 g/kg wheat gluten, and 100 and 200 g/kg of wheat improved pellet quality, and increased body weight in broilers over the whole trial period.
I. INTRODUCTION
Feed is the greatest cost item in broiler production representing 60-70% of the total production cost; feed processing further add to the cost of feed. However, feed processing provides an opportunity to improve broiler performance. Today, pelleting is the most common thermal processing method in the production of poultry feed. Offering feed to poultry in pellet form enhances the economics of production by increasing the feed intake (FI), and thus growth performance and feed efficiency. However, only feeding pelleted diets is not enough to achieve higher performance in broiler industry; the physical quality of pellets should also be considered. Physical pellet quality is defined as the ability of pellet to withstand fragmentation and abrasion during mechanical and pneumatic handling without breaking up and to reach feeders without generating a high proportion of fines (Amerah et al., 2007). Scheideler (1991) found that feed efficiency increased by 2.4% when broilers were fed a composition of 75% pellets and 25% fines compared with 25% pellets and 75% fines. Feed ingredients influence pellet quality in different ways. Winowiski (1988) increased the proportion of wheat (from 0 to 600 g/kg) in diets by directly displacing maize without balancing the nutrients, and reported an improved pellet durability index (PDI) from 32 (68% fines) to 73 (27% fines). The objective of the present study was to evaluate the effects of adding different inclusion of sodium bentonite, wheat gluten and wheat on physical quality of pellets and growth performance in broiler chickens from 1 to 42 days of age.
II. MATERIALS AND METHODS
A total of 504, one-day-old male broilers (Ross 308) were allocated, in a completely randomized design, to 42 pens (12 broilers per pen). Treatments were as follow: control group (based on maize and soybean meal), sodium bentonite (10 and 20 g/kg), wheat gluten
1 Department of Animal Science, Faculty of Agriculture and Natural Resources, Razi University, Kermanshah, Iran.
2 Institute of Veterinary, Animal and Biomedical Sciences, Massey University, Palmerston North, New Zealand; [email protected]
Aust. Poult. Sci. Symp. 2016.....27
227

(10 and 20 g/kg) and wheat (100 and 200 g/kg). All diets were equivalent in respect of metabolisable energy, protein and amino acids. The ingredients were ground through a 2-mm sieve in a hammer mill, mixed, and pelleted at 80 °C. The pellet diameter was 2.5 mm for the starter (1-21 d) and 4.0 mm for the finisher diets (22-42 d). Body weight and FI were recorded on a pen basis at weekly intervals. Feed conversion ratios were corrected for the body weight of any bird that died during the course of the experiment. Pellet durability was measured for 30 s using a Holmen pellet tester (NHP 100 Holmen). Pellet hardness was determined by Kahl device (Amandus Kahl). The data were analysed by a one-way ANOVA using the General Linear Models procedure of the SAS Institute Inc. (2004). Differences were considered to be significant at P < 0.05.
III. RESULTS AND DISCUSSION
The pellet durability test showed that all tested ingredients, when added to the diet, significantly increased (P < 0.05) PDI compared with control in starter and finisher diets (Table 1). In starter diets, wheat gluten and wheat at either inclusion significantly (P < 0.05) elevated hardness. In finisher diets, all diets except the one with 10 g/kg sodium bentonite were harder (P < 0.05) than the control diet. In both starter and finisher diets, the highest pellet hardness achieved with inclusion of 20 g/kg wheat gluten followed by the diet containing 200 g/kg wheat.
Birds received diets containing 10 g/kg wheat gluten and 200 g/kg wheat had higher (P < 0.05) weight gain compared to those fed the control diet from d 1 to 21 (Table 2). Dietary treatments had no significant (P > 0.05) effect on weight gain from d 22 to 42. Over the entire trial period of 42 d, chickens fed diets containing 10 g/kg wheat gluten and 100 and 200 g/kg wheat gained significantly more (P < 0.05) weight than the control.
Birds fed the diet containing 200 g/kg wheat consumed more (P < 0.05) feed than those fed control diet during the starter period (1 to 21 d). Feed intake was not influenced (P > 0.05) by the dietary treatments during the finisher period (21 to 42 d), and over the entire trial period (1- to 42 d). There was no significant effect (P > 0.05) of dietary treatments on feed per gain.
Feed ingredients incorporated into the broiler diet influence pellet quality in different ways. In this study, inclusion of sodium bentonite in starter and finisher diets improved PDI and hardness (only at 20 g/kg in finisher diet), a finding that agrees with the study by Pfost (1964) demonstrating that addition of lignin pellet binder (calcium lignosulphonate) improved pellet durability. It has been suggested that proteins derived from plant sources such as wheat will improve physical pellet quality (Briggs et al., 1999). An increase in PDI and pellet hardness resulting from dietary inclusion of wheat gluten and wheat agrees with findings by Winowiski (1988) reporting that increasing the proportion of wheat (from 0 to 600 g/kg) in diets by directly displacing maize improved PDI from 32 (68% fines) to 73 (27% fines). It has been suggested wheat has a higher dough-forming capability than maize due to higher concentrations of gluten proteins and pentosan/hexosan hemicelluloses that serve as good pellet binder (Jensen, 2000). Hydration and partial denaturation of the protein (gluten) fraction of wheat during feed processing, may account for the positive effect of wheat and wheat gluten on physical quality of pelleted diets (wood, 1987). Denaturised proteins with a strong gelling property, would possibly contribute towards a more durable pellet. The importance of the feeding high physical quality pellets on bird’s performance is well recognised and the current work confirmed that in terms of higher weight gain. In the current study, diets containing 10 g/kg wheat gluten, and 100 and 200 g/kg wheat, resulted in higher overall weight gain, and associated with improved PDI and pellet hardness. High
Aust. Poult. Sci. Symp. 2016.....27
228

quality pellets reduce the energy expenditure for ingestion, creating the potential to decrease energy requirements for maintenance (Moran, 1989). Abdollahi et al. (2012) reported that addition of pellet binder and moisture, individually or in combination, to broiler diets whilst improved pellet durability and hardness, had no effect on the growth response of birds. The lack of significant effect of sodium bentonite inclusion on weight gain in the current study, despite having positive effects on pellet quality, might suggest that improvements in pellet quality should be in such an extent capable to positively affect the growth response. In conclusion, inclusion of 10 g/kg wheat gluten, and 100 and 200 g/kg of wheat improved pellet quality, and increased body weight in broilers over the whole trial period.
REFERENCES Abdollahi MR, Ravindran V, Wester TJ, Ravindran G & Thomas DV (2012) Animal Feed
Science and Technology 175: 150-157. Amerah AM, Ravindran V & Lentle RG (2007) World’s Poultry Science Journal 63: 439-
451. Briggs JL, Maier DE, Watkins BA & Behnke KC (1999) Poultry Science 78: 1464-1471. Jensen LS (2000) Asian-Australasian Journal of Animal Science 13: 35-46. Moran ET (1989) In: Recent Advances in Animal Nutrition. Butterworth, London. Pfost HB (1964) Feedstuffs 36: 20. Scheideler SE (1991) Feed Management 46: 21. Winowiski T (1998) Feed Management 49: 23-26. Wood JF (1987) Animal Feed Science and Technology 18: 1-17.
Aust. Poult. Sci. Symp. 2016.....27
229

Table 1 - Influence of different feed ingredients on physical pellet quality.
Dietary treatments PDI1 Pellet hardness2
Starter Finisher Starter Finisher Control 88.6e 76.1d 4.75d 5.52d
Sodium bentonite, 10 g/kg 90.5d 86.4c 5.01dc 4.90d Sodium bentonite, 20 g/kg 91.5c 90.1b 5.05dc 6.0c
Wheat gluten, 10 g/kg 94.7a 90.7b 5.52c 6.30bc Wheat gluten, 20 g/kg 95.5a 93.0a 7.70a 7.30a
Wheat, 100 g/kg 92.3bc 90.6b 5.47c 6.37bc Wheat, 200 g/kg 92.7b 93.6a 6.33b 6.77ab Probabilities, P ≤ 0.001 0.001 0.001 0.001
SEM3 0.26 0.21 0.22 0.20 1Each value represents the mean of 6 analytical replicates. 2Each value represents the mean of 15 analytical replicates. 3Pooled standard error of mean.
Table 2 - Influence of different feed ingredients on weight gain (g/bird), feed intake (g/bird) and feed per gain (g feed/g gain) in broilers1.
Dietary treatments Weight gain Feed intake Feed per gain 1-21 d 22-42 d 1-42 d 1-21 d 22-42 d 1-42 d 1-21 d 22-42 d 1-42 d
Control 828c 1645 2473c 1103bc 3182 4286 1.330 1.944 1.736 Sodium bentonite, 10 g/kg 818bc 1722 2541bc 1073c 3209 4282 1.318 1.866 1.684 Sodium bentonite, 20 g/kg 844bc 1686 2531bc 1142ab 3174 4317 1.354 1.890 1.712
Wheat gluten, 10 g/kg 888ab 1772 2661ab 1115bc 3165 4280 1.255 1.796 1.613 Wheat gluten, 20 g/kg 852bc 1730 2582abc 1107bc 3232 4338 1.300 1.868 1.681
Wheat, 100 g/kg 849bc 1793 2642ab 1142ab 3210 4353 1.346 1.793 1.648 Wheat, 200 g/kg 902a 1797 2699a 1174a 3297 4472 1.305 1.838 1.655 Probabilities, P ≤ 0.003 0.180 0.010 0.010 0.780 0.370 0.10 0.50 0.10
SEM P
2 12.4 44.2 42.3 17.3 58.4 51.3 0.022 0.055 0.030 P
1PEach value represents the mean of six replicates (12 birds per replicate).
P
2PPooled standard error of mean.
Aust. Poult. Sci. Symp. 2016.....27

EFFECT OF PELLETING TEMPERATURE AND ENZYME SUPPLEMENTATION ON THE PERFORMANCE OF BROILERS FED A WHEAT-BASED DIET
G.A. GOMES1, H. GRAHAM1, G. GONZÁLEZ-ORTIZ1, R.A.H.M. TEN DOESCHATE1,
M. HEJDYSZ2, A. RUTKOWSKI2 and S. KACZMAREK2
Summary
The aim of this study was to evaluate the effect of pelleting temperature on recovery of different carbohydrase products, and how this would impact on broiler performance. Nine-hundred and sixty male Ross 308 broilers (1-day-old) were distributed to 12 experimental diets with 10 pen replicates each. The trial was designed as a factorial arrangement with four enzymes (Control, Xylanase E, Multi-enzyme R and Xylanase B) and three pelleting temperatures (80, 85 and 90ºC). The diets were based on wheat, soybean-meal and rye, and fed ad libitum in two phases, from 1 to 21d (starter) and 22 to 35d (grower). Body weight gain (BWG) and feed intake (FI) were measured and feed conversion ratio corrected for mortality (mFCR) and body weight gain (bwcFCR). Additionally, ileal digesta viscosity was measured at the end of the trial. Statistical comparisons were performed by using a two-way ANOVA (JMP Pro 12). No interactions were observed in any of the animal performance parameters evaluated over the whole experimental period. Pelleting temperature did not significantly influence the efficacy of any of the carbohydrases tested, but statistical effects (P < 0.05) of enzyme on BWG, FI and bwcFCR were observed. Body weight corrected FCR for diets supplemented with Xylanase E were unaffected by pelleting temperatures, but was increased by approximately 14 points with higher pelleting temperatures in diets supplemented with Multi-enzyme R and Xylanase B. Ileal digesta viscosity showed an interaction between the main factors (P < 0.01). Pelleting temperatures above 80ºC led to higher digesta viscosity when diets were manufactured with Multi-enzyme R and Xylanase B. In contrast, applying higher pelleting temperatures in diets containing Xylanase E led to significant reductions in the viscosity of the ileal digesta (P < 0.05). Xylanase E was the only enzyme that was not affected by pelleting temperature, therefore increasing bird performance and reducing the ileal viscosity to a greater extent than Multi-enzyme R and Xylanase B. This effect becoming more pronounced at higher pelleting temperatures.
I. INTRODUCTION
The number of commercial enzyme products has increased considerably in the past decades. Some of these products have been designed to be intrinsically thermostable, but the stability of added feed enzymes through the pelleting process continues to be a major concern for feed manufacturers, as processing can significantly reduce activity (Silversides and Bedford, 1999). Technological processes such as hydrophobic coating have coevolved to protect enzymes through the pelleting processes. This study was designed to evaluate the effect of feed pelleting temperature on recovery of different commercial enzyme products, and how this impacts on digesta viscosity and broiler performance.
II. MATERIALS AND METHODS A total of 960 day-old male broiler chicks (Ross 308) obtained from a commercial hatchery were used in the study. Birds were randomly distributed in a randomized complete-block
1AB Vista, Marlborough, Wiltshire, SN8 4AN, UK; [email protected] 2Poznań University of Life Sciences, Poznań, Poland.
Aust. Poult. Sci. Symp. 2016.....27
231

design to 12 experimental diets and 10 pen replicates (8 birds per replicate). Throughout the study, feed and water were supplied ad libitum, and animals were raised under controlled light and temperature, as recommended by the breeder. Basal starter (1-21 days) and grower (22-35 days) diets were based on wheat, soybean-meal, with rye included to slightly increase gut viscosity (Table 1).
Table 1 - Formulation and calculated nutrients in the basal diets.
Diet formulation [g/kg] Nutrient concentration [g/kg] Starter Grower Starter Grower
Wheat 466.8 512.5 Crude protein 222.8 197.5 Soybean meal 47 305.8 252.8 Crude fat 59.4 97.3 Rye 100.0 100.0 Crude fibre 26.1 23.6 Full-fat soya 50.0 25.0 Calcium 10 7.5 Soya oil 19.0 47.7 Total Phosphorous 7.6 6.1 Fat (lard) 10.0 25.0 Av Phosphorous 4.8 3.5 Monocalcium phosphate 15.7 10.5 Dig. Lys 12.7 9.7
Limestone 15.5 11.9 Dig. Met + Cys 8.9 7.9 Salt 1.6 2.3 Dig. Thr 7.9 6.7 Sodium bicarbonate 3.1 2.1 Dig. Trp 2.5 2.1 L-Lysine HCl 3.1 1.4 Dig. Iso 8.4 7.1 DL-Methionine 2.9 2.5 Dig. Val 9.0 7.8 L-Threonine 0.8 0.7 Dig. Leu 14.4 12.4 Vit-Min Premix 5.0 5.0 Dig. Phe + Tyr 16.4 14.0
Enzymes 0.05-0.1
0.05-0.1 Dig. His 5.0 4.3
Maxiban G16 0.6 - Dig. Arg 13.3 11.2 Elancoban G200 - 0.5 AME [MJ/kg] 12.6 13.3
A 3 x 4 factorial design was employed, with three pelleting temperatures (80ºC, 85ºC
and 90ºC), with a conditioning time of around 20 seconds. Three different commercial enzyme products at recommended dose rates plus unsupplemented controls were used. The enzyme products tested were a non-encapsulated intrinsically thermostable Trichoderma xylanase (Xylanase E - dosed at 100 g/tonne), an encapsulated Penicillium multi-carbohydrase preparation (Multi-enzyme R, containing primarily xylanase and ß-glucanase but claiming a number of other secondary activities - dosed at 50 g/tonne) and a non-encapsulated thermostable Bacillus xylanase (Xylanase B - dosed at 100 g/tonne). Diets for the starter period were crumbled following pelleting. All feeds were sampled and analysed for xylanase activity in a feed extract using Xylazyme tablets (Megazyme, Ireland) at pH 5.0 and 50°C. Analysis was performed in duplicate for each sample and each feeding phase, and results are expressed as the average of the four results, using results of 80˚C processed feeds as a reference for each enzyme.
Total pen weights and the residual feed at the end of each phase (21 and 35 days old) were recorded to calculate body weight gain (BWG), total feed intake (FI) and feed conversion ratio (FCR; g feed/g body weight). At the end of the grower phase, FCR was corrected for mortality (mFCR) and body weight gain (bwcFCR), where 27g of weight gain was considered equivalent to 1 point of FCR. On Day 35, 10 animals from each treatment (one per replicate) were slaughtered by cervical dislocation. After dissection, 2 g of ileal digesta was collected and immediately placed in a micro-centrifuge tube and centrifuged at 12,700 x g for 5 min. The supernatant was withdrawn and stored on ice until viscosity could
Aust. Poult. Sci. Symp. 2016.....27
232

be determined using a cone/plate viscometer (Brookfield Engineering Laboratories Inc., Stoughton, MA, USA) at a shear rate of 42.5 sec-1 at 40˚C (Bedford & Classen, 1992). A two-way analysis of variance (ANOVA) was conducted taking the enzyme product and pelleting temperature as independent variables and BWG, FI, FCR, mFCR, bwcFCR and digesta viscosity as dependent variables (JMP Pro 12). Level of significance was indicated by probability of less than 5%. The t-Student test was used to differentiate between mean values.
III. RESULTS AND DISCUSSION
In-feed enzyme analysis shows that activity of Xylanase E was only marginally affected by increasing pelleting temperature, while the other two enzyme preparations lost activity in a more pronounced way (Table 2).
Ileal digesta viscosity showed an interaction between the main factors (P < 0.01), with birds fed the control diets showing the same values regardless the pelleting temperature (Table 3). On the other hand, pelleting temperatures above 80ºC led to increased digesta viscosity values when diets were supplemented with Xylanase B and Multi-enzyme R. No such negative effects were observed when Xylanase E was used, where applying higher pelleting temperatures led to significant reductions in the ileal digesta viscosity (P < 0.05). A pair-wise correlation analysis against digesta viscosity established that there was a positive correlation with bwcFCR (r = 0.252; P < 0.01) but an inverse correlated with BWG (r = -0.206; P = 0.02).
Table 2 - In feed results of xylanase activity (results at 80˚C used as reference for each product).
Pelleting temperature (oC) Xylanase activity (80oC set at 100%) 80oC 85oC 90oC
Control - - - Xylanase E 100 90.9 93.0 Multi-enzyme R 100 69.2 51.3 Xylanase B 100 70.6 58.8
No statistical interactions were observed in any of the animal performance parameters
for the whole experimental period (1-35 days). Even though the pelleting temperature did not have a significant influence on the efficacy of any of the enzyme products tested, statistical differences in BWG (P < 0.01), FI (P = 0.02), mFCR (P < 0.01) and bwcFCR (P < 0.01) were observed. In general, the inclusion of the three enzyme products in the broiler diets led to similar productivity results (P > 0.05), but statistically different from the control group. bwcFCR was essentially constant following the application of the different pelleting temperatures to diets supplemented with Xylanase E (Table 3). In contrast, when higher pelleting temperatures (80ºC vs. 90ºC) were applied to diets containing Multi-enzyme R and Xylanase B, a reduction of 14-15 points in the bwcFCR was observed. In the same way, no statistical interactions (P > 0.05) were observed between any of the animal performance parameters evaluated in the starter period (1-21 days), with no temperature effect (P > 0.05). Nonetheless, statistical differences in the BWG (P < 0.01), FI (P < 0.01) and mFCR (P < 0.01) were observed with enzyme use. Overall, the intrinsically thermostable Xylanase E gave improved bird performance relative to the control and other products tested.
Cowieson et al. (2005) and Silversides and Bedford (1999) reported that increasing pelleting temperature increases in vitro and intestinal viscosity. Silversides and Bedford (1999) also showed that enzyme activity can be affected by pelleting temperature, and this can influence intestinal viscosity and ultimately performance of birds.
Aust. Poult. Sci. Symp. 2016.....27
233

The intrinsically thermostable Xylanase E was the only product that was not affected by pelleting temperature up to 90oC, and therefore increased bird performance and reduced ileal digesta viscosity in a more pronounced manner than the other enzyme products tested, particularly with higher pelleting temperatures. Table 3 - Body weight gain (BWG, 0-35 d), body weight corrected feed conversion ratio (bwcFCR, 0-35 d) and ileal digesta viscosity (d 35) as influenced by pelleting temperature and enzyme type. Different letters
indicates a statistical difference (P < 0.01) between main factors.
Pelleting Temperature Enzyme
Body weight gain
(g, 0-35 days) bwcFCR
(g:g, 0-35 days) Viscosity
(mPa.s, d 35) 80˚C Control 2184 1.62 4.32a 85˚C Control 2215 1.57 4.29a 90˚C Control 2208 1.62 4.11a 80˚C Xylanase E 2299 1.37 2.59d 85˚C Xylanase E 2302 1.39 2.08e 90˚C Xylanase E 2327 1.40 2.06e 80˚C Multi-enzyme R 2311 1.36 2.4de 85˚C Multi-enzyme R 2312 1.41 3.13c 90˚C Multi-enzyme R 2304 1.49 3.72b 80˚C Xylanase B 2233 1.35 2.81cd 85˚C Xylanase B 2266 1.46 3.23c 90˚C Xylanase B 2293 1.50 4.34a
80˚C
2272 1.43 3.03a 85˚C
2274 1.46 3.18b
90˚C
2268 1.50 3.56b
Control 2202b 1.60a 4.24a
Xylanase E 2309a 1.39b 2.24d
Multi-enzyme R 2309a 1.42b 3.08c
Xylanase B 2264ab 1.43b 3.46b
P - values
Model 0.12 < 0.01 < 0.01 Temperature 0.98 0.23 < 0.01 Enzyme < 0.01 < 0.01 < 0.01 Temperature*enzyme 0.95 0.81 < 0.01
REFERENCES Bedford MR & Classen HL (1992) Journal of Nutrition 122: 560-572. Cowieson AJ, Hruby M & Faurschou Isaksen M (2005) British Poultry Science 46: 717-724. Silversides FG & Bedford MR (1999) Poultry Science 78: 1184–1190.
Aust. Poult. Sci. Symp. 2016.....27
234

BREED, GENDER AND FEED ENZYMES AFFECT ABILITY OF MEAT CHICKENS TO EXTRACT ENERGY FROM WHEAT
R.J. HUGHES1, J.L. BLACK2, P.C. FLINN3, A.M. TREDREA4 and S. DIFFEY5
Summary
The apparent metabolisable energy (MJ/kg dry matter) values for wheats were determined in two conventional energy balance experiments. A blend of xylanase and phytase enzyme products was used in both experiments. In experiment 1, main effects of gender, breed, feed enzymes and wheat sample were significant (P < 0.001). Ability of meat chickens to extract energy from a semi-purified wheat diet formulation was highly breed-dependent, with Ross 308 chickens being superior to Cobb 500 chickens (14.61 versus 13.15 MJ/kg dry matter). Furthermore, within Ross 308, females were superior to males (14.79 versus 14.42 MJ/kg dry matter), whereas there was no difference due to gender in Cobb 500. The marked effect of breed on AME was unexpected and warrants further investigation under both experimental and commercial conditions. In Experiment 2, main effects of gender, feed enzymes and wheat sample were significant (P < 0.001). There was a significant interaction (P < 0.05) between wheat sample and enzyme addition to diets fed to Cobb 500 chickens. Ten samples of wheat out of a total of 29 showed a significant increase in AME values due to enzyme addition, with improvements ranging from 1.15 to 2.31 MJ/kg dry matter.
I. INTRODUCTION Cereal grains used by the poultry industry in Australia vary widely in available energy and protein contents (Hughes and Choct, 1999) which are often reflected as variation in bird performance (Hughes, 2001; Hughes and Choct, 1997). Gender (Hughes, 2003) and the “new season” grain phenomenon (Choct and Hughes, 1997) have been shown to affect the ability of meat chickens to draw energy from cereal grains, particularly wheat. Moreover, exogenous feed enzyme products are used in meat chicken diets to overcome the anti-nutritive effects of non-starch polysaccharides and phytate, but not always successfully.
Rapid techniques based on near infrared reflectance (NIR) have been developed for measuring the apparent metabolisable energy (AME) content of cereal grains for meat chickens to improve the accuracy of feed formulation (Black et al., 2014). Our unpublished research completed to date suggests that the global NIR calibrations, where all grains were used to establish the calibration, overestimate the AME values of some wheat samples. This limitation could be resolved by inclusion of a larger number of samples in the NIR data base, particularly in the lower end of the AME range. Because there have been no ‘new season’ grains evaluated to date, the robustness of calibrations could be greatly enhanced by addition of low AME new seasons wheat grains.
Data underpinning NIR calibrations (AusScan) and earlier work (Hughes, 2003) show that male and female chickens can respond differently when fed diets based on the same wheat samples. In addition to gender, breed may also affect responsiveness to different wheat samples. There are two main breeds of commercial meat chickens used in Australia. The AusScan database is built on results from only one breed of chicken (Cobb 500), which
1 South Australian Research and Development Institute, and School of Animal and Veterinary Sciences, University of Adelaide, South Australia; [email protected]
2 John L Black Consulting; [email protected] 3 Kelspec Services Pty Ltd; [email protected] 4 Plant Breeding Institute, University of Sydney; [email protected] 5 Centre for Crop and Disease Management, Curtin University; [email protected]
Aust. Poult. Sci. Symp. 2016.....27
235
shows different phenotypic traits to the other breed (Ross 308) in terms of growth rate and feed efficiency. The concern is that these differences also may extend to ability to extract energy from cereal grains in the diet.
The study reported here compared AME values measured with Cobb 500 and Ross 308 meat chickens fed four wheat-based diets without and with feed enzymes in Experiment 1, and Ross chickens fed 29 wheat-based diets without and with feed enzymes in Experiment 2. In both experiments, effects of gender were also determined.
II. MATERIALS AND METHODS The AME values of wheats were determined in conventional energy balance studies involving measurements of feed intake and excreta output as described by Mollah et al. (1983) with minor modifications, and subsequent measurement of gross energy values of feed and excreta by bomb calorimetry.
Experiment 1 was a factorial design involving breed (Ross 308 and Cobb 500), gender (male and female), enzymes (without and with) and wheat (four wheats grown in 2013) with each combination replicated twice. Experiment 2 was also a factorial design involving Ross 308 meat chickens), gender (male and female), enzymes (without and with) and 29 wheats with each combination replicated twice. Each experiment was conducted with two separate batches of day-old, feather-sexed broiler chickens raised in floor pens on a commercial broiler diet to 22 days of age and then transferred in single-sex groups of five to metabolism cages in controlled temperature rooms. Air temperature was maintained at 26oC at the start of the 7-day experiment and lowered daily until it was 23oC at the end. Experimental diets contained per kg wheat 800g, acid casein 155g, dicalcium phosphate 20g, limestone 11g, DL-methionine 7g, mineral and vitamin premix 3g, salt 2g, and choline chloride (60) 2g. All wheats were fed with and without a blend of xylanase (Porzyme 93010 at 50 g/tonne) and phytase (Phyzyme TPT at 50 g/tonne) enzyme products. Dietary treatments were replicated four times (two cages of males and two cages of females). Cold-pressed diets were fed for seven days (birds 22-29 days of age). The first three days enabled the chickens to adapt to the feeds. During the following four days, all excreta were collected and dried at 85oC. Feed intake was measured during the adaptation and collection phases of the study. Birds were weighed at the start and end of the 7-day period (data not shown). Dry matter contents of samples of pelleted and milled feeds were measured. Gross energy values of dried excreta and milled feeds were measured with a Parr isoperibol bomb calorimeter. AME of the grain was calculated by subtracting from total energy intake the energy contribution of casein, which was assumed to be 20.1 MJ/kg dry matter (Annison et al., 1994).
III. RESULTS
In experiment 1, main effects of gender, breed, enzyme and wheat on AME values were significant (P < 0.001; results not shown). The key finding was a significant interaction (P < 0.05) between gender and breed (Table 1). For each gender, Ross 308 chickens had higher AME values than Cobb 500. There was no difference due to gender for Cobb 500 chickens, whereas for Ross 308 the AME value averaged over four wheat samples was 0.37 MJ/kg dry matter higher for female compared with male chickens. Two-way interactions involving breed, gender or enzyme were not significant, nor was the interaction involving all three effects, which indicates that response to feed enzymes was consistent across breed and gender.
Aust. Poult. Sci. Symp. 2016.....27
236

Table 1 - Effects of gender and breed of meat chicken 22-29 days of age on apparent metabolisable energy values (MJ/kg dry matter); n=16 for each gender x breed combination. Means with different letters are
significantly different (P < 0.05).
Gender Cobb 500 Ross 308 Female 13.21 ± 0.17 c 14.79 ± 0.12 a Male 13.09 ± 0.18 c 14.42 ± 0.12 b
In Experiment 2, main effects of gender, enzyme and wheat on AME values were
significant (P < 0.001; results not shown). There was a significant interaction (P < 0.05) between wheat sample and enzyme addition (Figure 1).
Figure 1 - Effects of a blend of xylanase (Porzyme 93010 at 50 g/tonne) and phytase (Phyzyme TPT at 50 g/tonne) enzyme products on apparent metabolisable energy values (MJ/kg dry matter) for wheat.
III. DISCUSSION
Ability of meat chickens to extract energy from a semi-purified wheat diet formulation was highly breed-dependent. Ross 308 chickens were superior to Cobb 500 chickens (14.61 versus 13.15 MJ/kg dry matter). Furthermore, within Ross 308, females were superior to males (14.79 versus 14.42 MJ/kg dry matter), whereas there was no difference due to gender for Cobb 500. Given the commercial implications of the effect of breed, further investigations under both experimental and commercial conditions are warranted to confirm the finding and identify reasons for the breed differences.
Ten samples of wheat out of a total of 29 showed a significant increase in AME values due to enzyme addition. Significant differences in AME due to feed enzymes ranged from 1.15 to 2.31 MJ/kg dry matter. AME was significantly increased in seven of the ten wheats with AME values less than 13 MJ/kg dry matter, whereas only three of the 19 wheats with higher AME (>13 MJ/kg dry matter) were responsive to this blend of xylanase and phytase enzyme products. These results suggest that factors other than anti-nutritive effects of non-starch polysaccharides and phytate are at least partially responsible for variation in AME
*
* *
*
*
*
* * *
*
10
11
12
13
14
15
16
17
AM
E (M
J/kg
dry
mat
ter)
Wheat identification
No enzyme Enzyme
* Significant effect of enzyme addition (P < 0.05)
Aust. Poult. Sci. Symp. 2016.....27
237

values for wheat. For example, Truong et al. (2015) concluded that phytase may impede starch digestion in wheat- and maize-based diets. The ecology of the chicken gut microbiota has been implicated as yet another source of variability in energy metabolism and feed efficiency (Stanley et al., 2013; Torok et al., 2011).
IV. CONCLUSIONS
Ability of meat chickens to extract energy from a semi-purified wheat diet formulation was highly breed-dependent. The large effect of breed on AME requires verification. Response to feed enzymes was consistent across breed and gender. On the other hand, not all 29 wheat samples responded well to feed enzymes. Some wheats with lower AME values (<13 MJ/kg dry matter) were not improved by feed enzymes, whereas some wheats with higher AME (>13 MJ/kg dry matter) were responsive. ACKNOWLEDGMENTS: The RIRDC Chicken Meat Program provided financial support (Project 8582).
REFERENCES
Annison G, Choct M & Hughes RJ (1994) Proceedings of the Australian Poultry Science Symposium 6: 92-96.
Black JL, Hughes RJ, Diffey S, Tredrea AM, Flinn PC, Spragg JC & Kim JC (2014) Proceedings of the Australian Poultry Science Symposium 25: 23-30.
Choct M & Hughes RJ (1997) Proceedings of Recent Advances in Animal Nutrition in Australia 11: 146-150.
Hughes RJ (2001) Proceedings of Recent Advances in Animal Nutrition in Australia 13: 153-161.
Hughes RJ (2003) Proceedings of the Australian Poultry Science Symposium 15: 172-176. Hughes RJ & Choct M (1997) Proceedings of Recent Advances in Animal Nutrition in
Australia 9: 138-141. Hughes RJ & Choct M (1999) Australian Journal of Agricultural Research 50: 689-701. Mollah Y, Bryden WL, Wallis IR, Balnave D & Annison EF (1983) British Poultry Science
24: 81-89. Stanley D, Geier MS, Denman SE, Haring VR,Crowley TM, Hughes RJ & Moore RJ (2013)
Veterinary Microbiology 165: 85-92. Torok VA, Hughes RJ, Mikkelsen LL, Perez-Maldonado R, Balding K, McAlpine R, Percy
NJ & Ophel-Keller K (2011) Applied and Environmental Microbiology 77: 5868-5878. Truong HH, Liu SY & Selle PH (2015) Proceedings of the Australian Poultry Science
Symposium 26: 126-129.
Aust. Poult. Sci. Symp. 2016.....27
238

CALCIUM AND SODIUM IN BROILER BONE - WHAT IS THE RELATIONSHIP?
L.C. BROWNING1 and A.J. COWIESON1 Bone is the principal storage site for calcium (Ca) and sodium (Na) in vertebrate animals, with 99% of total body Ca being stored in bone, and about 30-45% of total body Na stored in the bones of man, 39-55% in dog, monkey and rabbit and 21% in the rat (Scott et al., 1982). Previous research by Harrison (1937) showed the Ca content of bone to be directly proportional to the Na content of bone with a molar ratio of approximately 30:1. This ratio was maintained not only in normal bone, but in bones of animals with osteoporosis, rickets and hypervitamin D. Recently this work was confirmed in three broiler experiments conducted by Browning and Cowieson (2014, 2015a, 2015b) where it was found that the ratio for Ca:Na was approximately 30:1 in tibia bone as shown in Table 1.
Table 1 - The relationship between Ca:Na in broiler tibia bone, across three experiments.
Treatment Ratio Ca:Na Exp 1
Ratio Ca:Na Exp 2 Ratio Ca:Na Exp 3 1 30.01 29.23 30.24 2 29.77 29.24 30.84 3 30.67 28.17 30.84 4 31.23 28.50 31.42 5 30.72 27.99 32.79 6 31.83 29.32 32.53 7 29.64 32.42 8 28.95 30.32
Furthermore, Browning and Cowieson (2015b) found a constant concentration of Ca, Na,
strontium, magnesium and potassium in bone of 43% suggesting some physiological regulation of mineral proportionality, possibly for architectural reasons.
More research is required to elucidate the effect of dietary Na and Ca concentration on Na and Ca content of bone and their subsequent effect on bone density in broiler chickens. There is a well documented correlation between Na and Ca concentration in urine. In human nutrition, diets higher in Na alter Ca metabolism by increasing Ca excretion and significantly reducing Ca content of bone (Teucher et al., 2008) leading to osteoporosis. The average loss of Ca from bone has been shown to be at least 40 mg (1 mol) for each 2290 mg (100 mol) of Na excreted which would deplete the human skeleton by 10% in a decade (Zarkadas et al., 1989). In conclusion, the effect of dietary Na and Ca concentrations (as well as P, Sr, Mg and K) on bone mineral proportionality requires further exploration. The putative effects of dietary Ca, P, phytate, phytase and vitamin D on Ca and Na egress into the intestinal lumen and the potential for the involvement in this of bone mobilization and the relevance of this for feed formulation strategies warrants attention.
ACKNOWLEDGEMENT: This research was supported by the Poultry CRC.
Browning L & Cowieson A (2014) Anim. Prod. Sci. 54: 942-949. Browning L & Cowieson A (2015) Anim. Prod. Sci. Published online 15th Jan, 2015. Browning LC & Cowieson AJ (2015) J. Sci. Food Agri. 95: 1080-1087. Harrison HE (1937) J. Biolog. Chem. 120: 457-462. Scott M, Nesheim M & Young R (1982) In: 'Nutrition of the chicken' 3rd Ed. (ML Scott &
Associates, Ithaca, NY). Teucher B, Dainty JR, Spinks CA, Majsak‐Newman G, Berry DJ, Hoogewerff JA, Foxall RJ &
Jakobsen J (2008) J. Bone Miner. Res. 23: 1477-1485. Zarkadas M, Gougeon-Reyburn R, Marliss E, Block E & Alton-Mackey M (1989) Amer. J. Clin.
Nutr. 50: 1088-1094.
1 Poultry Research Foundation, The University of Sydney, Camden, NSW 2570; [email protected]
Aust. Poult. Sci. Symp. 2016.....27
239

MEETING CREATINE NEEDS OF MODERN BROILERS VIA GUANIDINOACETIC ACID SUPPLEMENTATION IN DIETS WITH OR WITHOUT ANIMAL PROTEIN
K.R. PRADEEP1, M. RADEMACHER2 and C.K. GIRISH1
Summary Two experiments were conducted to investigate the effects of supplementation of guanidinoacetic acid (GAA), in diets with or without animal protein on the performance of broilers. In the first study, 780 male Ross 308 broilers were randomly allocated to three dietary treatments comprised of basal vegetable diet, basal vegetable diet supplemented with 0.6 g/kg GAA and diet containing 60 g/kg meat and bone meal (MBM). The treatment diets were fed from day 15 - 35. Weight gain of broilers fed MBM and GAA supplemented diet was higher (P = 0.006) than the basal vegetable diet. Feed conversion ratio (FCR; P = 0.001) of the GAA treatment was improved compared to either the MBM or the basal vegetable diet. In the second study, 540 male day-old Ross 308 broiler chicks were randomly allocated to six dietary treatments in a three by two factorial arrangement with or without fish meal (FM) and with or without GAA. FM improved weight gain and FCR particularly during the starter and grower phase (P < 0.05), whereas GAA supplementation improved (P < 0.05) FCR throughout all feeding phases. European Efficiency Factor (EEF) was improved (P < 0.01) by GAA supplementation, whereas FM had no impact. GAA supplementation increased (P < 0.01) muscle creatine content and lowered GAA content (P < 0.01). In conclusion, GAA improved growth performance of broilers when supplemented to either vegetable based diets or diets containing animal protein source.
I. INTRODUCTION Guanidino acetic acid (GAA) is a natural precursor of creatine in vertebrates and plays a major role in energy metabolism. GAA is available as commercial product, CreAMINO®
containing a minimum of 96% GAA. Thermal instability and high cost of pure form of creatine limits its use as a feed additive in animal production. While GAA is stable for feed processing and is more suitable as feed additive. GAA is mainly formed in the kidney from the amino acids glycine and arginine and is transported to the liver, where most of it is transformed into creatine. The irreversible conversion and excretion of creatine pool in the form of creatinine warrants continuous replacement of lost creatine, especially for fast growing modern broilers. The body is capable of replacing creatine losses to a certain extent through de-novo synthesis, nevertheless the remainder must be supplied through diet. In high yielding animals such as meat type broilers the inevitable creatine loss may be a performance-limiting factor, especially in complete vegetable diets due to lack of creatine. Furthermore, animal protein sources in broiler diets are often restricted to a maximum inclusion level of 50 g/kg and variability in the creatine levels contribute to incomplete fulfilling of the demand of creatine of fast growing broilers. Two studies were therefore conducted in order to evaluate, whether GAA supplementation can meet the creatine needs and improve the growth performance of fast growing broilers fed vegetable or animal protein based diets.
1 Nutrition and Care, Animal Nutrition, Evonik (SEA) Pte. Ltd, Singapore; [email protected] 2 Nutrition and Care, Animal Nutrition, Evonik Industries, Germany.
Aust. Poult. Sci. Symp. 2016.....27
240

II. MATERIALS AND METHODS
Trial 1: 780 male Ross 308 broilers were randomly distributed to three dietary treatments with nine replicates per treatment and 30 birds per replicate. Three dietary treatments included a corn soy basal vegetable diet; basal vegetable diet supplemented with 0.6 g/kg GAA and diet formulated to contain 60 g/kg meat and bone meal (MBM). The diets were supplied for the experimental period from day 15-35. Feed and water were supplied ad libitum. Environmental conditions during the trial were appropriate to the age of the birds following Aviagen Ross 308 recommendations. Birds were weighed individually and body weights were recorded at the start and at the end of the experimental period. Feed intake was recorded on pen basis. Subsequently, body weight gain and feed conversion ratio (FCR) were calculated. At the end of the trial, five birds per pen were utilized for carcass and meat quality determination. Data were analysed using the analysis of variance procedure of SAS (2009).
Trial 2: 540 male day-old Ross 308 broiler chicks were randomly distributed to six dietary treatments with nine replicates per treatment and 10 birds per replicate. A two-factorial arrangement included the factors ‘fish meal (FM) inclusion’ (no FM, 50 g/kg FM only in starter feed, 50 g/kg FM throughout all phases) and GAA supplementation (no GAA, 0.6 g/kg GAA supplementation). The experimental starter (1-10 days), grower (10-25 days) and finisher (25-36 days) diets were adequate in terms of energy and nutrient supply meeting the recommended digestible amino acid levels. Feed and water were supplied ad libitum. Environmental conditions during the trial were appropriate to the age of the birds following Aviagen Ross 308 recommendations. Birds were weighed individually at the start and at the end of the trial and body weights were recorded. Feed consumption was recorded per pen and FCR was corrected for mortality. The European efficiency factor (EEF) was calculated using final body weights (BW), FCR as well as mortality data: EEF = [(liveability % x BW kg) / (age in days x FCR)] x 100. At the end of the trial, six birds per pen with body weights closest to pen average were selected for determination of carcass yield (dressing percentage and breast meat yield). Samples of breast meat were obtained from two birds per pen for analysis of GAA and creatine. Data were analysed using the bi-factorial ANOVA procedure of SAS (2009).
III. RESULTS AND DISCUSSION Trial 1: Weight gain of both the MBM and GAA supplemented diet was significantly higher (P = 0.006) than of the basal vegetable diet. FCR (P=0.008) and FCR corrected for mortality (P = 0.001) of the GAA treatment were significantly improved compared to either the MBM diet or the basal vegetable diet (Table 1). This improvement in performance could be explained by the likelihood that dietary GAA restores the creatine load in tissues of birds fed purely vegetable diets and accordingly improves cell energy management and animal performance. These results are in line with the findings of Michiels et al. (2012) wherein the authors found an improved FCR (P < 0.05) and average daily gain (P < 0.05) with GAA supplementation. The improvement in FCR with GAA supplementation was also in line with observations of Stahl et al. (2003) who found improvement of FCR from weeks three to four after creatine monohydrate supplementation. The authors linked the improvement to muscle cell hydration and increase in weight gain as GAA plays a significant role in muscle tissues. The increased feed intake correlated with the increase in weight gain of animal protein diet compared to the basal vegetable diet with the feed efficiency being similar for both the treatments.
Aust. Poult. Sci. Symp. 2016.....27
241

Table 1 - Effects of supplementing 0.6 g/kg GAA to a vegetable diet on feed intake, weight gain, feed conversion ratio (FCR) and carcass yield of male Ross 308 broilers (days 15-35).
Treatment MBM Vegetable diet Vegetable diet
supplemented with GAA
P-value
Feed intake, g 2700a 2612b 2657ab 0.066 Weight gain, g 1671a 1610b 1693a 0.006 FCR, g/g 1.62b 1.62b 1.57a 0.008 FCR corr.1, g/g 1.61b 1.60b 1.56a 0.001 % Carcass yield 79.42 79.21 79.98 0.653
1Corrected for mortality abLS means within a row with different superscripts differ (P < 0.05)
There were only numeric differences between treatments for carcass yield as a percentage of live weight. Meat quality parameters including pH, lightness, yellowness and drip loss were not influenced by treatments. Only redness was found to be lower in the GAA treatment (data not shown). Maddock et al. (2000) and Abudabos et al. (2014) in the previous studies showed that dietary supplementation of creatine had little to no effect on the dressing percentage and fat deposition in swine and broilers respectively.
Trial 2: Dietary inclusion of FM improved weight gain and FCR particularly during the starter and grower phases (P < 0.05), whereas GAA supplementation improved FCR (P < 0.05) throughout all feeding phases. The impact of GAA on body weight gain was most pronounced in the finisher phase; nevertheless, there was a clear tendency (P < 0.10) until day 25. European Efficiency Factor (EEF), was significantly improved by GAA supplementation (P < 0.01), whereas FM diet had no impact.
Table 2 - Growth performance, feed conversion (FCR) and EEF of male Ross 308 broilers fed diets supplemented with no or 0.6 g/kg GAA and containing no or 50 g/kg fish meal (FM).
Treatment No Fish Meal (FM)
FM only in Starter
FM in all Phases P - value
GAA 0.6 g/kg 0.6
g/kg 0.6 g/kg FM GAA FM*GAA
Weight gain, g/d 0-10 days 28.5 29.2 29.6 29.9 29.9 30.2 <0.01 0.08 0.76 0-25 days 61.4 62.5 61.8 62.8 63.3 64.1 0.02 0.08 0.97 0-36 days 75.5 77.0 74.6 77.6 75.8 79.3 0.12 <0.01 0.40 FCR, corrected for mortality g/g 0-10 days 1.07 1.05 1.03 1.02 1.04 1.02 <0.01 <0.01 0.19 0-25 days 1.36 1.34 1.34 1.34 1.33 1.32 0.02 0.03 0.20 0-36 days 1.58 1.55 1.58 1.55 1.57 1.53 0.05 <0.01 0.68 European efficiency factor (EEF)
447 476 438 485 458 498 0.56 <0.01 0.86
GAA supplementation improved dressing percentage (P = 0.01) with no difference in
breast meat yield. Analyses of GAA and creatine in breast muscle tissues (Table 3) revealed that GAA supplementation substantially increased muscle creatine content (P < 0.01) and lowered GAA content (P < 0.01) which could be linked to suppression of de-novo synthesis of GAA in the body, regulated by a feedback mechanism (Lemme et al., 2007). The results indicated that there was an effective conversion and transportation of supplemental GAA into muscle tissues. The effect of FM inclusion was much smaller with regard to muscle creatine content (P = 0.04). Higher muscle creatine concentrations with GAA supplementation might
Aust. Poult. Sci. Symp. 2016.....27
242

have contributed to a more efficient utilization of dietary nutrients and resulted in an improved performance.
Table 3 - Carcass yield, GAA and creatine content in breast meat of male Ross 308 broilers fed diets
supplemented with no or 0.6 g/kg GAA and containing no or 50 g/kg fish meal (FM).
Treatment No Fish Meal (FM)
FM only in Starter
FM in all Phases P – value
GAA
0.6 g/kg
0.6 g/kg
0.6 g/kg
FM GAA FM*GAA
Carcass Yield (%) Dressing percentage
66.8 67.0 66.9 67.2 66.9 67.8 0.11 0.01 0.28
Breast meat yield 35.3 35.6 36.1 35.4 36.0 35.9 0.11 0.46 0.17 Breast Muscle Analysis (mg/kg) GAA 20.1 7.4 29.3 3.9 14.7 4.2 0.27 <0.01 0.20 Creatine 4646 5022 4410 5136 4618 5200 0.04 <0.01 0.22
In conclusion, results from above studies showed that supplementation of GAA improved the growth performance and carcass yield of broilers and the effect was independent of vegetable/animal protein diet.
REFERENCES
Abudabos AM, Saleh F, Lemme A & Zakaria HAH (2014) Italian Journal of Animal Science 13: 3269.
Lemme A, Ringel J, Sterk A & Young JF (2007) 16th European Symposium on Poultry Nutrition (26-30 August, 2007, Strasbourg, Françe) pp. 339-342.
Maddock RJ, Bidner BS, Carr SN, McKeith FK, Berg EP & Savell JW (2000) Proceedings of Annual Reciprocal Meat Conference 53: 118.
Michiels J, Maertens L, Buyse J, Rademacher M, Dierick NA & De Smet S (2012) Poultry Science 91: 402-412.
SAS (2009) SAS Institute Inc. (Cary, NC, USA). Stahl CA, Greenwood MW & Berg EP (2003) International Journal of Poultry Science 2:
404-408.
Aust. Poult. Sci. Symp. 2016.....27
243

META-ANALYSIS OF TRIALS CONDUCTED TO EVALUATE THE EFFICACY OF A MULTI ENZYME COMPLEX IN CORN-SOYBEAN MEAL FED BROILERS
R. MONTANHINI NETO1, D. WU2 and A. PREYNAT3
The efficacy of a multi-enzyme complex (Rovabio® Advance) to degrade non-starch polysaccharides has been determined using pen and metabolic trials. Fifteen in vivo trials, using the commercial recommendation (50 g/ton or 200 mL/ton) up to 35 days, were used for a meta-analysis to investigate growth performance (feed consumption, weight gains and feed conversion from d 0 to market age as well as for the different phases (initial, grower and finisher). Birds were fed corn and soybean meal feeds.
The trials were performed in different locations (countries and research centres). The nutritional requirements, the rearing procedures, and the commercial broiler breeds vary according to the location and were taken into account for the meta-analysis. Nevertheless, in all trials, feed was presented as pellets and offered ad libitum, as well as fresh water.
All diets were analysed for xylanase and beta-glucanase activities and results were in agreement with expected levels. Among these trials, twelve were based on pen designs and aimed to analyse the performance parameters (body weight gain, feed intake and feed conversion ratio) and three trials were metabolic studies in cages, aiming to evaluate the metabolizable energy (AME) of feeds and the nitrogen digestibility (Bourdillon et al., 1990). The model used fixed treatment and random study effects. Analyses were performed using the GLIMMIX procedure of SAS. In order to evaluate the efficacy of the enzyme, results (performance parameters, level of AME of feed and digestibility of nitrogen) from the treatments without and with the enzyme complex addition. Difference between these treatments were compared as percent of improvement provided by the enzyme complex. In some growth performance trials, the enzyme complex was added to more than one basal treatment, totalling 17 observations (comparison between without and with enzyme addition) in the 12 trials.
Analysed across the metabolic trials, the multi enzyme complex improved the AME by +2.89% (P<0.05), i.e. 90 kcal/kg. Digestibility of protein nitrogen was improved by +3.03% (P<0.05). The enzyme complex significantly improved (P<0.05) BWG and FCR by +2.64% and -2.15%, respectively, without significant (P>0.10) effect on feed intake. The enzyme addition significantly improved BWG in 14 observations (82.4% of the cases) and FCR in 12 observations (70.6%).
The present meta-analysis supports the conclusion that the multi enzyme complex at its commercial recommended dose is effective in broilers fed corn-SBM-based diets, to improve the energy and protein nutrient digestibility as well as the growth performance.
Bourdillon A, Carré B, Conan L, Francesch M, Fuentes M, Huyghebaert G, Janssen W, Leclercq B, Lessire M, McNab J, Rigoni M & Wiseman J (1990) Brit. Poult. Sci. 31: 567-576.
1 ADISSEO France S.A.S., Antony 92161, France; [email protected] 2 ADISSEO France S.A.S, Singapore 179360, Singapore. 3 CERN, Centre of Expertise and Recherche in Nutrition, Adisseo France S.A.S. Malicorne, 03600, France.
Aust. Poult. Sci. Symp. 2016.....27
244

EFFECTS OF XYLANASE, ARABINOFURANOSIDASE, AND THEIR COMBINATION ON IN VITRO DIGESTIBILITY OF MAIN RAW MATERIALS
P. COZANNET2, O. GUAIS1, R. MONTANHINI NETO3, A. PREYNAT2
and E. DEVILLARD2
Summary
Plant cell wall degrading enzymes are key technological components in biomass bioconversion and animal feed industries. In animal production, identification of the main effective enzymatic activities needed to improve digestibility is a key factor to ensure reliability in the effects of enzyme based products. The present study describes the effect of an endo-xylanase (xyl; GH11) and an arabinofuranosidase (Abf; GH51) on the in vitro digestibility of main cereals used in broiler feed. Effect was measured through dry matter digestibility (dig DM) and colorimetric assay of plant cell-wall breakdown (Dinitrosalicylic acid, DNS). Effects of single enzymes and combinations were evaluated on wheat, corn and corn distiller. Abf improved dig DM and DNS of all raw materials. The highest effect of Abf was observed on corn and corn distillers (respectively 5.7% and 14.8% improvement), which are characterized by high level of substitution of xylose backbone with arabinose. Xyl improved wheat dig DM by 3.8% (P < 0.001) and corn distillers dig DM by 13.3%. Combination of both enzymes further improved these digestibilities to 8.9% and 15.9%.
I. INTRODUCTION Non starch polysaccharides (NSP) are β(α) polymers, associated with plant cell walls and mainly found in the endosperm but also in the bran. They include celluloses, hemicelluloses and pectins. NSP can be divided according to their nutritional value into water-soluble and water-insoluble fractions (Bach Knudsen, 2014). Among the most used cereals, corn and wheat present very large variation in NSP contents as well as in NSP biochemical structures. Hemicelluloses, among which heteroxylan is the most important polymer, represents a high percentage of NSP in corn as well as in wheat. Xylose constituting the main chain of heteroxylan generally represents more than 50 % of the polymer. The main chain is substituted by various osidic components which include arabinofuranosyl with or without ferulic acid, a-glucuronic acid or galactose. The structure of heteroxylan is variable between cereals. The heteroxylans of corn are more substituted (80%) than those of wheat (70%) and contain more glucuronic acid (8.3% vs 2.6%). The present study focuses on the interest of the combination of an endo-xylanase (GH11) and an arabinofuranosidase (GH51) for NSP degradation of cereals and byproducts.
II. MATERIALS AND METHODS An in vitro incubation study was carried out to determine if various enzyme preparations contained appropriate activities to target NSP of wheat, corn and corn distiller.. Enzyme preparations Xyl (Xylanase; GH11 family) and Abf (Arabinofuranosidase; GH51) were first isolated from Talaromyces versatilis and expressed in Pichia pastoris. These enzymes were evaluated individually and in combination (Xyl; Abf; Xyl+Abf) on each raw material.
1 CINABio, Adisseo France SAS, 31077 Toulouse, France. 2 CERN, Adisseo France SAS, 03600 Malicorne, France; [email protected] 3 Adisseo France SAS, Antony 92161, France.
Aust. Poult. Sci. Symp. 2016.....27
245
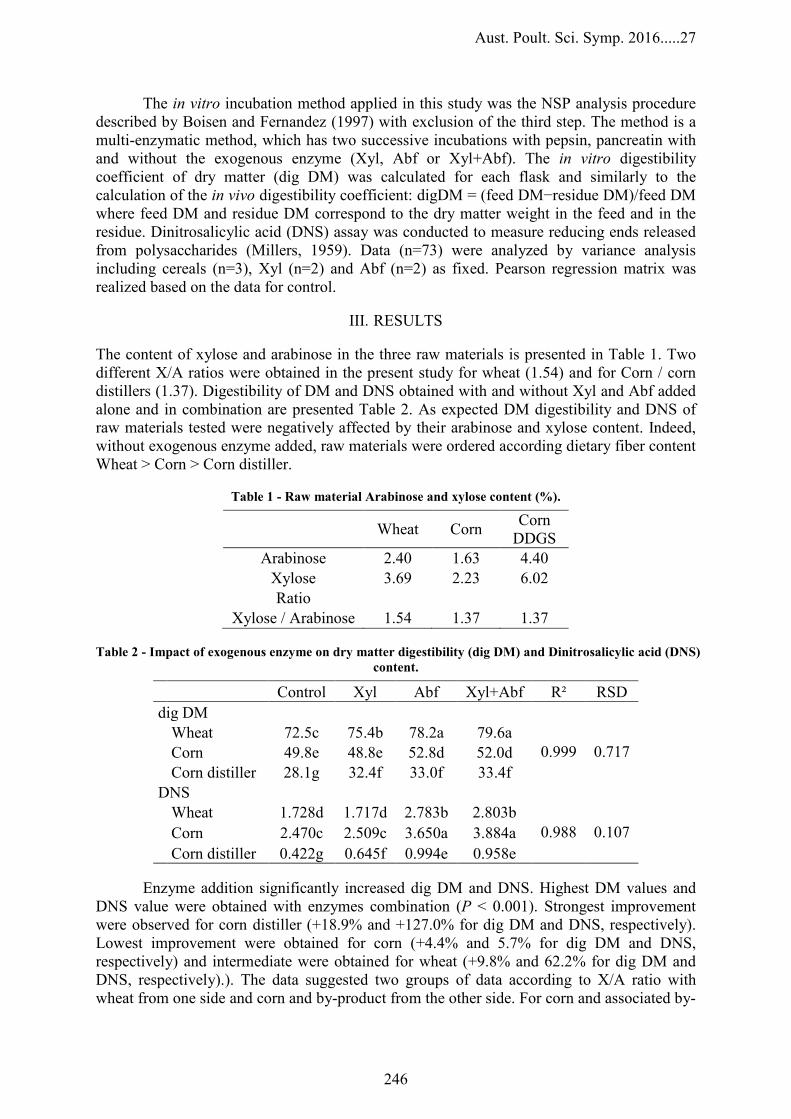
The in vitro incubation method applied in this study was the NSP analysis procedure described by Boisen and Fernandez (1997) with exclusion of the third step. The method is a multi-enzymatic method, which has two successive incubations with pepsin, pancreatin with and without the exogenous enzyme (Xyl, Abf or Xyl+Abf). The in vitro digestibility coefficient of dry matter (dig DM) was calculated for each flask and similarly to the calculation of the in vivo digestibility coefficient: digDM = (feed DM−residue DM)/feed DM where feed DM and residue DM correspond to the dry matter weight in the feed and in the residue. Dinitrosalicylic acid (DNS) assay was conducted to measure reducing ends released from polysaccharides (Millers, 1959). Data (n=73) were analyzed by variance analysis including cereals (n=3), Xyl (n=2) and Abf (n=2) as fixed. Pearson regression matrix was realized based on the data for control.
III. RESULTS The content of xylose and arabinose in the three raw materials is presented in Table 1. Two different X/A ratios were obtained in the present study for wheat (1.54) and for Corn / corn distillers (1.37). Digestibility of DM and DNS obtained with and without Xyl and Abf added alone and in combination are presented Table 2. As expected DM digestibility and DNS of raw materials tested were negatively affected by their arabinose and xylose content. Indeed, without exogenous enzyme added, raw materials were ordered according dietary fiber content Wheat > Corn > Corn distiller.
Table 1 - Raw material Arabinose and xylose content (%).
Wheat Corn Corn DDGS
Arabinose 2.40 1.63 4.40 Xylose 3.69 2.23 6.02 Ratio
Xylose / Arabinose 1.54 1.37 1.37 Table 2 - Impact of exogenous enzyme on dry matter digestibility (dig DM) and Dinitrosalicylic acid (DNS)
content.
Control Xyl Abf Xyl+Abf R² RSD dig DM
Wheat 72.5c 75.4b 78.2a 79.6a 0.999 0.717 Corn 49.8e 48.8e 52.8d 52.0d
Corn distiller 28.1g 32.4f 33.0f 33.4f DNS
Wheat 1.728d 1.717d 2.783b 2.803b
0.988 0.107
Corn 2.470c 2.509c 3.650a 3.884a Corn distiller 0.422g 0.645f 0.994e 0.958e
Enzyme addition significantly increased dig DM and DNS. Highest DM values and
DNS value were obtained with enzymes combination (P < 0.001). Strongest improvement were observed for corn distiller (+18.9% and +127.0% for dig DM and DNS, respectively). Lowest improvement were obtained for corn (+4.4% and 5.7% for dig DM and DNS, respectively) and intermediate were obtained for wheat (+9.8% and 62.2% for dig DM and DNS, respectively).). The data suggested two groups of data according to X/A ratio with wheat from one side and corn and by-product from the other side. For corn and associated by-
Aust. Poult. Sci. Symp. 2016.....27
246

product, Abf appeared as the most efficient enzyme with an increase +3.9% units and +0.876 in average for dig DM and DNS, respectively. Xyl alone improved corn distiller dig DM and DNS significantly. No effect of Xyl alone were observed on corn in present study in relation with lowest xylose content. For wheat, Xyl alone improved dig DM by 2.9% unit (P < 0.001), whereas it did not improved DNS. This effect was improved by Abf addition according an additive relationship. The average additional effect of Abf was +5.7% units and + 1.055 for dig DM and DNS, respectively.
IV. DISCUSSION Present work was focus on evaluation of effect of Xyl and Abf alone and their combination. This effect was evaluated on most common cereals characterized by different content and X/A ratio. Raw material xylose and arabinose content was in agreement with previous data reported by Bach Knudsen (2014).
Enzymes successfully improved dig DM and DNS values. These results were in agreement with several authors and is related to fiber degrading activities (Meng et al., 2005). Present work suggests a good efficiency of Xyl alone for wheat in relation with low substitution of wheat arabinoxylans. Arabinoxylans of corn and associated by-product were more efficiently hydrolysed by Abf and combination Abf+Xyl, because of the higher level of substitution of their arabinoxylans, when compared to wheat.
Combination of both enzymes resulted in the highest degradation of dig DM and DNS. This results might be explained by arabinoxylan structure. Different enzymes are required for the degradation of the arabinoxylans. While endo-xyl hydrolyze the xylose backbone, their activity is frequently hampered by the substitution by arabinose residues. Therefore, Xyl efficiency might be increased by Abf supplementation. To be efficient,endo-Xyl, requires an unsubstituted space to hydrolyze xylan backbone (up to 4 free accessible xylose residues for the Xyl B of T. versatilis, Lafond et al., 2014). Therefore, it can suggested that combinations of enzymes are required to breakdown efficiently high substituted arabinoxylans, such as arabinoxylans characterizing corn.
Finally, enzyme in-vitro development in connection with substrate might be a good strategy for development of optimal enzyme combination for application for feed industry. Such methodology might further enhance enzyme innovation.
REFERENCES Bach-Knudsen KE (2014) Poultry Science 93: 2380-2393. Boisen S & Fernadez JÁ (1997) Animal Feed Science and Technology 68: 277-286. Lafond M, Guais O, Maestracci M, Bonnin E & Giardina T (2014) Applied Microbiology
Biotechnology 98: 6339-6352. Meng X, Slominski BA, Nyachoti CM, Campbel LD & Guenter W (2005) Poultry Science 84:
37-47. Miller GL (1959) Analytical Chemistry 31: 426-428.
Aust. Poult. Sci. Symp. 2016.....27
247

GLOBAL APPLICABILITY OF NIR CALIBRATIONS FOR PREDICTING APPARENT METABOLISABLE ENERGY OF GRAINS FOR BROILERS
J.L. BLACK1, J.A. DOWNING2, H. GRAHAM3, P.C. FLINN4, S. DIFFEY5,
A.M. TREDREA6 and C. PIOTROWSKI7
Summary
The apparent metabolisable energy (AME) content of fifteen cereal grains from the United Kingdom, France, Denmark and Mexico and eight from Australia was determined for broiler chickens. There was no significant effect of grain source (Australian or Overseas) on AME (MJ/kg as fed), although there were significant differences between grain samples depending on grain species and chemical composition. An existing NIR calibration developed with Australian grains predicted the AME value of Australian and Overseas grains with similar accuracy. When the grains were incorporated into an upgraded calibration, AME was predicted for all Overseas grains within 95% accuracy of the measured value. The results suggest that a NIR calibration developed with a wide range of Australian grains can be used with similar accuracy on grains from other regions.
I. INTRODUCTION Cereal grains are incorporated into broiler diets primarily to provide energy. However, the energy value of grains varies widely between grain species and between individual grain samples within a species (Scott, 2004; Black, 2008). The AME content for broilers of approximately 300 cereal grains from six species (wheat, barley, triticale, sorghum, maize and rice) measured in an on-going experiment (Black et al., 2014) ranged from 10.0 to 15.6 MJ/kg (as fed) across species and by greater than 3 MJ/kg (as fed) within most species. Traditional methods for assessing energy content of grains, including calculation from chemical composition, test weight (kg/hl) and screenings percentage, do not rank grains well in relation to the measured AME content (MJ/kg) in broilers (Black et al., 2014). Near infra-red (NIR) spectroscopy techniques have become widely used within the animal feed industries to allow rapid and often real-time measurement of feed ingredient quality (Graham et al., 2013). Valdes and Leeson (1992) demonstrated, with a limited number of grains, that reliable NIR calibrations could be developed for assessing the AME content of grains for poultry. Subsequently, a NIR calibration for predicting AME content of cereal grains for broilers has been developed using approximately 300 cereal grains collected in Australia (Black et al., 2014). The standard error of prediction is currently 0.40 MJ/kg as fed. The purpose of the experiment described was to determine whether cereal grains collected from other parts of the world had significantly different AME content values from Australian grains, and whether the NIR calibration developed in Australia would be suitable for use on grains from around the world.
1 John L Black Consulting; [email protected] 2 University of Sydney, Poultry Research Foundation; [email protected] 3 AB Vista; [email protected] 4 Kelspec Services Pty Ltd; [email protected] 5 Centre for Crop and Disease Management, Curtin University; [email protected] 6 University of Sydney, Plant Breeding Institute; [email protected] 7 Aunir; [email protected]
Aust. Poult. Sci. Symp. 2016.....27
248

II. MATERIALS AND METHODS
The experiment was conducted in a different facility than had been used to generate results for the established NIR calibration. The AME content of 23 cereal grains (16 wheat, 1 barley, 1 triticale and 5 sorghum) was measured in broiler chickens. Fifteen of the grains (13 wheat and 2 sorghum) were collected from the United Kingdom (UK), France, Denmark and Mexico and ground in the UK using a hammer mill fitted with a 3mm screen before importation into Australia. The other grains were from Australia and had been fed previously to broilers in experiments used to develop the NIR calibration. Existing NIR calibrations (Black, 2008), upgraded with results from more recently analysed grains, were used to assess the chemical composition of each grain sample.
The diets contained 800g cereal, 155g casein, 20g dicalcium phosphate, 11g limestone, 7g DL-methionine, 2g vitamin mix, 3g sodium chloride and 2g choline chloride (60%) per kg. The diets were cold-press pelleted in accordance with a statistical, partially replicated design accounting for the day and order of manufacture. Diets for seven grains were replicated during processing, resulting in the 23 grains being fed to broilers as 30 pelleted diet batches. The experiment was conducted using 300 female and 300 male broilers housed in two rooms each containing 60 cages (ten blocks of three tiers), with 5 birds in each cage. There were four feeding replicates (2 male cages and 2 female cages) per grain, except the seven grains that were pelleted in two batches, which each had eight replicates.
Day-old, commercial Ross 308 breed chickens (Baiada Poultry Ltd, Marsden Park, NSW) were feather-sexed at hatch and reared in cages in single-sex groups for 21 days using commercial diets. Test diets were fed from 22-28 days of age. Birds were randomly allocated to diets on day 22 and given a 3 day adaptation period. Cage feed intake was measured and excreta collected during the following 3 day period. Pooled excreta from each cage was dried in a fan-forced oven at 80ºC before being ground and stored for analysis. The gross energy content of the feed, grain sources and excreta was determined with a bomb calorimeter standardised using benzoic acid. AME content of the diet and of the grain was calculated on an as fed and a dry matter basis.
Variance parameters within a statistical model were estimated using residual maximum likelihood (REML). Grain source (Australian or Overseas) and individual grain identity were fitted in the model as fixed effects, whereas bird gender, room, cage-block, cage-tier, pellet-batch and their interactions were fitted as random effects.
The experiment was analysed first as a stand-alone experiment to determine effects of source of grain and grain identity. The results were then used to determine 'statistically corrected' AME values across all experiments, where results from the experiment were incorporated into the existing dataset for NIR calibration evaluation. The use of common grain samples across experiments (connectivity grains) allows many individual experiments to contribute to a single dataset where random variance between experiments is corrected for statistically.
Whole grains from overseas were scanned using a FOSS NIR monochromator in the UK, while Australian grains were scanned on a similar FOSS instrument in Australia. The UK instrument had been 'standardised' to the Australian instrument using well-established procedures in WinISI software, which was used to update and evaluate calibrations.
III. RESULTS
There were no significant differences between Australian and Overseas grains in AME content (MJ/kg as fed; P = 0.24), grain intake (g/day; P = 0.31) or grain AME intake (MJ/day; P = 0.98). However, there were significant differences between individual grains for AME content and AME intake (Table 1). These differences were associated with grain species and chemical composition of the grain. The protein content of Australian wheat samples were higher (18.14 vs 10.65 % DM) and starch content lower (56.7 vs 67.8 % DM) than for the Overseas wheat samples. Composition of the Australian and Overseas sorghum samples were similar.
Aust. Poult. Sci. Symp. 2016.....27
249

The standard errors of the estimates for both AME and AME intake tended to be 20-30% lower for Australian than Overseas grains. Broiler gender accounted for approximately 10% of the non-grain residual variation for AME content and nearly 30% of the non-grain residual variation for AME intake. The interaction between room, cage block and cage tier also accounted for almost 8% of the non-grain residual variation for AME intake. Comprehensive design of the experiment (accounting for room, cage placement and pellet manufacturing) resulted in a 10% improvement in the accuracy of measuring grain AME content and approximately 40% improvement in accuracy of estimates of grain AME intake.
Table 1 - Values (mean ± standard error) after accounting for all known variance for grain AME and grain AME intake for broiler chickens averaged across gender and NIR estimated grain composition.
Grain Origin1 AME (MJ/kg af2 )
AME intake (MJ/d)
C protein3
(% DM4) Starch
(% DM) NDF5
(% DM) Wheat 1763 Aust 11.22 ± 0.34 1.31 ± 0.08 17.44 59.11 15.08 Wheat 1777 Aust 10.82 ± 0.34 1.35 ± 0.08 17.18 59.27 13.50 Wheat 1779 Aust 11.28 ± 0.34 1.35 ± 0.08 19.80 54.58 14.91 Wheat 1950 O/S 12.53 ± 0.44 1.38 ± 0.10 11.14 67.14 12.82 Wheat 1960 O/S 13.28 ± 0.44 1.33 ± 0.10 10.14 69.12 13.09 Wheat 1961 O/S 12.87 ± 0.44 1.37 ± 0.10 11.41 68.26 13.11 Wheat 1962 O/S 13.47 ± 0.44 1.22 ± 0.10 9.79 70.26 12.16 Wheat 1963 O/S 12.98 ± 0.44 1.34 ± 0.10 10.99 67.22 13.36 Wheat 1964 O/S 13.24 ± 0.44 1.40 ± 0.10 11.17 67.01 14.65 Wheat 1965 O/S 13.36 ± 0.44 1.38 ± 0.10 10.28 67.14 12.51 Wheat 1966 O/S 13.36 ± 0.44 1.46 ± 0.10 11.23 66.57 12.72 Wheat 1967 O/S 13.48 ± 0.45 1.11 ± 0.10 9.69 67.38 14.63 Wheat 1968 O/S 12.12 ± 0.44 1.34 ± 0.10 10.36 68.89 13.08 Wheat 1969 O/S 12.83 ± 0.44 1.37 ± 0.10 10.80 68.39 12.37 Wheat 1970 O/S 12.60 ± 0.44 1.38 ± 0.10 10.28 66.22 15.14 Wheat 1971 O/S 12.39 ± 0.44 1.32 ± 0.10 11.18 67.44 14.36 Barley 3871 Aust 12.47 ± 0.44 1.38 ± 0.10 15.30 50.22 17.64 Triticale 6849 Aust 12.60 ± 0.34 1.43 ± 0.08 18.40 52.88 15.36 Sorghum 7790 O/S 14.26 ± 0.44 1.28 ± 0.10 9.00 70.43 12.23 Sorghum 7791 O/S 13.38 ± 0.44 1.39 ± 0.10 10.91 66.79 12.91 Sorghum 7869 Aust 14.93 ± 0.34 1.24 ± 0.09 11.29 70.32 8.82 Sorghum 7885 Aust 14.96 ± 0.34 1.29 ± 0.08 6.29 73.15 5.80 Sorghum 7894 Aust 14.73 ± 0.34 1.35 ± 0.08 11.06 68.40 6.04 Approx LSD 0.826 0.187 1Grain origin: Australian (Aust) or Overseas (O/S); 2As fed; 3Crude protein; 4Dry matter; 5Neutral Detergent Fibre
The existing NIR calibration predicted the AME content of Overseas wheats with moderate accuracy (R2 for relationship between predicted and measured = 0.36). The predicted values for six of the overseas wheats and one sorghum differed by greater than two standard errors from the measured values as did the predicted values for the three Australian wheat samples. However, when the grains from the experiment were incorporated into a new calibration, all grains except one Australian wheat sample were predicted to be within two standard errors of the measured value (Figure 1). The protein content of the Australian wheat samples selected for the experiment were in the top range of samples used to develop the calibrations and this may have affected the accuracy of NIR predictions for these grains.
Aust. Poult. Sci. Symp. 2016.....27
250

Figure 1 - Relationship between measured and predicted AME using the updated NIR calibration. Solid line is
the line of equivalence. Dashed line is the fitted regression Reference = 1.036*NIR -0.56; R2 = 0.69. The dotted lines represent 95% confidence limits.
IV. DISCUSSION
The mean standard error for the measured AME values were considerably higher in the current experiment than for all previous experiments combined (±0.42; ±0.19 MJ/kg as fed, respectively). The difference may have been caused by the use of an alternative facility. The experimental protocol between this and previous experiments was similar except the faecal collection period was only 3 instead of 4 days. The resulting increase in variation of estimated AME values would have reduced the accuracy of the comparison between Overseas and Australian grains as well as the evaluation of the existing calibration for use with non-Australian grains. AME results from this experiment for Australian grains used in previous experiments, particularly wheat samples, were not well predicted by the existing NIR calibration, most probably because of their high protein content. Nevertheless, the results presented suggest that a NIR calibration developed using Australian grains can be used with similar accuracy for grains from other regions. ACKNOWLEDGEMENTS: Financial support was provided by the Pork CRC and AB Vista.
REFERENCES Black JL (2008) Premium Grains for Livestock Program: Component 1 – Coordination,
Final Report (Grains R&D Corporation, Canberra, Australia). Black JL, Hughes RJ, Diffey S, Tredrea AM, Flinn PC, Spragg JC & Kim JC (2014)
Proceedings of the Australian Poultry Science Symposium 25: 23-30. Graham H, Piotrowski C & van Barneveld R (2013) Animal Production Science 53: 1179-
1181. Scott TA (2004) Proceedings of the Australian Poultry Science Symposium 16: 9-16. Valdes EV & Leeson S (1992) Poultry Science 71: 1179-1187.
10
11
12
13
14
15
10 11 12 13 14 15
Mea
sure
d gr
ain
AM
E (M
J/kg
as
fed)
NIR predicted grain AME (MJ/kg as fed)
Wheat Aust
Wheat O/S
Barley Aust
Triticale Aust
Sorghum O/S
Sorghum Aust
Aust. Poult. Sci. Symp. 2016.....27
251

THE EFFECTS OF VARIABLE BUTTIAUXELLA PHYTASE DOSE ON MARKET-AGE BROILER PERFORMANCE AND CARCASS CHARACTERISTICS
M. HRUBY1, R. BOLD2, C.T. MOU3 and M.E. PERSIA3
Summary
Most poultry producers today frequently encounter information focusing on the value of a high phytase dose. Many times, such information can strongly support the benefit of increasing the phytase dose by up to several folds from the more established levels of 500 FTU/kg of feed. With new generation, more efficient phytases such as Buttiauxella-origin phytase, the question should be answered whether the higher levels of this new phytase source can still bring appropriate performance and economic benefit to poultry producers. The present study investigated performance of commercial strain broilers grown to a market age of 6 weeks and offered corn/soy-based diets reduced in available P, Ca, amino acids and energy and containing increasing levels of Buttiauxella phytase. As expected, reducing nutrient and energy density of feeds had a significant impact on gain and FCR and numerically reduced carcass and breast yield. Including phytase at 500 FTU/kg of feed corrected fully for performance reduction associated with feeding lower nutrient and energy density diets. Furthermore, offering phytase at 2000 FTU/kg of feed resulted in gain, FCR and breast yield response significantly better than those observed in high nutrients and energy diets.
I. INTRODUCTION In the classic research study by Shirley and Edwards (2003), very high levels of phytate degradation were achieved with phytase inclusions of up to 12,000 FTU/kg of feed, while more traditional commercially used levels of 500 FTU/kg of feed resulted in only half of the highest phytate degradation response. The fungal-origin phytase tested in their study had been used since the early 1990’s possibly raising a question whether today’s more efficacious phytase products such as Buttiauxella-origin phytase could, at higher levels inclusion than 500 FTU/kg, bring additional value in terms of performance and improved profitability. In the research by Menezes-Blackburn et al (2015) in vitro IP6 hydrolyses using Aspergillus niger-origin phytase at 1000 FTU/kg of feed did not match IP6 hydrolysis level achieved with only 250 FTU/kg of feed of Buttiauxella-origin phytase. Furthermore, the inclusion of Buttiauxella-origin phytase above 250 FTU/kg improved only marginally already very high levels of IP6 hydrolysis achieved at 250 FTU/kg of feed. With this background information, the objective of our research was to evaluate if commercially relevant high levels of Buttiauxella-origin phytase, up 2,000 FTU/kg of feed, could contribute to the live performance and carcass characteristics improvement when used in lower aP, Ca, amino acids and energy dense diets or whether the performance improvement plateau is accomplished already at 500 FTU/kg of feed.
II. MATERIALS AND METHODS Day-old male Cobb 500 broilers were distributed into 5 treatments with 8 replicates each with 8 birds per replicate (1045 cm2/bird). Broilers were grown on floor pens with new wood
1 DuPont Industrial Biosciences, Danisco Animal Nutrition, St. Paul, MN, USA; [email protected] 2 DuPont Industrial Biosciences, Danisco Animal Nutrition, Marlborough, UK. 3 Virginia Tech University, College of Agriculture and Life Sciences, Blacksburg, VA, USA.
Aust. Poult. Sci. Symp. 2016.....27
252

shavings until 42 days of age following Cobb breeder temperature and lighting recommendations. The birds were offered corn/soy-based diets with a diet change at 22 days of age. Positive control diet with nutrient and energy levels considered sufficient to support optimal growth were reduced in negative control diet by the following levels: 0.15% aP, 0.165% Ca, 0.22 MJ/kg, 0.42% CP, 0.017% Lys, 0.004% Met, 0.035% Cys, 0.033% Thr, 0.019% Try, 0.026% Iso, 0.023% Val, 0.013% Arg and 0.035% Na. The negative control diet was supplemented by Buttiauxella-origina phytase (Axtra® PHY, DuPont Industrial Biosciences, Danisco Animal Nutrition) at 500, 1000 or 2000 FTU/kg of feed. Feed intakes and weights were recorded at 21, 28, 35 and 42 days of age. Mortality was recorded daily. Carcass characteristics, including carcass yield and breast yield, were measured at 42 days of age. Data were subjected to analysis of variance (ANOVA) to test for the probability of significant differences between the means. Means separation was achieved using Student’s t-test in the Fit Model platform of JMP 11 (SAS Institute Inc., Cary, NC, 1989-2013).
III. RESULTS AND DISCUSSION Reducing protein, amino acids, sodium and energy levels in corn/soy–based diets had a significant (P < 0.05) negative impact on weight gain and FCR at 42 days of age (Table 1). Feed intake, carcass and breast yield were not significantly affected by the dietary nutrients and energy changes.
Table 1 - Broiler performance and carcass characteristics at 42 days of age.
Diet BWG42 FI42 FCRc42 CYP BRWP (g/bird) (g/bird) (g/g)
PC 2856b 116.0ab 1.709b 0.763ab 0.237b
NC 2582c 121.4a 1.895a 0.755b 0.235b
NC + 500 2827b 109.7b 1.602bc 0.771a 0.247a
NC + 1000 2905ab 110.7b 1.551c 0.770ab 0.246a
NC + 2000 3066a 112.1b 1.474c 0.773a 0.251a
SEM 59.06 2.90 0.046 0.005 0.003 P-value < 0.0001 0.046 < 0.0001 0.116 0.001
Means with the same superscript are not significantly different ( P < 0.05). FCRc42 – feed conversion corrected by 3 points for each 100 g difference in BWG42. CYP – carcass yield, BRWP – breast yield. Diet: PC (positive control), NC (negative control), + 500, + 1000, + 2000 – all FTU/kg feed.
Phytase at any level of inclusion significantly improved gain, feed intake, FCR and
breast yield of negative control diet. Breast yield of phytase-supplemented diets was also significantly higher than positive control treatment. Furthermore, phytase addition at 2000 FTU/kg of feed improved gain and FCR when compared to the positive control (optimal nutrient and energy specification) treatment. The results suggested that Buttiauxella-origin phytase provides strong nutrient and energy contributions at relatively moderate level of inclusion (500 FTU/kg of feed). Furthermore, high levels of the tested phytase product could provide additional opportunity to improve performance and breast yield. Some recently published work with the same source of phytase (Truong et al, 2014) supports benefits of this phytase in terms of high phytate hydrolysis, absorption of glucose and sodium retention, possibly explaining some of the performance responses achieved in this study.
Aust. Poult. Sci. Symp. 2016.....27
253

IV. CONCLUSIONS This research with the new generation Buttiauxella-origin phytase supports earlier data that the tested phytase is highly efficacious with an opportunity to correct for performance reduction due to feeding lower P, Ca, amino acids, sodium and energy dense diets. In terms of higher phytase dose benefits, the research supports the opportunity to consider higher phytase dose inclusions to further improve performance and profitability of broiler production. A possible mode of action(s) responsible for these effects might need further evaluation.
REFERENCES Menezes-Blackburn D, Gabler S & Greiner R (2015) Journal of Agricultural and Food
Chemistry 63: 6142-6149. Shirley RB & Edwards HE (2003) Poult Science Journal 82: 671-680. Truong HH, Yu S, Peron A, Cadogan DJ, Khoddami A, Roberts TH, Liu SY & Selle PH
(2014) Animal Feed Science and Technology 198: 248-256.
Aust. Poult. Sci. Symp. 2016.....27
254

RVA STARCH PASTING PROFILES MAY BE INDICATIVE OF FEED GRAIN QUALITY
P.H. SELLE1, A. KHODDAMI2, A.F. MOSS1, H.H. TRUONG1,3 and S.Y. LIU1
Summary
Some grain sorghum RVA starch viscosities were negatively correlated with FCR and positively correlated with AMEn. This suggests that sorghums with high RVA starch viscosities advantage broiler performance and RVAs may hold promise as indicators of feed grain quality.
I. INTRODUCTION The determination of starch pasting profiles by rapid visco-analysis (RVA) was developed in Australia for the estimation of sprout damage in wheat (Ross et al., 1987). RVA technology is used extensively in the human food industry but its application in animal nutrition is limited. Intuitively, RVA starch profiles may be indicative of feed grain quality for poultry and livestock although the consensus appears to be that this is unlikely. Nevertheless, RVAs may be a rapid, ‘weighbridge’ test to assess the nutritive value of feed grains for chicken-meat production.
II. METHODOLOGY Our research group has determined RVAs of more than 20 samples of sorghum, maize and wheat. RVA starch pasting profiles of feed grains were determined with an RVA-4 analyser (Newport Scientific, Warriewood, NSW) as described by Beta and Corke (2004). Ground grain (4.2 g) was mixed with deionised water (23.8 g) in a programmed heating and cooling cycle of 13 minutes. The slurry was held at a temperature of 50°C for 1 minute and then heated to 95°C and held for 2.5 minutes prior to cooling the slurry to 50°C and holding that temperature for 2 minutes. Peak holding and final viscosities were determined, breakdown (peak – holding) and setback (final – peak) viscosities calculated, and peak times and pasting temperatures recorded. RVA profile determinations were completed in duplicate.
In one comparative broiler bioassay nutritionally equivalent diets based on six divergent sorghum samples (580 g/kg) were offered to Ross 308 chicks from 7 to 28 days post-hatch. Parameters of growth performance (weight gain, feed intake, FCR), nutrient utilisation (AME, ME:GE ratios, N retention, AMEn), starch and protein digestive dynamics were determined (as yet unpublished data). Digestive dynamics included starch and protein (N) digestibility coefficients and disappearance rates (g/bird/day) from four small intestinal segments [proximal jejunum (PJ), distal jejunum (DJ), proximal ileum (PI), distal ileum (DI)]. Corresponding starch:protein disappearance rate ratios were deduced. Pearson correlations between RVA starch profiles of the six sorghums with the listed parameters of bird performance were derived.
III. RESULTS The RVA starch pasting profiles of eight diverse sorghum cultivars from the ‘sorghum starch’ project are shown in Table 1 where highly significant differences between sorghums
1 Poultry Research Foundation, 425 Werombi Road Camden NSW 2570; [email protected] 2 Department of Plant and Food Sciences, The University of Sydney, NSW 2006. 3 Poultry CRC, University of New England, Armidale NSW 2351.
Aust. Poult. Sci. Symp. 2016.....27
255

were observed for all seven RVA parameters. The mean peak RVA viscosity was 4702 cP but this ranged from 2392 to 9511 cP; corresponding values for holding were 3216 cP (2091 to 5485 cP) and for final RVA viscosity were 6269 cP (4592 to 8695 cP). In the majority of cases, Block I sorghum had the lowest, and sorghum FW the highest, RVA starch viscosities.
Six of these eight sorghums (Block I, Tiger, JM, Liberty, MP, HP) were evaluated in the broiler bioassay. Pearson correlations that were either significant (P < 0.05) or approached significance (P < 0.10) between RVA starch pasting profiles of six grain sorghum varieties and performance parameters of broiler chickens offered diets based on these sorghums are shown in Table 2. A total of 22 such Pearson correlations were identified. It is noteworthy that holding viscosity (r = -0.821; P < 0.05) and final viscosity (r = -0.832; P < 0.05) were negatively correlated with feed conversion efficiency (FCR) to significant extents. Alternatively, peak viscosity (r = -0.835; P < 0.04) and breakdown viscosity (r = -0.834; P < 0.04) were positively correlated with N-corrected AME (AMEn) to significant extents.
IV. DISCUSSION The negative correlations between RVA viscosities and FCR coupled with the positive correlations between RVA viscosities and AMEn suggest sorghums with high RVA starch viscosities advantage broiler performance. Superficially, this seems completely at odds with the established disadvantages associated with high gut viscosities and soluble non-starch polysaccharides of ‘viscous’ feed grains in broiler chickens. It should be noted that holding and final viscosities were negatively correlated to proximal jejunal starch digestibility coefficients but this apparent anomaly is addressed later.
The interpretation of RVA starch profiles is not straightforward. Fundamentally, the peak viscosity is indicative of the capacity of starch granules to take up water and swell which increases the viscosity of the flour and water slurry and its resistance to agitation at 90°C. When the slurry is held at this temperature starch granules rupture and viscosity decreases from the peak to the holding viscosity as defined by the breakdown viscosity. Then, with cooling of the system, viscosity increases to the final viscosity and the breakdown viscosity (final minus peak viscosities) is associated with starch retrogradation (Deffenbaugh and Walker, 1989). RVA starch profiles may be influenced by numerous factors including sulphite reducing agents (sodium metabisulphite) as they depolymerise starch and reduce its viscosity via oxidative–reductive reactions (Liu et al., 2014). Proteins may interact with starch and modify its RVA pasting profiles (Zhang and Hamaker, 1998; Ito et al., 2006); thus RVAs may provide a vehicle to investigate starch-protein interactions which remain poorly defined despite their recognised importance (Truong et al., 2015). Nevertheless, investigations into possible connections between RVAs and pig (White et al., 2008ab) and poultry (Ankrah et al., 1999) performance are limited and, with one exception in pigs (Doucet et al., 2010), generally inconclusive. Correlations do not establish causation; however, the majority of the tabulated correlations suggest that sorghums with high RVA viscosities should be preferred. The significant correlations mentioned above are supported by an overview of 5 similar feeding studies involving 8 sorghum varieties and 15 observations as similar correlations (P = 0.089 - 0.033) between breakdown, final and setback RVAs with FCR and AMEn were observed. As discussed, final RVA viscosity was negatively correlated (r = -0.933; P = 0.007) to starch digestibility in the proximal jejunum which appears to be inconsistent. However, final RVA viscosity was positively correlated (r = 0.718; P = 0.108) to starch digestibility in the distal ileum. Moreover, this transition from negative to positive correlations, albeit to non-significant extents, was observed for all five RVA viscosities. This may even suggest that RVA starch profiles provide indications as to the site of starch digestion along the small
Aust. Poult. Sci. Symp. 2016.....27
256

intestine. While there was a negative correlation between final RVA viscosity and starch digestibility in the proximal jejunum, there was a positive correlation (r = 0.803; P = 0.054) between final RVA viscosity and protein (N) digestibility in the same site. Also, there was a negative correlation (r = -0.930; P = 0.007) final RVA viscosity and starch:protein (N) disappearance rate ratios in the proximal jejunum. This relationship may have implications for starch and protein digestive dynamics which, in tandem, appear pivotal to broiler performance (Liu and Selle, 2015). Interestingly, both determinations of RVA starch pasting profiles and steam-pelleting broiler diets are somewhat parallel hydrothermal processes. The legitimacy of RVAs as indicators of feed grain quality may be enhanced if RVAs are used in conjunction with other methods including Promatest protein solubilities (Odjo et al., 2012). The latter approach proved promising in earlier evaluations of six red Liverpool Plains sorghums. In conclusion, it is evident that RVA starch profiles hold some promise as indicators of feed grain quality, at least insofar as sorghum is concerned. It probably should not be assumed that this may be equally the case with maize and wheat. Nevertheless, further investigations into the relationship between RVA starch profiles and feed grain quality for chicken-meat production do appear to be justified. ACKNOWLEGMENTS: We wish to acknowledge the ongoing support of RIRDC Chicken-meat for funding a series of sorghum related projects and the Poultry CRC for funding Ms Ha Truongs’s PhD scholarship.
REFERENCES Ankrah NO, Campbell GL, Tyler RT, Rossnagel BG & Sokhansanj SRT (1999) Animal Feed
Science and Technology 81: 205-219. Beta T & Corke H (2004) Cereal Chemistry 81: 418-422. Deffenbaugh LB & Walker CE (1989) Cereal Chemistry 66: 493-499. Doucet FJ, White GA, Wulfert F, Hill SE & Wiseman J (2010) British Journal of Nutrition
103: 1309-1318. Ito A, Hattori M, Yoshida T, Watanabe A, Sato R & Takahashi K (2006) Journal of
Agriculture and Food Chemistry 54: 10191-10196. Liu SY, Selle PH, Khoddami A, Robert TH & Cowieson AJ (2014) Animal Feed Science and
Technology 190: 68-78. Liu SY & Selle PH (2015) World’s Poultry Science Journal 71: 297-310. Odjo S, Malumba P, Dossou J, Janas S & Bera F (2012) Journal of Food Engineering 109:
561-570. Ross AS, Walker CE, Booth RI, Orth RA & Wrigley CW (1987) Cereal Foods World 38:
827–829. Truong HH, Liu SY & Selle PH (2015) Animal Feed Science and Technology (Published on
line). http://dx.doi.org/10.1071/AN15056 White GA, Doucet FJ, Hill SE & Wiseman J (2008) Animal 2: 867-878. White GA, Doucet FJ, Hill SE & Wiseman J (2008) Animal 2: 1312-1323. Zhang G & Hamaker BR (1998) Cereal Chemistry 75: 710-713.
Aust. Poult. Sci. Symp. 2016.....27
257

Table 1 - RVA starch pasting profiles of eight grain sorghum varieties (analyses completed in duplicate).
Sorghum
RVA viscosity (cP) Peak time (minutes)
Pasting temp. (°C) Peak Holding Breakdown Final Setback
Block I Tiger JM
Liberty FW MP HP
HFQ
SEM Significance (P) LSD (P < 0.05)
2392a 4771e 5559f 4717e 9511g 3619c 2591b 4454d
58.62
< 0.001 191.2
2091a 2904d 3202f 2810c 5458h 3022e 2517b 3695g
25.62
< 0.001 83.5
300b 1867e 2357f 1907e 4053g 597c 74a
760d
35.82 < 0.001 116.8
4592a 5746b 5726b 5378b 8695e 6347c 5554b 8115d
180.74 < 0.001 589.4
2501a 2846ab 2524a 2928ab 3238b 3325b 3037ab 4421c
177.19 0.001 577.8
5.63c 5.13b 5.00a 5.17b 5.64c 5.64c 6.20d 5.53c
0.0387 < 0.001 0.126
79.9d 75.1b 73.2a 75.9b 73.5a 77.9c 82.6e 80.3d
0.303
< 0.001 0.99
abcdefgh: Means within columns not sharing a common suffix are significantly different at the 5% level of probability
Table 2 - Pearson correlations (P < 0.10) between RVA starch pasting profiles of six grain sorghum varieties (Block I, Tiger, JM, Liberty, MP, HP) and performance parameters of broiler chickens offered diets based on the six sorghums.
RVA profile
Parameter Correlation coefficient
Significance RVA profile
Parameter Correlation coefficient
Significance
Holding Final Peak
Breakdown Peak
Breakdown Final
Setback Peak
Breakdown Peak time
FCR FCR AME AME
ME:GE ratio ME:GE ratio N retention N retention
AMEn AMEn AMEn
r = -0.821 r = -0.832 r = 0.789 r = 0.774 r = 0.800 r = 0.767 r = 0.880 r = 0.774 r = 0.835 r = 0.834 r = -0.749
P = 0.045 P = 0.040 P = 0.062 P = 0.071 P = 0.056 P = 0.075 P = 0.021 P = 0.071 P = 0.039 P = 0.039 P = 0.086
Pasting temp. Holding
Final Final
Setback Setback Setback Holding
Final Setback Setback
AMEn Starch dig. PJ Starch dig. PJ Protein dig. PJ Protein dig. PJ Protein dig. DJ Protein dig. DJ
St:Pr dis. ratio PJ St:Pr dis. ratio PJ St:Pr dis. ratio PJ St:Pr dis. ratio DJ
r = -0.751 r = -0.906 r = -0.933 r = 0.803 r = 0.896 r = 0.798 r = 0.862 r = -0.754 r = -0.930 r = -0.735 r = -0.753
P = 0.087 P = 0.013 P = 0.007 P = 0.054 P = 0.016 P = 0.057 P = 0.027 P = 0.083 P = 0.007 P = 0.096 P = 0.084
Aust. Poult. Sci. Symp. 2016.....27

Name Page(s) Email Address
Abdollahi, M.R 223, 227 [email protected]
Alders, R.G 9 [email protected]
Al-Zahrani, K 141 [email protected]
Amerah, A.M 223
Angel, R 182 [email protected]
Anwar, S 217
Ashraf, S 217
Bao, Y 91
Barekatain, M.R 147 [email protected]
Barnes, B 196 [email protected]
Bedford, M.R 178 [email protected]
Betacourt, T.C 146
Bhattarai, S.P 42
Bhuiyan, M.M 58, 186
Black, J.L 235, 248 [email protected]
Bold, R. 252
Briens, M 149 [email protected]
Browning, L.C 239 [email protected]
Bryden, W.L 1 [email protected]
Cadogan, D.J 166, 170 [email protected]
Campbell, D 71 [email protected]
Carragher, J 148
Cervantes-Pahm, S 52 [email protected]
Channarayapatna, G 65
Cho, S 95 [email protected]
Choct, M 46, 57, 64, 66 [email protected]
Chousalkar, K 133
Clark, K.V 51 [email protected]
Cordell, D 153 [email protected]
Couloigner, F 149
Cowieson, A.J 14, 56, 60, 78, 91, 170, 239 [email protected]
Cozannet, P 96, 245 [email protected]
Cressman, M.D 34 [email protected]
Cronin, G.M 51, 72, 76, 77, 82, 87 [email protected]
Cuttell, L 109
de Koning, C.T 29 [email protected]
Devillard, E 218, 219, 245 [email protected]
Dhand, N 91
Diffey, S 235, 248 [email protected]
Doran, R.A 87 [email protected]
Downing, J.A 248 [email protected]
Drake, K 29
Dunlop, M.W 21, 30, 34, 38, 46 [email protected]
Durand, D 149
Erdaw, M.M 186
AUTHOR INDEX

Faure, M 149
Flinn, P.C 235, 248 [email protected]
Forder, R.E.A 213 [email protected]
Frankel, T.L 97
Freilikh, J 60
Garet, J 149
Gatelier, P 149
Geraert, P.-A 149, 218, 219 [email protected]
Gibson, R 148
Gilani, S.S 213 [email protected]
Girish, C.K 240 [email protected]
Glass, K 196 [email protected]
Gomes, G.A 231
Gómez, J 146
González-Ortiz, G 231
Gous, R.M 170
Graham, H 178, 231, 248 [email protected]
Grieve, A.M 52 [email protected]
Groves, M 109 [email protected]
Groves, P.J 51, 59, 60, 196 [email protected]
Guais, O 245
Hargreave, G 170
Hartcher, K.M 72, 76 [email protected]
Hejdysz, M 231
Hemsworth, P.H 72, 76, 77 [email protected]
Hernandez, C.E 78
Hernandez-Jover, M 196 [email protected]
Hickey, K.A 76
Hilliar, M 145
Hinch, G 71, 78 [email protected]
Hine, B 86
Hopcroft, R.L 60, 87 [email protected]
Howarth, G.S 213 [email protected]
Hruby, M 252 [email protected]
Hughes, R.J 148, 213, 235 [email protected]
Hunt, P. 86
Hussein, S.M 97 [email protected]
Ijaz, A 217
Iji, P.A 58, 186 [email protected]
Iqbal, Z 145 [email protected]
Islam, A.F.M.F 30, 34, 38
Jacquier, V 218, 219
Jovanovski, M 60
Kaczmarek, S 231
Kanakri, K 148 [email protected]
Keerqin, C 64 [email protected]
Kheravii, S.K 66 [email protected]
Khoddami, A 255

Kim, J.M 95
Kitessa, S.M 213 [email protected]
Larsen, H 77 [email protected]
Laurenson, Y.C.S.M 30, 34, 38
Le Crapper, M 96
Lee, A 196 [email protected]
Lee, C 71, 78 [email protected]
Li, W 182 [email protected]
Liu, S.Y 82, 91, 166, 170, 174, 255 [email protected]
Martinez, M.A 52 [email protected]
Masood, S 217
Matthews, L.R 47 [email protected]
Maucotel, T 149
Mercier, Y 149 [email protected]
Midmore, D 42
Moloney, B 196 [email protected]
Montanhini Neto, R 96, 244, 245 [email protected]
Moradi, A 227
Moradi, S 227
Moss, A.F 166, 174, 255 [email protected]
Mou, C.T 252
M'Sadeq, S 145
Muhlhausler, B 148
Muir, W.I 56, 59, 60 [email protected]
Nelson, A 219
Nielsen, P 219
Omede, A.A 58
O'Shea, C.J 91 [email protected]
Parkinson, G 137
Partridge, G.G 166
Perez-Maldonado, R.A 145, 186
Persia, M.E 252
Piotrowski, C 248 [email protected]
Powell, D.J 56 [email protected]
Pradeep, K.R 240
Prasai, T.P 42 [email protected]
Prescilla, K.M 82 [email protected]
Preynat, A 96, 244, 245
Pritchard, S 206 [email protected]
Rademacher, M 240
Raubenheimer, D 170
Rault, J-L 47, 51, 77 [email protected]
Ravindran, V 223
Rehman, H 217
Restrepo, G.M 146 [email protected]
Rhayat, L 218, 219 [email protected]
Roberts, J.R 133, 137, 141, 145 [email protected]

Roura, E 95
Ruhnke, I 29, 86, 145
Rutkowski, A 231
Samiullah, S 133 [email protected]
Sanchez, D.E 146 [email protected]
Schaal, T 190 [email protected]
Scott, A.B 196 [email protected]
Selle, P.H 91, 166, 170, 174, 255 [email protected]
Sexton, M 116 [email protected]
Sharma, N 86, 145 [email protected]
Sharma, N.K 46, 86, 145 [email protected]
Simpson, S.J 170
Singh, M 29, 56, 76, 78, 82, 145, 196 [email protected]
Skerman, A 29
Smith, C.L 77 [email protected]
Sparks, N 101, 125 [email protected]
Speight, R.E 158 [email protected]
Stuetz, R.M 21 [email protected]
Suawa, E.K 137 [email protected]
Svihus, B 64
Swick, R.A 46, 57, 64, 65, 66, 86, 145,
147
ten Doeschate, R.A.H.M 231 [email protected]
Toghyani, M 65, 147 [email protected]
Tommasino, N 149
Toribio, J-A 196
Tran, C.D 213 [email protected]
Tran, K.T.N 72
Tredrea, A.M 235, 248 [email protected]
Truong, H.H 166, 174, 255 [email protected]
Velleman, S.G 56 [email protected]
Walk, C.L 178 [email protected]
Walkden-Brown, S.W 30, 34, 38 [email protected]
Walsh, K 42
Wells, B.A 30, 38 [email protected]
Wideman Jr., R.F 200 [email protected]
Wilkinson, S.J 76, 91 [email protected]
Wilson, A 109
Wu, D 96, 244
Wu, S.B 46, 57, 64, 65, 66, 145 [email protected]
Xue, G.D 57 [email protected]
Yokhana, J.S 97
Yousaf, M.S 217
Yu, S 174
Zaman, M.A 67 [email protected]
Zaneb, H 217 [email protected]