Thermal stress in concrete slabs under different constraints

Gradstein, F. M., Ludden, J. N., et al, 1992Proceedings of the Ocean Drilling Program, Scientific Results, Vol. 123
26. CONSTRAINTS ON THE STATE OF STRESS IN OLD OCEANIC CRUST OF THEINDO-AUSTRALIAN PLATE, NORTHWEST OF AUSTRALIA1
David A. Castillo2,3 and Brennan O'Neill3,4
ABSTRACT
Stress-induced wellbore breakouts have been detected using an ultrasonic borehole televiewer tool (BHTV) run in thebasalt section of Hole 765D. A detailed analysis of the breakouts over a depth range of 1125 to 986 mbsf gives a statisticallyaveraged orientation of 121.5°N ±9.0° for the maximum horizontal compressive stress (SH m a x ) . Similar S H m a x orienta-tions are observed in industry wells situated on the nearby Australian continental shelf. Using the criteria that wellborefailure occurs when the circumferential compressive stress concentration around the borehole exceeds the compressivestrength of the rock, we develop constraints on the stress regime active within the northwest section of the Indo-AustralianPlate. The occurrence of these stress-induced breakouts indicates that this region is in a state of compression suitable forsupporting reverse and strike-slip faulting. We calculated a stress tensor using the reported S H m a x direction for Site 765,along with fault-slip data from the 1979 Ms = 5.7 Broome earthquake located on the western continental shelf. Resultsindicate a state of compression, while the minimum horizontal compressive stress (Shm i n) is approximately equivalent tothe vertical overburden (i.e., 5 2, S3, and Sv). These results are supported by the widespread occurrence of both strike-slipand reverse types of earthquakes in western Australia.
INTRODUCTION
Knowledge of the state of stress is important for understandingplate-driving forces. A wealth of information about the state ofstress for continental crust has been collected from a variety ofsources (Zoback et al., 1989). The bulk of these data is fromcompressional axes (P-axis) associated with well-constrainedfocal mechanism solutions and from in-situ measurements ofstress-induced wellbore breakouts. To date, the state of stress inthe oceanic lithosphere is largely limited to F-axes from oceanicintraplate and interplate earthquakes (Bergman and Solomom,1985). In-situ stress from wellbore breakouts in deep boreholeswithin the oceanic crust has been measured near the Mid-AtlanticRidge in DSDP Hole 395A (Hickman et al., 1984) and in theeastern Pacific in DSDP/ODP Hole 504B (Newmark et al., 1984;Morin et al., 1990). Prior to the drilling of Hole 765D, no in-situstress measurements had been collected in the Indian Ocean.
The greater Indo-Australian Plate is associated with the high-est rate of intraplate deformation. This is particularly true in theIndian Ocean, where the deformation is manifest in the occurrenceof widespread intraplate seismicity (Bergman and Solomon,1985) and by indulations within the basement topography andgeoid height (McAdoo and Sandwell, 1985). However, the exactnature and origin of the tectonic stresses responsible for thisdeformation remain largely unknown. Therefore, one of the ob-jectives for initiating a multiple-leg drilling program in the IndianOcean (Legs 115 through 123) was to use in-situ methods tounderstand the nature of this intraplate deformation better. Thisstudy presents data about stress orientations from in-situ measure-ments collected in 140-Ma-old crust at depths of 6700 to 8650 mbelow sea level (bsl; 980-1125 mbsf) in Hole 765D using theborehole televiewer (BHTV).
The use of the BHTV logging tool allowed us to conductdetailed observations of the borehole wall on a scale of centime-
1 Gradstein, F. M., Ludden, J. N., et al., 1992. Proc. ODP, Sci. Results, 123:College Station, TX (Ocean Drilling Program).
2 Department of Geophysics, Stanford University, Stanford, CA 94305, U.S.A.3 United States Geological Survey, Menlo Park, CA 94025, U.S.A.4 Present address: UNAVCO-SERIES, Campus Box 449, University of Colo-
rado-Boulder, Boulder, CO 80309, U.S.A.
ters. With this information, we were able to determine the princi-pal stress orientations as a function of depth. Regional stressorientations for the oceanic crust in the Argo Abyssal Plain (thisstudy) and the continental shelf of western Australia (WorldStress Project) are used to investigate the nature of lithospherecoupling between the oceanic and continental crust. The proxim-ity of Site 765 to the Java Trench (Fig. 1) also enabled us toinvestigate to what degree the downgoing slab has dictated thestresses seaward of the trench.
METHODS
Principles of Wellbore Failure
Grough and Bell (1981) and Bell and Grough (1983) initiallyproposed that breakouts are spalled regions of the wellbore thatdevelop in the direction of the least horizontal far-field stresses.It is well known that breakouts are the result of localized shear-failure around the borehole in response to the concentration ofcompressive stress (maximum circumferential stress) that exceedsthe compressive strength of the rock (Zoback et al., 1985). Zobacket al. (1985) used a Mohr-Coulomb criterion to account for theshape of the breakout and later proposed a method of estimatingthe horizontal stresses if the shape or width of the breakout werewell-constrained (Barton et al., 1988; Moos and Zoback, 1990).
At the borehole wall, the circumferential stress, σθ θ, is givenby
σθ θ = SHm a x + Shmin - 2(SHmax - cos 2θ - 2P0,
where SHm a x and Shm i n are the maximum and minimum hori-zontal principal stresses, respectively; the angle θ is measuredwith respect to the direction of the maximum horizontal principalstress; and Po is the pore pressure in the borehole. Under condi-tions of unequal horizontal principal stresses, the circumferentialstress has a maximum value at θ = ± π/2 and its minimum at θ =0, as shown in Figure 2. Wellbore breakouts therefore will formwhen the compressive stress concentration exceeds the compres-sive strength of the rock, Co, or
σθ θ = SHm a^ - 2(SHmax - Shm i n) cos 2θ - 2P0 Co, (2)
503

D. A. CASTILLO, B. O'NEILL
12°S -
WESTERN AUSTRALIA
24
Figure 1. Location of Site 765 in the Argo Abyssal Plain.
Shm In
Minimum
(3Shmm-SHmax)
W-
Breakout
Breakout development BHTV data
θ measured from SHmax
Circumferential stresses
Figure 2. A. Schematic representation of the breakout process, showing
the angle of breakout extent, ab, where §b = Yl/2 - ab. B. BHTV data
(right) over a breakout interval, where polar cross sections delineate the
breakout shape. The radial lines indicate the picks of the breakout width.
Breakout azimuth is the bisector of the angle αb. C. The variation in
circumferential stress, σ θ θ, is a function of q measured from SH m a x .
plotted in Figure 2B, is the case for an arbitrary horizontalstress distribution. At Co = C3, the borehole should be devoid ofbreakouts because rock strength should exceed the stress concen-tration everywhere around the borehole. However, at Co = C2, abreakout should form and expand out to α b (dashed line in Fig.2B).
Borehole Televiewer
The BHTV is an ultrasonic well-logging tool useful for meas-uring the orientation and distribution of stress-induced wellborebreakouts and fractures and for analyzing lithostratigraphic as-semblages. The BHTV used in the ODP community is an analogdevice that contains a transducer emitting a 1.4-MHz focused 3°acoustic beam at a rate of 1800 pulses/s. To attain completeazimuthal coverage of the borehole wall, the transducer rotates atabout 3 rev/s, while the tool logs up the hole at a speed of about2.5 cm/s. A fluxgate magnetometer inside the tool provides ori-entation with respect to magnetic north. Analog data are transmit-ted up the co-axial logging cable and recorded on videotape forlater processing.
The ultrasonic seismograms undergo an analog-to-digital con-version by windowing the reflected pulse and digitizing at 1-µsintervals (Barton, 1988). This process produces both amplitudeinformation (pertaining to the wellbore's reflectivity) and travel-time information, which is needed to determine hole geometry andto detect breakouts. The borehole geometry can best be analyzedby constructing polar cross sections for interactive selection ofthe breakout azimuths and breakout width (Fig. 2B).
The BHTV was run twice in Hole 765D. During the first run,the centralizing bow springs were too stiff and pressed against theborehole wall too tightly. At logging speeds of 2.5 cm/s, the toolresisted upward movement and often continued to log the samesection of the hole for several seconds. Eventually, an increase intensional stresses in the logging wire caused the tool to jerkswiftly up the hole, often bypassing large sections of the hole.
504

STATE OF STRESS IN OLD OCEANIC CRUST
Complete borehole coverage thus was not possible during thisfirst run. Fortunately, smaller and more responsive bow springswere installed before the second run, enabling us to collect anear-complete log. Results of the analysis for the second run arepresented here.
BREAKOUT ANALYSISObservations of stress-induced wellbore breakouts are limited
to the basalt formation of Hole 765D, because BHTV coveragedoes not extend into the overlying sediments. These breakouts areclustered in three different sections of the well: 1123 to 1108,1046 to 1034, and 988 to 968 mbsf. The orientations, character,and distribution of the breakouts, as well as the associated lithol-ogy of the spalled rocks, differ slightly and therefore warrantseparate discussions.
Interval 1 (1123-1108 mbsf)The deepest suite of breakouts (Interval 1) occurs within a
monotonous section of aphyric pillow basalts, where both freshand devitrified glass rinds are found on the pillows margins (Hole765D basement Unit 15, Ludden, Gradstein, et al., 1990). Small,brecciated horizons bound some of the pillows, but poor-to-in-complete core recovery makes mapping the size of the pillows andfractured zones difficult.
In general, the breakouts within Interval 1 are of exceptionalquality (Figs. 3A and 3B). Despite shortcomings of a slightlyoff-centered tool, first-order measurements of the breakouts showconsistent orientations with depth, where breakout widths aregenerally less than 40° (Figs. 3A and 3B). A simple average forSHmax for all 250 observations (every 2 cm) is 120.1°N ±8.3°(Figs. 4 and 5). Second-order features, occurring at wavelengthson the order of 10 to 40 cm, include minor discontinuities in thestyle of wellbore failure. The borehole wall appears to alternateslightly between zones with well-developed breakouts and areasof presumably intact rock devoid of breakouts (Figs. 3 A and 3B).Because significant changes in the circumferential stresses are notexpected to occur at this scale, the depth variability of the break-outs may be related to small-scale changes in the compressivestrength of the rock with depth. Marked increases in reflectivityoccur at both the centimeter and meter scale as the log leaves abreakout interval and enters a zone of intact rock, devoid ofcompressive failure. Consequently, any change in reflectivitywould represent a textural change in the host rock, such as a subtletransition between the margins and the center of individual pil-lows or brecciated zones within the pillow basalts.
Interval 2 (1046-1034 mbsf)
The intermediate breakout (Interval 2) occurs within a sparselyphyric pillow basalt section (Hole 765D basement Unit 9, Ludden,Gradstein, et al., 1990). Unit 9 is distinguished from Unit 15 bythe lack of any brecciated fractures. Although, the character of thepillow margins is similar to those in Unit 15, poor core recovery(15%) makes mapping the pillows very difficult.
The breakout widths within Interval 2 are considerably moremassive and asymmetric (Figs. 3C and 3D). The side of thebreakout trending -220° is more than 60° wide. The oppositebreakout average is about 43° wide. The discontinuity of thebreakouts at this intermediate depth is somewhat similar to thatfound in the deeper section (1123 to 1108 mbsf). Although Inter-val 2 is shorter than its deeper counterpart, the orientations remainroughly consistent, showing that SHmax is about 133.7°N ±12.2°(Figs. 4 and 5).
Interval 3 (988-986 mbsf)The shallowest suite of breakouts (Interval 3), and also the
shortest (2 m), appears to have developed within a massive layer
of basalt flows with intermediate layers of pillow basalts andhyaloclastic material (Hole 765D basement Unit 3, Ludden, Grad-stein, et al., 1990). Because the core recovery in Core 123-765D-5R was complete, with many of the sections containing largecoherent pieces of rock, it may be possible to identify the rocksassociated with this breakout interval.
The extent of wellbore failure for this 2-m breakout intervalwas slightly asymmetric, with the most pronounced breakoutoccurring at 180°N (Figs. 3E and 3F). Average widths again areabout 40°. Aside from these small differences, the evidence for awell-developed breakout because of wellbore failure is convinc-ing. However, the most notable difference between these break-outs and the others is the inferred SHmax direction of 91.6°N ±5°(Figs. 4 and 5).
No immediate explanation is available for this change in di-rection, but similar features have been observed at Cajon Pass,California, near the San Andreas Fault. In this deep well (3.5 km),major changes in the stress field have been associated with placeswhere the wellbore has intersected faults believed to be active(Shamir and Zoback, in press).
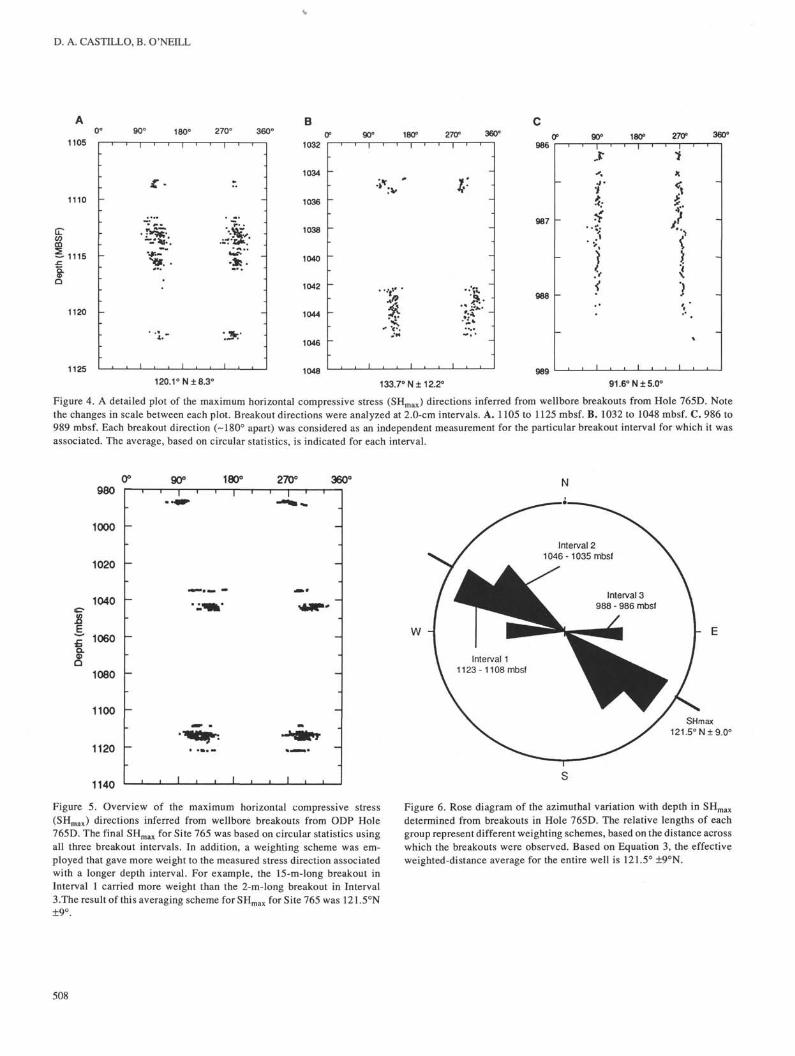
The statistical average of all three breakout intervals wasdetermined using circular statistics (Mardia, 1972) and by placingadditional weight on the breakouts that occurred over a longerdepth interval (Figs. 4 and 5). The expression that describes thismethod is given below,
(3)
where SHW is the distance-weighted average for SHmax in thishole; L, is the length of interval /; and SH(, is the average SHmax
direction for interval i.For example, the deeper 15-m interval should carry more
statistical weight than the shallower 2-m interval. Figure 6 is arose diagram showing the orientation for each breakout interval,as well as the distance-weighted average for the entire well. Thefinal direction of SHmax for this site is 121.5°N ±9.0° (Fig. 6). Ifthe SHmax direction of 91.6°N ±5° from the shallower intervalwere excluded from this average, the SHmax for the site should be126°N±9.0°.
DISCUSSION
Regional Stress Field IndicatorsCompilation of principal stress directions worldwide has
provided a valuable tool with which to address the nature ofplate-driving forces (Fig. 2 of Zoback et al., 1989). In particular,stress indicators from industry wells drilled in the Exmouth Pla-teau, southwest of Hole 765D, show an average direction of about120°N. This is in excellent agreement with the 121.5°N ±9°orientation for SHmax, inferred from breakouts in Hole 765D (Fig.7). Contemporary effects from this compressive stress directionmay be found in the Exmouth and Scott plateaus near the edge ofthe ocean/continent boundary in northwestern Australia. Theseregions are associated with Holocene-age structural highs alonga series of synclines that trend parallel to the northwest margin ofAustralia (Exon and Wilcox, 1980). The development of thesenorth-to-northeast trending structural highs and the internal con-sistency in the reported SHmax orientations for both Site 765 andthe Exmouth Plateau, the Scott Plateau, and the Timor Sea (Fig.7) suggest that the present-day stress field is responsible for thesestructures. Stress data from the onshore Canning Basin of western
505

D. A. CASTILLO, B. O'NEILL
A
1113.6 mbsf
0° 90° 180° 270° 360°
1113
-Q
1114
1115
270° — — 90°
1801113.9 mbsf
1114.3 mbsf
11 13Borehole radius - cm
15 17 191115.4 mbsf
Figure 3. Borehole televiewer imagery. A. Selected (1116-1111 mbsf) BHTV images from breakout Interval 1. Colorenhancements of the BHTV data are plotted by simulating an unwrapped portrait of the borehole from 0° to 360°. The azimuthis magnetically corrected for true north. The color scheme is used to scale the borehole radius, where distances from thetool's center range from red (farthest) to purple (closest). The breakouts are represented by the vertical black-banded imageson the right, representing unreflected sonic energy. B. The polar cross sections from Interval 1 clearly illustrate the boreholeelongation despite the tool's being off-centered. Note the subtle changes in reflectivity between the breakout zones and thelayers void of breakouts. C , D. Selected (1045-1041 mbsf) BHTV images from breakout Interval 2. Explanations for C andD are similar to those for A and B. Note that the width of the breakouts (D) is considerably greater than that observed inInterval 1. E., F. Selected (989-983 mbsf) BHTV images from breakout Interval 3. Explanations for E and F are similar tothose for A and B. Note the asymmetry in the breakouts in this interval.
Australia (700 km southeast of Site 765) exhibit a markedlydifferent stress orientation of approximately 50°N. This may bean example of a separate stress province because compressionalaxes (P-axes) from earthquakes farther eastward revert back to astress direction consistent with the offshore stress data (Fig. 7).The east-west trending SHmax direction immediately south of theJava Trench should not be considered representative of intraplatestresses. This north-south Shmin direction inferred from the 1977M = 8.2 Sumba normal faulting earthquake has been interpretedas either an interplate coupling event along the Java-Timor arc(Stewart, 1978; Given and Kanamori, 1980) or a plate-bendingevent (Hanks, 1979). Therefore, one should not rely upon theSumba event as an indicator of intraplate stresses.
Regional Seismicity
The western section of the Australian continent is associatedwith high levels of seismicity (Fig. 8 and Fig. 1 of Fredrich et al.,1988). One of the largest earthquakes reported in the past 20 yrwas the 23 April 1979 Broome earthquake (Ms = 5.7). Based onaftershocks associated with the main event, faulting was almostpure left-lateral strike-slip along a northwest-trending fault planethat dips about 80° to the northeast. The focal mechanism andcentroid depth (27 ±3 km) were determined from body waveforminversions (Fredrich et al., 1988). This centroid depth and esti-
mates of the crustal thickness from seismic reflection data (Staggand Exon, 1981) indicate that the event occurred within the lowercrust or upper mantle. The P-axis from the focal mechanismsolution for the Broome earthquake was 90°N ±5°, which isconsistent with other large western Australian earthquakes (Fig.8). This direction, however, is within 30° of the SHmax directionsreported here.
Compressional axes of focal mechanisms of large historicalearthquakes east of the Ninetyeast Ridge, within the Indo-Austra-lian Plate, indicate northwest-southeast compression accommo-dated by strike-slip and thrust faulting (Weins, 1984; Weins et al.,1985; Petroy and Weins, 1989). This regional stress direction isconsistent with breakout observations from Hole 765D and otherbreakout observations.
Previous Stress ModelsThe observed SHmax direction of 120°N differs by about 30°
from the direction (SHmax = 90°N) predicted by finite-elementmodels of Richardson (1987) and Cloetingh and Wortel (1986).Although the geometry of the two models was nearly identical,the magnitudes of the principal stresses were markedly different.Cloetingh and Wortel (1986) calculated a predominantly ten-sional stress field on the order of 200 MPa in the vicinity of Site765, while Richardson (1987) predicted tensional stresses near 10
506

STATE OF STRESS IN OLD OCEANIC CRUST
B
1035
1042
£1043
1044
1045
0° 90° 180° 270° 360
1044.5 mbsf
270° —
1045.5 mbsf
180°
— 90°
Borehole radius - cm10 12 14 16 18 20
1045.3 mbsf
1045.7 mbsf
989
90° 180° 270° 360°
10
987.1 mbsf
2702—
180°
988.0 mbsf
Borehole radius - cm12 14 16 18 20
— 90
987.4 mbsf
988.2 mbsfFigure 3 (continued).
507
D. A. CASTILLO, B. O'NEILL
90° 180° 270° 360°1105
1110 -
S- 1115
IQ
1120 -
1125
1 1 I I 1 I
: %
i , , i
r. ;
M: ."31 •
i
0°1032
1034
1036
1038
1040
1042
1044
1046
-
—
-
-
-
90°1 I
.i
, i
• • j • • "
'"ilk
180°
-
•
I
270° 3«1
I'
--
t-i I i i
986
987 -
988 -
989120.1° N ±8.3° 133.7° N± 12.2°
90" 180° 270° 360°i i I i i I
r
V
I<
I I I I
ft
J
i i 1 i i
91.6° N±5.0°
Figure 4. A detailed plot of the maximum horizontal compressive stress (SHmax) directions inferred from wellbore breakouts from Hole 765D. Notethe changes in scale between each plot. Breakout directions were analyzed at 2.0-cm intervals. A. 1105 to 1125 mbsf. B. 1032 to 1048 mbsf. C. 986 to989 mbsf. Each breakout direction (-180° apart) was considered as an independent measurement for the particular breakout interval for which it wasassociated. The average, based on circular statistics, is indicated for each interval.
980
1000 -
1120 ~
1140
Figure 5. Overview of the maximum horizontal compressive stress(SHmax) directions inferred from wellbore breakouts from ODP Hole765D. The final SHmax for Site 765 was based on circular statistics usingall three breakout intervals. In addition, a weighting scheme was em-ployed that gave more weight to the measured stress direction associatedwith a longer depth interval. For example, the 15-m-long breakout inInterval 1 carried more weight than the 2-m-long breakout in Interval3.The result of this averaging scheme for SHmax for Site 765 was 121.5°N±9°.
Figure 6. Rose diagram of the azimuthal variation with depth in SHmax
determined from breakouts in Hole 765D. The relative lengths of eachgroup represent different weighting schemes, based on the distance acrosswhich the breakouts were observed. Based on Equation 3, the effectiveweighted-distance average for the entire well is 121.5° ±9°N.
508

STATE OF STRESS IN OLD OCEANIC CRUST
20° S -
40c
Scott Plateau
ODP HOLE 765DCanning Basin
E×mouth Plateau
1979 Ms = 5.9Broome Earthquake
INDIAN OCEAN
Focal mech.BreakoutsFault slip
— Volcanic alignHydrofracOvercore
100° E 120c 140c 160c
Figure 7. Regional stress map of the Indo-Australian Plate showing the orientations of the maximum horizontal compressive stress (SHmax ), based ona variety of stress indicators (Zoback et al., 1989). These indicators include wellbore breakouts from industry wells, P-axes from well-constrainedearthquake focal mechanism solutions, hydraulic-fracturing experiments in wells, and geologic features (such as dike alignments). The results fromHole 765D indicate that the principal stress direction at this site is about 121.5°N ±9.0°. The 1979 Ms = 5.7 Broome earthquake used here was locatedabout 300 km east of Site 765.
MPa. Each of these models placed varying emphasis on the forcesdistributed throughout the plate, as well as the forces acting alongthe boundaries. The modeled plate-driving and resisting forcesincluded ridge-push, slab-pull, slab-resistant, and collisionalforces at the boundaries and basal drag forces.
Unfortunately, attempts to distinguish between these twomarkedly different stress models by in-situ measurements ofstress magnitudes within the oceanic crust of Hole 765D wereunsuccessful. However, what follows is an attempt to constrainthe relative magnitudes of the principal stresses active at Site 765,using information about the depth of breakouts, generalized as-sumptions about the compressive strength of basalt, and focalmechanism solutions from regional earthquake data.
ADDITIONAL CONSTRAINTS ON THE STATE OFSTRESS
Although the stress orientation determined from BHTV datain Hole 765D can be considered as one observation, it is importantto emphasize that this orientation is consistent with other stressorientations observed in nearby industry wells (Fig. 7). Conse-quently, we use the Hole 765D breakout information to constrain
the current stress field and to make generalized estimates of stressmagnitudes expected in this section of the Indo-Australian Plate.Two independent criteria are used to develop these stress-regimeconstraints: the occurrence of breakouts and linear stress relation(Φ), which describes the relative relationship between the threeprincipal stress magnitudes. The ideal situation might be to deter-mine stress magnitudes from hydraulic fracturing experiments,but an attempt to do this during Leg 123 was unsuccessful.
Breakout Method
Moos and Zoback (1990) successfully placed constraints onthe occurrence of breakouts in relatively young oceanic crust atDSDP Hole 395 A and ODP Hole 504B. Following their approach,we use the criterion for wellbore failure and estimates of thecompressive strength of oceanic basalts (Bauer and Handin, 1985)to constrain the relative principal stress magnitudes.
Estimates of the principal stress magnitudes, and therefore thestress regime, are based on the assumption that one of the princi-pal stresses is vertical and equivalent to the overburden load (Sv)and that the remaining two principal stresses are horizontal (SHm a x
and Shm i n). We further assume, as suggested by Sibson (1974),that the ratio of the effective maximum to effective minimum
509

D. A. CASTILLO, B. 0'NEILL
20° S
40<
1970 Ms = 5.9Canning Basin Eq.
1979 Ms = 6.0Cadoux Eq.
INDIAN OCEAN
1968 Ms = 6.8Meckering Eq.
100° E 125C150c
Figure 8. Epicenters of the major earthquake clusters that have occurred in western Australia and surrounding offshore areas for the period 1964 to1987. Data are from the International Seismic Centre (ISC). Focal plane solutions for the major earthquakes are indicated with the compressionalquadrants filled. The P-axis (tick mark) is shown bisecting the dilatational quadrant. The 1979 Ms = 5.7 Broome earthquake used here was locatedabout 300 km east of Site 765 (after Fredrich et al., 1988).
stresses cannot exceed that required to cause slip on preexistingfaults optimally oriented with the stress field. If the above as-sumptions are correct, the stress constraint for any stress regimecan be described in the following manner (Jeager and Cook,1979):
where S,, 53, and Po are the maximum principal stress, mini-mum principal stress, and pore pressure, respectively, and µ is thecoefficient of friction for preexisting fault planes. In seismicallyactive regions, in-situ stress measurements using hydraulic frac-turing techniques have confirmed that these constraints on stressmagnitudes are generally correct (McGarr, 1980; Zoback andHealy, 1984).
Anderson's faulting theory (Anderson, 1951) implies the fol-lowing relationship between the observed style of faulting and thestate of stress regimes: in a normal faulting stress regime 5V >SHmax > Shmin; in a strike-slip faulting stress regime, SHmax > Sv
> Shmin; and in a reverse faulting stress regime, SHmax > Shmin >Sy.
We used µ = 0.8 in Equation 3 for a depth of 1125 mbsf(occurrence of deepest breakouts) to make reasonable estimatesof the minimum and maximum stress magnitudes for both normal
and reverse faulting regimes. For the strike-slip faulting case, weassume that 5V = (Sx + S3)/2. For reference, the vertical overburdenwas determined using seawater, sediment, and basalt densities of1020, 2200, and 2850 kg/m3, respectively. We used a water depthof 5724 m and a sediment thickness of 932 m. For completeness,Table 1 shows the variation of stresses for the three possible stressregimes using a range of µ-values (i e., µ = 0.6,0.8, and 1.0). Onlyin the strike-slip regime are both horizontal stresses estimatedfrom Equation 4.
For the special case of a normal faulting stress regime, whereSv = S, ~S2, the condition is such that both normal and strike-slipearthquakes will occur on optimally oriented faults. For example,dipping faults whose strike is approximately near-perpendicularto the Shmin (or S3) direction will be associated with normalfaulting events. On the other hand, vertical faults oriented about45° to the same principal horizontal stress directions will experi-ence strike-slip faulting. For a reverse faulting stress regime,where Sv = S3 ~S2, the condition is such that both reverse andstrike-slip earthquakes will occur on optimally oriented faults. Inthis case, dipping faults whose strike is approximately near-per-pendicular to SHmax (or Sj) direction will be associated withreverse faulting events. On the other hand, vertical faults againoriented about 45° to the two principal horizontal stress directionswill experience strike-slip faulting.
510
STATE OF STRESS IN OLD OCEANIC CRUST
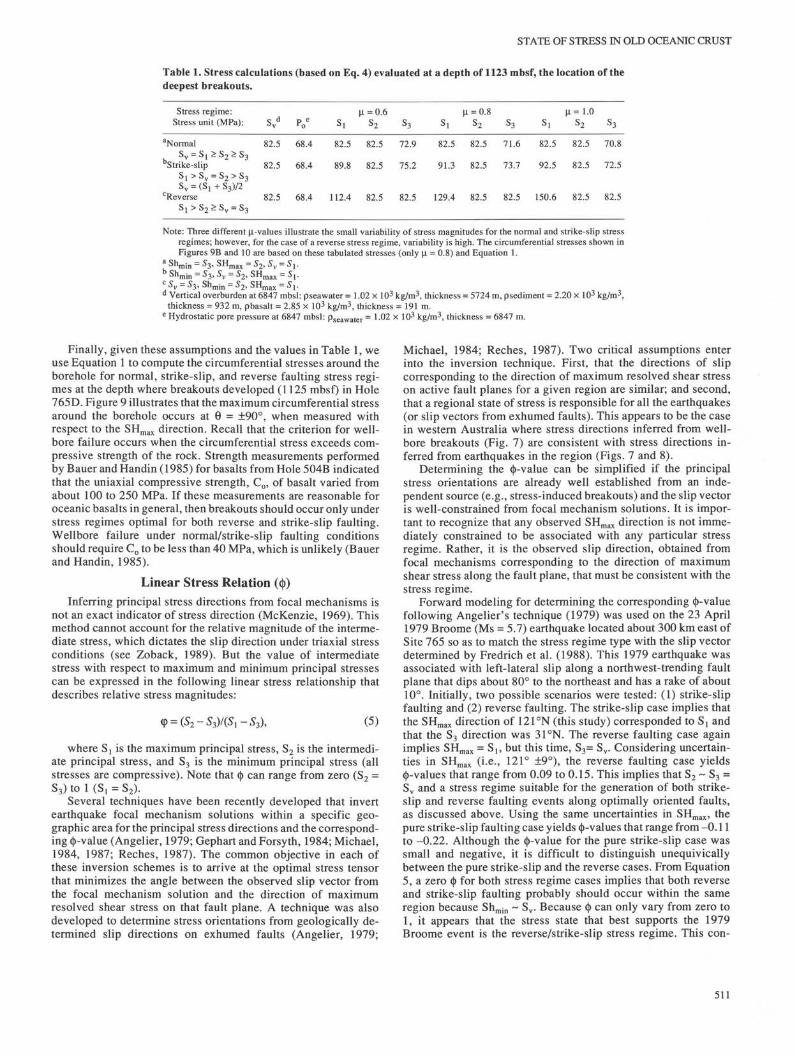
Table 1. Stress calculations (based on Eq. 4) evaluated at a depth of 1123 mbsf, the location of thedeepest breakouts.
Stress regime:Stress unit (MPa):
µ = 0.6s l S2 S3
µ = 0.8 µ = 1.0S2 S3
aNormalSv = Sj S2 S3
bStrike-slipSj > Sy = S2 ^ S^S v = (Sj + S3) /2
c ReverseSj > S2 Sy = S3
82.5
82.5
68.4
68.4
82.5
89.8
82.5
82.5
72.9
75.2
82.5
91.3
82.5
82.5
71.6
73.7
82.5
92.5
82.5
82.5
70.8
72.5
82.5 68.4 112.4 82.5 82.5 129.4 82.5 82.5 150.6 82.5 82.5
Note: Three different µ-values illustrate the small variability of stress magnitudes for the normal and strike-slip stressregimes; however, for the case of a reverse stress regime, variability is high. The circumferential stresses shown inFigures 9B and 10 are based on these tabulated stresses (only µ = 0.8) and Equation 1.
* Snmin = S 3 ' SHmax = S2'Sv = Sl•Snmin = % Sv = S2' SHmax = Sl•
CSV = S3, Shmin = S2, SHm a x = SVd Vertical overburden at 6847 mbsl: pseawater = 1.02 × 10³ kg/m3, thickness = 5724 m, psediment = 2.20 × 10³ kg/m3,
thickness = 932 m, pbasalt = 2.85 × 10³ kg/m3, thickness = 191 m.e Hydrostatic pore pressure at 6847 mbsl: pseawater = 1-02 × 103 kg/m3, thickness = 6847 m.
Finally, given these assumptions and the values in Table 1, weuse Equation 1 to compute the circumferential stresses around theborehole for normal, strike-slip, and reverse faulting stress regi-mes at the depth where breakouts developed (1125 mbsf) in Hole765D. Figure 9 illustrates that the maximum circumferential stressaround the borehole occurs at θ = ±90°, when measured withrespect to the SHm a x direction. Recall that the criterion for well-bore failure occurs when the circumferential stress exceeds com-pressive strength of the rock. Strength measurements performedby Bauer and Handin (1985) for basalts from Hole 504B indicatedthat the uniaxial compressive strength, Co, of basalt varied fromabout 100 to 250 MPa. If these measurements are reasonable foroceanic basalts in general, then breakouts should occur only understress regimes optimal for both reverse and strike-slip faulting.Wellbore failure under normal/strike-slip faulting conditionsshould require Co to be less than 40 MPa, which is unlikely (Bauerand Handin, 1985).
Linear Stress Relation (Φ)
Inferring principal stress directions from focal mechanisms isnot an exact indicator of stress direction (McKenzie, 1969). Thismethod cannot account for the relative magnitude of the interme-diate stress, which dictates the slip direction under triaxial stressconditions (see Zoback, 1989). But the value of intermediatestress with respect to maximum and minimum principal stressescan be expressed in the following linear stress relationship thatdescribes relative stress magnitudes:
where S! is the maximum principal stress, S2 is the intermedi-ate principal stress, and S3 is the minimum principal stress (allstresses are compressive). Note that Φ can range from zero (S2 =S3) to 1 (S, = S2).
Several techniques have been recently developed that invertearthquake focal mechanism solutions within a specific geo-graphic area for the principal stress directions and the correspond-ing Φ-value (Angelier, 1979; Gephart and Forsyth, 1984; Michael,1984, 1987; Reches, 1987). The common objective in each ofthese inversion schemes is to arrive at the optimal stress tensorthat minimizes the angle between the observed slip vector fromthe focal mechanism solution and the direction of maximumresolved shear stress on that fault plane. A technique was alsodeveloped to determine stress orientations from geologically de-termined slip directions on exhumed faults (Angelier, 1979;
Michael, 1984; Reches, 1987). Two critical assumptions enterinto the inversion technique. First, that the directions of slipcorresponding to the direction of maximum resolved shear stresson active fault planes for a given region are similar; and second,that a regional state of stress is responsible for all the earthquakes(or slip vectors from exhumed faults). This appears to be the casein western Australia where stress directions inferred from well-bore breakouts (Fig. 7) are consistent with stress directions in-ferred from earthquakes in the region (Figs. 7 and 8).
Determining the Φ-value can be simplified if the principalstress orientations are already well established from an inde-pendent source (e.g., stress-induced breakouts) and the slip vectoris well-constrained from focal mechanism solutions. It is impor-tant to recognize that any observed SHm a x direction is not imme-diately constrained to be associated with any particular stressregime. Rather, it is the observed slip direction, obtained fromfocal mechanisms corresponding to the direction of maximumshear stress along the fault plane, that must be consistent with thestress regime.
Forward modeling for determining the corresponding Φ-valuefollowing Angelier's technique (1979) was used on the 23 April1979 Broome (Ms = 5.7) earthquake located about 300 km east ofSite 765 so as to match the stress regime type with the slip vectordetermined by Fredrich et al. (1988). This 1979 earthquake wasassociated with left-lateral slip along a northwest-trending faultplane that dips about 80° to the northeast and has a rake of about10°. Initially, two possible scenarios were tested: (1) strike-slipfaulting and (2) reverse faulting. The strike-slip case implies that
(5) the SHm a x direction of 121°N (this study) corresponded to Sj andthat the S3 direction was 31°N. The reverse faulting case againimplies SHm a x = Sj, but this time, S3= Sv. Considering uncertain-
ties in SHm a x (i.e., 121° ±9°), the reverse faulting case yieldsΦ-values that range from 0.09 to 0.15. This implies that S2 ~ S3 =Sv and a stress regime suitable for the generation of both strike-slip and reverse faulting events along optimally oriented faults,as discussed above. Using the same uncertainties in SHm a x, thepure strike-slip faulting case yields Φ-values that range from -0.11to -0.22. Although the Φ-value for the pure strike-slip case wassmall and negative, it is difficult to distinguish unequivicallybetween the pure strike-slip and the reverse cases. From Equation5, a zero Φ for both stress regime cases implies that both reverseand strike-slip faulting probably should occur within the sameregion because Shm i n ~ Sv. Because Φ can only vary from zero to1, it appears that the stress state that best supports the 1979Broome event is the reverse/strike-slip stress regime. This con-
511

D. A. CASTILLO, B. O'NEILL
AP
a)St
ress
(M
CO
£ 3 U
200
150
100
50
0
i
- \
~>. \
• \ \
normal/strikθ-slip
i
1 1
reverse/strike-slip /
µ -
µ=0.6
-strike-slip
µ
0.8
/
-1.0
^ <
h
i
—
-90 -45 0 45
Angle theta measured w.r.t. SHma×
90
B250
200
50
-50
0.8@1125mbβf
normal/strike-slip
-90 -45 0 45Angle theta measured w.r.t. SHmax
90
Figure 9. A. Plot of the circumferential hoop stresses (in MPa) as afunction of angle θ from the S H m a x direction. The nine curves correspondto the estimated stresses for normal/strike-slip, strike-slip, and reverse/strike-slip faulting stress regimes using coefficients of friction of µ = 0.6,0.8, and 1.0, respectively, in Equation 4. See text and Table 1 for detailsabout stress computations. B. Plot of the circumferential hoop stresses (inMPa) as a function of angle θ from the S H m a x direction., using a µ-valueof 0.8. Note: if the compressive strength (Co) of basalt falls within therange of 100 to 250 MPa, breakouts should be expected to develop onlyunder reverse/strike-slip and/or pure strike-slip faulting conditions, withΦ ~ 0. Normal faulting stress regimes could not generate the appropriatestress concentrations to cause wellbore breakouts.
elusion is consistent with the occurrence of both styles of faultingseen in western Australia (Fig. 8). Additional in-situ data andlarge earthquakes might further constrain the state of stress in thearea. The same test for Φ-values for a normal faulting stress regime(Sv = Sj and S3 = 31°N) produced results far outside the allowableΦ = 0 to Φ = 1 range.
Figure 10 illustrates the circumferential stress distribution fora reverse faulting stress regime with Φ ranging from zero to 1. The
CD
α.
200
150 =:
100 ~
V) 50 -
0 -
-50
1
-
-
1
1 1
\
1 1
1 1
-1.0
\
Φ -o \
i i
i
- 0 . 5
) - 0 . 1
V .
1
1
*×
ys
1
1
y
1
1 1 1
f 'I
1 1 1
-90 -60 -30 0 30Angle theta w.r.t. SHma×
60 90
Figure 10. Plot of the circumferential hoop stresses (in MPa) as a functionof angle θ from the S H m a x direction. Curves correspond to estimatedstresses for a reverse/strike-slip faulting case for Φ ranging from zero to1. The curve Φ = 0.1 is the result of matching the regional stress field tothe slip vector reported for the 1979 Ms = 5.9 Broome earthquake (seetext for details). Note that for the case of Φ = 1.0, should the compressivestrength be less than 125 MPa, breakouts should develop omni-direction-ally, because equivalent horizontal stresses produce no stress concentra-tion.
Φ = 0.1, from the above tensor calculation, is included for clarifi-cation. When Φ = 1-0, both horizontal stresses should be equiva-lent, and breakouts should be omni-directional if the compressivestrength of the basalt were less than 125 MPa. Although specula-tive at this stage, the spatial distribution of these stress-inducedbreakouts suggests that the compressive strength of basalt appearsto fluctuate about the average maximum circumferential stressconcentration. A detailed compressive strength "log" of the coresamples from this hole will be required to verify the exact stressstate.
The source of this stress is still unresolved. The SHm a x direc-tion is oblique to the absolute plate motion vector (Minster andJordon, 1978; DeMets et al., 1990), suggesting that stresses arenot responding completely to basal drag and ridge-push as theplate moves northward toward the Java Trench. The proximity ofthe Australian continental margin to the Java Trench may be asecondary source of drag forces that acts to resist northward platemotion. However, the tensional stresses imposed by trench-pullforces at the Java Trench appear not to be transmitted far into theinteriors of the Indo-Australian Plate.
CONCLUSIONS
Detailed BHTV analyses from Hole 765D in the southern limitof the Argo Abyssal Plain in the Indian Ocean northwest of theAustralian continental margin show that the maximum horizontalcompressive stress (SHm a x) direction is about 121.5°N ±9°. Thisstress direction is consistent with other stress indicators fromoffshore industry wells in the Exmouth and Scott plateaus. Con-sidering the criterion for wellbore failure and the compressivestrength of basalt, the breakouts observed in Hole 765D supportthe interpretation that the northeast Indo-Australian Plate southof Java and northwest of Australia is in a state of compression.Stress-tensor calculations using the slip vector determined frombodywave inversion of the 1979 Ms = 5.7 Broome left-lateralstrike-slip earthquake (Fredrich et al., 1988) along with the as-sumption that the stress tensor at Site 765 is similar to that of theearthquake (300 km from Site 765) also suggest that northwesternAustralia is in a state of compression with intermediate stress (S2
512

STATE OF STRESS IN OLD OCEANIC CRUST
or Shmin) being approximately equivalent to the vertical overbur-den (Sv). These results are supported by the widespread occur-rence of both strike-slip and reverse-type earthquakes in thenorthwest section of the Indo-Australian Plate in western Austra-lia. However, a tensional state of stress for this section of theIndo-Australian Plate has been predicted (Cloetingh and Wortel,1986; Richardson, 1987). The occurrence of breakouts suggeststhat a tensional stress field might not produce the stress concen-tration suitable for the formation of breakouts, because the com-pressive stress concentration along the borehole wall might neverexceed the compressive strength of the basalt.
ACKNOWLEDGMENTS
We thank the crew of the JOIDES Resolution and the support-ing ODP staff for making this research possible. Special thanksto C. Barton for developing the software for BHTV analyses. Wealso thank M. D. Zoback, G. Shamir, D. Moos, and C. Barton fortheir help with the reduction and analysis of data and M. L.Zoback for the use of her program for determining the Φ-value.We extend our appreciation to M. Magee, M. L. Zoback, andM. D. Zoback for their assistance with the World Stress DataBase. We also thank G. Beroza for his assistance with generatingthe seismicity map from ISC data. The authors thank D. Wiens,M. Magee, C. Barton, T. Parsons, and an anonymous reviewer forgreatly improving this manuscript.
REFERENCES
Anderson, E. M., 1951. The Dynamics of Faulting and Dike Formationwith Applications in Britain (2nd ed.): Edinburgh (Oliver and Boyd).
Angelier, J., 1979. Determination of the mean principal directions ofstresses for a give fault population. Tectonophysics, 56:T17-T26.
Barton, C. A., 1988. Development of in-situ stress measurement tech-niques for deep drillholes [Ph.D. dissert.]. Stanford Univ., Stanford.
Barton, C. A., Zoback, M. D., and Burns, K. L., 1988. In-situ stressorientation and magnitude at the Fenton Geothermal site, New Mex-ico, determined from wellbore breakouts. Geophys. Res. Lett., 15:467^70.
Bauer, S. J., and Handin, J., 1985. Mechanical properties of basalt coresfrom Deep Sea Drilling Project Hole 504B. In Anderson, R. N.,Honnorez, J., Becker, K., et al., Init. Repts. DSDP, 83: Washington(U.S. Govt. Printing Office), 371-378.
Bell, J. S., and Gough, D. I., 1983. Northeast-southwest compressivestress in Alberta: evidence from oil wells. Earth Planet. Sci. Lett.,45:475-482.
Bergman, E. A., and Solomon, S. C , 1985. Earthquake source mech-anisms from body-waveform inversion and intraplate tectonics in thenorthern Indian Ocean. Phys. Earth Planet. Inter., 40:1-123.
Cloetingh, S.A.P.L., and Wortel, M.J.R., 1986. Stress in the Indo-Austra-lian Plate. Tectonophysics, 132:49-67.
Demets, C , Gordon, R. G., Argus, D. F., and Stein, S., 1990. Currentplate motions. Geophys. J. Int., 101:425-478.
Exon, N. F., and Willcox, J. B., 1980. The Exmouth Plateau: stratigraphy,structure and petroleum potential. Bull. Bur. Miner. Resour., Geol.Geophys. (Aust.), No. 199.
Fredrich, J., McCaffery, R., and Denham, D., 1988. Source parameters ofseven large Australian earthquakes determined by body waveforminversion. Geophys. J., 95:1-13.
Gephart, J. W., and Forsyth, D. W., 1984. An improved method fordetermining the regional stress tensor using earthquake focal mech-anism data: application to the San Fernando earthquake sequence. J.Geophys. Res., 89:9305-9320.
Given, J. W., and Kanamori, H., 1980. The depth extent of the 1977Sumbawa Indonesian earthquake. Eos, 61:1044. (Abstract)
Grough, D. I., and Bell, J. S., 1981. Stress orientations from oil wellfractures in Alberta and Texas. Can. J. Earth Sci., 18:1358-1370.
Hanks, T. C , 1979. Deviatoric stresses and earthquake occurrence at theouter rise. /. Geophys. Res., 84:2343-2347.
Hickman, S. H., Svitek, J. F., Langseth, M. G., 1984. Borehole televiewerlog of Hole 395A, In Hyndman, R. D., Salisbury, M. H., et al., Init.Repts. DSDP, 78B: Washington (U.S. Govt. Printing Office), 709-715.
Jeager, J. C , and Cook, N.G.W., 1979. Fundamentals of Rock Mechanics(3rd ed.): New York (Chapman and Hall).
Ludden, J. N., Gradstein, F. M., et al., 1990. Proc. ODP, Init. Repts., 123:College Station, TX (Ocean Drilling Program).
Mardia, K. V., 1972. Statistics of Directional Data: London(AcademicPress). McAdoo, D. C , and Sandwell, D. T., 1985. Folding of oceaniclithosphere. /. Geophys. Res., 90:8563-8568.
McGarr, A., 1988. On the state of lithospheric stress in the absence ofapplied tectonic forces. /. Geophys. Res., 93:13609-13617.
McKenzie, D. P., 1969. The relationship between fault plane solutionsfor earthquakes and the directions of the principal stresses. Bull.Seismol. Soc, 59:591-601.
Michael, A. J., 1984. Determination of stress from slip data: faults andfolds. /. Geophys. Res., 89:11517-11526.
, 1987. The use of focal mechanisms to determine stress: a controlstudy. /. Geophys. Res., 92:357-368.
Minster, J. B., and Jordan, T. H., 1978. Present-day plate motions. /.Geophys. Res., 83:5331-5354.
Moos, D., and Zoback, M. D., 1990. Utilization of observations of wellbore failure to constrain the orientation and magnitude of crustalstresses: application to continental, Deep Sea Drilling Project, andOcean Drilling Program boreholes. J. Geophys. Res., 95:9305-9325.
Morin, R. H., Newmark, R. L., Barton, C. A., and Anderson, R. N., 1990.State of lithospheric stress and borehole stability at Deep Sea DrillingProject site 504B, eastern equatorial Pacific. /. Geophys. Res.,95:9293-9303.
Newmark, R. L., Zoback, M. D., and Anderson, R. N., 1984. Orientationof in situ stresses in the oceanic crust. Nature, 311:424-428.
Petroy, D. E., and Wiens, D. A., 1989. Historical seismicity and implica-tions for diffuse plate convergence in the northeast Indian Ocean. /.Geophys. Res., 94:12301-12319.
Reches, Z., 1987. Determination of the tectonic stress tensor from slipalong faults that obey the Coulomb yield condition. Tectonics, 6:849-861.
Richardson, R. M., 1987. Modeling the tectonics of the Indo-Australianplate. Eos, 68:1466. (Abstract)
Shamir, G., and Zoback, M. D., in press. A detailed stress orientationprofile in the upper crust near the San Andreas fault at Cajon Pass,California. /. Geophys. Res.
Sibson, R. H., 1974. Frictional constraints on thrust, wrench, and normalfaults. Nature, 249:542-544.
Stagg, H.M.J., and Exon, N. F., 1981. The geology of the Scott Plateauand Rowley Terrace, off northwestern Australia. Bur. Miner. Resour.Aust. Bull., 213:1-53.
Stewart, G. S., 1978. Implications for plate tectonics of the August 19,1977 Indonesian decoupling normal fault earthquake. Eos, 59:326.(Abstract)
Zoback, M. D., and Healy, J. H., 1984. Friction, faulting and in situ stress.Ann. Geophys., 2:689-698.
Zoback, M. D., Moos, D., Mastin, L., and Anderson, R. N., 1985. Wellbore breakouts and in situ stress. /. Geophys. Res., 90:5523-5530.
Zoback, M. L., 1989. State of stress and modern deformation of thenorthern Basin and Range Province. J. Geophys. Res., 94:77105-77128.
Zoback, M. L., Zoback, M. D., Adams, J., Assumpeio, M., Bell, S.,Bergman, E. A., Blümling, P., Brereton, N. R., Denham, D., Ding, J.,Fuchs, K., Gay, N., Gregersen, S., Gupta, H. K., Givishiani, A., Jacob,K., Klein, R., Knoll, P., Magee, M., Mercier, J. L., Müller, B. C ,Paquin, C , Rajendran, J., Stephensson, O., Suarez, G., Suter, M.,Udas, A., Xu, Z. H., and Zhizhin, M., 1989. Global patterns ofintraplate stress: a status report on the world stress map project of theInternational Lithosphere Program. Nature, 241:291-298.
Date of initial receipt: 3 August 1990Date of acceptance: 13 June 1991Ms 123B-134
513