
2
29
© The University of North Carolina Press Social Forces, March 2003, 81(3):881-908 Occupational Segregation and the Devaluation of Women’s Work across U.S. Labor Markets* PHILIP N. COHEN, University of California at Irvine MATT L. HUFFMAN, University of California at Irvine Abstract Previous research on the devaluation of women’s work has investigated whether the net effect of gender composition varies across jobs and organizational settings. We extend that research by using hierarchical linear models that combine data from a random sample of U.S. work establishments with metropolitan-area data to explore whether macro-level gender inequality also influences the tendency to devalue women’s work roles. Thus, we offer the first attempt to examine processes that lead to organizational gender inequality in local labor market contexts. Specifically, we hypothesize that gender devaluation will be strongest in highly gender-segregated labor markets. One reason for this may be that in segregated markets, men are in a stronger position to benefit from devaluation while women are less able to resist it. The results strongly support this hypothesis: Higher levels of occupational segregation at the labor market level are associated with a significantly increased tendency to devalue women’s work roles. This finding is not explained by a diverse set of controls at both the establishment and local labor market level. Our findings highlight an additional way that gender segregation intensifies labor market inequality. * The authors contributed equally to the preparation of this manuscript; we list our names alphabetically. An earlier version of this article was presented at the 2001 meetings of the American Sociological Association. Some of the data used in this analysis are derived from sensitive data files of the 1991 National Organizations Study (NOS), obtained under special contractual arrangements designed to protect the anonymity of respondents. These data are not available from the authors. People interested in obtaining NOS sensitive data files should contact David Knoke, Department of Sociology, University of Minnesota, Minneapolis, MN 55455. E-mail: [email protected]. We thank Reeve Vanneman and his colleagues for sharing their Metropolitan Area data file with us. We also thank Michelle Budig, Marta Elvira, Julie Kmec, Barbara Reskin, Judy Stepan-Norris, Donald Tomaskovic-Devey, and anonymous Social Forces reviewers for their very helpful comments and suggestions. The authors are responsible for any remaining errors or omissions. Direct correspondence to Philip N. Cohen, Department of Sociology, University of California at Irvine, Irvine, CA 92697-5100. E-mail: [email protected].
-
Upload
jktinarpidwaotkiim -
Category
Documents
-
view
214 -
download
1
Transcript of 2

Occupational Segregation / 881
© The University of North Carolina Press Social Forces, March 2003, 81(3):881-908
Occupational Segregation and the Devaluationof Women’s Work across U.S. Labor Markets*
PHILIP N. COHEN, University of California at IrvineMATT L. HUFFMAN, University of California at Irvine
Abstract
Previous research on the devaluation of women’s work has investigated whether thenet effect of gender composition varies across jobs and organizational settings. Weextend that research by using hierarchical linear models that combine data from arandom sample of U.S. work establishments with metropolitan-area data to explorewhether macro-level gender inequality also influences the tendency to devaluewomen’s work roles. Thus, we offer the first attempt to examine processes that leadto organizational gender inequality in local labor market contexts. Specifically, wehypothesize that gender devaluation will be strongest in highly gender-segregated labormarkets. One reason for this may be that in segregated markets, men are in a strongerposition to benefit from devaluation while women are less able to resist it. The resultsstrongly support this hypothesis: Higher levels of occupational segregation at the labormarket level are associated with a significantly increased tendency to devalue women’swork roles. This finding is not explained by a diverse set of controls at both theestablishment and local labor market level. Our findings highlight an additional waythat gender segregation intensifies labor market inequality.
* The authors contributed equally to the preparation of this manuscript; we list our namesalphabetically. An earlier version of this article was presented at the 2001 meetings of the AmericanSociological Association. Some of the data used in this analysis are derived from sensitive datafiles of the 1991 National Organizations Study (NOS), obtained under special contractualarrangements designed to protect the anonymity of respondents. These data are not availablefrom the authors. People interested in obtaining NOS sensitive data files should contact DavidKnoke, Department of Sociology, University of Minnesota, Minneapolis, MN 55455. E-mail:[email protected]. We thank Reeve Vanneman and his colleagues for sharing theirMetropolitan Area data file with us. We also thank Michelle Budig, Marta Elvira, Julie Kmec,Barbara Reskin, Judy Stepan-Norris, Donald Tomaskovic-Devey, and anonymous Social Forcesreviewers for their very helpful comments and suggestions. The authors are responsible for anyremaining errors or omissions. Direct correspondence to Philip N. Cohen, Department ofSociology, University of California at Irvine, Irvine, CA 92697-5100. E-mail: [email protected].

882 / Social Forces 81:3, March 2003
Earnings inequality by gender may result from discrimination both in theallocation of workers across job categories and in how female-dominated jobsare rewarded relative to male-dominated jobs (Petersen & Morgan 1995). Thefirst form operates by blocking access to well-paying jobs and occupationsthrough social closure processes (Tilly 1998); the second functions through thedifferential valuation of jobs and occupations with varying gender composition(Tomaskovic-Devey 1993b). Thus, the gender gap in pay is a function of twodistinct sources: the differential distribution of women and men across jobsand occupations that vary with respect to pay, and within-job pay differences.Because it is uncommon to find women and men sharing the same job title inthe same work establishment (Bielby & Baron 1984, 1986; Groshen 1991;Petersen & Morgan 1995; Tomaskovic-Devey 1993b), the first source — sortingworkers into jobs — has been found to contribute the most to the pay gap.1
However, explaining the mechanisms by which the determination of rewardsoperates is important for understanding how gender inequality in the labormarket is constructed and perpetuated.
In this article, we reconsider the idea that the gender of the person whoperforms a particular line of work is an important determinant of how thatwork is rewarded, extending the large body of literature on gender-basedascription in the evaluation of job worth. By focusing on organizations in theirlabor market contexts, we directly address the effects of gender segregation atthe labor market level. This enables us to unite research focusing on the impactof job and occupation-level gender segregation (Baron & Newman 1989;England et al. 1988; England, Reid & Kilbourne 1996; Huffman & Velasco 1997;Reid 1998) with literature highlighting the effect of macro-level, labor-marketprocesses on earnings inequality (e.g., Beggs, Villemez & Arnold 1997; Cassirer1996; Cohen 1998; Cotter et al. 1997; Jacobs & Blair-Loy 1996). We bringtogether these two bodies of research by examining whether status compositionprocesses — those through which jobs performed by women accrue aneconomic penalty relative to those jobs held by men (see Tomaskovic-Devey1993a) — are particularly strong when those jobs are embedded in segregatedlabor markets. We argue that gender devaluation should be strongest in highlygender-segregated labor markets. One reason for this may be that in segregatedmarkets men occupy superior jobs in terms of pay and authority relative towomen. As a result, men may be in a stronger position to benefit fromdevaluation, while women are less able to resist it. Therefore, our mainhypothesis is that the negative association between female representation in ajob and average wages will be especially pronounced when gender segregationin the broader labor market is high.

Occupational Segregation / 883
Gender-Based Devaluation: What People Do, Where They Work, or Both?
Comparable worth policies — predicated on the idea that women earn lessbecause they work in female-dominated jobs and occupations — attempt tocorrect these between-job pay differences by adjusting pay scales so that both“male” and “female” jobs are compensated according to skill requirements(Acker 1989; England 1992; England & Dunn 1988). This policy approach isfueled by empirical investigations of the wage effect of gender composition.One line of research (England 1992; England et al. 1994; Parcel 1989) uses U.S.Census occupations as the units of analysis, with average earnings in theoccupation as the dependent variable. These studies often include detailedmeasures of average educational requirements and other occupationaldemands taken from the Dictionary of Occupational Titles (U.S. Department ofLabor 1977). Similar studies (Johnson & Solon 1986; Reid 1998; Tam 1997)use individual-level wages as the dependent variable and append occupationalcharacteristics (including the occupation’s gender composition) as contextualvariables. These analyses often estimate the interaction between gender anddemographic composition by fitting models separately for women and men;some (Macpherson & Hirsch 1995) use models with fixed effects in order toaccount for unmeasured gender differences in unchanging attributes ofindividuals relevant for pay determination (England et al. 1988).
This line of research consistently finds a significant net wage penaltyassociated with female-dominated occupations. For example, the findings ofEngland and her colleagues (1988) include wage differences between male- andfemale-dominated occupations ranging from 8% to 11%, depending on themodel specification. Kilbourne and her colleagues (1994) and Macpherson andHirsch (1995) report this difference to be approximately 5%, while England,Reid, and Kilbourne (1996) find a wage differential ranging from 7% to 19%between male- and female-dominated occupation-industry cells. On the otherhand, Tam (1997) argues that the statistical models and measures used inprevious studies of the wage effect of gender composition bias the results tofavor the devaluation hypothesis. Using a model that omits many commonlyused measures, Tam (1997) reports no significant negative effect of occupationgender composition on wages.2
A second group of researchers (Baron & Newman 1990; Huffman & Velasco1997; Petersen & Morgan 1995; Tomaskovic-Devey 1993a, 1995) uses job-levelmeasures of female representation rather than the broader occupation-levelmeasures. This allows them to examine the organizational contexts of rewardallocation, as well as how the undervaluation of work roles performed bywomen or minorities varies by work setting and characteristics of theorganizational environment.3 Analyzing a sample of U.S. work establishments,Huffman and Velasco (1997) report a large job-level penalty associated withfemale representation that was not explained by, and did not vary systematically

884 / Social Forces 81:3, March 2003
with, various measures of organizational structure. That is, not only did thegender composition effect remain large in the presence of controls fororganizational policies, practices, and skill demands, but gender compositionalso did not interact with these measures. This net effect of gender compositionsuggests a remarkable stability in the degree of job-level devaluation in U.S.work establishments. Across jobs in diverse work establishments, as the level offemale representation increases, the wages of both male and female employeesdecrease markedly.
This body of work also has indicated that as the level of classificationbecomes finer, the wage effect of gender composition becomes stronger. Forexample, in comparing the relative effect of occupational and job gendercomposition, Huffman, Velasco, and Bielby (1996) find that the typical earningsin an all-female job are about 50% lower than in a comparable all-male job.In another job-level study, Baron and Newman (1990) report that thedifference in starting wages between male- and female-dominated civil servicejobs is approximately 30%. Of course, the fact that the job-level gendercomposition effect on wages is much larger than that found in occupation-levelstudies is explained, at least in part, by the fact that measures of occupationalsegregation understate the degree of segregation occurring at the job level(Bielby & Baron 1986; Tomaskovic-Devey 1995). We agree with Tomaskovic-Devey (1995:24) that observed occupation-level effects are largely a result ofmore proximate processes operating at the level of the job (also see Reskin1993).
In sum, empirical tests of the devaluation hypothesis have been nearlyunanimous in their finding that female representation conditions the rewardlevels, even after controlling for job-related skills and educational requirements.Additionally, gender composition effects are explained neither by labor mar-ket conditions such as job growth (Baron & Newman 1990:156) nor by differ-ences across jobs or occupations in working conditions that might constitute“compensating differentials” (England 1992; Huffman & Velasco 1997; Jacobs& Steinberg 1995; Reid 1998).4 This finding characterizes nearly all studiesconducted at the occupation level, as well as those performed at the moredetailed job level.
What processes might explain the negative effect of female representationon reward levels? Kilbourne and her colleagues (1994) offer two potentialmechanisms. First, employers err cognitively by not seeing women’s contributionto the profitability of their organizations. Second, skills typically associated withwomen’s work (such as nurturance) are underrewarded (see England et al.1994). Both experimental and survey research on how work is valued supportthis position by showing that both sexes attribute more value to work performedby men than by women (see Bose & Rossi 1983; Deaux 1985; Major, McFarlin& Gagnon 1984; McArthur 1985). Others suggest that over time, occupationsbecome defined largely by stereotypes based on the sex of the occupation’s
Occupational Segregation / 885
“typical” incumbent (Jacobs & Blair-Loy 1996; Milkman 1987). Onceestablished, institutional inertia keeps both gender-based interoccupational andinterjob wage differences in place and resistant to change over time (Baron1991; Hannan & Freeman 1984; Kilbourne et al. 1994). The persistence ofeither of these mechanisms may also follow from gender dynamics withinorganizations, such that incumbents in female-dominated jobs have lessdecision-making power regarding pay and authority (Reskin, McBrier & Kmec1999; Tomaskovic-Devey 1993b). Regardless of its source, we refer to theoutcome as “devaluation” — lower wages in female-dominated jobs. We arguethat this devaluation of women’s work might not be invariant across diverselabor market contexts. Although most of the research on spatial variation ininequality focuses on race (see Beggs, Villemez & Arnold 1997; Cohen 2001;Tienda & Lii 1987), we address how variation in the gender devaluation effectmay depend on local labor market factors.
A Missing Link: The Local Labor Market Context of Work Establishments
Although gender inequality is systemic throughout the U.S. economy, there isalso pronounced variation across local labor markets (Cotter, Hermsen &Vanneman 1999). Gender devaluation also may be partly a function of localconditions, as the culture and power structure of the local labor market willhave affected the composition of decision makers and the context in whichthey make their decisions over time. Beggs (1995) posits that the level ofsupport for equality of opportunity in firms’ local institutional environmentinfluences the degree of racial and gender inequality. Additionally, Cotter andhis colleagues (1997) argue that, in markets with more gender equality inoccupational allocation, “changes in market pressures, normative expectations,and managerial power induced by occupational integration” may producebetter jobs and higher earnings for women across the board (715–16). Theiranalysis shows that occupational gender segregation in local labor marketsnegatively affects women’s earnings even outside of segregated occupations.
A stiffer local regime of gender devaluation could produce this effect. Ifgender devaluation were reproduced locally in this manner, it would representan important mechanism linking the gendered practices of everyday life (West& Zimmerman 1987) with the larger structures of gender inequality in theeconomy (Goldin 1990). On this point, Nelson and Bridges (1999) cite researchshowing that historically, employment patterns in organizations often reflectstatus differences in the local community; they note that between-job wageinequality may result from the organizational reproduction of male advantage.Moreover, they assert that the devaluation of work done primarily by women“may have its most pronounced influence on pay disparities in interaction withthe culture and structure of employing organizations” (95).

886 / Social Forces 81:3, March 2003
Previous research also shows that employers respond to changes in the legalenvironment with regard to gender inequality issues (Kelly & Dobbin 1999)and to workplace due-process procedures more generally (Edelman 1990).Some of this is observed at the local or state level (Guthrie & Roth 1999b). Infact, despite the effect of highly visible national trends and related campaigns(Guthrie & Roth 1999a), much of the pressure against gender inequality isgenerated locally. In the case of the law, for example, although the federalgovernment provides national standards regarding employment discrimination,local laws allow cities to set higher standards (Gold 1993; Gutman 1993).5
These considerations suggest possible shortcomings of existing studies of thedevaluation hypothesis. In the determination of wages, establishment-levelcharacteristics partly may be a proxy for labor market attributes. This wouldbe the case if the distribution of types of establishments or patterns ofestablishment practices were not uniform across labor markets. For example,Reskin and McBrier (2000) show that firms’ personnel practices are associatedwith gender inequality in managerial hiring. Such practices may reflect localvariation in acceptable standards, in which case the establishment variablewould reflect local labor market characteristics. Given the importance ofestablishment practices, the distribution of these practices across labor marketsmay be an important component of how gender inequality is maintained — apattern that would only emerge in an analysis that accounts for both levels.Previous studies of work-based devaluation are insensitive to potentialinteractions between the local context and the demographic composition ofjobs, despite the fact that there is ample reason to ask whether gender-baseddevaluation is positively correlated with levels of occupational gendersegregation at the local labor market level. Our analysis, in contrast to workthat implies that devaluation is a uniform cultural process (England 1992),explores spatial variation in the gender devaluation effect across labor markets.
Data, Measures, and Analyses
THE NATIONAL ORGANIZATIONS STUDY
Our primary data source is the National Organizations Study (NOS), a ran-dom sample of 688 U.S. work establishments.6 The 1991 General Social Sur-vey (GSS) included a topical module on work organizations. That survey wasused to draw the NOS sample, generating a random sample of U.S. work es-tablishments with probability of inclusion proportionate to workplace size.Employed GSS respondents were asked to supply the contact information ofboth their employer and their spouse’s employer. Subsequently, interviews with“knowledgeable organizational informants” at these organizations were con-ducted by telephone and questionnaires were mailed to them. These informants,
Occupational Segregation / 887
who were heads of personnel departments or people responsible for makinghiring decisions, were queried about the establishment’s demographic compo-sition, environment, and structure, as well as characteristics of specific jobtitles.7
Many of the NOS questions targeted the core job in the establishment, whichis the job title of those employees most directly associated with the productionof the firm’s main service or product (e.g., production workers in a factory).The informants reported the “annual earnings of most core employees” in eachNOS establishment, which, when logged, serves as the dependent variable inour multivariate models. The other NOS establishment-level variables we useconsist of those variables that have been linked to gender inequality in previousresearch (see Baron, Mittman & Newman 1991; Huffman & Velasco 1997;Reskin & McBrier 2000; Tomaskovic-Devey 1993b). The primary independentvariable of interest is the proportion female in the core job title.
We control for other aspects of the establishments’ demographic composi-tion by including variables measuring proportion female in management andproportion nonwhite (among full-time workers). We also include continuousmeasures of the establishments’ age and size (both are logged, and size is equalto the sum of full- and part-time workers). Dichotomous variables are used toindex whether the establishment is part of a larger organization (1 = yes), andwhether it has a professional/managerial core job (1 = yes). Three dummy vari-ables capture differences across four establishment types (corporate, govern-ment, nonprofit, and entrepreneurial). Nonprofit is the reference category.
Formalization of the establishments’ rules and procedures was measured withan additive index composed of eight dichotomous indicators. These indicatethe presence of these documents at the establishment: a rules and proceduresmanual, written job descriptions, written record of job performance, employ-ment contracts, personnel evaluation documents, hire-fire procedure docu-ments, documents describing safety-hygiene practices, and fringe benefits docu-ments. The formalization index takes a value equal to the number of docu-ments out of eight present. The extent to which a NOS establishment is sub-ject to government regulation is based on the question, “How much of yourestablishment’s operations are regulated by government agencies?” The pos-sible answers ranged from “almost completely” to “none at all.” We reverse-coded the original item so that high values indicate more regulation. The de-gree to which each establishment relies on an internal labor market to promotecurrently employed workers is measured with an additive index made up ofthree NOS items (see Marsden, Cook & Knoke 1994). The first is whether theestablishment fills vacancies in the core job title with current employees(1 = yes; 0 = no). The second item asks whether different levels of the core jobtitle exist (1 = yes; 0 = no). The final item taps the frequency of promotionabove the core job title (3 = very often; 2 = often; 1 = not very often). The

888 / Social Forces 81:3, March 2003
internal labor market index takes a value equal to the mean computed acrossthe three indicators.
We also use 10 dummy variables to represent the 11 industry categoriesrepresented in the Office of Management and Budget’s Standard IndustrialClassification. The 11 categories are: agriculture, construction, nondurablemanufacturing, durable manufacturing, transportation, wholesale trade, retail,F.I.R.E. (finance, insurance and real estate), business/repair and personal ser-vices, professional and related services, and public administration. Nondurablemanufacturing is the omitted category in all multivariate models.
If there are differences in required skills, education, and working conditionsacross jobs, and these differences are correlated with both gender compositionand wages, then the association between proportion female and reward levelscould be spurious. Ideally, we would control for these characteristics at the levelof the individual worker (education, skills) or job (working conditions, averagetraining required, level of authority). Unfortunately, our data do not includeindividual-level attributes. We can employ some proxies, however, for job-levelskills and requirements, from the Occupational Measures from the Dictionary ofOccupational Titles (DOT) for 1980 Census Detailed Occupations data set (England& Kilbourne 1988). These are common in studies of gender and racecomposition effects on remuneration (see England 1992; Huffman & Velasco1997; Tam 1997). The DOT measures are averages for workers in each 3-digitoccupational category and are merged with the NOS data using the census3-digit occupational code associated with the core job title of eachestablishment.
Specifically, we use three DOT variables as controls. The first is specificvocational preparation (SVP), which taps the amount of training time neededto learn the techniques and obtain the information necessary for averageperformance on the job. High values of this scale represent a longer period oftime required to acquire these skills. SVP can be thought of as a measure ofspecific human capital (Tam 1997). We also use general educational development(GED), which measures “the typical requirement of the occupation forschooling that is not vocationally specific” (England, Hermsen & Cotter2000:1742). GED is measured along a 0–6 point scale, with high values denotingthose occupations requiring relatively high levels of general educationaldevelopment. SVP and GED are positively correlated (r = .89, p < .01). Finally,we use a scale of physical demands from the DOT data set. The value of thisscale is the average computed across five individual physical demands factorsincluded in the DOT: climbing, stooping, reaching, talking, and seeing. Highvalues of this variable indicate greater levels of physical demands.8

Occupational Segregation / 889
LOCAL LABOR MARKETS
Our second source of data is a metropolitan area (MA) labor market fileconstructed by Cotter and his colleagues (1997), mostly from the CensusBureau’s STF3C file from the 1990 census. Each NOS establishment was mappedinto a county by ZIP code; each county is part of only one MA in the file. BecauseZIP codes can span counties (and therefore MAs), a particular NOSestablishment can have one of the following four relationships to MAs. It canbe located (1) in a single MA, (2) partially in an MA and partially not in anyMA, (3) simultaneously in two different MAs, or (4) outside all MAs.Establishments found to be located partially in an MA and partially not in anyMA were coded as part of that MA. Establishments that have a ZIP codestraddling two MAs were assigned to the MA with the larger percentage of theZIP code population within it. Establishments not located in an MA wereassigned an MA if they were located within 75 miles of the central city of thenearest MA. If a rural establishment fell within this limit, it was assigned tothe MA with the shortest distance between the establishment’s ZIP code andthe MA’s central city. Establishments located more than 75 miles from thecentral city of any MA were excluded from the analysis. This yielded 475establishments nested in 80 different MAs for use in the analyses.
The primary MA-level independent variable is occupational integration. Astandard measure of occupational segregation reflects the proportion of womenor men who would have to switch occupations in order to equalize thedistribution of women and men across occupations. We subtract this measurefrom 1, and refer to it as occupational integration, with higher values indicatinggreater gender integration.9 For the 80 MAs represented in the NOS sample,occupational integration ranges from .40 to .56. Examples of highly segregatedlabor markets include Lafayette, Louisiana, and Johnstown, Pennsylvania.Among the most integrated labor markets are Madison, Wisconsin, and Bryan–College Station, Texas. Although the NOS sample includes only 80 of the 262possible U.S. MAs, the range computed across the 80 labor markets includedin the NOS sample is virtually identical to the range based on the 262 U.S.MAs.10
Because of the relatively small number of metropolitan areas, we includeonly a limited number of MA-level control variables that have been shown toaffect gender inequality in earnings (Cotter et al. 1997). These include variablesreflecting basic economic structure and historical conditions: the percentageof the labor force employed in durable-goods manufacturing and dummyvariables indicating each of the four census regions of the country (Northeast,North Central, South, and West). Others reflect local economic conditions: thenet percentage change in the population resulting from 1985–90 internalmigration (a proxy for long-term regional economic vitality), the unemploymentrate (for short-term vitality), and the level of male earnings inequality (the

890 / Social Forces 81:3, March 2003
TABLE 1: Descriptive Statistics and Bivariate Correlation Coefficients forEstablishment-Level Variables Used in the Analysis
1 2 3 4 5 6 7 8 9
1. Earnings of core job title(ln) 1.0 — — — — — — — —
2. Proportion female in corejob title –.25* 1.0 — — — — — — —
3. Proportion femalemanagement –.15* .57* 1.0 — — — — — —
4. Establishment size (ln) .35* .05 –.09* 1.0 — — — — —
5. Establishment age (ln) .32* –.04 –.10* .44* 1.0 — — — —
6. Proportion nonwhite –.06 .03 .03 .29* .04 1.0 — — —
7. Part of a larger organization .11* .02 –.12* .32* .17* .11* 1.0 — —
8. Regulation .25* .05 –.03 .35* .28* .08 –.10* 1.0 —
9. Professional/managerialcore job title .38* .21* .21* .19* .22* –.02 –.34* .18*
10. Institutionalization scale .27* .01* .01 .45* .25* .05 .24* .83* .23*
11. Formalization .32* .07 –.01 .66* .33* .18* .49* .40* .17*
12. Corporate establishment –.06 –.13* –.19* .06 –.05 .02 .03 –.10* –.34*
13. Government establishment .13* –.19* –.20* .13* .26* .02 .24* .32* .0214. Entrepreneurial
establishment –.32* .01 .15* –.48* –.38* –.07 –.35* –.36* –.20*15. Internal labor market .28* –.03 –.14* .62* .28* .18* .39* .27* .12*16. Standard vocational
preparation (SVP) .43* .01 .11* .07 .20* –.17* –.04 .09 .69*
17. General educationaldevelopment (GED) .42* .18* .22* .23* .23* –.15* .02 .13*
18. Physical demands scale –.15* –.26* –.16* –.35 –.16* .06 –.06 –.15* –.53*
Mean 9.94 .47 .37 4.18 3.10 .21 .54 3.37 .33Standard deviation .66 .40 .35 2.25 1.21 .26 .50 1.23 .47Minimum 7.44 0 0 0 0 0 0 1.0 0Maximum 12.0 1.0 1.0 10.7 5.32 1.0 1.0 5.0 1.0
(N = 475)
earnings Gini coefficient for full-time year-round employed men in the agerange 25–54). Three variables measure the local demographic structure: thenatural logarithm of the size of the labor force, the percentage of the populationthat is black, and the percentage that is Latino.
Finally, given its importance in explaining a wide range of outcomes relatedto gender stratification (Chafetz 1984; Cotter et al. 1998), we control for the

Occupational Segregation / 891
TABLE 1: Descriptive Statistics and Bivariate Correlation Coefficients forEstablishment-Level Variables Used in the Analysis (Cont’d)
10 11 12 13 14 15 16 17 18
1. Earnings of core job title (ln) — — — — — — — — —
2. Proportion female in corejob title — — — — — — — — —
3. Proportion femalemanagement — — — — — — — — —
4. Establishment size (ln) — — — — — — — — —
5. Establishment age (ln) — — — — — — — — —
6. Proportion nonwhite — — — — — — — — —
7. Part of a larger organization — — — — — — — — —
8. Regulation — — — — — — — — —
9. Professional/managerial corejob title — — — — — — — — —
10. Institutionalization scale 1.0 — — — — — — — —
11. Formalization .49* 1.0 — — — — — — —
12. Corporate establishment –.05 .06 1.0 — — — — — —
13. Government establishment .16* .21* –.35* 1.0 — — — — —
14. Entrepreneurialestablishment –.40* –.53* –.44* –.21* 1.0 — — — —
15. Internal labor market .31* .58* .13* .11* –.41* 1.0 — — —
16. Standard vocationalpreparation (SVP) .11* .03 –.28* –.01 –.09* .06 1.0 — —
17. General educationaldevelopment (GED) .19* .10* –.31* –.01 –.16* .08 .89* 1.0 —
18. Physical demands scale –.04 –.04 .14* .06 .11* –.03 –.26* –.52* 1.0
Mean 1.72 .75 .42 .14 .21 .74 5.38 3.85 1.66Standard deviation .49 .34 .49 .35 .41 .47 1.55 .94 .88Minimum .5 0 0 0 1 0 1.7 1.56 0Maximum 2.5 1.0 1.0 1.0 1.0 1.67 8.5 6.0 3.90
(N = 475)
* p < .01 (two-tailed)
demand for female labor implied by the occupational structure. Specifically, thisvariable taps the share of the labor force that would be female if localoccupations had the same percentage female found in the country as a whole.It measures the degree to which the occupational structure of the local labormarket is tilted toward female-dominated occupations. These variables areconsistent with those used in most previous research on labor market earnings

892 / Social Forces 81:3, March 2003
variation (see Fossett 1988; Grant & Parcel 1990), and almost all have beenshown to affect gender inequality in labor markets (Cotter et al. 1997).Descriptive statistics and bivariate correlations for all variables used in theanalysis are reported in Tables 1 and 2.
STATISTICAL MODEL AND ANALYSIS STRATEGY
Our analysis employs hierarchical linear models (Bryk & Raudenbush 1992)that combine the NOS establishment-level variables with data from U.S.metropolitan areas.11 Hierarchical modeling has become more popular as itsadvantages have been documented and as increased computing resources andnew software have made its application more practical. According to Guo andZhao (2000), hierarchical models are used for analyzing nested data structuresbecause they correct biases in parameter estimates resulting from clusteringin the data, and because they provide correct standard errors and significancetests when data are hierarchically structured.12
Implicitly, our model allows an establishment-level equation to be estimatedseparately in each of the 80 MAs. Each establishment-level coefficient may betreated as a dependent variable in the MA-level analysis. We are particularlyinterested in the MA-level determinants of the effect of proportion female in
TABLE 2: Descriptive Statistics and Bivariate Correlation Coefficients forMetropolitan Area–Level Variables Used in the Analysis
1 2 3 4 5 6
1. Gender integration 1.0 — — — — —
2. Total population (ln) .16 1.0 — — — —
3. Percentage black –.25* .12 1.0 — — —
4. Percentage Hispanic .08 .33* –.16 1.0 — —
5. Durable good manufacturing –.12 .11 –.24 –.13 1.0 —
6. Male earnings Gini .15 .41* .12 .64* –.47* 1.0
7. Unemployment rate –.47* –.004 .07 .52* .17 .10
8. Female labor demand .48* .08 –.01 –.004 –.44* .17
9. Net migration .27 –.02 .12 –.11 –.12 .08
10. Northeast –.04 .30* –.08 –.07 .05 –.06
11. North central .002 –.11 –.16 –.25 .37* –.38*
12. South –.25 –.28* .52* .001 –.45* .28*
13. West .34* .21 –.37* .36* .07 .16
Mean .50 13.99 .12 .07 .11 .35Standard deviation .06 3.52 .23 .31 .12 .06Minimum .40 11.02 .001 .003 .03 .29Maximum .56 16.78 .46 .85 .26 .42

Occupational Segregation / 893
the core job at the establishment level. This gender composition effect measuresgender-based devaluation in each MA. Therefore, this model allows us to testwhether occupational gender integration reduces the devaluation of jobsperformed typically by women.
Specifically, our establishment-level model is described by
00 1 2 2( ) ( ..) ... ( ..).ij j ij j ij kj kij ijY P roportionFemale X X X X rβ β β β= + + − + + − +
Where Yij equals the typical earnings (logged) of the core job title ofestablishment i in MA j, and b0 is the level-1 intercept. b1j is the regressioncoefficient associated with the core job proportion female in establishment iin MA j. X2ij through Xkij is a set of K – 1 establishment-level control variables(each centered at its grand mean, ..X ) and bkj is a vector of regressioncoefficients associated with those control variables. Finally, rij is the level-1 errorterm, assumed to be normally distributed with mean zero and variance s2.
TABLE 2: Descriptive Statistics and Bivariate Correlation Coefficients forMetropolitan Area-Level Variables Used in the Analysis (Cont’d)
7 8 9 10 11 12 13
1. Gender integration — — — — — — —
2. Total population (ln) — — — — — — —
3. Percentage black — — — — — — —
4. Percentage Hispanic — — — — — — —
5. Durable good manufacturing — — — — — — —
6. Male earnings Gini — — — — — — —
7. Unemployment rate 1.0 — — — — — —
8. Female labor demand –.32* 1.0 — — — — —
9. Net migration –.30* –.11 1.0 — — — —
10. Northeast –.001 –.35 –.15 1.0 — — —
11. North central –.12 –.008 –.24 –.27* 1.0 — —
12. South .08 –.17 .27 –.30* –.49* 1.0 —
13. West .04 –.11 .10 –.20 –.32* –.36* 1.0
Mean .06 .46 .001 .15 .31 .36 .19Standard deviation .04 .03 .09 .86 1.13 1.18 .97Minimum .03 .42 -.15 0 0 0 0Maximum .14 .50 .13 1.0 1.0 1.0 1.0
(N = 80)
Note: All statistics weighted by number of establishments per MA.
* p < .01 (two-tailed test)

894 / Social Forces 81:3, March 2003
The complete MA-level equation is given by:
0 00 01 02 2 0( ) ( ..) ... ( ..)j j j j sj sj ijOccupationalIntegration W W W W uβ γ γ γ γ= + + − + + − +
1 10 11 12 2 1( ) ( ..) ... ( ..)j j j j sj sj ij
kj k
OccupationalIntegration W W W W uβ γ γ γ γβ γ
= + + − + + − +
=
where g00 is the intercept for the MA-level model of typical earnings (logged)in the core job title, and g01 is the effect of labor market occupationalintegration on b0j. The MA-level intercept for the effect of core job proportion
TABLE 3: Hierarchical Linear Regression Results for Logged Earnings ofCore Job Title on Establishment-Level Characteristics
Model 1 Model 2 Model 3Coef. Coef. Coef.
Intercept 9.925*** 10.119*** 10.182**
Proportion female in core job — –.413*** –.529***
Establishment size (ln) — — .049***
Establishment age (ln) — — .035
Proportion female management — — –.056
Proportion nonwhite — — –.228*
Part of a larger organization — — –.071
Regulation — — .016
Professional/managerial core job — — .162Institutionalization scale — — .018
Formalization — — .316**
Corporate establishment — — –.048Government establishment — — –.148
Entrepreneurial establishment — — –.071
Internal labor market — — .038Standard vocational preparation (SVP) — — .046
General educational development (GED) — — .111
Physical demands scale — — –.019Level-1 R2 — .106 .450
Variance componentsLevel-1 variance (s2) .3932 .3670 .2298Intercept (t00) .0397 .0198 .0082Proportion female in core job (t11) 0 .0256 .0441
Intraclass correlation coefficient (r) .0917 .0512 .0345
Notes: Omitted categories are West region and nonprofit establishment. Industry (11 SIC catego-ries) is also controlled; coefficients are not shown but are available upon request from theauthors.
* p < .05 ** p < .01 *** p < .001 (two-tailed test)

Occupational Segregation / 895
TABLE 4: Hierarchical Linear Regression Results for Logged Earnings ofCore Job Title on Establishment-Level and Local Labor MarketCharacteristics
Model 1 Model 2Coef. Coef.
InterceptIntercept 10.076*** 11.913***
Gender integration .214 –3.562**
Percentage durable goods — –1.126Northeast — .033North central — –.157South — –.173†Unemployment rate — –5.892*Male earnings Gini — –.647Net internal migration — .450Population size (ln) — .032Percentage black — .530Percentage Hispanic — .812*Female labor demand — 2.510
Proportion female in core jobIntercept –1.673 –4.655**Gender integration 2.297 8.400**Percentage durable goods — 2.510Northeast — .170North central — .153South — .189Unemployment rate — 6.702Male earnings Gini — 4.158Net internal migration — –.098Population size (ln) — –.025
Percentage black — –.543Percentage Hispanic — –1.132Female labor demand — –9.134Variance componentsLevel-1 variance (s2) .2300 .2307
Intercept (t00) .0099 .0006Proportion female in core job (t11) .0441 .0606Intraclass correlation coefficient (r) .0413 .0026
Notes: Omitted categories are West region and nonprofit establishment. Industry (11 SIC catego-ries) and all establishment-level variables from Table 3 are also controlled; coefficients are notshown but are available upon request from the authors.
† p < .10 * p < .05 ** p < .01 *** p < .001 (two-tailed test)

896 / Social Forces 81:3, March 2003
female on typical earnings in the core job title is denoted by g10, and g11 is theeffect of labor market occupational integration on b1j. W2j through Wsj is a setof S – 1 establishment-level control variables (each centered at its grand mean,
..W ), while g0sj and g1sj are the vectors of regression coefficients associatedwith those control variables in each level-2 model. The effects of the level-1control variables do not vary across MAs; therefore, gk represents the fixedeffects bk across all MAs. Finally, u0j and u1j are level-2 random effects, assumedto be uncorrelated and with means of zero. It is common to denote the varianceof these level-2 error terms as t00 and t11, respectively (see Bryk & Raudenbush1992).13 Among level-2 independent variables, only gender integration is notcentered.
We begin by estimating a random intercept model, which includes noindependent variables at either level. This model, which is equivalent to a one-way analysis of variance with random effects, expresses variation in thedependent variable (Yij) as the sum of the grand mean outcome in thepopulation (g00), a level-1 random effect (rij), and a level-2 random effect (u0j).This model is useful because it allows the total variability in the outcomevariable to be decomposed into within- and between-group parts (Bryk &Raudenbush 1992; Snijders & Bosker 1999). Specifically, it can be shown thatthe variance of Yij is equal to t00 + s2, where t00 equals the between-groupvariability, and s2 equals the within-group variation.14
Results
The results from the first set of hierarchical linear models appear in Table 3.Model 1 is a random intercept model; the intraclass correlation coefficient forthis model indicates that about 9% of the total variability in wages is due todifferences across MAs, while 91% is attributable to earnings differences acrosscore jobs. This is not surprising, as one would expect the difference in earningsbetween lawyers and janitors in a particular MA to be much larger than thedifference between lawyers in Boston and lawyers in Los Angeles, for example.In model 2, proportion female in the core job alone is shown to account forabout 10% of the variability in between-job wages. Of the remaining variance,only about 5% is due to differences across MAs (r = .0512).
With no MA-level variables included, model 3 is similar to an ordinary leastsquares (OLS) regression, except that the intercept and the effect of core jobproportion female are allowed to vary across MAs. Because all theestablishment-level variables except core job proportion female are grand-mean-centered, the intercept in this model (10.182, or $26,423) is the predictedearnings for a typical establishment that has no women in its core job. Thenegative net effect of core job proportion female is large and statisticallysignificant (–.529, p < .001). To give a sense of the magnitude of this effect, the

Occu
pational Segregation
/ 897
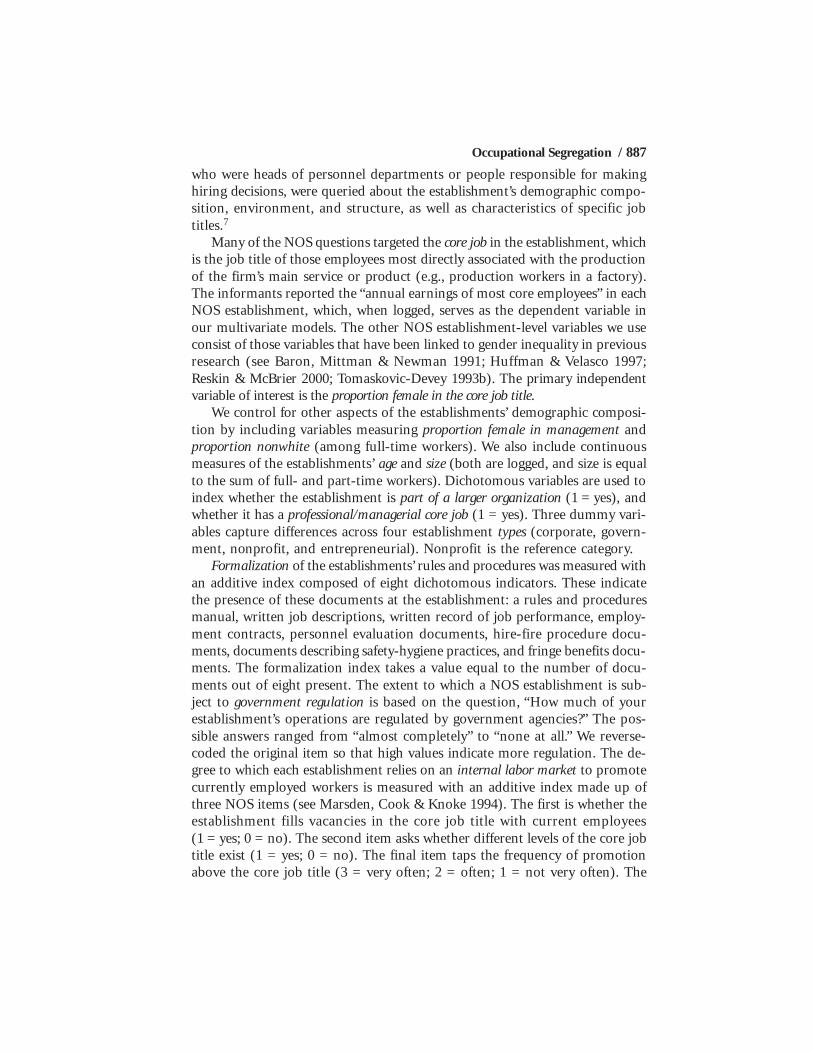
FIGURE 1: Gender Devaluation in Select Labor Markets, by Labor Market Occupational Integration
Figure 1. Gendered Devaluation in Select Labor Markets,by Labor Market Occupational Integration
-1.50
-1.40
-1.30
-1.20
-1.10
-1.00
-0.90
-0.80
-0.70
-0.60
-0.50
-0.40
-0.30
-0.20
-0.10
0.00
0.10
.46 .48 .50 .52 .54 .56 .58
Labor Market Occupational Integration
Pre
dict
edE
ffect
ofP
ropo
rtio
nF
emal
ein
Cor
eJo
b
Youngstown
Philadelphia
Chicago
Nashville
New York
Boston
Fort Wayne
Los Angeles
ColumbusWashington/Baltimore
Madison

898 / Social Forces 81:3, March 2003
proportion female coefficient of –.529 means that as proportion female risesfrom 0 (all men) to 1.0 (all women), the earnings in the core job are predictedto decrease by 41% ([e–.529 – 1] × 100 = –41.1). That is the gender devaluationeffect.
The gender-composition effect we find is larger than that found in someprevious research (for example, England et al. 1988; England, Reid & Kilbourne1996; Kilbourne et al. 1994; Macpherson & Hirsch 1995). There are severalprobable reasons for this difference. First, as noted above, the wage effect ofgender composition is stronger with finer levels of classification (Baron &Newman 1990; Huffman, Velasco & Bielby 1996), and our measures are at theestablishment-specific job level. Second, we do not control for variables at theindividual level. If women have, for example, lower average levels of educationor are more likely to work part-time, and these traits are associated with lowerwages — or if women’s individual wage returns to these characteristics aredifferent from men’s — then our gender composition variable will capturesome of the gender gap resulting from these differences as well. Finally, we notethat some previous studies have collapsed jobs (or occupations) into male-dominated and female-dominated categories. As a result, the gendercomposition effect they find will be smaller than ours, which reflects predictedwage differences between jobs that are all male and those that are all female.
However, our primary objective in this paper is to analyze the differencein the level of gender devaluation across labor markets. Of most interest is howthe gender devaluation effect is conditional on labor market segregation. Leastsquares estimates of the devaluation coefficient for each of the 11 labor markets(MAs) in our sample that have more than 10 establishments are shown inFigure 1 (obtained from model 3 of Table 3). This is the bivariate relationshipbetween labor market integration and gender devaluation. The relationshipsuggests that gender devaluation is generally less pronounced in moreintegrated labor markets. In the large labor markets in our sample, then, therelationship between occupational gender segregation and gender devaluationis consistent with our main hypothesis: Gender segregation intensifies thenegative effect of job percentage female.
In the subsequent models, shown in Table 4, we enter gender integration atthe labor market level and test its effect on gender devaluation in the presenceof the control variables at both levels. In these models, the core job proportionfemale and the labor market occupational integration variables are notcentered. Therefore, the level-2 intercept (g00) represents the predictedearnings of an all-male job in a completely segregated local labor market, atthe mean of the establishment and labor market control variables. And theintercept for the core job proportion female effect (g10) represents the effectof proportion female at 0 gender integration.15 In the final model, only labor

Occu
pational Segregation
/ 899
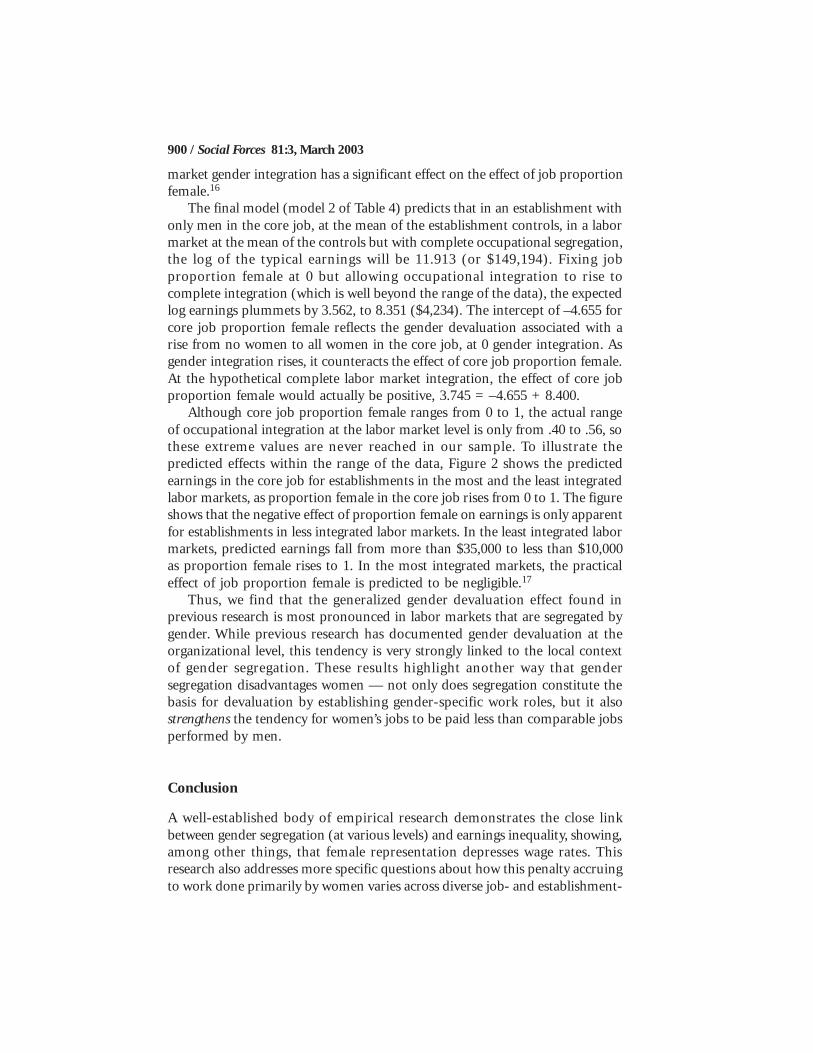
FIGURE 2: Gender Devaluation in High- and Low-Gender Integration Labor Markets
Figure 2. Gendered Devaluation in High- and Low-Gender Integration Labor Markets
$0
$5,000
$10,000
$15,000
$20,000
$25,000
$30,000
$35,000
$40,000
.00 .25 .50 .75 1.00
Proportion Female in Establishment's Core Job
Pre
dict
edE
arni
ngs
inC
ore
Job
Least integrated labor market (.40)
Most integrated labor market (.56)
900 / Social Forces 81:3, March 2003
market gender integration has a significant effect on the effect of job proportionfemale.16
The final model (model 2 of Table 4) predicts that in an establishment withonly men in the core job, at the mean of the establishment controls, in a labormarket at the mean of the controls but with complete occupational segregation,the log of the typical earnings will be 11.913 (or $149,194). Fixing jobproportion female at 0 but allowing occupational integration to rise tocomplete integration (which is well beyond the range of the data), the expectedlog earnings plummets by 3.562, to 8.351 ($4,234). The intercept of –4.655 forcore job proportion female reflects the gender devaluation associated with arise from no women to all women in the core job, at 0 gender integration. Asgender integration rises, it counteracts the effect of core job proportion female.At the hypothetical complete labor market integration, the effect of core jobproportion female would actually be positive, 3.745 = –4.655 + 8.400.
Although core job proportion female ranges from 0 to 1, the actual rangeof occupational integration at the labor market level is only from .40 to .56, sothese extreme values are never reached in our sample. To illustrate thepredicted effects within the range of the data, Figure 2 shows the predictedearnings in the core job for establishments in the most and the least integratedlabor markets, as proportion female in the core job rises from 0 to 1. The figureshows that the negative effect of proportion female on earnings is only apparentfor establishments in less integrated labor markets. In the least integrated labormarkets, predicted earnings fall from more than $35,000 to less than $10,000as proportion female rises to 1. In the most integrated markets, the practicaleffect of job proportion female is predicted to be negligible.17
Thus, we find that the generalized gender devaluation effect found inprevious research is most pronounced in labor markets that are segregated bygender. While previous research has documented gender devaluation at theorganizational level, this tendency is very strongly linked to the local contextof gender segregation. These results highlight another way that gendersegregation disadvantages women — not only does segregation constitute thebasis for devaluation by establishing gender-specific work roles, but it alsostrengthens the tendency for women’s jobs to be paid less than comparable jobsperformed by men.
Conclusion
A well-established body of empirical research demonstrates the close linkbetween gender segregation (at various levels) and earnings inequality, showing,among other things, that female representation depresses wage rates. Thisresearch also addresses more specific questions about how this penalty accruingto work done primarily by women varies across diverse job- and establishment-

Occupational Segregation / 901
level characteristics. Although there is no question that this work has addedgreatly to what we know about the dimensions of gender inequality, it does notaddress the important question of how the tendency to devalue women’s workmay be dependent on the level of gender segregation in the broader labormarket. Thus, previous research has not asked whether devaluation is strongeror weaker in segregated labor market contexts.
To this end, we used a unique combination of data sets to explore how thetendency for women’s work to be devalued is associated with occupationalgender segregation at the labor market level. Specifically, we hypothesized thatin labor markets with a relatively high level of gender segregation — a keyindicator of gender inequality — men are in a stronger position to benefit fromdevaluation and women are less able to resist it. Likewise, labor markets withmore gender segregation may have stronger systems of allocation and valueassessment that have evolved in a more inequitable environment.
Our results support the hypothesis that higher levels of occupational seg-regation at the labor market level are associated with a strongly increased ten-dency for gender-based devaluation of women’s work roles. The implicationsof our findings are substantial. Although devaluation certainly occurs at theestablishment level (see Huffman & Velasco 1997; Tomaskovic-Devey 1993b),it takes place in a larger labor market context. This underscores the impor-tance of macro-level conditions in the determination of inequality manifestedat the establishment level and raises the possibility that in the absence of oc-cupational segregation, at least some of the basis for gender-based devaluationwould be substantially eroded. In previous research (Huffman & Velasco 1997),gender devaluation was found to be relatively constant across a range of orga-nizational characteristics. However, devaluation does vary as a function of la-bor market characteristics, especially occupational gender segregation. This doesnot imply that organizational processes are irrelevant or that changing thepractices of firms will not substantially affect those processes producing be-tween-job wage inequality. Rather, it shows that their aggregate practices at thelabor market level are associated with the level of gender devaluation.
Although our analysis addresses an important unanswered questionregarding the organizational and labor market sources of gender inequality,several limitations should be noted. Most importantly, while other studies inthis area use data on individuals but not their establishment-specific jobs (seeEngland, Reid & Kilbourne 1996), we have data on jobs but not on individualsin those jobs. It is likely, therefore, that some of the gender-composition effecton wages that we find would be accounted for by individual-level factors, suchas full-time versus part-time employment, level of education, age, maritalstatus, and number of children. To narrow this gap, we control for the skilldemands and training requirements for the occupation of each job, whichcaptures some of this individual variation. Although this limitation is

902 / Social Forces 81:3, March 2003
significant, in this analysis our primary concern is the variation in thedevaluation effect across labor markets; we have no reason to believe that theomission of individual-level variables results in biased estimates of thatvariation.
Further, in the current analysis we cannot rule out the possibility that somepart of the devaluation effect we have identified results from the lower wageswomen receive, generally, net of the control variables we include. Futureresearch and data collection efforts need to include individual as well as joband labor market characteristics. In new research, we use U.S. Census micro-data to examine individual workers nested within local occupation-industrycells (Cohen & Huffman 2002), which gives us a large sample of individualsand simulated jobs across labor markets (but sacrifices the job- andestablishment-specific variables we have from the NOS). This results inestimates of the gender-composition effect on wages that account for individualworker characteristics. This also allows us to estimate within-job genderinequality — that is, how much men versus women earn in these jobs.
Finally, although our results clearly suggest that labor market segregationstrengthens gender-based devaluation, our data do not allow us to preciselyspecify the mechanisms underlying this association. For example, Beggs (1995)suggests that both race and gender inequality reflect spatial variation in localinstitutional history, which we do not directly measure. Incorporating suchvariables into a multilevel framework would allow researchers to betterunderstand the processes that create and sustain gender inequality in importantlabor market outcomes.
Notes
1. A well-established empirical finding is that the sex gap in pay decreases as occupationalclassifications become finer (Bielby & Baron 1984; Hultin & Szulkin 1999).
2. For a rebuttal of Tam’s (1997) model specification and a reanalysis of his data, seeEngland, Hermsen, and Cotter (2000).
3. Alternately, percentage female in individuals’ occupation-industry cell has been usedas a proxy for job-level gender composition (Budig 2002; England, Reid & Kilbourne 1996;Reid 1998).
4. As England, Reid, and Kilbourne (1996:513) note, some economists (Bergmann 1974,1986) interpret the effect of sex composition as suggestive of “crowding” rather thandevaluation. When access to some occupations is blocked, the oversupply of women inthe remaining occupations results in lower pay relative to men. Although it is extremelydifficult to differentiate crowding and devaluation empirically, Baron and Newman (1990)provide evidence that the net effect of demographic composition on job rewards reflectsdevaluation rather than crowding. See England (1992) and Jacobsen (1994) for detaileddiscussions of the sources and consequences of occupational crowding.

Occupational Segregation / 903
5. For example, see Bain (1985–86) and Daspit (1994). These local efforts also ofteninvolve fractious public debates that could heighten awareness of inequality and helpgenerate pressure on employers. The mayor of San Francisco, Willie Brown, claims thatthe city “has shown that cities committed to the fight for justice and equality can prevail”and has sent a “message to other local governments around California and the nation”(Brown 1999). On attempts to publicize local levels of gender inequality in executivepositions, see “Omaha Women Make Strides into Executive Ranks” (Omaha World-Herald, October 21, 2000); “The Culture Club: Diversity Efforts Make Some Inroads”(Kansas City Star, Sept. 19, 2000); and “Minorities Making Little Headway in SeniorManagement Positions” (Milwaukee Journal Sentinel, June 20, 2000). For efforts withregard to blue-collar workers, see “O.C. Far Below Average in Hiring Female Police” (LosAngeles Times, February 20, 2000); and, “MCLU: Too few women, people of color involunteer fire departments” (Star Tribune [Minneapolis], Dec. 16, 1993).
6. The original NOS data set comprised 727 work establishments. However, 39 wereduplicates.
7. Additional details regarding the NOS survey design can be found in Kalleberg et al.(1994) and Spaeth and O’Rourke (1996).
8. Tam (1997) argues that estimates of gender composition effects will be biased in favorof the devaluation hypothesis when both SVP and GED are included in the same model(but see England, Hermsen & Cotter 2000). Tam (1997), using only SVP and industrycontrols, finds no between-occupation gender composition effect. We replicated our level-1 model without GED but with our other controls — and again using just SVP andindustry controls — and in all cases found a strong and significant (p <.001) negativeeffect of proportion female on earnings in the core job. These results are available fromthe authors upon request.
9. Rather than using the standard dissimilarity index (see Duncan & Duncan 1955),which is the most commonly used segregation measure, we use an adjusted dissimilarityindex, taken from Cotter and colleagues (1997:730). It yields the proportion of womenwho would have to change occupations so that the observed number of women was nolarger or smaller than chance would predict. This measure has the same interpretationas the unadjusted dissimilarity index, but it uses a random distribution as the standardrather than absolute equality.
10. More than 95% of the MAs nationally fall within the range of occupational integrationcomputed across the 80 NOS MAs.
11. We estimated our models with the HLM software package, version 5.04. Estimatesare derived through maximum likelihood estimation.
12. For example, two jobs in the same labor market will have identical values on all labormarket variables, yielding downwardly biased standard errors.
13. The estimated variance components t00 and s2 can be used to form the intraclasscorrelation coefficient (r), which yields the proportion of the variance in the outcomevariable that exists between the level-2 units. It is computed as r = t
00 / (t
00 + s
2).

904 / Social Forces 81:3, March 2003
14. We also report a level-1 R2 measure defined by Snijders and Bosker (1994). Thismeasure is equal to the proportional reduction in the quantity t
00 + s2 due to inclusion
of predictors in the model. Following Snijders and Bosker (1994), we compute R2 bycomparing the quantity t
00 + s
2 of the random intercept model with the same quantity
in a model that includes independent variables. Thus, R2 = 1– [t00
+ s2 for a modelthat includes predictors / t
00 + s2 for a model with no predictors]. For example, for model
2 of Table 3, R2 = 1– [(.0198 + .3670) / (.0397 + .3932)] = .106.
15. Although the coefficients for gender integration are quite different in the two modelsin Table 4, this is an artifact of the variable centering. To see the predicted effect ofproportion female in the average MA, which has a gender integration of .50, we add one-half of the gender integration effect to the proportion female intercept. This yields aproportion female effect of –.525 in model 1 (–1.673 + [.50 × 2.297]), and –.455 inmodel 2 (–4.655 + [.50 × 8.400]).
16. In semi-reduced form models not shown, several of the control variables showsignificant effects, including those for durable goods manufacturing and female labordemand. The positive effect of durable goods manufacturing could help explain theposition of Youngstown, Ohio, in Figure 1.
17. One reviewer suggested that our devaluation effect might reflect the greater propensityof female workers to work part-time. The NOS data do not include a measure of theproportion of core job workers who work part-time, but they do include the number offull- and part-time workers in the entire establishment (although this measure is missingin 110 of our 475 establishments). We use these variables to construct a variableindicating the proportion of workers who are part-time (imputing the mean score andadding a dummy variable for missing cases) to test the possibility that part-time workersare confounding our gender devaluation effect. In the final model, proportion part-timedoes have a significant negative effect, but the inclusion of this variable does notsubstantially change the rest of the model. The net effect of core job proportion female(at .50 occupational integration) is reduced from .455 to .434, but the effect of genderintegration remains positive and significant. This is perhaps not surprising since 75% ofour establishments have fewer than 29% part-time workers.
References
Acker, Joan. 1989. Doing Comparable Worth: Gender, Class, and Pay Equity. Temple UniversityPress.
Bain, Adam J. 1985–86. “In Re Associated Sign & Post, Inc.: The Affirmative Action Obligationsof Government Contractors in Indiana.” Indiana Law Journal 61 Ind. L.J. 793.
Baron, James N. 1991. “Organizational Evidence of Ascription in Labor Markets.” Pp. 113–43 inNew Approaches to Economic and Social Analyses of Discrimination, edited by Richard R.Cornwall and Phanindra V. Wunnava. Praeger.
Baron, James N., Brian S. Mittman, and Andrew E. Newman. 1991. “Targets of Opportunity:Organizational and Environmental Determinants of Gender Integration within theCalifornia Civil Service, 1979–1985.” American Journal of Sociology 96:1362–1401.
Baron, James N., and Andrew E. Newman. 1989. “Pay the Man: Effects of DemographicComposition on Prescribed Pay Rates in the California Civil Service.” Pp. 107–30 in Pay

Occupational Segregation / 905
Equity: Empirical Inquiries, edited by Robert T. Michael, Heidi I. Hartmann, and BrigidO’Farrell. National Academy Press.
———. 1990. “For What It’s Worth: Organizations, Occupations, and the Value of Work Doneby Women and Nonwhites.” American Sociological Review 55:155–75.
Beggs, John J. 1995. “The Institutional Environment: Implications for Race and GenderInequality in the U.S. Labor Market.” American Sociological Review 60:612–33.
Beggs, John J., Wayne J. Villemez, and Ruth Arnold. 1997. “Black Population Concentrationand Black-White Inequality: Expanding the Consideration of Place and Space Effects.” SocialForces 76:65–91.
Bergmann, Barbara. 1974. “Occupational Segregation, Wages, and Profits: When EmployersDiscriminate.” Eastern Economic Journal 1:103–10.
———. 1986. The Economic Emergence of Women. Basic Books.
Bielby, William T., and James N. Baron. 1984. “A Woman’s Place Is with Other Women: SexSegregation within Organizations.” Pp. 27–55 in Sex Segregation in the Workplace: Trends,Explanations, Remedies, edited by Barbara F. Reskin. National Academy Press.
———. 1986. “Men and Women and Work: Sex Segregation and Statistical Discrimination.”American Journal of Sociology 91:759–99.
Bose, Christine E., and Peter H. Rossi. 1983. “Gender and Jobs: Prestige Standing of OccupationsAs Affected by Gender.” American Sociological Review 48:316–30.
Brown, Willie. 1999. “Breaking the Status Quo: San Francisco’s Attempt to Ensure Fairness inPublic Contracting.” Stanford Law and Policy Review 10:227.
Bryk, Anthony S., and Stephen W. Raudenbush. 1992. Hierarchical Linear Models: Applicationsand Data Analysis Methods. Sage Publications.
Budig, Michelle J. 2002. “Male Advantage and the Gender Composition of Jobs: Who Rides theGlass Escalator?” Social Problems 49:258–77.
Cassirer, Naomi. 1996. “Race Composition and Earnings: Effects by Race, Region, and Gender.”Social Science Research 25:375–99.
Chafetz, Janet S. 1984. Sex and Advantage: A Comparative, Macro-Structural Theory of SexStratification. Rowman & Allanheld.
Cohen, Philip N. 1998. “Black Concentration Effects on Black-White and Gender Inequality:Multilevel Analysis for U.S. Metropolitan Areas.” Social Forces 77:207–29.
———. 2001. “Race, Class, and Labor Markets: The White Working Class and RacialComposition of U.S. Metropolitan Areas.” Social Science Research 30:146–69.
Cohen, Philip N., and Matt L. Huffman. 2003. “Individuals, Jobs, and Labor Markets: TheDevaluation of Women’s Work.” Department of Sociology, University of California at Irvine.Unpublished manuscript.
Cotter, David A., JoAnn DeFiore, Joan M. Hermsen, Brenda M. Kowalewski, and ReeveVanneman. 1997. “All Women Benefit: The Macro-Level Effect of Occupational Integrationon Gender Earnings Inequality.” American Sociological Review 62:714–34.
———. 1998. “The Demand for Female Labor.” American Journal of Sociology 103:1673–1712.
Cotter, David A., Joan M. Hermsen, and Reeve Vanneman. 1999. “Systems of Gender, Race, andClass Inequality: Multilevel Analyses.” Social Forces 78:433–60.

906 / Social Forces 81:3, March 2003
Daspit, Nancy R. 1994. “The Family and Medical Leave Act of 1993: A Great Idea but a ‘RubeGoldberg’ Solution?” Emory Law Journal 43:1351.
Deaux, Kay. 1985. “Sex and Gender.” Annual Review of Psychology 36:49–81.
Duncan, Otis D., and Beverly Duncan. 1955. “A Methodological Analysis of Segregation Indexes.”American Sociological Review 20:210–17.
Edelman, Lauren B. 1990. “Legal Environments and Organizational Governance: The Expansionof Due Process in the American Workplace.” American Journal of Sociology 95:1401–40.
England, Paula. 1992. Comparable Worth: Theories and Evidence. Aldine de Gruyter.
England, Paula, and Dana Dunn. 1988. “Evaluating Work and Comparable Worth.” AnnualReview of Sociology 14:227–48.
England, Paula, George Farkas, Barbara S. Kilbourne, and Thomas Dou. 1988. “ExplainingOccupational Sex Segregation and Wages: Findings from a Model with Fixed Effects.”American Sociological Review 53:544–58.
England, Paula, Melissa S. Herbert, Barbara S. Kilbourne, Lori L. Reid, and Lori M. Megdal.1994. “The Gendered Valuation of Occupations and Skills: Earnings in 1980 CensusOccupations.” Social Forces 73:65–100.
England, Paula, Joan M. Hermsen, and David A. Cotter. 2000. “The Devaluation of Women’sWork: A Comment on Tam.” American Journal of Sociology 105:1741–51.
England, Paula, and Barbara S. Kilbourne. 1988. Occupational Measures from the Dictionary ofOccupational Titles for 1980 Census Detailed Occupations. Interuniversity Consortium forPolitical and Social Research.
England, Paula, Lori L. Reid, and Barbara S. Kilbourne. 1996. “The Effect of the Sex Compositionof Jobs on Starting Wages in an Organization: Findings from the NLSY.” Demography 33:511–21.
Fossett, Mark A. 1988. “Community-Level Analyses of Racial Socioeconomic Inequality:A Cautionary Note.” Sociological Methods and Research 16:454–91.
Gold, Michael E. 1993. An Introduction to the Law of Employment Discrimination. ILR Press.
Goldin, Claudia. 1990. Understanding the Gender Gap: An Economic History of American Women.Oxford University Press.
Grant, Don S., and Toby Parcel. 1990. “Revisiting Metropolitan Racial Inequality: The Case forthe Resource Approach.” Social Forces 68:1121–42.
Groshen, Erica L. 1991. “The Structure of the Female-Male Wage Differential: Is It Who You Are,What You Do, or Where You Work?” Journal of Human Resources 26:457–72.
Guo, Guang, and Hongxin Zhao. 2000. “Multilevel Modeling for Binary Data.” Annual Review ofSociology 26:441–62.
Guthrie, Doug, and Louise M. Roth. 1999a. “The State, Courts, and Maternity Policies in U.S.Organizations: Specifying Institutional Mechanisms.” American Sociological Review 64:41–63.
———. 1999b. “The State, Courts, and Equal Opportunities for Female CEOs in U.S.Organizations: Specifying Institutional Mechanisms.” Social Forces 78:511–42.
Gutman, Arthur. 1993. EEO Law and Personnel Practices. Sage Publications.
Hannan, Michael T., and John H. Freeman. 1984. “Structural Inertia and OrganizationalChange.” American Sociological Review 49:149–64.
Huffman, Matt L., and Steven C. Velasco. 1997. “When More Is Less: Sex Composition,Organizations, and Earnings in U.S. Firms.” Work and Occupations 24:214–44.

Occupational Segregation / 907
Huffman, Matt L., Steven C. Velasco, and William T. Bielby. 1996. “Where Sex CompositionMatters Most: Comparing the Effect of Job versus Occupational Sex Composition onEarnings.” Sociological Focus 29:189–207.
Hultin, Mia, and Ryszard Szulkin. 1999. “Wages and Unequal Access to Organizational Power:An Empirical Test of Gender Discrimination.” Administrative Science Quarterly 44:453–72.
Jacobs, Jerry A., and Mary Blair-Loy. 1996. “Race, Gender, Local Labor Markets and OccupationalDevaluation.” Sociological Focus 29:209–30.
Jacobs, Jerry A., and Ronnie J. Steinberg 1995. “Further Evidence on Compensating Differentialsand Gender Gap in Wages.” Pp. 93–124 in Gender Inequality at Work, edited by Jerry A.Jacobs. Sage Publications.
Jacobsen, Joyce P. 1994. The Economics of Gender. Blackwell.
Johnson, George, and Gary Solon. 1986. “Estimates of the Direct Effects of Comparable WorthPolicy.” American Economic Review 76:1117–25.
Kalleberg, Arne L., David Knoke, Peter V. Marsden, and Joe L. Spaeth. 1994. “The NationalOrganizations Study: An Introduction and Overview.” American Behavioral Scientist 37:860–71.
Kelly, Erin, and Frank Dobbin. 1999. “Civil Rights Law at Work: Sex Discrimination and theRise of Maternity Leave Policies.” American Journal of Sociology 105:455–92.
Kilbourne, Barbara S., Paula England, George Farkas, Kurt Beron, and Dorothea Weir. 1994.“Returns to Skill, Compensating Differentials, and Gender Bias: Effects of OccupationalCharacteristics on the Wages of White Women and Men.” American Journal of Sociology100:689–719.
Macpherson, David A., and Barry T. Hirsch. 1995. “Wages and Gender Composition: Why DoWomen’s Jobs Pay Less?” Journal of Labor Economics 13:426–71.
Major, Brenda, Dean McFarlin, and Diana Gagnon. 1984. “Overworked and Underpaid: Onthe Nature of Gender Differences in Personal Entitlement.” Journal of Personality and SocialPsychology 47:1399–1412.
Marsden, Peter V., Cynthia Cook, and David Knoke. 1994. “Measuring Organizational Structuresand Environments.” American Behavioral Scientist 37:891–910.
McArthur, Leslie. 1985. “Social Judgment Biases in Comparable Worth Analysis.” Pp. 53–70 inComparable Worth: New Directions for Research, edited by Heidi I. Hartmann. NationalAcademy Press.
Milkman, Ruth. 1987. Gender at Work: The Dynamics of Gender Segregation during World War II.University of Illinois Press.
Nelson, Robert L., and William P. Bridges. 1999. Legalizing Gender Inequality: Courts, Markets,and Unequal Pay for Women in America. Cambridge University Press.
Parcel, Toby. 1989. “Comparable Worth, Occupational Labor Markets, and OccupationalEarnings: Results from the 1980 Census.” Pp. 134–52 in Pay Equity: Empirical Inquiries, editedby Robert T. Michael, Heidi I. Hartmann, and Brigid O’Farrell. National Academy Press.
Petersen, Trond, and Laurie A. Morgan. 1995. “Separate and Unequal: Occupation-EstablishmentSex Segregation and the Gender Wage Gap.” American Journal of Sociology 101:329–65.
Reid, Lori L. 1998. “Devaluing Women and Minorities: The Effects of Race/Ethnic and SexComposition of Occupations on Wage Levels.” Work and Occupations 25:511–36.
Reskin, Barbara F. 1993. “Sex Segregation in the Workplace.” Annual Review of Sociology 19:241–70.

908 / Social Forces 81:3, March 2003
Reskin, Barbara F., and Debra B. McBrier. 2000. “Why Not Ascription? Organizations’Employment of Male and Female Managers.” American Sociological Review 65:210–33.
Reskin, Barbara F., Debra B. McBrier, and Julie A. Kmec. 1999. “The Determinants and Consequencesof Workplace Sex and Race Composition.” Annual Review of Sociology 25:335–61.
Snijders, Tom, and Roel J. Bosker. 1994. “Modeled Variance in Two-Level Models.” SociologicalMethods and Research 22:342–63.
———. 1999. Multilevel Analysis: An Introduction to Basic and Advanced Multilevel Modeling.Sage Publications.
Spaeth, Joe L., and O’Rourke, Diane P. 1996. “Design of the National Organizations Study.”Pp. 23–44 in Organizations in America: Analyzing Their Structures and Human ResourcePractices, edited by Arne L. Kalleberg, David Knoke, Peter V. Marsden, and Joe L. Spaeth.Sage Publications.
Tam, Tony. 1997. “Sex Segregation and Occupational Gender Inequality in the United States:Devaluation or Specialized Training?” American Journal of Sociology 102:1652–92.
Tienda, Marta, and Ding-Tzann Lii. 1987. “Minority Concentration and Earnings Inequality:Blacks, Hispanics, and Asians Compared.” American Journal of Sociology 93:141–65.
Tilly, Charles. 1998. Durable Inequality. University of California Press.
Tomaskovic-Devey, Donald. 1993a. “The Gender and Race Composition of Jobs and Male/Female,White/Black Pay Gaps.” Social Forces 72:45–76.
———. 1993b. Gender and Racial Inequality at Work: The Sources and Consequences of JobSegregation. ILR Press.
———. 1995. “Sex Composition and Gendered Earnings Inequality: A Comparison of Job andOccupational Models.” Pp. 23–56 in Gender Inequality at Work, edited by Jerry A. Jacobs.Sage Publications.
U.S. Department of Labor. 1977. Dictionary of Occupational Titles, 4th ed. Government PrintingOffice.
West, Candace, and Don H. Zimmerman. 1987. “Doing Gender.” Gender and Society 1:125-51.


![[XLS] · Web view1 2 2 2 3 2 4 2 5 2 6 2 7 8 2 9 2 10 11 12 2 13 2 14 2 15 2 16 2 17 2 18 2 19 2 20 2 21 2 22 2 23 2 24 2 25 2 26 2 27 28 2 29 2 30 2 31 2 32 2 33 2 34 2 35 2 36 2](https://static.fdocuments.in/doc/165x107/5ae0cb6a7f8b9a97518daca8/xls-view1-2-2-2-3-2-4-2-5-2-6-2-7-8-2-9-2-10-11-12-2-13-2-14-2-15-2-16-2-17-2.jpg)