25 Strategies to Health and Wealth - Montana State University · 40s 50s 60s Retirement has 20s...
17
1 1 Retirement Planning at Any Age January 26, 2012 2 Question A: What best describes your reaction about retirement? 1. Looking forward to it 2. Dreading it 3. Ambivalent 4. Don’t want to think about it 3 Question B: Have you talked to a retired person about what retirement is like? 1. Yes 2. No 4 40s 50s 60s Retirement has different meanings 20s 30s 70s 5 Question C: Your Age 1. 20 - 29 2. 30 - 39 3. 40 - 49 4. 50 - 59 5. 60 - 69 6. Over 70 6 Thinking About Retirement •Future Decisions •Future Concerns
Transcript of 25 Strategies to Health and Wealth - Montana State University · 40s 50s 60s Retirement has 20s...

1
1
Retirement
Planning
at Any Age
January 26, 2012
2
Question A: What best
describes your reaction about retirement?
1. Looking forward to it
2. Dreading it
3. Ambivalent
4. Don’t want to think about it
3
Question B: Have you talked to a retired person about what retirement is like?
1. Yes
2. No
4
40s
50s
60s
Retirement has
different meanings 20s
30s
70s
5
Question C: Your Age
1. 20 - 29
2. 30 - 39
3. 40 - 49
4. 50 - 59
5. 60 - 69
6. Over 70 6
Thinking About
Retirement
•Future Decisions
•Future Concerns

2
7
Future Decisions
•Where to live?
8
Future Decisions •Type of activities?
9
Future Concern •24/7 with spouse?
10
Future Concern •Family issues? –Sandwich Generation
•Care giving
–Parents
–Grandchildren
–Children (boomerang kids)
11
Future concern: Money Future concern: Money
12
Question D: What is your major concern about retirement?
1. Where to live?
2. Activities?
3. 24/7 spouse?
4. Family issues?
5. Money?

3
13
Future concern: Money Future concern: Money
14
7 Key Factor$ 1. Age at retirement
2. Years in retirement
3. Current retirement savings
4. Income needed
5. Income sources/amounts
6. Investment rate of return
7. Inflation rate
15
Factor # 1
• Age at retirement?
– How many more years to work?
16
Trend…people
are retiring later
• Age 62 in 1995
• Age 65 during 2006 - 2010
17
Working longer • Increased savings
• Increased benefits
• Fewer years to provide retirement income
18
Workers’ Planned
Retirement Ages 2011
•Before age 60 7%
•Age 60-64 16%
•Age 65 26%
Total planned to retire
before age 65 49%
4
19
• 38% of today’s retirees retired by age 65
Gap: Expectations (49%) vs. Reality (38%) (2010)
20
Question E: What age do you plan to retire?
1.66 - 70
2.61 - 65
3.56 - 60
4.51 – 55
5.Never
21
Factor #2
•Number years in retirement?
22
How long are you ‘gonna’ live?
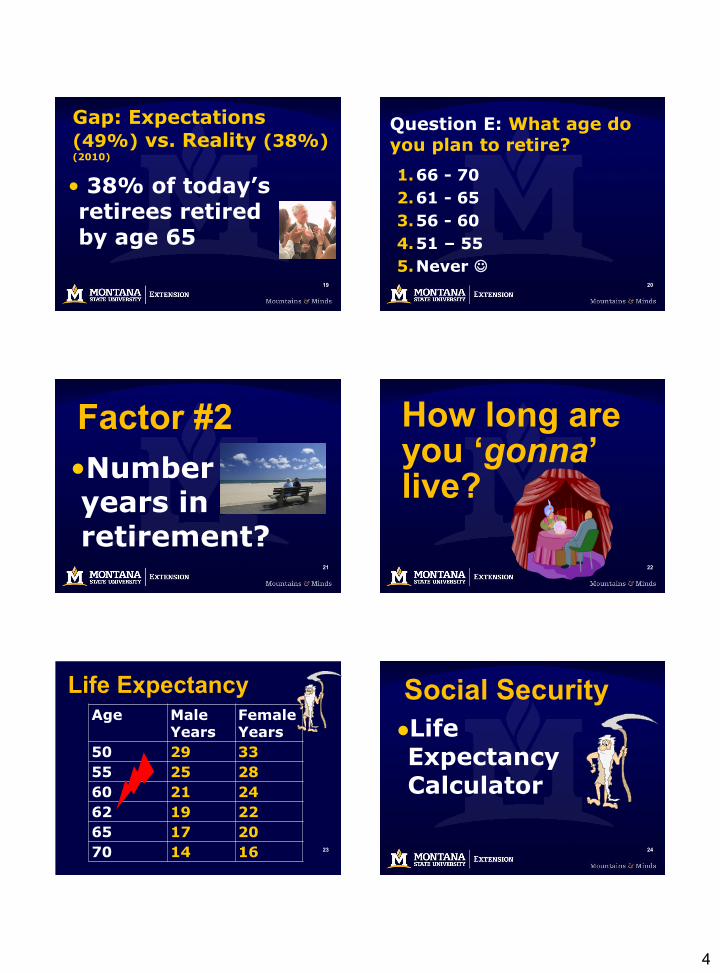
23
Life Expectancy Age Male
Years Female Years
50 29 33
55 25 28
60 21 24
62 19 22
65 17 20
70 14 16 24
Social Security
Life Expectancy Calculator

5
25
Live to??? • 45% chance that
one spouse in a 65-year old couple will live to 95
26
What about you?
Your anticipated years in retirement?
27
Question F: How long do you expect to be retired?
1. 40+ years
2. 26 - 30 yrs
3. 21 - 25 yrs
4. 16 - 20 yrs
5. 11 - 15 yrs
6. 5 - 10 yrs 28
Factor #3 • Amount of
“designated” retirement savings?
29
Question G: What is the current value of your retirement funds?
1. Less than $10,000
2. $10,000 - $24,999
3. $25,000 - $49,999
4. $50,000 - $99,999
5. $100,000 - $249,000
6. $250,000 or more
30
Total Savings March 2010
HR attendees
Less than $10,000 40%
$10,000 - $24,999 13%
$25,000 - $49,999 11%
$50,000 - $99,999 12%
$100,000 - $249,999 12%
$250,000 or more 12%

6
31
General Guideline from a
CFP For every $1,000 in monthly income you need $300,000 in savings
Marsha’s reaction
GET REAL!!! 32 32
$100,000 Fund
Monthly Withdrawal
Fund Lasts
$500 23 yrs
$700 15 yrs
$1,000 9.5 yrs
33
IRA Contributions
2012 $5,000 under age 50
$6,000 age 50 & older
34
Under age 50 $17,000
Age 50 & $22,500 older
Tax-Deferred Plans
2012 [401(k) , 403(b), 457]
35
Retirement
Confidence Survey • March 2011
–Only 24% of workers said they are very confident they’ll have enough for retirement
–2010 average was 19% 36
How much to save?
•Have you calculated how much money you need to save by retirement?

7
37
Question H: Have you calculated how much to save for retirement?
1.Yes
2.No
38
Calculate March 2011
•42% workers report they have tried to calculate how much money they need to save by retirement
39
Benefit of Calculating March 2011
• Benefit of Calculation
– 59% of workers who calculated retirement
• saved and invested more
40
Changed other aspects of their retirement planning
•Changed investment mix 19%
•Reduced debt/spending 16%
•Researched ways save for retirement 7%
•Decided to work longer 5% Enrolled retire/savings plan 3%
41
Resources to Help
You Find Answers
•“Do it yourselfers”
–Financial calculators via the Web
42
Information Needed for Calculating Retirement Needs
•Typical questions asked at Web sites: –www.msuextension.org/ solidfinances – Click Recorded Sessions & Resources • See January 24 Resources

8
43
ChoosetoSave.org – Retirement
calculators – Social Security
calculators – Roth IRA calculators
44
Web Resources • Ballpark Estimate –www.choosetosave.org/ ballpark
45
AARP Interactive Tools www.aarp.org/tools
Work & Retirement Tools 1. AARP Retirement Calculator 2. 401(k) Savings Calculator 3. 403(b) Savings Calculator 4. Pension Plan Retirement
Options
46
Web Calculators • Investment firms –TIAA - CREF
–T. Rowe Price
–Fidelity
–and Others????
47
Results of Web
Financial Calculators
• Reveals how much you need to save by your targeted retirement date
48
Factor #4 •Income needed during retirement?

9
49
Marsha Goetting
•“It depends!” – Lifestyle
– Health
– Care giving for parents
50
TIAA-CREF • 55% of retirees expected expenses to decline
– But, only 30% of found that to be true
51
TIAA-CREF • 20% of retirees said their spending ROSE during retirement
52
Prosperous Retirement:
Guide to the New Reality
-Michael Stein
• Go-go years
• Slow-go years
• No-go years
53
Consumer Expenditures--2009
Bureau of Labor Statistics Income After Taxes
Age Monthly Yearly
55 – 64 $5,632 $67,586 65 – 74 $3,255 $39,054 75 + $2,606 $31,272
54
Financial
Planners • Income sources should provide 60% to 80% of pre-retirement income

10
55
Some financial
planners recommend
• 100% + of
pre- retirement income
56
Can You? • Live on 50%, 60%, 70%, or 80% of current income?
57
Test Drive
• Take income cut now –Put difference in retirement savings
58
Question H: What % of present income do you think you will need during retirement?
1. More than 100%
2. 100%
3. 90%
4. 80%
5. 70%
6. 50%
59
Factor #5 • Income sources & amounts during retirement?
60
Traditional Income
Sources “Stool”
Savings Pension
Social Security

11
61
Now..stool has more
legs
Savings Pension
Social Security
Job(s)
Job(s)
Job(s)
62
Income from Social Security
Savings Pension
Social Security
63
Average Social
Security Benefits
2011
Income
Worker $1,170
Spouse $746
64
Income from
Pension/Retirement Plan?
Savings Pension
Social Security
65
Question I: Will you have retirement income from your job?
1.Yes
2.No
66
Income from
Savings
Savings Pension
Social Security

12
67
Income from Personal
Savings 2011 (Gap again)
•Workers Expect 65%
•Retirees Reported 50%
68
Why Save for Retirement Check how big your account can
grow
• Growth Calculator – Find your age – See how large your weekly/biweekly investment can grow by age 65
69
Growth & Savings
Savings (Weekly)
Age 25
Age 35
$10 $151,277 $64,582
$25 $378,193 $161,456
$50 $756,385 $322,911
$75 $1,134,578 $484,367
$100 $1,512,770 $645,822
$200 $3,025,540 $1,291,645 Assuming 8% rate of return
70
Growth & Savings Savings
(Weekly) Age 40
Age 50
$10 $41,211 $14,995
$25 $103,028 $37,487
$50 $206,056 $74,975
$75 $309,084 $112,462
$100 $412,111 $149,950
$200 $824,223 $299,900 Assuming 8% rate of return
71
Check the cost of
ONE YEAR delay
• Find your age
• Look under weekly/biweekly amount to invest
• See how much less 72
Cost of One Year Delay
Savings (Weekly)
Age 25
Age 35
$10 $12,092 $5,448
$25 $30,230 $13,619
$50 $60,459 $27,238
$75 $90,689 $40,857
$100 $120,918 $54,476
$200 $241,836 $108,953 Assuming 8% rate of return; Pay Increases 3%

13
73
Savings
(Weekly) Age 40
Age 50
$10 $3,657 $1,647
$25 $9,141 $4,118
$50 $18,283 $8,237
$75 $27,424 $12,355
$100 $36,565 $16,473
$200 $73,100 $32,947
Cost of One Year Delay
Assuming 8% rate of return; Pay Increases 3% 74
Income from job
Savings Pension
Social Security
Job(s)
Job(s)
Job(s)
75
Retirees work
•Why • Stay active 92%
• Enjoy working 86%
• Financial 72%
–Money for extras 72%
–Make ends meet 59%
–Keep health insurance 40%
76
Disconnect
•Pre-retirees –72-80% say they plan to work
•Retirees – Only 12% have jobs
77
Question J: Do you plan to work after retirement?
1.Yes
2.No
78
Factor #6 • Investment Rate of Return?
–Before retirement?
–During retirement?

14
79
Question K: What was the average rate of return for large common stocks from 1926 – 2010?
1. 9.8%
2. 8.1%
3. 6.6%
4. 3.7% 80
Average rate of return for large common stocks 1926 - 2010
9.8%
81
Diversification • Stocks & Bonds
• Mutual Funds
• U. S. Savings Bonds
• Real Estate
• Certificates of Deposit
• Money Market Certificates 82
Investment Alternatives
• $1,000 in cash several years ago
83
Touch America-
$1,000
• Worth $0.000016
84
Enron-$1,000
• Worthless

15
85
World Com
$1,000 •Worth Zip
86
Budweiser - $1,000 • Actual Beer not stock
• Drank all beer & turned in cans for 10 cent deposit
87
Budweiser-$1,000
• You would have $168
88
Moral of Story
• “You should always keep a portion of your portfolio liquid!”
89
Question L: What do you “guesstimate” will be your investment rate of return during retirement?
1. 10.7%
2. 8.5%
3. 6.1%
4. 4.2%
5. 3.1% 90
Factor #7 • Inflation rate?? –Before retirement
–During retirement
16
91
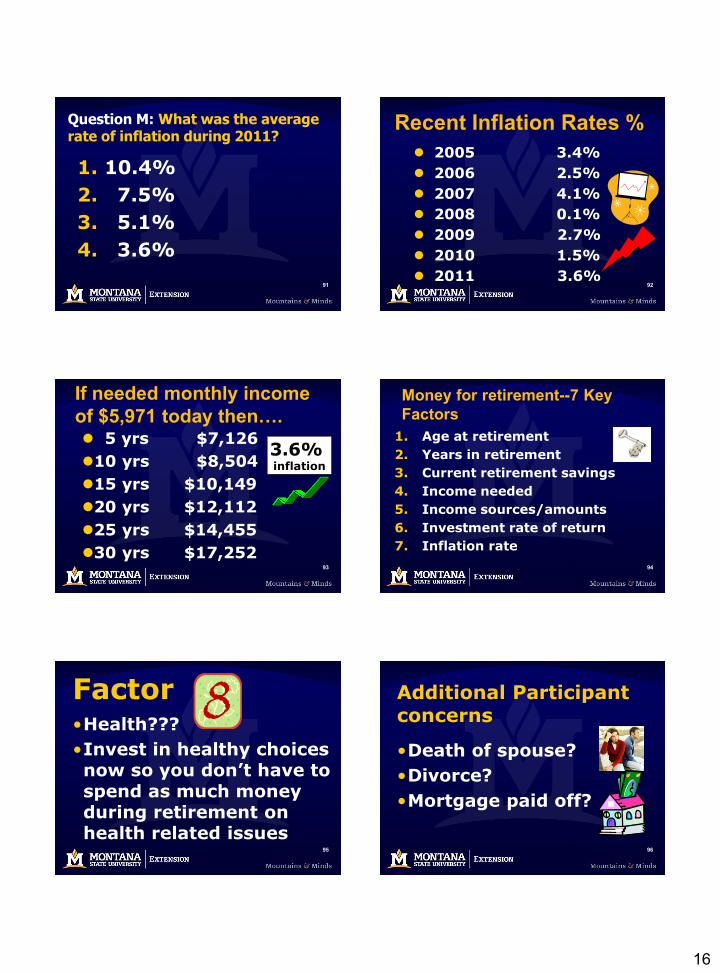
Question M: What was the average rate of inflation during 2011?
1. 10.4%
2. 7.5%
3. 5.1%
4. 3.6%
92
Recent Inflation Rates %
2005 3.4%
2006 2.5%
2007 4.1%
2008 0.1%
2009 2.7%
2010 1.5%
2011 3.6%
93
If needed monthly income
of $5,971 today then…. 5 yrs $7,126
10 yrs $8,504
15 yrs $10,149
20 yrs $12,112
25 yrs $14,455
30 yrs $17,252
3.6% inflation
94
Money for retirement--7 Key
Factors
1. Age at retirement
2. Years in retirement
3. Current retirement savings
4. Income needed
5. Income sources/amounts
6. Investment rate of return
7. Inflation rate
95
Factor •Health???
•Invest in healthy choices now so you don’t have to spend as much money during retirement on health related issues
96
Additional Participant concerns
•Death of spouse?
•Divorce?
•Mortgage paid off?

17
97
Philosophy?
•Plan for uncertainty
98 98 98
6 $olution$ 1. Spend less, now & later
2. Work longer
3. Withdraw retirement savings
4. Work during retirement
5. Moonlight now
6. Convert assets to cash
99 99
GAP example
Needed Income $5,971 • Social Security H $1,162 • Social Security W $ 573 • PERS/TIAACREF $1,486 • IRA Withdrawal $ 478 • Other Retirement Fund $ 956 • Job (Part Time) ($7.25) $1,160
• Total $5,815
GAP -$156
100 100
Best wishes as you make consider the impact of these 8 key factors on
your Retirement Planning
Marsha