25 PLAXIS Bulletin
24
Crane Monopile Foundation Analysis Mohr-Coulomb Parameters for Modelling of Concrete Structures Simulation of Soil Nail Structures using PLAXIS 2D Ed Issue 25 / Spring 2009 Plaxis Bulletin
-
Upload
clarence-deada -
Category
Documents
-
view
36 -
download
6
Transcript of 25 PLAXIS Bulletin
Title
Crane Monopile Foundation Analysis
Mohr-Coulomb Parameters for Modelling of Concrete Structures
Simulation of Soil Nail Structures using PLAXIS 2D
Editorial
Issue 25 / Spring 2009
Plaxis Bulletin
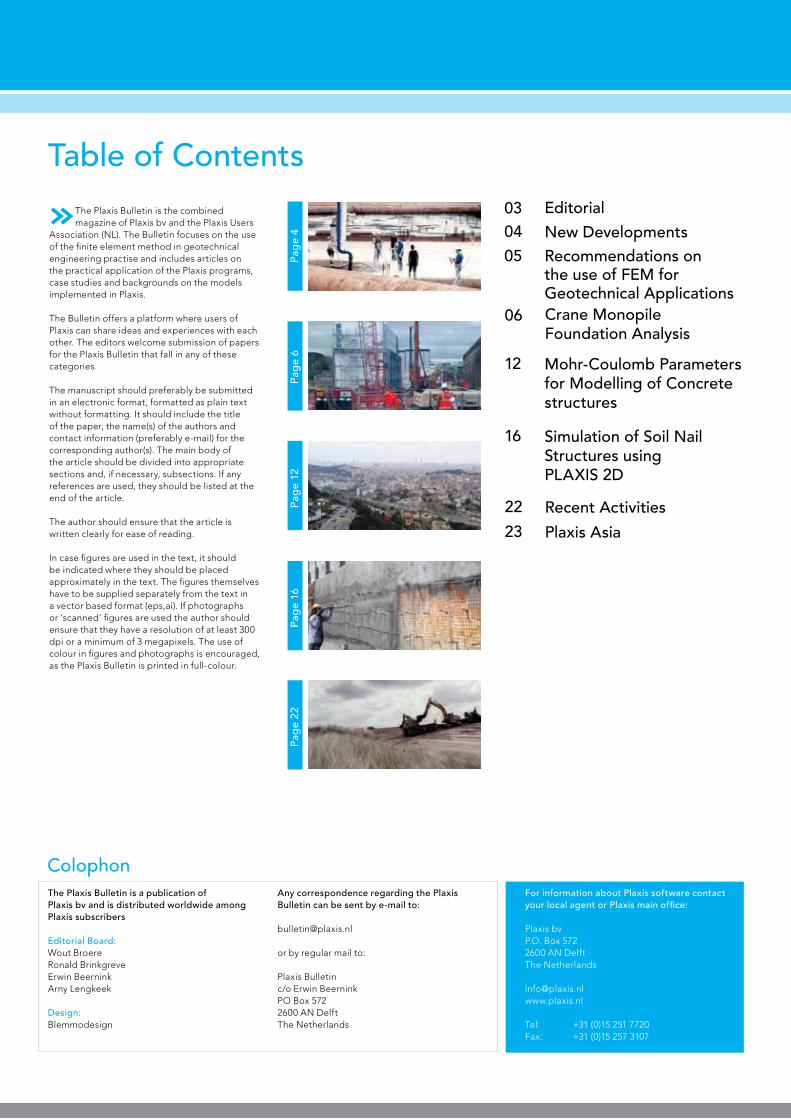
Table of Contents
Pag
e 4
Pag
e 6
Pag
e 12
Pag
e 16
Pag
e 22
Editorial03New Developments04
Recent Activities22
Plaxis Asia23
Simulation of Soil Nail Structures using PLAXIS 2D
16
Mohr-Coulomb Parameters for Modelling of Concrete structures
12
Crane Monopile Foundation Analysis
06
Recommendations on the use of FEM for Geotechnical Applications
05
ColophonAny correspondence regarding the Plaxis Bulletin can be sent by e-mail to:
or by regular mail to:
Plaxis Bulletinc/o Erwin BeerninkPO Box 5722600 AN DelftThe Netherlands
The Plaxis Bulletin is a publication of Plaxis bv and is distributed worldwide among Plaxis subscribers
Editorial Board:Wout BroereRonald BrinkgreveErwin BeerninkArny Lengkeek
Design: Blemmodesign
For information about Plaxis software contact your local agent or Plaxis main office:
Plaxis bvP.O. Box 5722600 AN DelftThe Netherlands
Tel: +31 (0)15 251 7720Fax: +31 (0)15 257 3107
» The Plaxis Bulletin is the combined magazine of Plaxis bv and the Plaxis Users
Association (NL). The Bulletin focuses on the use of the finite element method in geotechnical engineering practise and includes articles on the practical application of the Plaxis programs, case studies and backgrounds on the models implemented in Plaxis.
The Bulletin offers a platform where users of Plaxis can share ideas and experiences with each other. The editors welcome submission of papers for the Plaxis Bulletin that fall in any of these categories.
The manuscript should preferably be submitted in an electronic format, formatted as plain text without formatting. It should include the title of the paper, the name(s) of the authors and contact information (preferably e-mail) for the corresponding author(s). The main body of the article should be divided into appropriate sections and, if necessary, subsections. If any references are used, they should be listed at the end of the article. The author should ensure that the article is written clearly for ease of reading.
In case figures are used in the text, it should be indicated where they should be placed approximately in the text. The figures themselves have to be supplied separately from the text in a vector based format (eps,ai). If photographs or ‘scanned’ figures are used the author should ensure that they have a resolution of at least 300 dpi or a minimum of 3 megapixels. The use of colour in figures and photographs is encouraged, as the Plaxis Bulletin is printed in full-colour.
www.plaxis.nl l Spring Issue 2009 l Plaxis Bulletin 3
Editorial
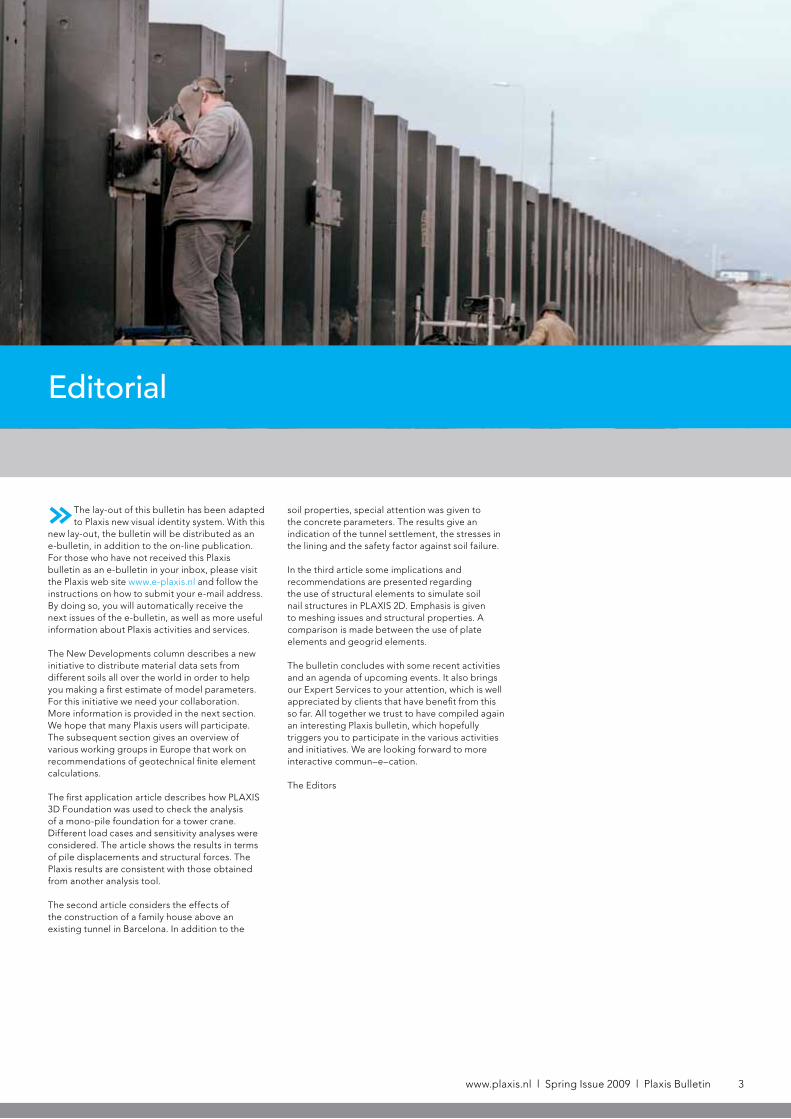
» The lay-out of this bulletin has been adapted to Plaxis new visual identity system. With this
new lay-out, the bulletin will be distributed as an e-bulletin, in addition to the on-line publication. For those who have not received this Plaxis bulletin as an e-bulletin in your inbox, please visit the Plaxis web site www.e-plaxis.nl and follow the instructions on how to submit your e-mail address. By doing so, you will automatically receive the next issues of the e-bulletin, as well as more useful information about Plaxis activities and services.
The New Developments column describes a new initiative to distribute material data sets from different soils all over the world in order to help you making a first estimate of model parameters. For this initiative we need your collaboration. More information is provided in the next section. We hope that many Plaxis users will participate. The subsequent section gives an overview of various working groups in Europe that work on recommendations of geotechnical finite element calculations.
The first application article describes how PLAXIS 3D Foundation was used to check the analysis of a mono-pile foundation for a tower crane. Different load cases and sensitivity analyses were considered. The article shows the results in terms of pile displacements and structural forces. The Plaxis results are consistent with those obtained from another analysis tool.
The second article considers the effects of the construction of a family house above an existing tunnel in Barcelona. In addition to the
soil properties, special attention was given to the concrete parameters. The results give an indication of the tunnel settlement, the stresses in the lining and the safety factor against soil failure.
In the third article some implications and recommendations are presented regarding the use of structural elements to simulate soil nail structures in PLAXIS 2D. Emphasis is given to meshing issues and structural properties. A comparison is made between the use of plate elements and geogrid elements.
The bulletin concludes with some recent activities and an agenda of upcoming events. It also brings our Expert Services to your attention, which is well appreciated by clients that have benefit from this so far. All together we trust to have compiled again an interesting Plaxis bulletin, which hopefully triggers you to participate in the various activities and initiatives. We are looking forward to more interactive commun–e–cation.
The Editors
Editorial
4 Plaxis Bulletin l Spring Issue 2009 l www.plaxis.nl
New Developments
0
100
200
300
400
500
600
700
800
900
0 5 10 15 20
epsyy [%]
Experiment
Simulation
drained
undrained
q [kPa]
0
200
300
400
500
600
700
0 100 200 300 400 500 600 700
p' [kPa]
q
drained
Critical State Line Instability
Line
undrained
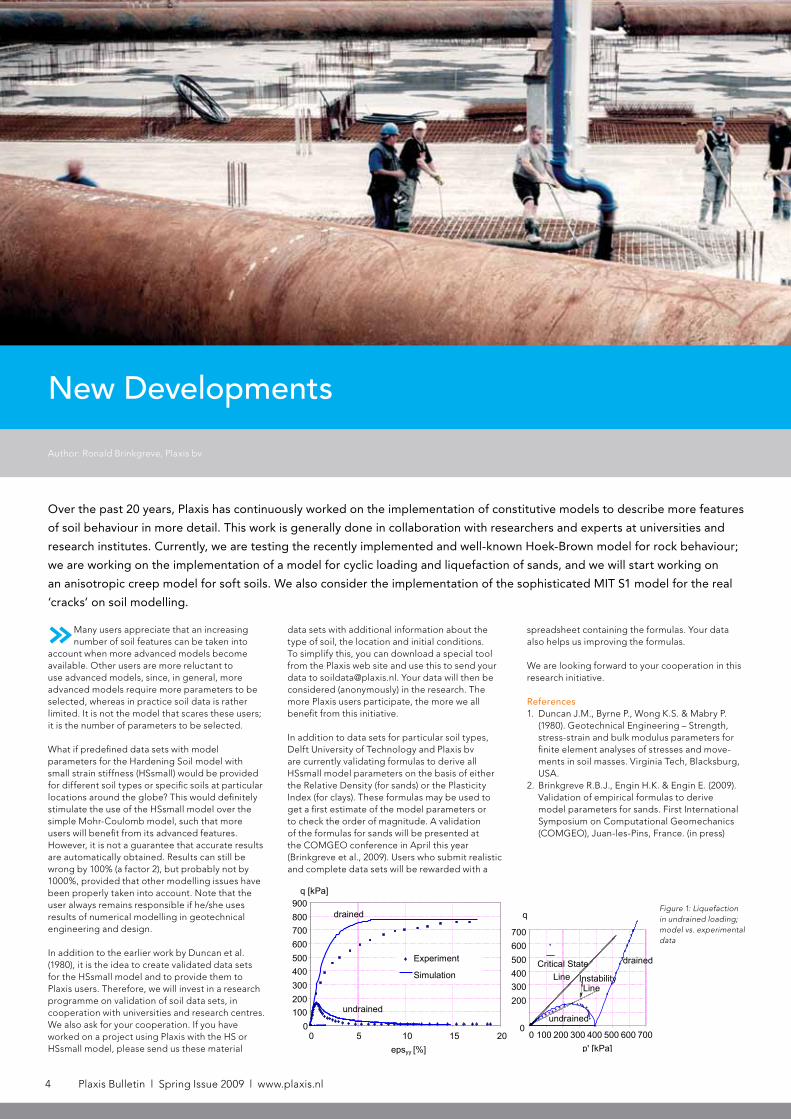
Figure 1: Liquefaction in undrained loading; model vs. experimental data
»Many users appreciate that an increasing number of soil features can be taken into
account when more advanced models become available. Other users are more reluctant to use advanced models, since, in general, more advanced models require more parameters to be selected, whereas in practice soil data is rather limited. It is not the model that scares these users; it is the number of parameters to be selected.
What if predefined data sets with model parameters for the Hardening Soil model with small strain stiffness (HSsmall) would be provided for different soil types or specific soils at particular locations around the globe? This would definitely stimulate the use of the HSsmall model over the simple Mohr-Coulomb model, such that more users will benefit from its advanced features. However, it is not a guarantee that accurate results are automatically obtained. Results can still be wrong by 100% (a factor 2), but probably not by 1000%, provided that other modelling issues have been properly taken into account. Note that the user always remains responsible if he/she uses results of numerical modelling in geotechnical engineering and design.
In addition to the earlier work by Duncan et al. (1980), it is the idea to create validated data sets for the HSsmall model and to provide them to Plaxis users. Therefore, we will invest in a research programme on validation of soil data sets, in cooperation with universities and research centres. We also ask for your cooperation. If you have worked on a project using Plaxis with the HS or HSsmall model, please send us these material
data sets with additional information about the type of soil, the location and initial conditions. To simplify this, you can download a special tool from the Plaxis web site and use this to send your data to [email protected]. Your data will then be considered (anonymously) in the research. The more Plaxis users participate, the more we all benefit from this initiative.
In addition to data sets for particular soil types, Delft University of Technology and Plaxis bv are currently validating formulas to derive all HSsmall model parameters on the basis of either the Relative Density (for sands) or the Plasticity Index (for clays). These formulas may be used to get a first estimate of the model parameters or to check the order of magnitude. A validation of the formulas for sands will be presented at the COMGEO conference in April this year (Brinkgreve et al., 2009). Users who submit realistic and complete data sets will be rewarded with a
spreadsheet containing the formulas. Your data also helps us improving the formulas.
We are looking forward to your cooperation in this research initiative.
References1. Duncan J.M., Byrne P., Wong K.S. & Mabry P.
(1980). Geotechnical Engineering – Strength, stress-strain and bulk modulus parameters for finite element analyses of stresses and move-ments in soil masses. Virginia Tech, Blacksburg, USA.
2. Brinkgreve R.B.J., Engin H.K. & Engin E. (2009). Validation of empirical formulas to derive model parameters for sands. First International Symposium on Computational Geomechanics (COMGEO), Juan-les-Pins, France. (in press)
Over the past 20 years, Plaxis has continuously worked on the implementation of constitutive models to describe more features
of soil behaviour in more detail. This work is generally done in collaboration with researchers and experts at universities and
research institutes. Currently, we are testing the recently implemented and well-known Hoek-Brown model for rock behaviour;
we are working on the implementation of a model for cyclic loading and liquefaction of sands, and we will start working on
an anisotropic creep model for soft soils. We also consider the implementation of the sophisticated MIT S1 model for the real
‘cracks’ on soil modelling.
Author: Ronald Brinkgreve, Plaxis bv

www.plaxis.nl l Spring Issue 2009 l Plaxis Bulletin 5
»The German DGGT working group 1.6 Numerical Methods in Geotechnics is
active since the early nineties. Over the years, they have published a number of documents with recommendations on the size of finite element meshes, the selection of models and parameters, and other useful hints for typical applications like excavations, tunnels and slopes (Meissner 1991, 1996, 2002; Schanz 2006). Also various benchmarks have been elaborated in collaboration with the ERTC7, of which the results have been published in three NUMGE conferences (Schweiger 1998, 2002, 2006).
In France, a new committee was initiated in 2008 by the geotechnical division of LCPC to consider typical French situations. In particular, the use of the pressuremeter test as the main source of soil investigation leads to special recommendations for model parameter selection. The recommendations should also consider reinforced soil structures.
About the same time, another committee was initiated by NAFEMS in the UK to give a follow up on an earlier publication in this field (Mar, 2002). NAFEMS is a non-profit organization to promote the use of the finite element method in engineering in general.
Plaxis is actively involved in workshops and meetings organized by all these working groups. In addition to the committees mentioned here, there are several other persons, universities and organizations involved in education and research with the purpose to stimulate and improve the use of numerical methods and constitutive models for geotechnical applications. This short message is not intended to give a complete overview, but we are interested to hear about similar initiatives.
Please inform us by sending an e-mail with further details to [email protected].
References1. Meissner H. (1991). Empfehlungen des
Arbeitskreises “Numerik in der Geotechnik” der Deutschen Gesellschaft für Erd- und Grundbau e.V. Geotechnik 14. 1-10.
2. Meissner H. (1996). Tunnelbau unter Tage. Empfehlungen des Arbeitskreises 1.6 “Numerik in der Geotechnik“, Abschnitt 2. Geotechnik 19, Nr. 2. 99-108.
3. Meissner (2002). Baugruben. Empfehlungen des Arbeitskreises 1.6 “Numerik in der Geotechnik”, Abschnitt 3. Geotechnik 25. 44-56.
4. Schanz (2006). Actuelle Entwicklungen bei Standsicherheits- und Verformungs-berechnungen in der Geotechnik. Empfehlungen des Arbeitskreises 1.6 “Numerik in der Geotechnik”, Abschnitt 4. Geotechnik 29. 13-27.
5. Schweiger H.F. (1998). Results from two geotechnical benchmark problems. Proc. 4th Eur. Conf. on Num. Meth. in Geotechnical Engineering. Cividini A. (ed.) Springer. 645-654.
6. Schweiger H.F. (2002). Results from numerical benchmark exercises in geotechnics. Proc. 5th Eur. Conf. on Num. Meth. in Geotechnical Engineering. Mestat P. (ed.). Paris: Presses Ponts et Chaussees. 305-314.
7. Schweiger H.F. (2006). Results from the ERTC7 benchmark exercise. Proc. 6th Eur. Conf. on Num. Meth. in Geotechnical Engineering. Schweiger H.F. (ed.) Taylor & Francis.
8. Mar A. (2002). How to undertake Finite Element based geotechnical analysis. NAFEMS publication.
In Europe, a few committees are working on recommendations on the use of the Finite Element Method for geotechnical
applications. Since 1986 the European Regional Technical Committee ERTC7 has organized conferences on Numerical Methods
in Geotechnics (NUMGE). Conferences have been held in Stuttgart (1986), Santander (1990), Manchester (1994), Udine (1998),
Paris (2002), Graz (2006), and the next conference will be held in Trondheim (2010).
Author: Ronald Brinkgreve, Plaxis bv
Recommendations on the use of FEM for Geotechnical Applications
6 Plaxis Bulletin l Spring Issue 2009 l www.plaxis.nl
derived in the first instance from data in a comprehensive geotechnical investigation interpretative report. In summary, the site is underlain by: 2m of made ground, 4m of weathered London Clay, 14.5m of London clay, 19.5m of Lambeth Clay and 3.5m of Thanet Sands founded on Upper Chalk.
Given the transitory nature of the crane loading a short-term undrained response of the ground was considered appropriate; consequently an undrained analysis was performed using undrained soil parameters. A range of soil parameters were considered for the detailed analysis and because of the extreme nature of the problem in terms of the close proximity of the surrounding structures and uncertainties with regard to soil strength and stiffness due to construction stage effects; the final analyses assumed a single London clay layer with very conservative values for the undrained Young’s modulus and undrained shear strength of: 30MPa and 150kPa respectively. Given the transitory nature of the loading and the characteristics of the surrounding soils the pile/soil interaction was analysed as an undrained load case. Therefore the London clay has been modelled as an undrained, cohesive linear elastic-perfectly plastic (Tresca) material. The Plaxis Mohr-Coulomb strength model was used with the friction and dilatancy angles equal to zero, cohesion equal to the undrained strength and the Plaxis default (zero tensile strength) tension cut-off criterion in place which restricts the development of tensile stresses in the soil.
0z }= =^ hc su=^ h
The monopile is a composite structure as shown in Figure 3 which comprises a 16.825m length of steel pipe (Outer diameter 2.2m with a wall thickness of 40mm) surrounded by a 6.825m length of concrete caisson (Inner diameter of 3m with a wall thickness of 160mm) in the upper portion of the pile where it is known that the high lateral loads will develop. The infill between the concrete and steel is a cement-bentonite grout mixture and the infill in the steel pipe is a 20:1 sand-cement mixture. The basement structure comprises three floors and a contiguous piled wall composed of 28.825m length; 900mm diameter piles at 1050mm centres. The horizontal distance between the bored pile wall and crane monopile centrelines is 3.2m. The top of the crane monopile is connected to the top of the basement structure by a 500 thick reinforced concrete slab as shown in Figure 1.
The material properties used for this problem are summarised in Table 1.
Interface elements have been used along the outside surfaces of the monopile for all the finite element models in this study. These elements are used to improve the results by allowing for slip between the monopile and the soil and to model a possibly reduced strength along the sides of the monopile to account for reduced soil strengths due to the effects of pile installation.
s s,int intu u$= a
Crane Monopile Foundation Analysis
»PLAXIS 3D Foundation results on simplified representations of the pile foundation
were compared with Coffey in-house developed analytical tools. The crane monopile is a composite structure composed of concentric elements and the effect of using the pile designer in developing such a configuration was explored.The monopile is a composite structure of concentric elements and this was modelled using a combination of volume elements defined using the pile designer in PLAXIS 3D Foundation. The pile cross-section for each concentric component was modelled as a circular tube with the appropriate diameter and wall thickness.
Description of the Problem ConsideredThe proposed foundation is a monopile situated very close to an existing two-level basement as illustrated in Figure 1. As well as ensuring that the proposed design of the monopile is structurally capable of carrying the applied loads from the tower crane, the close proximity of the foundation to the basement warrants investigation of the loads and deformations induced in these neighboring structures by the activities of the tower crane. Such predictions would not be possible via simplistic calculations hence the recourse to finite element modelling to gain insight into this three-dimensional soil-structure interaction problem.
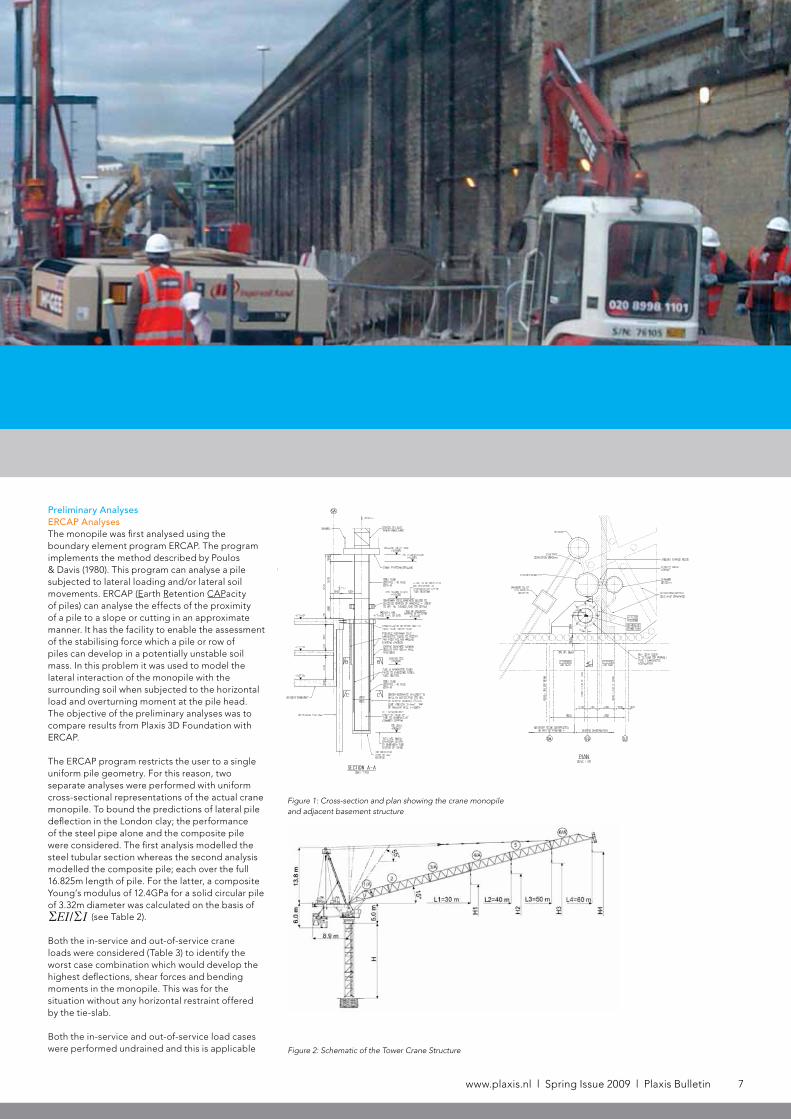
The base of the crane platform grillage (500mm thick) is elevated at 9.5m above the top of concrete capping and tie slab. The tower crane is 24.4m high with a 60m long jib as shown in Figure 2.The soil parameters used in the analyses were
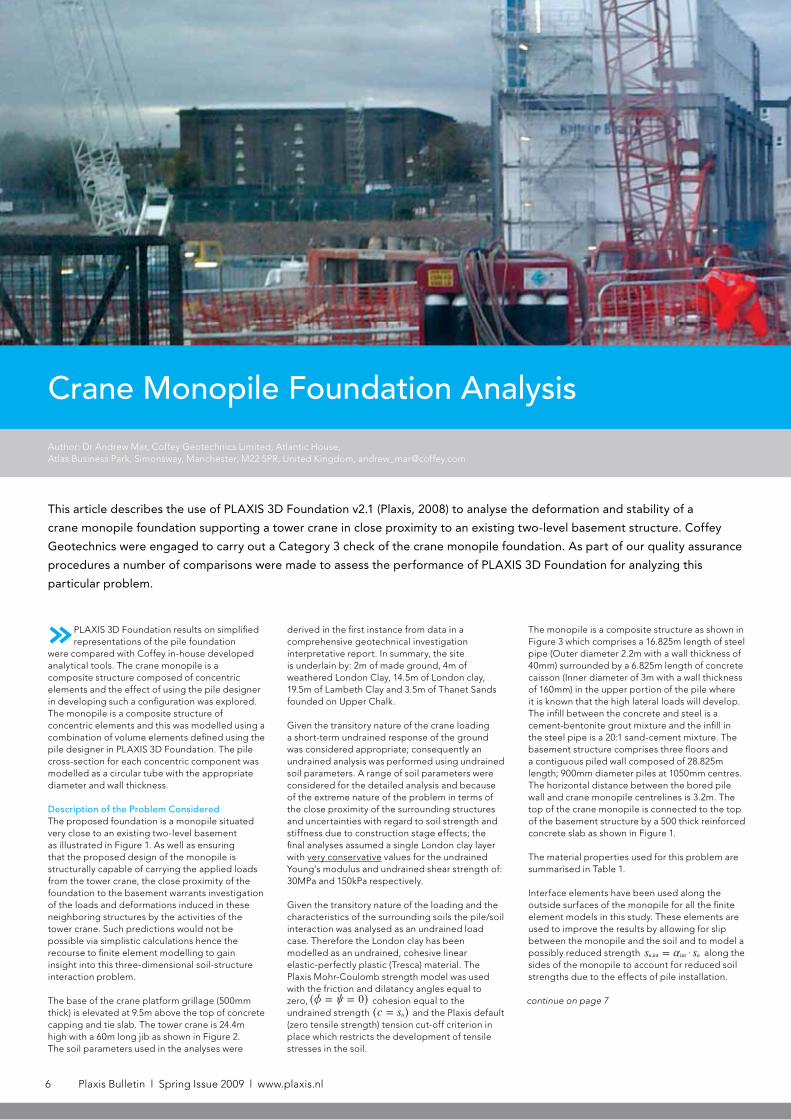
This article describes the use of PLAXIS 3D Foundation v2.1 (Plaxis, 2008) to analyse the deformation and stability of a
crane monopile foundation supporting a tower crane in close proximity to an existing two-level basement structure. Coffey
Geotechnics were engaged to carry out a Category 3 check of the crane monopile foundation. As part of our quality assurance
procedures a number of comparisons were made to assess the performance of PLAXIS 3D Foundation for analyzing this
particular problem.
Author: Dr Andrew Mar, Coffey Geotechnics Limited, Atlantic House, Atlas Business Park, Simonsway, Manchester, M22 5PR, United Kingdom, [email protected]
continue on page 7
www.plaxis.nl l Spring Issue 2009 l Plaxis Bulletin 7
Preliminary Analyses ERCAP AnalysesThe monopile was first analysed using the boundary element program ERCAP. The program implements the method described by Poulos & Davis (1980). This program can analyse a pile subjected to lateral loading and/or lateral soil movements. ERCAP (Earth Retention CAPacity of piles) can analyse the effects of the proximity of a pile to a slope or cutting in an approximate manner. It has the facility to enable the assessment of the stabilising force which a pile or row of piles can develop in a potentially unstable soil mass. In this problem it was used to model the lateral interaction of the monopile with the surrounding soil when subjected to the horizontal load and overturning moment at the pile head. The objective of the preliminary analyses was to compare results from Plaxis 3D Foundation with ERCAP. The ERCAP program restricts the user to a single uniform pile geometry. For this reason, two separate analyses were performed with uniform cross-sectional representations of the actual crane monopile. To bound the predictions of lateral pile deflection in the London clay; the performance of the steel pipe alone and the composite pile were considered. The first analysis modelled the steel tubular section whereas the second analysis modelled the composite pile; each over the full 16.825m length of pile. For the latter, a composite Young’s modulus of 12.4GPa for a solid circular pile of 3.32m diameter was calculated on the basis of
/EI IR R (see Table 2).
Both the in-service and out-of-service crane loads were considered (Table 3) to identify the worst case combination which would develop the highest deflections, shear forces and bending moments in the monopile. This was for the situation without any horizontal restraint offered by the tie-slab.
Both the in-service and out-of-service load cases were performed undrained and this is applicable Figure 2: Schematic of the Tower Crane Structure
Figure 1: Cross-section and plan showing the crane monopile and adjacent basement structure
8 Plaxis Bulletin l Spring Issue 2009 l www.plaxis.nl
Plaxis Practice: Crane Monopile Foundation Analysis
as the key stratum is London clay with an average coefficient of consolidation of 0.3m2/year. For drainage paths, , in the range of 5.5 to 30m and an out-of-service time, t, of 1 year say, the dimensionless time factor is less than 0.01 and Duncan(1996) has suggested that the soil can then be considered to behave in an undrained manner under the loading specified.
With reference to Figure 1, it can be seen that the crane grillage soffit level is elevated at 9.5m above the top of concrete and tie slab. Thus for a 1m thick crane platform grillage the lever arm will be 10m - inducing an additional bending moment equal to the horizontal crane load multiplied by this lever arm. For the in-service crane loads this produces an overturning moment of 6642kNm at the top of concrete capping and tie slab.
Graphs 1 and 2 show the ERCAP predictions of pile deflection in the London clay for the steel tube alone and composite pile respectively under the action of the in-service and out-of-service load conditions. It can be seen that the in-service loads produce slightly higher horizontal pile head displacement. From the deflected pile shapes it can be seen that the composite pile is behaving more like a short rigid pile than the steel tube alone. The actual crane monopile is a combination of these two simplifications and so it is expected that the deflections will fall within the range of deflection predictions shown for this extreme case without a tie-slab in place.
Graphs 3 and 4 show the ERCAP predictions of bending moment and shear force developed in the pile for these two load conditions. It can be seen that the in-service loads induce higher bending moments and shear forces in the pile.
PLAXIS 3D Foundation AnalysesThe three-dimensional analyses considered two idealisations of the pile: (1) a ‘simplified composite pile’ consisting of a solid circular pile with a: Young’s modulus of 12.4GPa, diameter of 3.32m and length of 16.825m (as used in the ERCAP analyses) and (2) a ‘complex composite pile’ comprising individual concentric elements as summarised in Table 2 (see the next paragraph for further details on modelling). The horizontal deflections, bending moments and shear force predictions are broadly similar as shown in Graphs 5-7 thus confirming the idealisation approaches and different analysis methodologies used.
Modelling of the Complex Composite PileThe series of concentric elements (Figure 3) forming the crane monopile were explicitly modelled in PLAXIS 3D Foundation using the pile designer. This was achieved by selecting the circular tube pile type which is defined by its wall thickness and internal diameter. Tubular piles were specified for the concrete caisson, cement-bentonite grout and steel pipe and each of these components were centred on plan at the same x,z^ hcoordinate. This created a mesh of solid elements with full connection at the mating boundaries between each concentric component. Through the pile designer, interface elements were specified along the outside boundaries of the monopile to allow for the simulation of slippage and separation between the soil and monopile. The use of the pile designer creates an equivalent structural line element along the centreline of the pile which enables the pile:
cv
/T c t Dv2
=^ h
displacements, bending moments and shear forces to be output in a convenient manner. This was performed for every workplane defined in the model. Workplanes are the horizontal planes
Outer diameter
(m)
Inner diameter
(m)
UCS(MPa)
Young’s modulus
(kPa)
Second Moment of Area l (m4)
Flexural RigidityEl (kNm2))
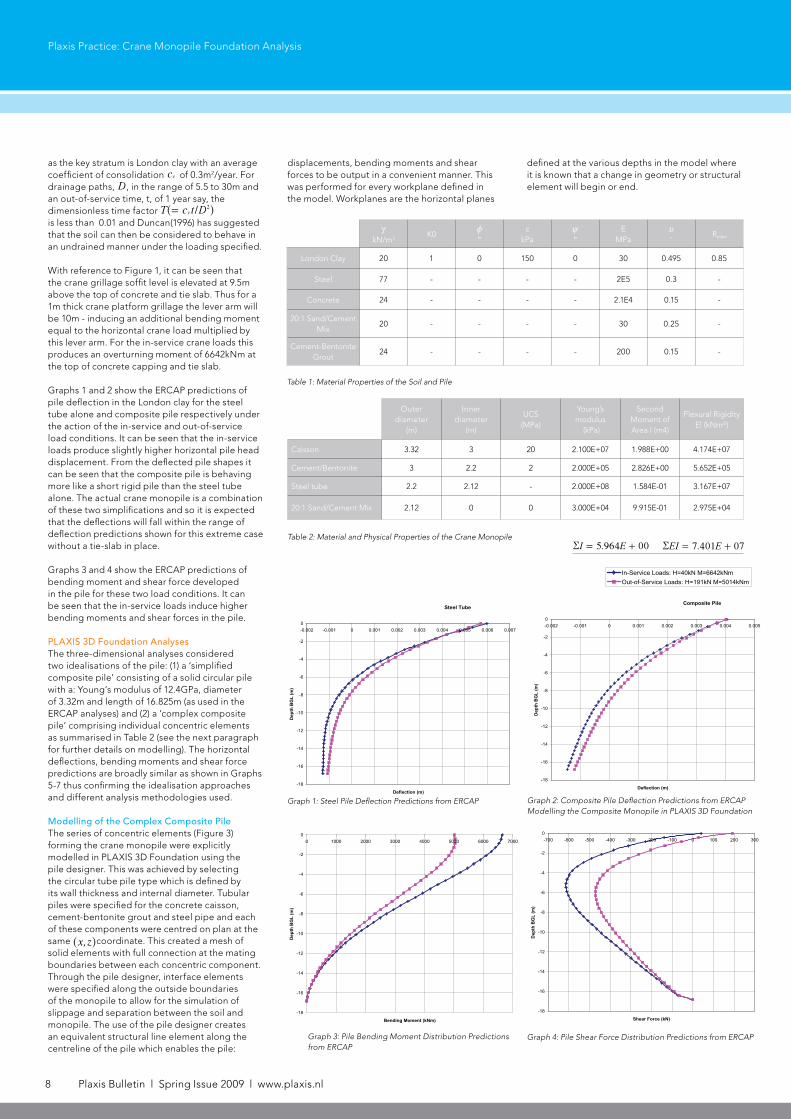
Caisson 3.32 3 20 2.100E+07 1.988E+00 4.174E+07
Cement/Bentonite 3 2.2 2 2.000E+05 2.826E+00 5.652E+05
Steel tube 2.2 2.12 - 2.000E+08 1.584E-01 3.167E+07
20:1 Sand/Cement Mix 2.12 0 0 3.000E+04 9.915E-01 2.975E+04
Table 2: Material and Physical Properties of the Crane Monopile
defined at the various depths in the model where it is known that a change in geometry or structural element will begin or end.
Steel Tube
-18
-16
-14
-12
-10
-8
-6
-4
-2
0-0.002 -0.001 0 0.001 0.002 0.003 0.004 0.005 0.006 0.007
Deflection (m)
Dep
th B
GL
(m)
In-Service Loads: H=40kN M=6642kNmOut-of-Service Loads: H=191kN, M=5014kNm
-18
-16
-14
-12
-10
-8
-6
-4
-2
00 1000 2000 3000 4000 5000 6000 7000
Bending Moment (kNm)
Dep
th B
GL
(m)
In-Service Loads: H=40kN M=6642kNmOut-of-Service Loads: H=191kN M=5014kNm
-18
-16
-14
-12
-10
-8
-6
-4
-2
00 1000 2000 3000 4000 5000 6000 7000
Bending Moment (kNm)
Dep
th B
GL
(m)
In-Service Loads: H=40kN M=6642kNmOut-of-Service Loads: H=191kN M=5014kNm
Composite Pile
-18
-16
-14
-12
-10
-8
-6
-4
-2
0-0.002 -0.001 0 0.001 0.002 0.003 0.004 0.005
Deflection (m)
Dep
th B
GL
(m)
In-Service Loads: H=40kN M=6642kNmOut-of-Service Loads: H=191kN, M=5014kNm
-18
-16
-14
-12
-10
-8
-6
-4
-2
0-700 -600 -500 -400 -300 -200 -100 0 100 200 300
Shear Force (kN)
Dep
th B
GL
(m)
In-Service Loads: H=40kN M=6642kNmOut-of-Service Loads: H=191kN M=5014kNm
Graph 1: Steel Pile Deflection Predictions from ERCAP Graph 2: Composite Pile Deflection Predictions from ERCAPModelling the Composite Monopile in PLAXIS 3D Foundation
Graph 3: Pile Bending Moment Distribution Predictions from ERCAP
Graph 4: Pile Shear Force Distribution Predictions from ERCAP
D
ckN/m3
K0zo
ckPa
}o
EMPa
y- Rinter
London Clay 20 1 0 150 0 30 0.495 0.85
Steel 77 - - - - 2E5 0.3 -
Concrete 24 - - - - 2.1E4 0.15 -
20:1 Sand/Cement Mix
20 - - - - 30 0.25 -
Cement-Bentonite Grout
24 - - - - 200 0.15 -
Table 1: Material Properties of the Soil and Pile
5.964 00I E= +R 7.401 07EI E= +R
www.plaxis.nl l Spring Issue 2009 l Plaxis Bulletin 9
Plaxis Practice: Crane Monopile Foundation Analysis
Where d is the diameter of the pile and s is the centre-to-centre pile spacing.The soil and monopile were modelled using 15-noded wedge elements. The horizontal, vertical and moment loads applied to the monopile were rationalised into equivalent horizontal and vertical pressures acting over the steel pipe cross-section. Interface elements were inserted between the soil, walls, floors and outside surfaces of the monopile to simulate the reduced strength between the soil and these structures. For these analyses an interface reduction factor of 0.85 was assumed, resulting in a reduced undrained shear strength of 127.5kPa between the soil and non-soil structures.
Four 3D finite element analyses were undertaken to model the excavation and ‘wished-in-place’ construction of the basement and the subsequent monopile with loading based on the tower crane load specifications. The soil-structure interaction between the monopile, walls and floors was simulated in these analyses. These analyses considered the in-service load combination and the results confirmed that the worst case corresponded to case 2 of Table 6.
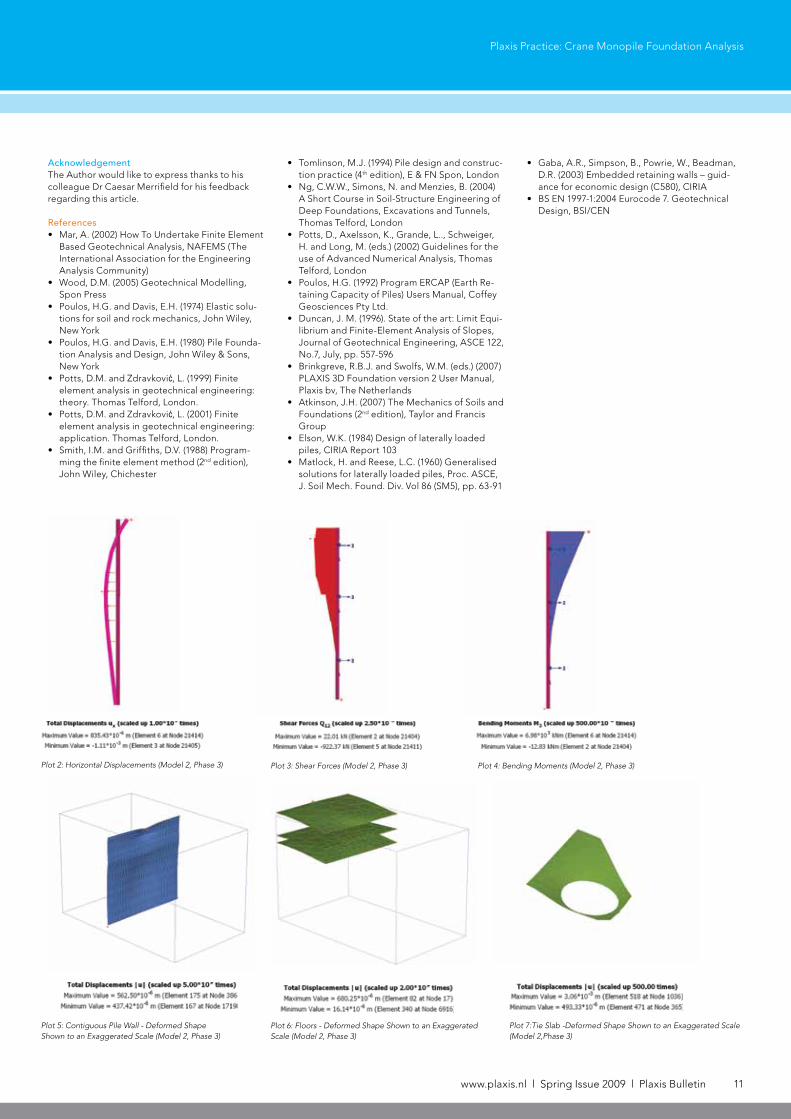
ResultsThis section summarises a selection of results from the PLAXIS 3D Foundation analyses.
Plot 1 shows the deformed shape for Model 2 (Table 6) Phase 3 (Table 4) – note that the partial geometry feature has been used to hide the London clay.
Plot 2 shows the horizontal deflection of the crane monopile and this was obtained by double-clicking the structural line element representation of the pile. The shear force and bending moments developed in the pile were obtained in a similar manner and these are shown in Plots 3 & 4. These plots are direct outputs from PLAXIS 3D Foundation with no additional post-processing made.
The resolution of the shear force diagram is a result of the relatively coarse mesh being used. However, independent checks described in paragraph “PLAXIS 3D Foundation” on similar mesh refinements of the simplified pile provide confidence in the accuracy of these results.
The deformation pattern of the contiguous pile wall is shown in Plot 5. This is to an exaggerated scale of 5000x to make the deformations visible. Predicted deformations are very small with a peak total displacement of around 0.6mm.
The deformed shape of the floors is shown in Plot 6 – again shown to an exaggerated scale (2000x). Predicted deformations are very small with a peak total displacement of around 0.7mm.
The deformed shape of the tie-slab is shown in Plot 7 to an exaggerated scale of 500x. A peak total deformation of 3mm is predicted to develop at the leading edge of the tie-slab.
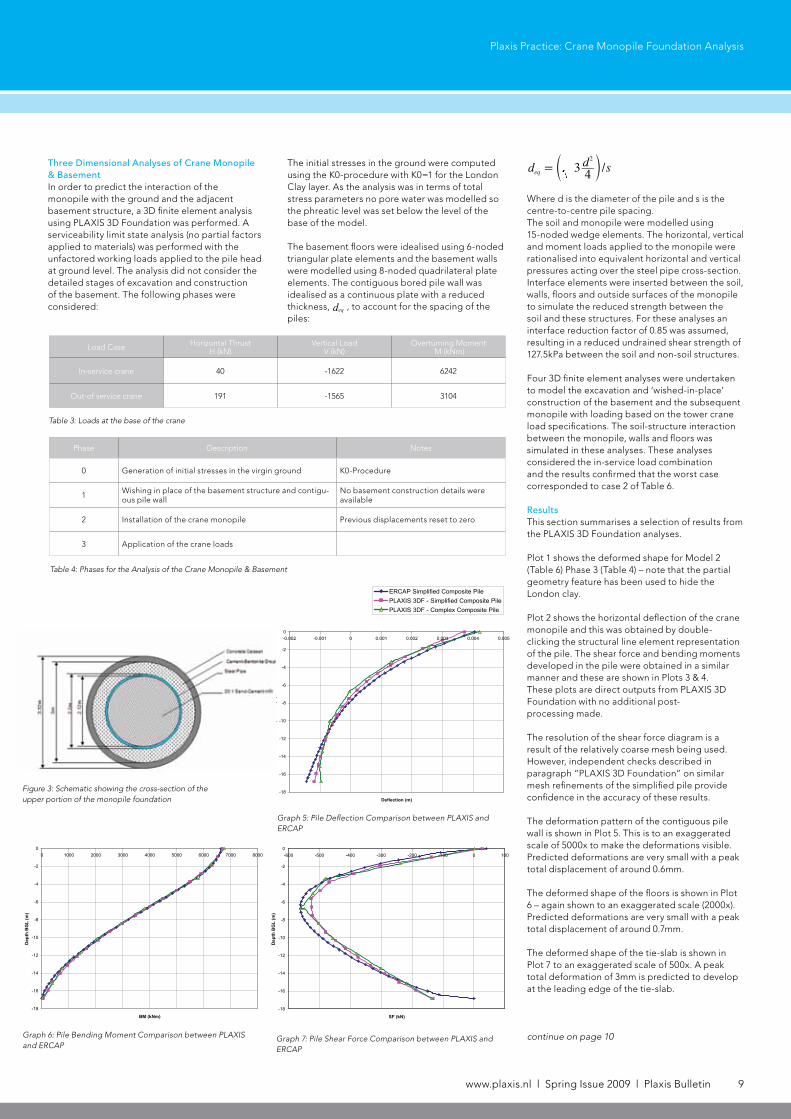
Three Dimensional Analyses of Crane Monopile & BasementIn order to predict the interaction of the monopile with the ground and the adjacent basement structure, a 3D finite element analysis using PLAXIS 3D Foundation was performed. A serviceability limit state analysis (no partial factors applied to materials) was performed with the unfactored working loads applied to the pile head at ground level. The analysis did not consider the detailed stages of excavation and construction of the basement. The following phases were considered:
The initial stresses in the ground were computed using the K0-procedure with K0=1 for the London Clay layer. As the analysis was in terms of total stress parameters no pore water was modelled so the phreatic level was set below the level of the base of the model.
The basement floors were idealised using 6-noded triangular plate elements and the basement walls were modelled using 8-noded quadrilateral plate elements. The contiguous bored pile wall was idealised as a continuous plate with a reduced thickness, deq , to account for the spacing of the piles:
/d d s34eq
2
= d n
Load Case Horizontal Thrust H (kN)
Vertical Load V (kN)
Overturning Moment M (kNm)
In-service crane 40 -1622 6242
Out-of service crane 191 -1565 3104
Table 3: Loads at the base of the crane
In-Service Loads: H=40kN M=6642kNm
-18
-16
-14
-12
-10
-8
-6
-4
-2
0-0.002 -0.001 0 0.001 0.002 0.003 0.004 0.005
Deflection (m)
Dep
th B
GL
(m)
ERCAP Simplified Composite PilePLAXIS 3DF - Simplified Composite PilePLAXIS 3DF - Complex Composite Pile In-Service Loads: H=40kN M=6642kNm
-18
-16
-14
-12
-10
-8
-6
-4
-2
0-0.002 -0.001 0 0.001 0.002 0.003 0.004 0.005
Deflection (m)
Dep
th B
GL
(m)
ERCAP Simplified Composite PilePLAXIS 3DF - Simplified Composite PilePLAXIS 3DF - Complex Composite Pile
Graph 5: Pile Deflection Comparison between PLAXIS and ERCAP
Graph 7: Pile Shear Force Comparison between PLAXIS and ERCAP
In-Service Loads: H=40kN M=6642kNm
-18
-16
-14
-12
-10
-8
-6
-4
-2
0-600 -500 -400 -300 -200 -100 0 100
SF (kN)
Dep
th B
GL
(m)
ERCAP Simplified Composite PilePLAXIS 3DF - Simplified Composite PileComplex Composite Pile
In-Service Loads: H=40kN M=6642kNm
-18
-16
-14
-12
-10
-8
-6
-4
-2
00 1000 2000 3000 4000 5000 6000 7000 8000
BM (kNm)
Dep
th B
GL
(m)
ERCAP Simplified Composite PilePLAXIS 3DF - Simplified Composite PilePLAXIS 3DF - Complex Composite Pile
Graph 6: Pile Bending Moment Comparison between PLAXIS and ERCAP
Table 4: Phases for the Analysis of the Crane Monopile & Basement
Phase Description Notes
0 Generation of initial stresses in the virgin ground K0-Procedure
1 Wishing in place of the basement structure and contigu-ous pile wall
No basement construction details were available
2 Installation of the crane monopile Previous displacements reset to zero
3 Application of the crane loads
continue on page 10
Figure 3: Schematic showing the cross-section of the upper portion of the monopile foundation
10 Plaxis Bulletin l Spring Issue 2009 l www.plaxis.nl
Plaxis Practice: Crane Monopile Foundation Analysis
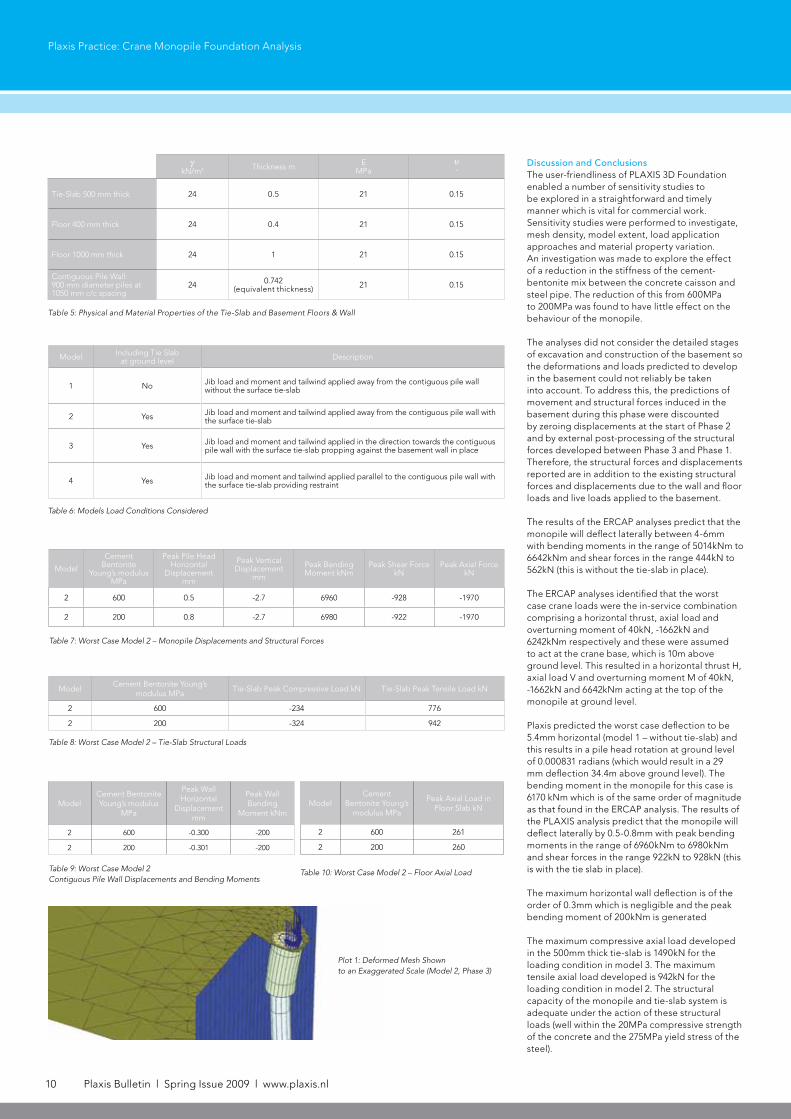
Discussion and ConclusionsThe user-friendliness of PLAXIS 3D Foundation enabled a number of sensitivity studies to be explored in a straightforward and timely manner which is vital for commercial work. Sensitivity studies were performed to investigate, mesh density, model extent, load application approaches and material property variation. An investigation was made to explore the effect of a reduction in the stiffness of the cement-bentonite mix between the concrete caisson and steel pipe. The reduction of this from 600MPa to 200MPa was found to have little effect on the behaviour of the monopile.
The analyses did not consider the detailed stages of excavation and construction of the basement so the deformations and loads predicted to develop in the basement could not reliably be taken into account. To address this, the predictions of movement and structural forces induced in the basement during this phase were discounted by zeroing displacements at the start of Phase 2 and by external post-processing of the structural forces developed between Phase 3 and Phase 1. Therefore, the structural forces and displacements reported are in addition to the existing structural forces and displacements due to the wall and floor loads and live loads applied to the basement.
The results of the ERCAP analyses predict that the monopile will deflect laterally between 4-6mm with bending moments in the range of 5014kNm to 6642kNm and shear forces in the range 444kN to 562kN (this is without the tie-slab in place). The ERCAP analyses identified that the worst case crane loads were the in-service combination comprising a horizontal thrust, axial load and overturning moment of 40kN, -1662kN and 6242kNm respectively and these were assumed to act at the crane base, which is 10m above ground level. This resulted in a horizontal thrust H, axial load V and overturning moment M of 40kN, -1662kN and 6642kNm acting at the top of the monopile at ground level.
Plaxis predicted the worst case deflection to be 5.4mm horizontal (model 1 – without tie-slab) and this results in a pile head rotation at ground level of 0.000831 radians (which would result in a 29 mm deflection 34.4m above ground level). The bending moment in the monopile for this case is 6170 kNm which is of the same order of magnitude as that found in the ERCAP analysis. The results of the PLAXIS analysis predict that the monopile will deflect laterally by 0.5-0.8mm with peak bending moments in the range of 6960kNm to 6980kNm and shear forces in the range 922kN to 928kN (this is with the tie slab in place).
The maximum horizontal wall deflection is of the order of 0.3mm which is negligible and the peak bending moment of 200kNm is generated
The maximum compressive axial load developed in the 500mm thick tie-slab is 1490kN for the loading condition in model 3. The maximum tensile axial load developed is 942kN for the loading condition in model 2. The structural capacity of the monopile and tie-slab system is adequate under the action of these structural loads (well within the 20MPa compressive strength of the concrete and the 275MPa yield stress of the steel).
Model Including Tie Slab at ground level Description
1 No Jib load and moment and tailwind applied away from the contiguous pile wall without the surface tie-slab
2 Yes Jib load and moment and tailwind applied away from the contiguous pile wall with the surface tie-slab
3 Yes Jib load and moment and tailwind applied in the direction towards the contiguous pile wall with the surface tie-slab propping against the basement wall in place
4 Yes Jib load and moment and tailwind applied parallel to the contiguous pile wall with the surface tie-slab providing restraint
Table 6: Models Load Conditions Considered
ckN/m3 Thickness m E
MPay-
Tie-Slab 500 mm thick 24 0.5 21 0.15
Floor 400 mm thick 24 0.4 21 0.15
Floor 1000 mm thick 24 1 21 0.15
Contiguous Pile Wall:900 mm diameter piles at 1050 mm c/c spacing
24 0.742 (equivalent thickness) 21 0.15
Table 5: Physical and Material Properties of the Tie-Slab and Basement Floors & Wall
Model
Cement Bentonite
Young’s modulus MPa
Peak Pile Head Horizontal
Displacement mm
Peak Vertical Displacement
mm
Peak Bending Moment kNm
Peak Shear Force kN
Peak Axial Force kN
2 600 0.5 -2.7 6960 -928 -1970
2 200 0.8 -2.7 6980 -922 -1970
Table 7: Worst Case Model 2 – Monopile Displacements and Structural Forces
ModelCement Bentonite Young’s
modulus MPaTie-Slab Peak Compressive Load kN Tie-Slab Peak Tensile Load kN
2 600 -234 776
2 200 -324 942
Table 8: Worst Case Model 2 – Tie-Slab Structural Loads
ModelCement Bentonite Young’s modulus
MPa
Peak Wall Horizontal
Displacement mm
Peak Wall Bending
Moment kNm
2 600 -0.300 -200
2 200 -0.301 -200
Table 9: Worst Case Model 2 Contiguous Pile Wall Displacements and Bending Moments
Table 10: Worst Case Model 2 – Floor Axial Load
ModelCement
Bentonite Young’s modulus MPa
Peak Axial Load in Floor Slab kN
2 600 261
2 200 260
Plot 1: Deformed Mesh Shown to an Exaggerated Scale (Model 2, Phase 3)
www.plaxis.nl l Spring Issue 2009 l Plaxis Bulletin 11
Plaxis Practice: Crane Monopile Foundation Analysis
AcknowledgementThe Author would like to express thanks to his colleague Dr Caesar Merrifield for his feedback regarding this article.
References• Mar, A. (2002) How To Undertake Finite Element
Based Geotechnical Analysis, NAFEMS (The International Association for the Engineering Analysis Community)
• Wood, D.M. (2005) Geotechnical Modelling, Spon Press
• Poulos, H.G. and Davis, E.H. (1974) Elastic solu-tions for soil and rock mechanics, John Wiley, New York
• Poulos, H.G. and Davis, E.H. (1980) Pile Founda-tion Analysis and Design, John Wiley & Sons, New York
• Potts, D.M. and Zdravković, L. (1999) Finite element analysis in geotechnical engineering: theory. Thomas Telford, London.
• Potts, D.M. and Zdravković, L. (2001) Finite element analysis in geotechnical engineering: application. Thomas Telford, London.
• Smith, I.M. and Griffiths, D.V. (1988) Program-ming the finite element method (2nd edition), John Wiley, Chichester
• Tomlinson, M.J. (1994) Pile design and construc-tion practice (4th edition), E & FN Spon, London
• Ng, C.W.W., Simons, N. and Menzies, B. (2004) A Short Course in Soil-Structure Engineering of Deep Foundations, Excavations and Tunnels, Thomas Telford, London
• Potts, D., Axelsson, K., Grande, L.., Schweiger, H. and Long, M. (eds.) (2002) Guidelines for the use of Advanced Numerical Analysis, Thomas Telford, London
• Poulos, H.G. (1992) Program ERCAP (Earth Re-taining Capacity of Piles) Users Manual, Coffey Geosciences Pty Ltd.
• Duncan, J. M. (1996). State of the art: Limit Equi-librium and Finite-Element Analysis of Slopes, Journal of Geotechnical Engineering, ASCE 122, No.7, July, pp. 557-596
• Brinkgreve, R.B.J. and Swolfs, W.M. (eds.) (2007) PLAXIS 3D Foundation version 2 User Manual, Plaxis bv, The Netherlands
• Atkinson, J.H. (2007) The Mechanics of Soils and Foundations (2nd edition), Taylor and Francis Group
• Elson, W.K. (1984) Design of laterally loaded piles, CIRIA Report 103
• Matlock, H. and Reese, L.C. (1960) Generalised solutions for laterally loaded piles, Proc. ASCE, J. Soil Mech. Found. Div. Vol 86 (SM5), pp. 63-91
• Gaba, A.R., Simpson, B., Powrie, W., Beadman, D.R. (2003) Embedded retaining walls – guid-ance for economic design (C580), CIRIA
• BS EN 1997-1:2004 Eurocode 7. Geotechnical Design, BSI/CEN
Plot 2: Horizontal Displacements (Model 2, Phase 3) Plot 3: Shear Forces (Model 2, Phase 3)
Plot 6: Floors - Deformed Shape Shown to an Exaggerated Scale (Model 2, Phase 3)
Plot 4: Bending Moments (Model 2, Phase 3)
Plot 5: Contiguous Pile Wall - Deformed ShapeShown to an Exaggerated Scale (Model 2, Phase 3)
Plot 7:Tie Slab -Deformed Shape Shown to an Exaggerated Scale (Model 2,Phase 3)
12 Plaxis Bulletin l Spring Issue 2009 l www.plaxis.nl
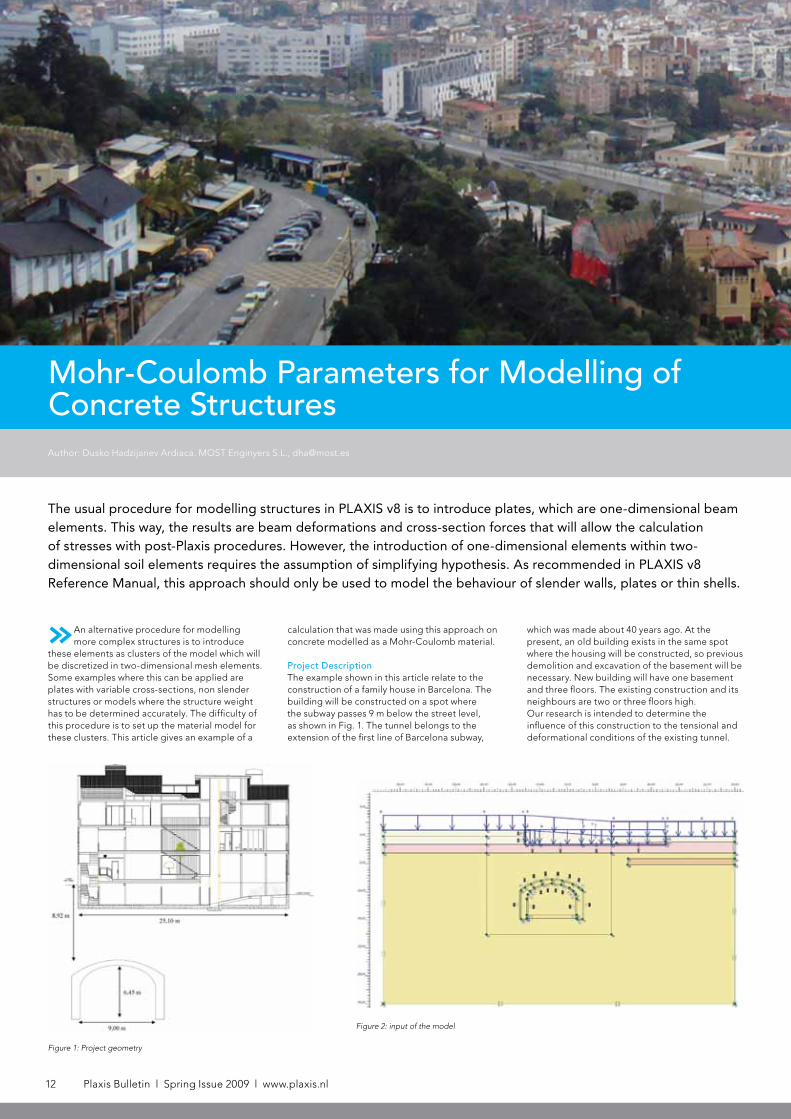
»An alternative procedure for modelling more complex structures is to introduce
these elements as clusters of the model which will be discretized in two-dimensional mesh elements. Some examples where this can be applied are plates with variable cross-sections, non slender structures or models where the structure weight has to be determined accurately. The difficulty of this procedure is to set up the material model for these clusters. This article gives an example of a
calculation that was made using this approach on concrete modelled as a Mohr-Coulomb material.
Project DescriptionThe example shown in this article relate to the construction of a family house in Barcelona. The building will be constructed on a spot where the subway passes 9 m below the street level, as shown in Fig. 1. The tunnel belongs to the extension of the first line of Barcelona subway,
which was made about 40 years ago. At the present, an old building exists in the same spot where the housing will be constructed, so previous demolition and excavation of the basement will be necessary. New building will have one basement and three floors. The existing construction and its neighbours are two or three floors high.Our research is intended to determine the influence of this construction to the tensional and deformational conditions of the existing tunnel.
The usual procedure for modelling structures in PLAXIS v8 is to introduce plates, which are one-dimensional beam elements. This way, the results are beam deformations and cross-section forces that will allow the calculation of stresses with post-Plaxis procedures. However, the introduction of one-dimensional elements within two-dimensional soil elements requires the assumption of simplifying hypothesis. As recommended in PLAXIS v8 Reference Manual, this approach should only be used to model the behaviour of slender walls, plates or thin shells.
Mohr-Coulomb Parameters for Modelling of Concrete Structures
Figure 1: Project geometry
Figure 2: input of the model
Author: Dusko Hadzijanev Ardiaca. MOST Enginyers S.L., [email protected]

www.plaxis.nl l Spring Issue 2009 l Plaxis Bulletin 13
FE AnalysisThe stresses and displacements in the tunnel have been calculated before the construction of the housing, during the excavation and at the final situation. The calculations were performed using PLAXIS v8 with about 1200 15-noded elements. Input of the model is showed in Figure 2.The main calculations phases are described below:
1. Construction of the tunnel. Because of the existing buildings above the tunnel, this could not be done in open-cut procedure.
2. Current situation. Uniformly distributed loads of 20 kN/m2 have been considered to take in account the weight of the existing constructions and road traffic.
3. Excavation of the parking floor and execution of the foundation slab, as retaining walls. Loads of 20 kN/m2 are applied.
4. Construction of the building. It’s considered as a uniformly distributed load of 40 kN/m2.
Soil PropertiesTwo sets of calculations were made using two different material models on soils: the Mohr-Coulomb model and the Hardening Soil model. The soil parameters are summarized in Tables 1 and 2: Regarding the presence of water, no phreatic levels were detected during ground testing and had not been considered in calculations.
Concrete ParametersThe existing tunnel was built about 1970. According to the project’s history, the structure does not have a tunnel invert and the vault is constituted by mass concrete.
The concrete of the tunnel was characterized having elastoplastic behaviour using the Mohr-Coulomb drained material model.
Even if previous laboratory tests revealed that the mass concrete is considerably strong, the choice of the elastic parameters ( Eand y) and strength parameters (c, z, and tensile strength) of the Figure 3: Deduction of Mohr-Coulomb plasticity parameters
Average depth
[m]
c[kN/m3]
E[kN/m2]
y[-]
c[kN/m2]
{[o]
}[o]
Fill 1.0 17.00 6000 0.30 0.10 22 0
Fine sand 2.1 19.00 8000 0.30 0.10 34 0
Silt 4.5 19.00 8000 0.30 5.00 29 0
Gravel and sand 12.5 20.00 40000 0.30 0.10 34 0
Table 1: Mohr-Coulomb soil parameters
c[kN/m3]
c[kN/m2]
{[o]
}[o]
E50ref
[kN/m2]Eoed
ref
[kN/m2]Eur
ref
[kN/m2]m[-]
yur
[-]pref
[kN/m2]Rf
Fill 17.00 0.10 22 0 25912 25912 77737 0.60 0.20 100 0.90
Fine sand 19.00 0.10 34 0 23268 23268 69804 0.60 0.20 100 0.90
Silt 19.00 5.00 29 0 13242 13242 39726 0.70 0.20 100 0.90
Gravel and sand 20.00 0.10 34 0 42597 42597 127791 0.50 0.20 100 0.90
Table 2: Hardening-Soil model soil parameters
concrete has been carried out considering several hypotheses in a conservative way.
In this sense, two hypotheses concerning the quality of the concrete were considered, given by the characteristic compressive strength: fck = 15 MPa and fck = 25 Mpa, from now on “HM-15” and “HM-25”.
The elastic modulus E was determined through the formula proposed by the Spanish regulation EHE-98. According of this, the longitudinal deformation modulus relates to the compressive strength as follows:
8500 8f pa3ck$= +E L6 @
Two values of Poisson’s ratio were considered: a value y= 0.2 according to EHE-98 and a value of y= 0.0 according to Eurocode-2 Recommendation for fissured concrete.
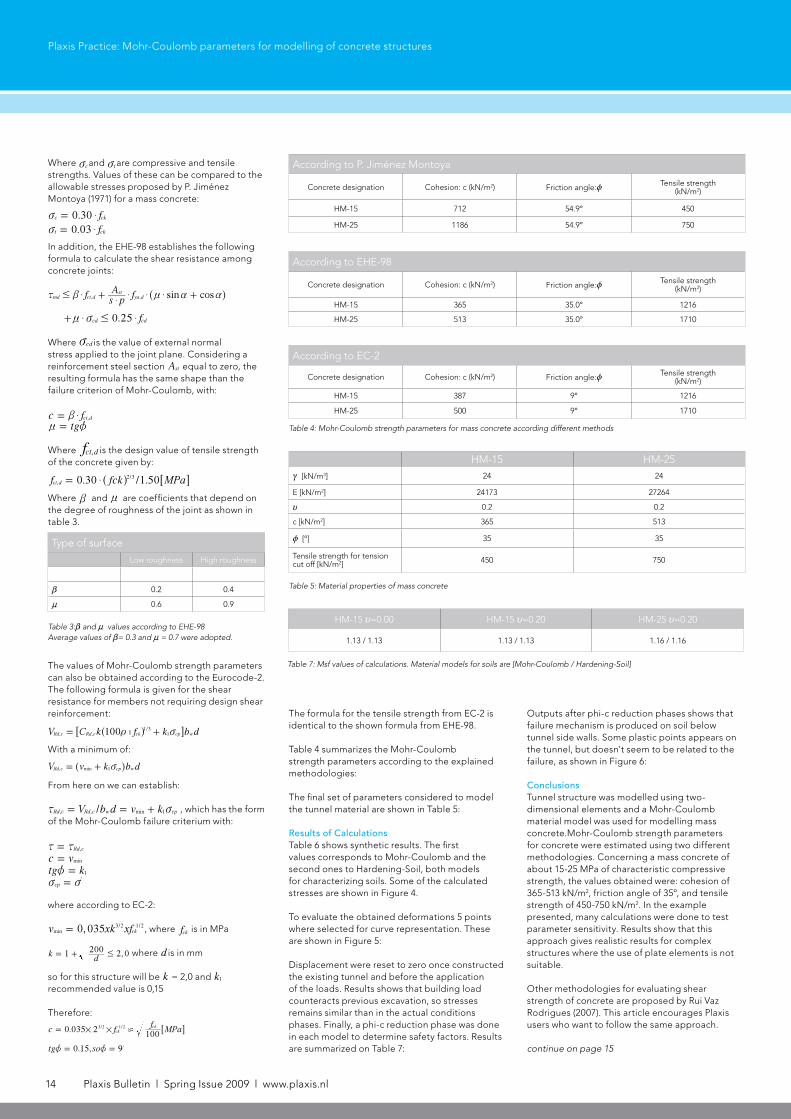
Regarding the plasticity parameters of Mohr-Coulomb model, these can be obtained from compressive and tensile strengths according to the representation of the yield surface as shown in Figure 3:
14 Plaxis Bulletin l Spring Issue 2009 l www.plaxis.nl
Plaxis Practice: Mohr-Coulomb parameters for modelling of concrete structures
The formula for the tensile strength from EC-2 is identical to the shown formula from EHE-98.
Table 4 summarizes the Mohr-Coulomb strength parameters according to the explained methodologies:
The final set of parameters considered to model the tunnel material are shown in Table 5:
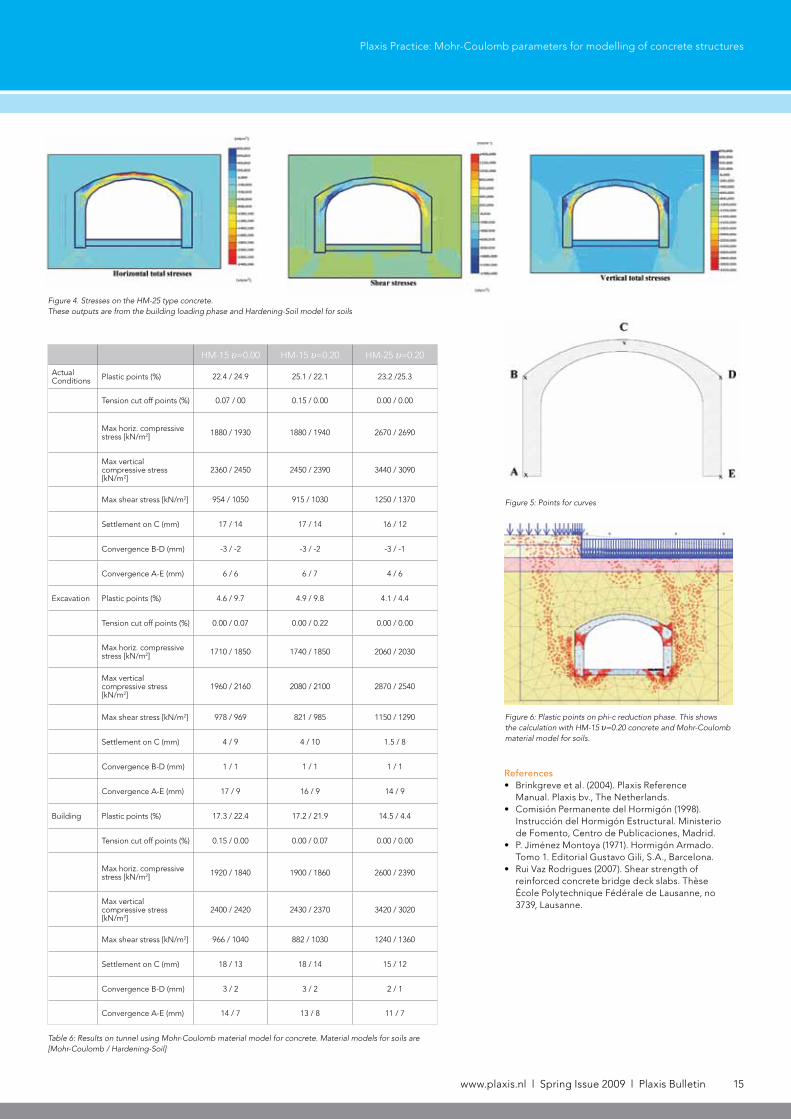
Results of CalculationsTable 6 shows synthetic results. The first values corresponds to Mohr-Coulomb and the second ones to Hardening-Soil, both models for characterizing soils. Some of the calculated stresses are shown in Figure 4.
To evaluate the obtained deformations 5 points where selected for curve representation. These are shown in Figure 5:
Displacement were reset to zero once constructed the existing tunnel and before the application of the loads. Results shows that building load counteracts previous excavation, so stresses remains similar than in the actual conditions phases. Finally, a phi-c reduction phase was done in each model to determine safety factors. Results are summarized on Table 7:
According to P. Jiménez Montoya
Concrete designation Cohesion: c (kN/m2) Friction angle:z Tensile strength(kN/m2)
HM-15 712 54.9° 450
HM-25 1186 54.9° 750
According to EHE-98
Concrete designation Cohesion: c (kN/m2) Friction angle:z Tensile strength(kN/m2)
HM-15 365 35.0° 1216
HM-25 513 35.0° 1710
Table 4: Mohr-Coulomb strength parameters for mass concrete according different methods
According to EC-2
Concrete designation Cohesion: c (kN/m2) Friction angle:z Tensile strength(kN/m2)
HM-15 387 9° 1216
HM-25 500 9° 1710
HM-15 HM-25
c [kN/m3] 24 24
E [kN/m2] 24173 27264
y 0.2 0.2
c [kN/m2] 365 513
z [o] 35 35
Tensile strength for tension cut off [kN/m2] 450 750
Table 5: Material properties of mass concrete
Where cv and tv are compressive and tensile strengths. Values of these can be compared to the allowable stresses proposed by P. Jiménez Montoya (1971) for a mass concrete:
In addition, the EHE-98 establishes the following formula to calculate the shear resistance among concrete joints:
Where cdv is the value of external normal stress applied to the joint plane. Considering a reinforcement steel section Ast equal to zero, the resulting formula has the same shape than the failure criterion of Mohr-Coulomb, with:
c f ,ct d$b=tgn z=
Where f ,ct d is the design value of tensile strength of the concrete given by:
. / .f fck MPa0 30 1 50,/
ct d2 3$= ^ h 6 @
Where b and n are coefficients that depend on the degree of roughness of the joint as shown intable 3.
Table 3:b and n values according to EHE-98Average values of b= 0.3 and n = 0.7 were adopted.
Type of surface
Low roughness High roughness
b 0.2 0.4
n 0.6 0.9
The values of Mohr-Coulomb strength parameters can also be obtained according to the Eurocode-2. The following formula is given for the shear resistance for members not requiring design shear reinforcement:
V C k f k b d100, ,/
Rd c Rd c ck cp w1 3
1y= +t v^ h6 @With a minimum of:
V v k b d, minRd c cp w1= + v^ h
From here on we can establish:
/V b d v k, , minRd c Rd c w cp1x v= = + , which has the form of the Mohr-Coulomb failure criterium with:
,Rd cx x=c vmin=tg k1z =
'cp =v v
where according to EC-2:
0,035v xk xf/ /min ck
3 2 1 2= , where fck is in MPa
1 2,0kd
200 #= + where d is in mm
so for this structure will be k = 2,0 and k1
recommended value is 0,15
Therefore:
0.035 2c ff
MPa100
/ /ck
ck3 2 1 2# # c= 6 @
0.15, 9tg so= =z z %
. f0 30c ck$v =
. f0 03t ck$v =
Outputs after phi-c reduction phases shows that failure mechanism is produced on soil below tunnel side walls. Some plastic points appears on the tunnel, but doesn’t seem to be related to the failure, as shown in Figure 6:
ConclusionsTunnel structure was modelled using two-dimensional elements and a Mohr-Coulomb material model was used for modelling mass concrete.Mohr-Coulomb strength parameters for concrete were estimated using two different methodologies. Concerning a mass concrete of about 15-25 MPa of characteristic compressive strength, the values obtained were: cohesion of 365-513 kN/m2, friction angle of 35º, and tensile strength of 450-750 kN/m2. In the example presented, many calculations were done to test parameter sensitivity. Results show that this approach gives realistic results for complex structures where the use of plate elements is not suitable.
Other methodologies for evaluating shear strength of concrete are proposed by Rui Vaz Rodrigues (2007). This article encourages Plaxis users who want to follow the same approach.
continue on page 15
Table 7: Msf values of calculations. Material models for soils are [Mohr-Coulomb / Hardening-Soil]
HM-15 y=0.00 HM-15 y=0.20 HM-25 y=0.20
1.13 / 1.13 1.13 / 1.13 1.16 / 1.16
sin cosfs pA f, ,md ct d
stya d$
$$ $ $# + +x b n a a^ h
0.25 fcd cd$ $#+n v
www.plaxis.nl l Spring Issue 2009 l Plaxis Bulletin 15
Plaxis Practice: Mohr-Coulomb parameters for modelling of concrete structures
References• Brinkgreve et al. (2004). Plaxis Reference
Manual. Plaxis bv., The Netherlands.• Comisión Permanente del Hormigón (1998).
Instrucción del Hormigón Estructural. Ministerio de Fomento, Centro de Publicaciones, Madrid.
• P. Jiménez Montoya (1971). Hormigón Armado. Tomo 1. Editorial Gustavo Gili, S.A., Barcelona.
• Rui Vaz Rodrigues (2007). Shear strength of reinforced concrete bridge deck slabs. Thèse École Polytechnique Fédérale de Lausanne, no 3739, Lausanne.
HM-15 y=0.00 HM-15 y=0.20 HM-25 y=0.20
Actual Conditions Plastic points (%) 22.4 / 24.9 25.1 / 22.1 23.2 /25.3
Tension cut off points (%) 0.07 / 00 0.15 / 0.00 0.00 / 0.00
Max horiz. compressive stress [kN/m2] 1880 / 1930 1880 / 1940 2670 / 2690
Max vertical compressive stress [kN/m2]
2360 / 2450 2450 / 2390 3440 / 3090
Max shear stress [kN/m2] 954 / 1050 915 / 1030 1250 / 1370
Settlement on C (mm) 17 / 14 17 / 14 16 / 12
Convergence B-D (mm) -3 / -2 -3 / -2 -3 / -1
Convergence A-E (mm) 6 / 6 6 / 7 4 / 6
Excavation Plastic points (%) 4.6 / 9.7 4.9 / 9.8 4.1 / 4.4
Tension cut off points (%) 0.00 / 0.07 0.00 / 0.22 0.00 / 0.00
Max horiz. compressive stress [kN/m2] 1710 / 1850 1740 / 1850 2060 / 2030
Max vertical compressive stress [kN/m2]
1960 / 2160 2080 / 2100 2870 / 2540
Max shear stress [kN/m2] 978 / 969 821 / 985 1150 / 1290
Settlement on C (mm) 4 / 9 4 / 10 1.5 / 8
Convergence B-D (mm) 1 / 1 1 / 1 1 / 1
Convergence A-E (mm) 17 / 9 16 / 9 14 / 9
Building Plastic points (%) 17.3 / 22.4 17.2 / 21.9 14.5 / 4.4
Tension cut off points (%) 0.15 / 0.00 0.00 / 0.07 0.00 / 0.00
Max horiz. compressive stress [kN/m2] 1920 / 1840 1900 / 1860 2600 / 2390
Max vertical compressive stress [kN/m2]
2400 / 2420 2430 / 2370 3420 / 3020
Max shear stress [kN/m2] 966 / 1040 882 / 1030 1240 / 1360
Settlement on C (mm) 18 / 13 18 / 14 15 / 12
Convergence B-D (mm) 3 / 2 3 / 2 2 / 1
Convergence A-E (mm) 14 / 7 13 / 8 11 / 7
Table 6: Results on tunnel using Mohr-Coulomb material model for concrete. Material models for soils are [Mohr-Coulomb / Hardening-Soil]
Figure 5: Points for curves
Figure 6: Plastic points on phi-c reduction phase. This shows the calculation with HM-15 y=0.20 concrete and Mohr-Coulomb material model for soils.
Figure 4. Stresses on the HM-25 type concrete.These outputs are from the building loading phase and Hardening-Soil model for soils
16 Plaxis Bulletin l Spring Issue 2009 l www.plaxis.nl
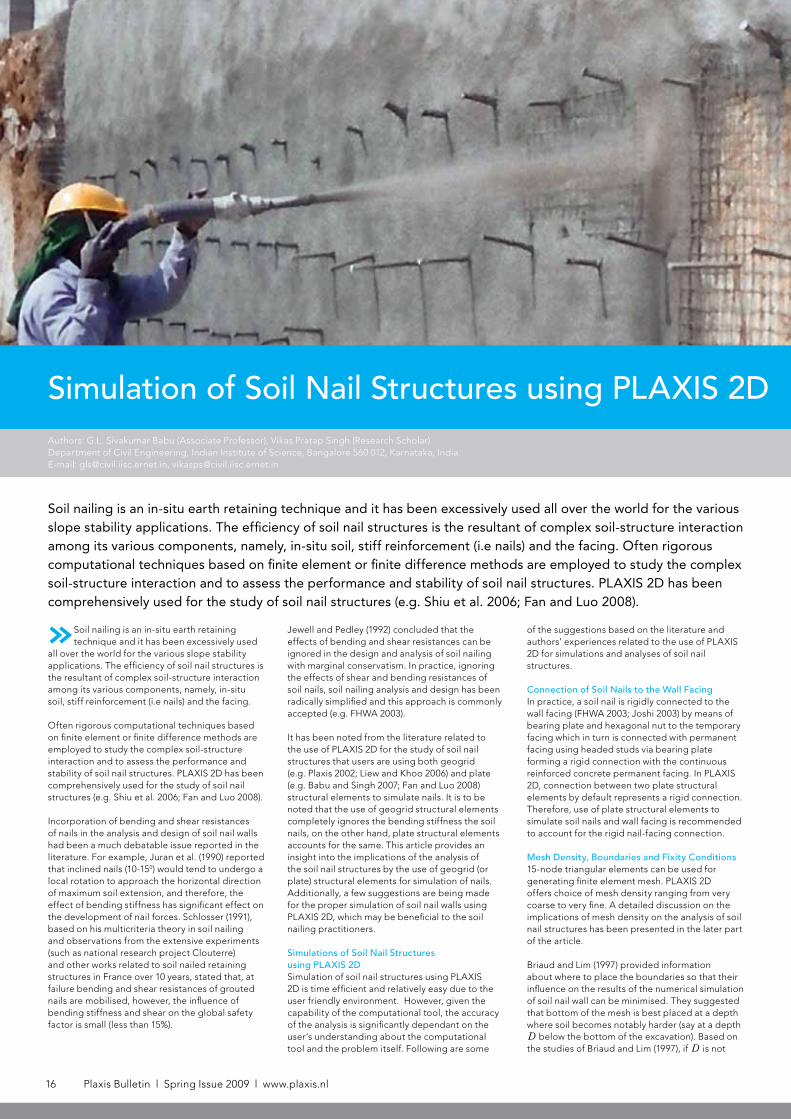
Simulation of Soil Nail Structures using PLAXIS 2D
Soil nailing is an in-situ earth retaining technique and it has been excessively used all over the world for the various slope stability applications. The efficiency of soil nail structures is the resultant of complex soil-structure interaction among its various components, namely, in-situ soil, stiff reinforcement (i.e nails) and the facing. Often rigorous computational techniques based on finite element or finite difference methods are employed to study the complex soil-structure interaction and to assess the performance and stability of soil nail structures. PLAXIS 2D has been comprehensively used for the study of soil nail structures (e.g. Shiu et al. 2006; Fan and Luo 2008).
»Soil nailing is an in-situ earth retaining technique and it has been excessively used
all over the world for the various slope stability applications. The efficiency of soil nail structures is the resultant of complex soil-structure interaction among its various components, namely, in-situ soil, stiff reinforcement (i.e nails) and the facing.
Often rigorous computational techniques based on finite element or finite difference methods are employed to study the complex soil-structure interaction and to assess the performance and stability of soil nail structures. PLAXIS 2D has been comprehensively used for the study of soil nail structures (e.g. Shiu et al. 2006; Fan and Luo 2008).
Incorporation of bending and shear resistances of nails in the analysis and design of soil nail walls had been a much debatable issue reported in the literature. For example, Juran et al. (1990) reported that inclined nails (10-150) would tend to undergo a local rotation to approach the horizontal direction of maximum soil extension, and therefore, the effect of bending stiffness has significant effect on the development of nail forces. Schlosser (1991), based on his multicriteria theory in soil nailing and observations from the extensive experiments (such as national research project Clouterre) and other works related to soil nailed retaining structures in France over 10 years, stated that, at failure bending and shear resistances of grouted nails are mobilised, however, the influence of bending stiffness and shear on the global safety factor is small (less than 15%).
Jewell and Pedley (1992) concluded that the effects of bending and shear resistances can be ignored in the design and analysis of soil nailing with marginal conservatism. In practice, ignoring the effects of shear and bending resistances of soil nails, soil nailing analysis and design has been radically simplified and this approach is commonly accepted (e.g. FHWA 2003).
It has been noted from the literature related to the use of PLAXIS 2D for the study of soil nail structures that users are using both geogrid (e.g. Plaxis 2002; Liew and Khoo 2006) and plate (e.g. Babu and Singh 2007; Fan and Luo 2008) structural elements to simulate nails. It is to be noted that the use of geogrid structural elements completely ignores the bending stiffness the soil nails, on the other hand, plate structural elements accounts for the same. This article provides an insight into the implications of the analysis of the soil nail structures by the use of geogrid (or plate) structural elements for simulation of nails. Additionally, a few suggestions are being made for the proper simulation of soil nail walls using PLAXIS 2D, which may be beneficial to the soil nailing practitioners.
Simulations of Soil Nail Structures using PLAXIS 2D Simulation of soil nail structures using PLAXIS 2D is time efficient and relatively easy due to the user friendly environment. However, given the capability of the computational tool, the accuracy of the analysis is significantly dependant on the user’s understanding about the computational tool and the problem itself. Following are some
of the suggestions based on the literature and authors’ experiences related to the use of PLAXIS 2D for simulations and analyses of soil nail structures.
Connection of Soil Nails to the Wall FacingIn practice, a soil nail is rigidly connected to the wall facing (FHWA 2003; Joshi 2003) by means of bearing plate and hexagonal nut to the temporary facing which in turn is connected with permanent facing using headed studs via bearing plate forming a rigid connection with the continuous reinforced concrete permanent facing. In PLAXIS 2D, connection between two plate structural elements by default represents a rigid connection. Therefore, use of plate structural elements to simulate soil nails and wall facing is recommended to account for the rigid nail-facing connection.
Mesh Density, Boundaries and Fixity Conditions15-node triangular elements can be used for generating finite element mesh. PLAXIS 2D offers choice of mesh density ranging from very coarse to very fine. A detailed discussion on the implications of mesh density on the analysis of soil nail structures has been presented in the later part of the article.
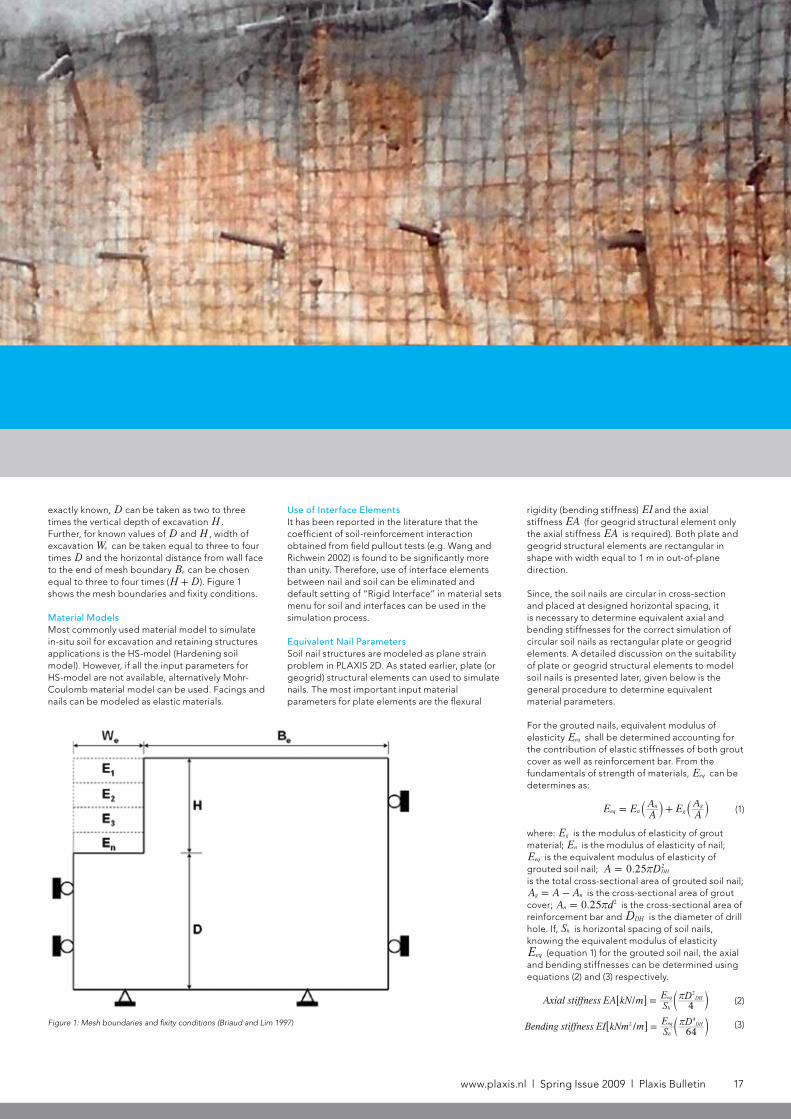
Briaud and Lim (1997) provided information about where to place the boundaries so that their influence on the results of the numerical simulation of soil nail wall can be minimised. They suggested that bottom of the mesh is best placed at a depth where soil becomes notably harder (say at a depth D below the bottom of the excavation). Based on the studies of Briaud and Lim (1997), if D is not
Authors: G.L. Sivakumar Babu (Associate Professor), Vikas Pratap Singh (Research Scholar) Department of Civil Engineering, Indian Institute of Science, Bangalore 560 012, Karnataka, India. E-mail: [email protected], [email protected]
www.plaxis.nl l Spring Issue 2009 l Plaxis Bulletin 17
exactly known, D can be taken as two to three times the vertical depth of excavation H . Further, for known values of D and H , width of excavation We can be taken equal to three to four times D and the horizontal distance from wall face to the end of mesh boundary Be can be chosen equal to three to four times (H D+ ). Figure 1 shows the mesh boundaries and fixity conditions.
Material ModelsMost commonly used material model to simulate in-situ soil for excavation and retaining structures applications is the HS-model (Hardening soil model). However, if all the input parameters for HS-model are not available, alternatively Mohr-Coulomb material model can be used. Facings and nails can be modeled as elastic materials.
Figure 1: Mesh boundaries and fixity conditions (Briaud and Lim 1997)
Use of Interface ElementsIt has been reported in the literature that the coefficient of soil-reinforcement interaction obtained from field pullout tests (e.g. Wang and Richwein 2002) is found to be significantly more than unity. Therefore, use of interface elements between nail and soil can be eliminated and default setting of “Rigid Interface” in material sets menu for soil and interfaces can be used in the simulation process.
Equivalent Nail ParametersSoil nail structures are modeled as plane strain problem in PLAXIS 2D. As stated earlier, plate (or geogrid) structural elements can used to simulate nails. The most important input material parameters for plate elements are the flexural
rigidity (bending stiffness) EI and the axial stiffness EA (for geogrid structural element only the axial stiffness EA is required). Both plate and geogrid structural elements are rectangular in shape with width equal to 1 m in out-of-plane direction.
Since, the soil nails are circular in cross-section and placed at designed horizontal spacing, it is necessary to determine equivalent axial and bending stiffnesses for the correct simulation of circular soil nails as rectangular plate or geogrid elements. A detailed discussion on the suitability of plate or geogrid structural elements to model soil nails is presented later, given below is the general procedure to determine equivalent material parameters.
For the grouted nails, equivalent modulus of elasticity Eeq shall be determined accounting for the contribution of elastic stiffnesses of both grout cover as well as reinforcement bar. From the fundamentals of strength of materials, Eeq can be determines as:
where: Eg is the modulus of elasticity of grout material; En is the modulus of elasticity of nail;Eeq is the equivalent modulus of elasticity of grouted soil nail; 0.25A DDH
2= r
is the total cross-sectional area of grouted soil nail; A A Ag n= - is the cross-sectional area of grout cover; .A d0 25n
2= r is the cross-sectional area of
reinforcement bar and DDH is the diameter of drill hole. If, Sh is horizontal spacing of soil nails, knowing the equivalent modulus of elasticity
(equation 1) for the grouted soil nail, the axial and bending stiffnesses can be determined using equations (2) and (3) respectively.
Eeq
(2)
(3)/Bending stiffness EI kNm mSE D
64h
eq DH24r
= c m6 @
/Axial stiffness EA kN mSE D
4h
eq DH2
=rc m6 @
(1)E EAA E
AA
eq nn
gg
= +` `j j
18 Plaxis Bulletin l Spring Issue 2009 l www.plaxis.nl
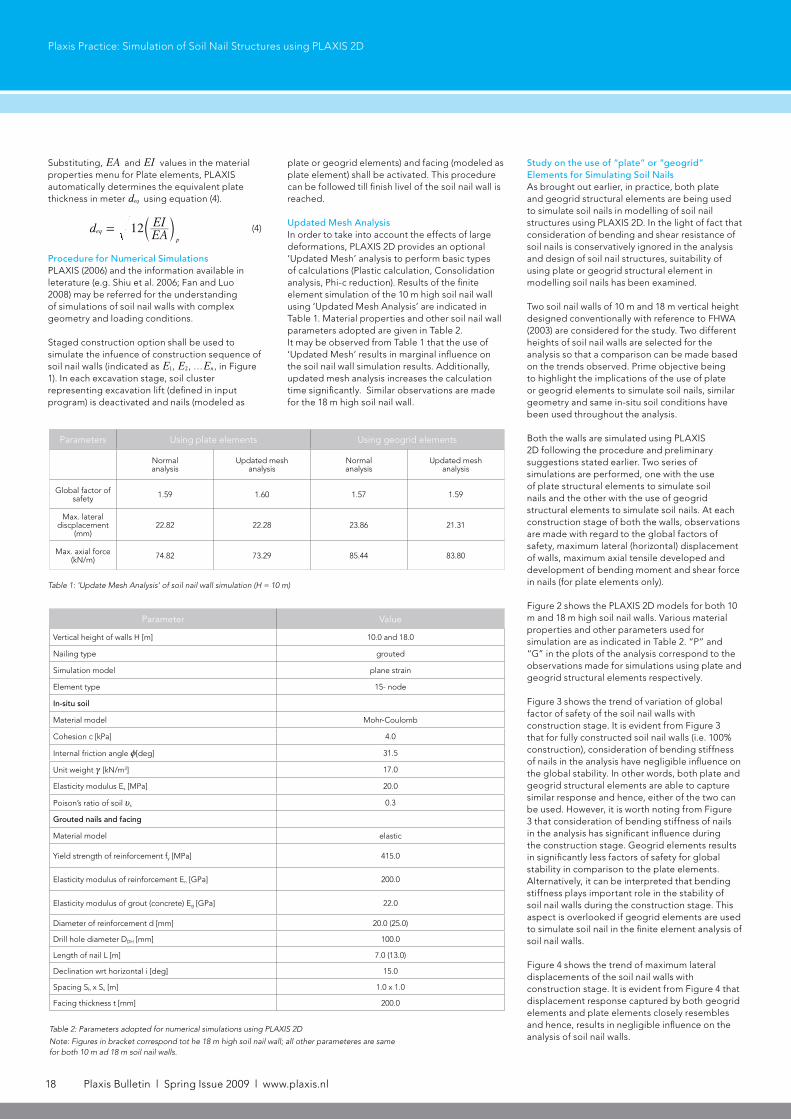
Substituting, EA and EI values in the material properties menu for Plate elements, PLAXIS automatically determines the equivalent plate thickness in meter deq using equation (4).
Procedure for Numerical SimulationsPLAXIS (2006) and the information available in leterature (e.g. Shiu et al. 2006; Fan and Luo 2008) may be referred for the understanding of simulations of soil nail walls with complex geometry and loading conditions.
Staged construction option shall be used to simulate the infuence of construction sequence of soil nail walls (indicated as E1, E2, …En , in Figure 1). In each excavation stage, soil cluster representing excavation lift (defined in input program) is deactivated and nails (modeled as
Parameters Using plate elements Using geogrid elements
Normalanalysis
Updated meshanalysis
Normalanalysis
Updated meshanalysis
Global factor of safety 1.59 1.60 1.57 1.59
Max. lateraldiscplacement
(mm)22.82 22.28 23.86 21.31
Max. axial force (kN/m) 74.82 73.29 85.44 83.80
Parameter Value
Vertical height of walls H [m] 10.0 and 18.0
Nailing type grouted
Simulation model plane strain
Element type 15- node
In-situ soil
Material model Mohr-Coulomb
Cohesion c [kPa] 4.0
Internal friction angle z[deg] 31.5
Unit weight c [kN/m3] 17.0
Elasticity modulus Es [MPa] 20.0
Poison’s ratio of soil ys 0.3
Grouted nails and facing
Material model elastic
Yield strength of reinforcement fy [MPa] 415.0
Elasticity modulus of reinforcement En [GPa] 200.0
Elasticity modulus of grout (concrete) Eg [GPa] 22.0
Diameter of reinforcement d [mm] 20.0 (25.0)
Drill hole diameter DDH [mm] 100.0
Length of nail L [m] 7.0 (13.0)
Declination wrt horizontal i [deg] 15.0
Spacing Sh x Sv [m] 1.0 x 1.0
Facing thickness t [mm] 200.0
Table 2: Parameters adopted for numerical simulations using PLAXIS 2D
Note: Figures in bracket correspond tot he 18 m high soil nail wall; all other parameteres are same for both 10 m ad 18 m soil nail walls.
Table 1: ‘Update Mesh Analysis’ of soil nail wall simulation (H = 10 m)
plate or geogrid elements) and facing (modeled as plate element) shall be activated. This procedure can be followed till finish livel of the soil nail wall is reached.
Updated Mesh AnalysisIn order to take into account the effects of large deformations, PLAXIS 2D provides an optional ‘Updated Mesh’ analysis to perform basic types of calculations (Plastic calculation, Consolidation analysis, Phi-c reduction). Results of the finite element simulation of the 10 m high soil nail wall using ‘Updated Mesh Analysis’ are indicated in Table 1. Material properties and other soil nail wall parameters adopted are given in Table 2. It may be observed from Table 1 that the use of ‘Updated Mesh’ results in marginal influence on the soil nail wall simulation results. Additionally, updated mesh analysis increases the calculation time significantly. Similar observations are made for the 18 m high soil nail wall.
Study on the use of “plate” or “geogrid” Elements for Simulating Soil NailsAs brought out earlier, in practice, both plate and geogrid structural elements are being used to simulate soil nails in modelling of soil nail structures using PLAXIS 2D. In the light of fact that consideration of bending and shear resistance of soil nails is conservatively ignored in the analysis and design of soil nail structures, suitability of using plate or geogrid structural element in modelling soil nails has been examined.
Two soil nail walls of 10 m and 18 m vertical height designed conventionally with reference to FHWA (2003) are considered for the study. Two different heights of soil nail walls are selected for the analysis so that a comparison can be made based on the trends observed. Prime objective being to highlight the implications of the use of plate or geogrid elements to simulate soil nails, similar geometry and same in-situ soil conditions have been used throughout the analysis.
Both the walls are simulated using PLAXIS 2D following the procedure and preliminary suggestions stated earlier. Two series of simulations are performed, one with the use of plate structural elements to simulate soil nails and the other with the use of geogrid structural elements to simulate soil nails. At each construction stage of both the walls, observations are made with regard to the global factors of safety, maximum lateral (horizontal) displacement of walls, maximum axial tensile developed and development of bending moment and shear force in nails (for plate elements only).
Figure 2 shows the PLAXIS 2D models for both 10 m and 18 m high soil nail walls. Various material properties and other parameters used for simulation are as indicated in Table 2. “P” and “G” in the plots of the analysis correspond to the observations made for simulations using plate and geogrid structural elements respectively.
Figure 3 shows the trend of variation of global factor of safety of the soil nail walls with construction stage. It is evident from Figure 3 that for fully constructed soil nail walls (i.e. 100% construction), consideration of bending stiffness of nails in the analysis have negligible influence on the global stability. In other words, both plate and geogrid structural elements are able to capture similar response and hence, either of the two can be used. However, it is worth noting from Figure 3 that consideration of bending stiffness of nails in the analysis has significant influence during the construction stage. Geogrid elements results in significantly less factors of safety for global stability in comparison to the plate elements. Alternatively, it can be interpreted that bending stiffness plays important role in the stability of soil nail walls during the construction stage. This aspect is overlooked if geogrid elements are used to simulate soil nail in the finite element analysis of soil nail walls.
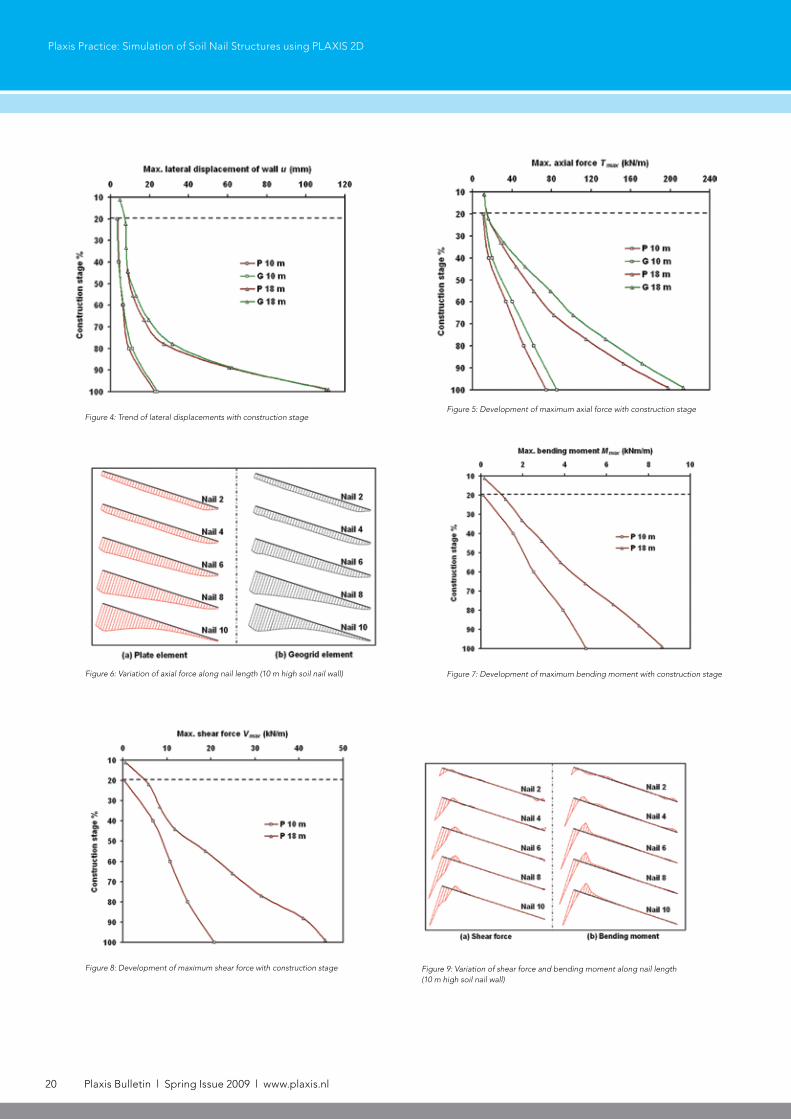
Figure 4 shows the trend of maximum lateral displacements of the soil nail walls with construction stage. It is evident from Figure 4 that displacement response captured by both geogrid elements and plate elements closely resembles and hence, results in negligible influence on the analysis of soil nail walls.
Plaxis Practice: Simulation of Soil Nail Structures using PLAXIS 2D
(4)dEAEI12eq
p
= c m

www.plaxis.nl l Spring Issue 2009 l Plaxis Bulletin 19
Figure 5 shows the development of maximum axial force in nails with construction stage. From Figure 5, it can be observed that on an average the maximum axial force developed in nails simulated using geogrid elements is found to be 15% more in comparison to that developed in nails using plate elements. In other words, lesser axial force developed in nails simulated using plate elements is credited to the contribution of bending stiffness of the nails.
This observation is in good agreement with the literature. Figure 6 shows the variation of axial force along the nail length for nails at different levels in 10 m high soil nail wall. Very close resemblance among the axial forces variation along nail length is evident from Figure 6 for the nails simulated using geogrid and plate elements. Similar observations were made for 18 m high soil nail wall.
Development of maximum bending moment and maximum shear force in nails with construction stages are shown in Figures 7 and 8 respectively. It is evident from Figures 7 and 8 that bending and shear capacities of soil nail start mobilising with increasing construction stages. For soil nail walls of greater heights such as 18 m, the magnitude of
maximum bending moment and maximum shear force developed in soil nails with construction stages are considerable.
Figure 9 shows the variation of bending moments and shear forces along the nail length for nails at different levels in 10 m high soil nail wall. Similar observations were made for 18 m high soil nail wall. It is interesting to note that bending moments and shear forces are concentrated near the face of the wall. This provides an insight into the facing failure modes of the soil nail walls. As mentioned previously, in practice, soil nail are rigidly connected with the facing (FHWA 2003; Joshi 2003) and therefore, it may be desirable to appraise the facing design. Improper design may lead to the bending and/or shear failures of soil nails at or near the facing. Use of geogrid elements for simulating soil nails may lead to the complete negligence of this aspect of the soil nail wall analysis.
Thus, from the above discussions it is apparent that the use of plate elements provides better insight into the analysis of soil nail walls using finite element simulations. Hence, when PLAXIS 2D is used to investigate the cause of failure or to assess the performance of soil nail structure, it
is advisable that use of plate structural elements shall be preferred over geogrid structural element for simulating soil nails.
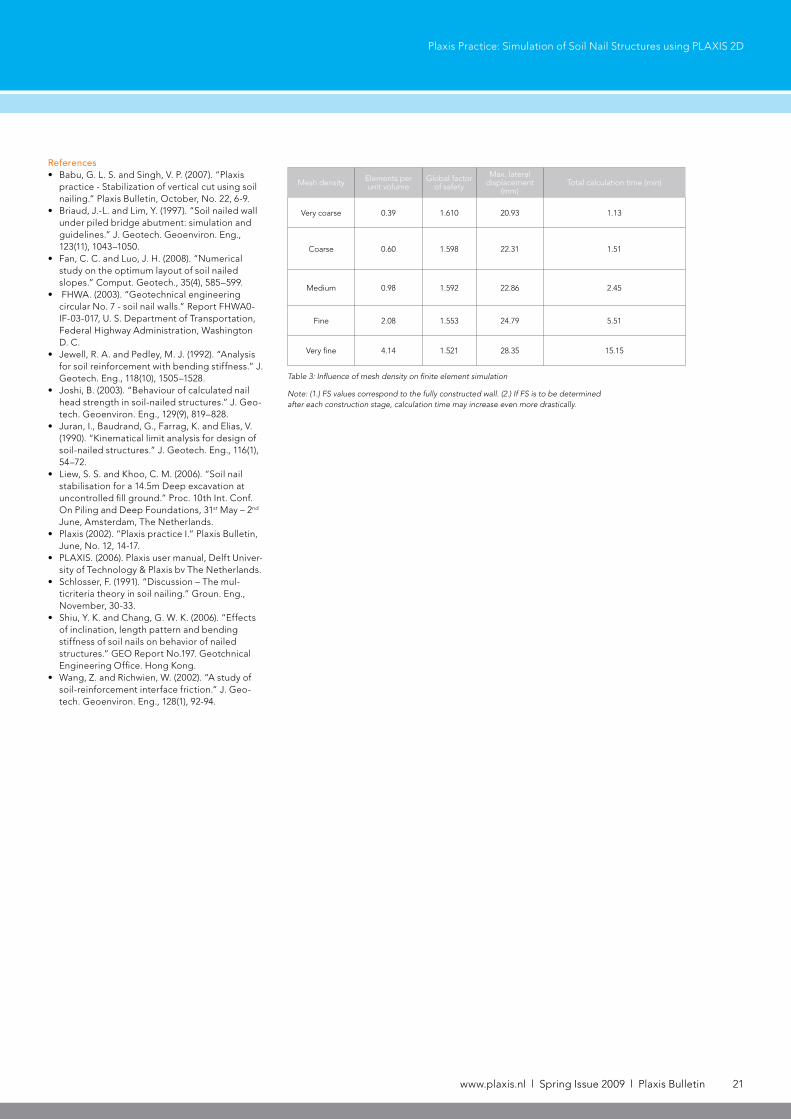
Influence of Mesh Density on the Soil Nail Structures SimulationsAnother important aspect of the numerical simulation of any structure is the density of finite element mesh adopted for the analysis. PLAXIS 2D provides option to the users to select mesh density in the range from very coarse to very fine. Influence of mesh density on the analysis of the soil nail wall and the results corresponding to the analysis of 10m high soil nail wall are presented in Table 3. From Table 3, it can be observed that global factor of safety varies significantly from 1.61 for very coarse mesh to 1.52 for very fine mesh. Also, maximum lateral displacement varied from 20.93mm for very coarse mesh to 28.35mm for very fine mesh. Similar trends are observed for the stress parameters in nails such as development of axial force, bending moment and shear force. Though, denser mesh may result in more accurate analysis, it is important to note that increasing the mesh density results in drastic increase in the overall calculation time (Table 3). Thus, appropriate mesh density shall be used depending upon the degree of accuracy required and the capacity of the computing machine. In general, coarse mesh density globally and fine mesh density in the vicinity of the soil nail wall can be used.
Concluding RemarksIn this article, an attempt has been made to bring out implications of the use of plate and geogrid structural elements for simulating soil nails on the analysis of soil nail structures using PLAXIS 2D. Based on the observations from the analyses, use of plate structural elements in comparison to geogrid structural element is advised to simulate soil nails. Further, influence of mesh density on the analysis of soil nail structures is highlighted. Preliminary suggestions made regarding numerical simulations of the soil nail structures that may be useful for the Plaxis user community in general and soil nailing practitioners in particular.
AcknowledgementsThe work presented in this article is a part of the research project Guidelines for Soil Nailing Technique in Highway Engineering (R-86) financed by the Ministry of Shipping, Road Transport and Highways, India. The authors express thanks to the Ministry for funding and providing necessary support for the project.
Figure 2: Simulated soil nail walls using PLAXIS 2D
Plaxis Practice: Simulation of Soil Nail Structures using PLAXIS 2D
continue on page 21
Figure 3: Trend of global factor of safety with construction stage
20 Plaxis Bulletin l Spring Issue 2009 l www.plaxis.nl
Figure 6: Variation of axial force along nail length (10 m high soil nail wall)
Figure 9: Variation of shear force and bending moment along nail length(10 m high soil nail wall)
Figure 7: Development of maximum bending moment with construction stage
Figure 8: Development of maximum shear force with construction stage
Figure 5: Development of maximum axial force with construction stage
Plaxis Practice: Simulation of Soil Nail Structures using PLAXIS 2D
Figure 4: Trend of lateral displacements with construction stage
www.plaxis.nl l Spring Issue 2009 l Plaxis Bulletin 21
References• Babu, G. L. S. and Singh, V. P. (2007). “Plaxis
practice - Stabilization of vertical cut using soil nailing.” Plaxis Bulletin, October, No. 22, 6-9.
• Briaud, J.-L. and Lim, Y. (1997). “Soil nailed wall under piled bridge abutment: simulation and guidelines.” J. Geotech. Geoenviron. Eng., 123(11), 1043–1050.
• Fan, C. C. and Luo, J. H. (2008). “Numerical study on the optimum layout of soil nailed slopes.” Comput. Geotech., 35(4), 585–599.
• FHWA. (2003). “Geotechnical engineering circular No. 7 - soil nail walls.” Report FHWA0-IF-03-017, U. S. Department of Transportation, Federal Highway Administration, Washington D. C.
• Jewell, R. A. and Pedley, M. J. (1992). “Analysis for soil reinforcement with bending stiffness.” J. Geotech. Eng., 118(10), 1505–1528.
• Joshi, B. (2003). “Behaviour of calculated nail head strength in soil-nailed structures.” J. Geo-tech. Geoenviron. Eng., 129(9), 819–828.
• Juran, I., Baudrand, G., Farrag, K. and Elias, V. (1990). “Kinematical limit analysis for design of soil-nailed structures.” J. Geotech. Eng., 116(1), 54–72.
• Liew, S. S. and Khoo, C. M. (2006). “Soil nail stabilisation for a 14.5m Deep excavation at uncontrolled fill ground.” Proc. 10th Int. Conf. On Piling and Deep Foundations, 31st May – 2nd June, Amsterdam, The Netherlands.
• Plaxis (2002). “Plaxis practice I.” Plaxis Bulletin, June, No. 12, 14-17.
• PLAXIS. (2006). Plaxis user manual, Delft Univer-sity of Technology & Plaxis bv The Netherlands.
• Schlosser, F. (1991). “Discussion – The mul-ticriteria theory in soil nailing.” Groun. Eng., November, 30-33.
• Shiu, Y. K. and Chang, G. W. K. (2006). “Effects of inclination, length pattern and bending stiffness of soil nails on behavior of nailed structures.” GEO Report No.197. Geotchnical Engineering Office. Hong Kong.
• Wang, Z. and Richwien, W. (2002). “A study of soil-reinforcement interface friction.” J. Geo-tech. Geoenviron. Eng., 128(1), 92-94.
Mesh density Elements per unit volume
Global factor of safety
Max. lateraldisplacement
(mm)Total calculation time (min)
Very coarse 0.39 1.610 20.93 1.13
Coarse 0.60 1.598 22.31 1.51
Medium 0.98 1.592 22.86 2.45
Fine 2.08 1.553 24.79 5.51
Very fine 4.14 1.521 28.35 15.15
Table 3: Influence of mesh density on finite element simulation
Note: (1.) FS values correspond to the fully constructed wall. (2.) If FS is to be determined after each construction stage, calculation time may increase even more drastically.
Figure 5: Development of maximum axial force with construction stage
Plaxis Practice: Simulation of Soil Nail Structures using PLAXIS 2D
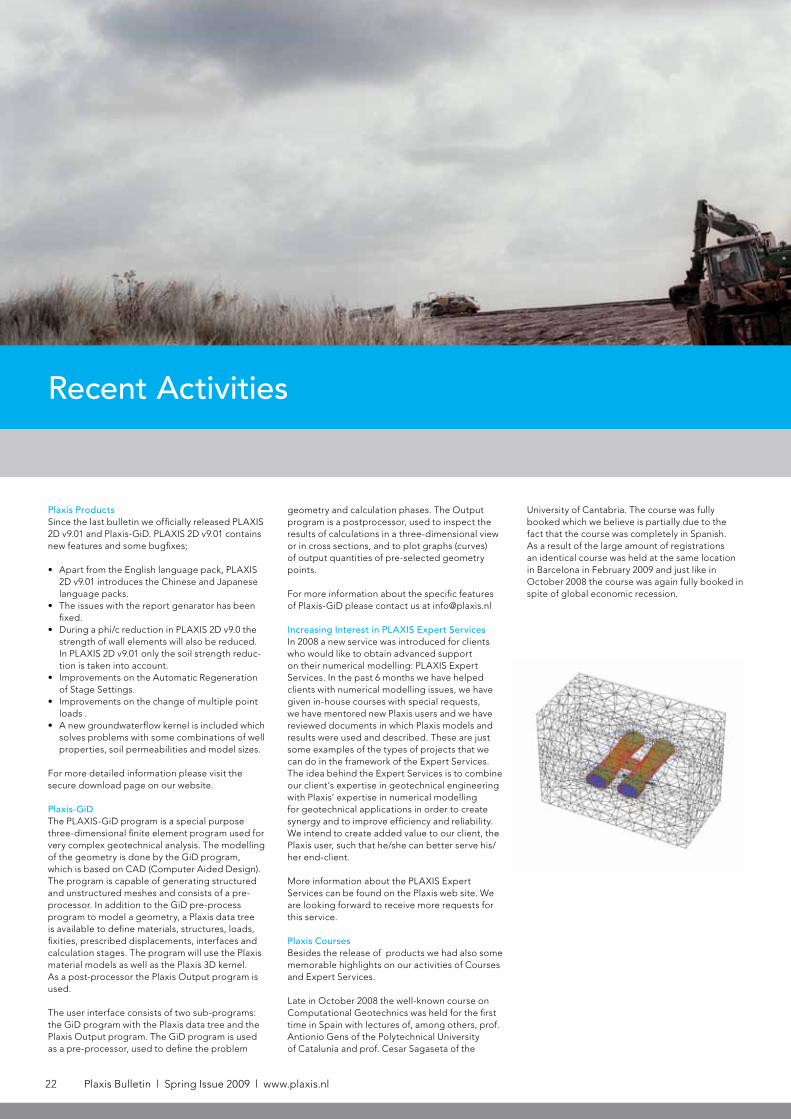
22 Plaxis Bulletin l Spring Issue 2009 l www.plaxis.nl
University of Cantabria. The course was fully booked which we believe is partially due to the fact that the course was completely in Spanish. As a result of the large amount of registrations an identical course was held at the same location in Barcelona in February 2009 and just like in October 2008 the course was again fully booked in spite of global economic recession.
Recent Activities
Plaxis ProductsSince the last bulletin we officially released PLAXIS 2D v9.01 and Plaxis-GiD. PLAXIS 2D v9.01 contains new features and some bugfixes;
• Apart from the English language pack, PLAXIS 2D v9.01 introduces the Chinese and Japanese language packs.
• The issues with the report genarator has been fixed.
• During a phi/c reduction in PLAXIS 2D v9.0 the strength of wall elements will also be reduced. In PLAXIS 2D v9.01 only the soil strength reduc-tion is taken into account.
• Improvements on the Automatic Regeneration of Stage Settings.
• Improvements on the change of multiple point loads .
• A new groundwaterflow kernel is included which solves problems with some combinations of well properties, soil permeabilities and model sizes.
For more detailed information please visit the secure download page on our website.
Plaxis-GiDThe PLAXIS-GiD program is a special purpose three-dimensional finite element program used for very complex geotechnical analysis. The modelling of the geometry is done by the GiD program, which is based on CAD (Computer Aided Design). The program is capable of generating structured and unstructured meshes and consists of a pre-processor. In addition to the GiD pre-process program to model a geometry, a Plaxis data tree is available to define materials, structures, loads, fixities, prescribed displacements, interfaces and calculation stages. The program will use the Plaxis material models as well as the Plaxis 3D kernel. As a post-processor the Plaxis Output program is used.
The user interface consists of two sub-programs: the GiD program with the Plaxis data tree and the Plaxis Output program. The GiD program is used as a pre-processor, used to define the problem
geometry and calculation phases. The Output program is a postprocessor, used to inspect the results of calculations in a three-dimensional view or in cross sections, and to plot graphs (curves) of output quantities of pre-selected geometry points.
For more information about the specific features of Plaxis-GiD please contact us at [email protected]
Increasing Interest in PLAXIS Expert Services In 2008 a new service was introduced for clients who would like to obtain advanced support on their numerical modelling: PLAXIS Expert Services. In the past 6 months we have helped clients with numerical modelling issues, we have given in-house courses with special requests, we have mentored new Plaxis users and we have reviewed documents in which Plaxis models and results were used and described. These are just some examples of the types of projects that we can do in the framework of the Expert Services.The idea behind the Expert Services is to combine our client’s expertise in geotechnical engineering with Plaxis’ expertise in numerical modelling for geotechnical applications in order to create synergy and to improve efficiency and reliability. We intend to create added value to our client, the Plaxis user, such that he/she can better serve his/her end-client.
More information about the PLAXIS Expert Services can be found on the Plaxis web site. We are looking forward to receive more requests for this service.
Plaxis CoursesBesides the release of products we had also some memorable highlights on our activities of Courses and Expert Services. Late in October 2008 the well-known course on Computational Geotechnics was held for the first time in Spain with lectures of, among others, prof. Antionio Gens of the Polytechnical University of Catalunia and prof. Cesar Sagaseta of the
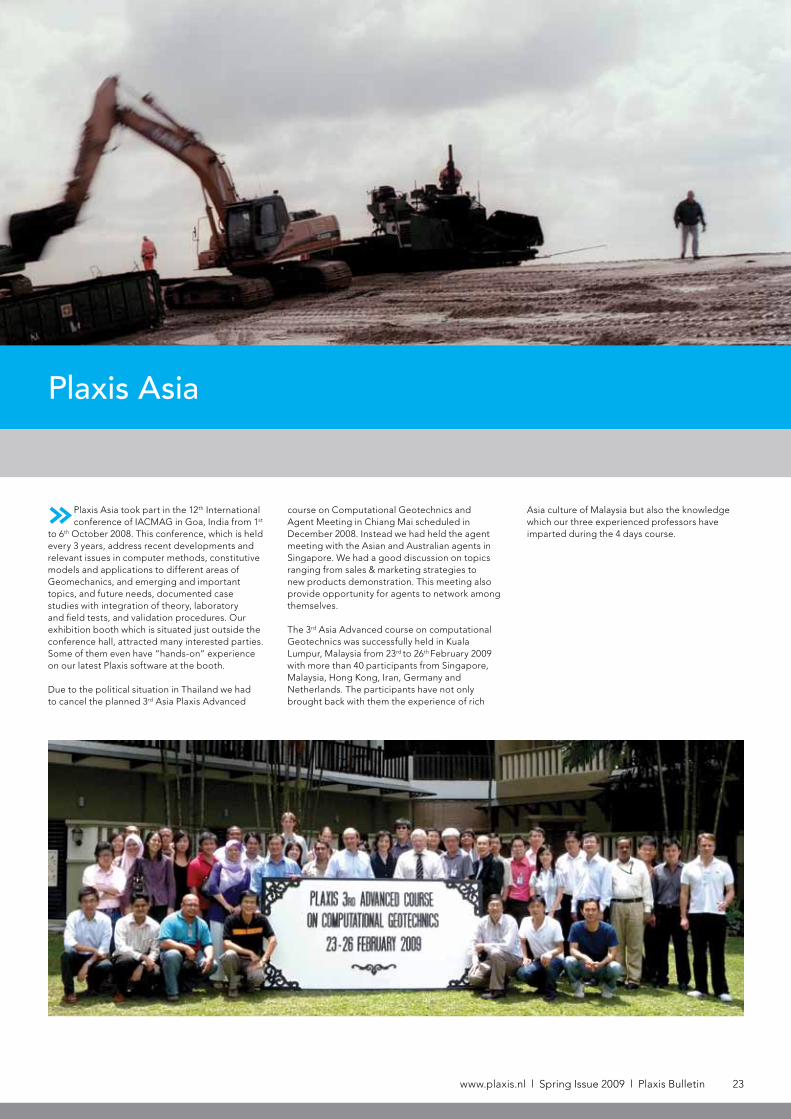
www.plaxis.nl l Spring Issue 2009 l Plaxis Bulletin 23
Plaxis Asia
»Plaxis Asia took part in the 12th International conference of IACMAG in Goa, India from 1st
to 6th October 2008. This conference, which is held every 3 years, address recent developments and relevant issues in computer methods, constitutive models and applications to different areas of Geomechanics, and emerging and important topics, and future needs, documented case studies with integration of theory, laboratory and field tests, and validation procedures. Our exhibition booth which is situated just outside the conference hall, attracted many interested parties. Some of them even have “hands-on” experience on our latest Plaxis software at the booth.
Due to the political situation in Thailand we had to cancel the planned 3rd Asia Plaxis Advanced
course on Computational Geotechnics and Agent Meeting in Chiang Mai scheduled in December 2008. Instead we had held the agent meeting with the Asian and Australian agents in Singapore. We had a good discussion on topics ranging from sales & marketing strategies to new products demonstration. This meeting also provide opportunity for agents to network among themselves.
The 3rd Asia Advanced course on computational Geotechnics was successfully held in Kuala Lumpur, Malaysia from 23rd to 26th February 2009 with more than 40 participants from Singapore, Malaysia, Hong Kong, Iran, Germany and Netherlands. The participants have not only brought back with them the experience of rich
Asia culture of Malaysia but also the knowledge which our three experienced professors have imparted during the 4 days course.
Title
16 Jalan Kilang Timor#05-08 Redhill Forum
159308 Singapore
P.O. Box 572 2600 AN Delft
The Netherlands
www.plaxis.nlTel +31 (0)15 2517 720Fax +31 (0)15 2573 107
Plaxis AsiaSingapore
Tel +65 6325 4191
Plaxis bvDelftechpark 53
2628 XJ Delft
April 3, 2009Plaxis SeminarHCMC, Vietnam
April 6 – 8, 2009International Course for ExperiencedPlaxis UsersDelft, The Netherlands
April 15 – 17, 2009 Standard Course on Computational Geotechnics Beijing, China
April 29 – May 1, 2009 Com Geo IJuan-les-Pins, France
May 23 – 28, 2009 WTC2009, Budapest, Hungary
May 25 – 27, 2009 IS on Prediction and Simulation Methods for Geohazard MitigationKyoto, Japan
May 27 – 29, 2009 Standard Course on Computational GeotechnicsBangalore, India
June 15 – 18, 2009IS on Performance-Based Design in Earthquake Geotecnical EngineeringTokyo, Japan
June 23 – 25, 2009Standard Course on Computational GeotechnicsManchester, United Kingdom
June, 2009 Russian Plaxis Users MeetingSt. Petersburg, Russia
July 14 – 17, 2009 Standard Course on Computational GeotechnicsChicago, USA
July 15, 2009Plaxis SeminarManila, Philippines
August 16 – 18, 2009Standard Course on Computational GeotechnicsTapei, Taiwan
August 24 – 26Advanced Course on Computational GeotechnicsGlasgow, United Kingdom
September 9 – 11, 2009 EURO TUN 2009,Bochum, Germany
October 5 – 9, 2009 17th ISSMGEAlexandria, Egypt
November 5, 2009GeotechniekdagThe Netherlands
November 11 – 13, 200916th European Plaxis User MeetingKarlsruhe, Germany
November 18 – 20, 2009Standard Course on Computational GeotechnicsHongkong SAR, China
November 25 – 27, 2009Standard Course on Computational GeotechnicsParis, France
December 2 – 3, 2009IS on Geotechnical Engineering Ground Improvement and Geosynthetics for Sustainable Mitigration and Adaption to Climate ChangeBangkok, Thailand
December 9 – 11, 2009IS on Ground Improvement Technologies and Case Histories (1SG109)Singapore
Activities 2009