%2$5 ',5(&7256’ 257 - CMVMweb3.cmvm.pt/english/sdi/emitentes/docs/PCS61803.pdf · 1.8.1....
203
BOARD OF DIRECTORS’ REPORT 1 st Half 2016 CGD Reports www.cgd.pt
Transcript of %2$5 ',5(&7256’ 257 - CMVMweb3.cmvm.pt/english/sdi/emitentes/docs/PCS61803.pdf · 1.8.1....

BOARD OF DIRECTORS’ REPORT
1st Half 2016
CGD Reports
www.cgd.pt


CGD BOARD OF DIRECTORS’ REPORT – 1st HALF 2016 3
TABLE OF CONTENTS
1. BOARD OF DIRECTORS’ REPORT ................................................................................ 5
1.1. HIGHLIGHTS .................................................................................................................. 5 1.2. EVOLUTION OF CGD GROUP ...................................................................................... 9 1.3. ECONOMIC-FINANCIAL FRAMEWORK ..................................................................... 13 1.4. OPERATING SEGMENTS ........................................................................................... 16
1.4.1. Commercial banking ..................................................................................... 16 1.4.2. Investment banking....................................................................................... 25 1.4.3. Specialised credit.......................................................................................... 26 1.4.4. Asset management ....................................................................................... 29 1.4.5. International area activity .............................................................................. 32
1.5. RESULTS, BALANCE SHEET, LIQUIDITY AND SOLVENCY .................................... 39
1.5.1. Consolidated activity ..................................................................................... 39 1.5.2. Separate operations ..................................................................................... 47
1.6. MAIN RISKS AND UNCERTAINTIES IN 2ND HALF 2016 ............................................ 49 1.7. GROUP RATINGS ........................................................................................................ 51 1.8. STATEMENTS OF THE BOARD OF DIRECTORS ..................................................... 52
1.8.1. Statement of conformity of the presentation of financial information ........... 52 1.8.2. Statement of the auditing of the accounts .................................................... 53
1.9. BONDS HELD BY MEMBERS OF THE BOARD OF DIRECTORS ............................. 54 1.10. INFORMATION ON CGD’S SHAREHOLDERS ......................................................... 55 1.11. SEPARATE AND CONSOLIDATED FINANCIAL STATEMENTS ............................. 56
Balance sheet (separate)........................................................................................ 56 Income statement (separate) .................................................................................. 57 Statement of comprehensive income (separate) .................................................... 58 Cash flow statements (separate) ............................................................................ 59 Statement of changes in equity (separate) ............................................................. 60 Consolidated balance sheet ................................................................................... 61 Consolidated income statements ........................................................................... 62 Consolidated statement of comprehensive income ................................................ 63 Consolidated cash flow statements ........................................................................ 64 Consolidated statement of changes in equity ......................................................... 65
2. NOTES ON THE ACCOUNTS ........................................................................................ 66
2.1. NOTES TO THE CONSOLIDATED FINANCIAL STATEMENTS ................................ 66
1. Introductory note ................................................................................................. 66 2. Accounting policies ............................................................................................. 68 3. Group companies and transactions in period ..................................................... 88 4. Cash and claims at central banks ....................................................................... 92 5. Claims at other credit institutions ........................................................................ 93 6. Investments in credit institutions ......................................................................... 94 7. Financial assets held for trading and other assets at fair value through
profit or loss ......................................................................................................... 96 8. Available-for-sale financial assets ...................................................................... 97 9. Financial assets with repurchase agreements ................................................. 105 10. Derivatives ...................................................................................................... 106 11. Held-to-maturity investments .......................................................................... 108 12. Loans and advances to customers ................................................................. 109 13. Non-current assets and liabilities held-for-sale .............................................. 111 14. Investment properties ..................................................................................... 112

4 BOARD OF DIRECTORS’ REPORT – 1st HALF 2016 CGD
15. Investments in associates and jointly controlled enterprises ......................... 116 16. Income tax ..................................................................................................... 118 17. Other assets ................................................................................................... 123 18. Credit institutions' and central banks' resources ........................................... 126 19. Customers’ resources and other loans .......................................................... 128 20. Debt securities ............................................................................................... 129 21. Provisions and contingent liabilities ............................................................... 133 22. Other subordinated liabilities ......................................................................... 138 23. Other liabilities ............................................................................................... 144 24. Capital ............................................................................................................ 145 25. Reserves, retained earnings and results Attributable to the shareholder
CGD.................................................................................................................. 146 26. Non-controlling interests ................................................................................ 150 27. Interest and income and interest and similar costs ....................................... 152 28. Income from equity instruments..................................................................... 154 29. Income and costs of services and commissions ........................................... 155 30. Income from financial operations ................................................................... 156 31. Other operating income ................................................................................. 158 32. Employee costs.............................................................................................. 160 33. Other administrative expenses ...................................................................... 162 34. Impairment of assets ..................................................................................... 163 35. Segment reporting ......................................................................................... 164 36. Disclosures relating to financial instruments ................................................. 167 37. Note added for translation ............................................................................. 196
2.3. EBA REPORTS ......................................................................................................... 197
This document is an English translation of the original Portuguese language document “Relatório do Conselho de Administração - 1º semestre de 2016”. The Portuguese original prevails in the event of any inconsistency.

CGD BOARD OF DIRECTORS’ REPORT – 1st HALF 2016 5
HIGHLIGHTS
1. Board of Directors’ Report
1.1. Highlights
RESULTS
At the end of the first half 2016, core operating income (sum of net interest income and
commissions, net of operating costs), saw an increase of 19.1% in the period to €159.6
million, influenced by the good performance of net interest income and operating costs.
CGD Group’s net interest income, in first half 2016, was up 5.5% by €29.8 million over the
same half 2015 to €568.7 million.
As in first half 2015, the half yearly growth of net interest income greatly benefited from the
17.5% reduction of €171.7 million in funding costs, surpassing the reduction also felt in
interest on lending (down 9.3% by €141.8 million).
Commissions earnings (net) of €230.1 million reflected the strong competitive and
regulatory pressure on commissions charges.
Income from financial operations were negative at €47.4 million, influenced by high
volatility experienced in international financial markets, including public debt, associated
with the United Kingdom's referendum about remaining in the European Union.
CGD’s total operating income for the half year, strongly influenced by the negative change
of €349.4 million in income from financial operations, was therefore down €399.5 million
over the same half 2015 to €754.7 million.
CGD’s operating costs, which benefited from the containment felt across all of its
components, namely administrative expenditure (down 3.1%) and depreciation (down
7.6%) were down 2.0% in the half year. Employee costs were down 0.7%, although the
reduction would have been 6% with the exclusion of the one-off Horizonte Plan cost of
€20.0 million. Total operating costs, excluding this one-off factor, were down 5.1%.
Net operating income before impairments for first half 2016 amounted to €115.4 million.
There was a 2.1% increase of €6.7 million in provisions and impairment for the period to
€328.4 million.
Income before tax and non-controlling interests and net income for the half year were
€193.1 million and €-205.2 million, respectively.
BALANCE SHEET
CGD Group’s total assets, at the end of June 2016, were down 0.9% over the same date in
2015, to €99,355 million.
Customer resources of €72,442 million at the end of the first half represented a positive
3.1% evolution of €2,199 million over June 2015.
Gross loans and advances to customers (including credit with repurchase agreements)
amounted to €70,674 million in June last. The growth of new loan operations across the
half year was insufficient to offset portfolio maturities.

6 BOARD OF DIRECTORS’ REPORT – 1st HALF 2016 CGD
HIGHLIGHTS
Credit at risk, in June 2016, was 12.2% of the credit portfolio, with a level of provisions and
impairment coverage of 63.2%. The level of coverage of credit at risk was 46.5% for credit
to individuals and 73.7% for corporate customers.
The loans-to-deposits ratio of 90.1% reflected CGD’s strong resource-taking capacity, in
addition to the, as yet, limited recovery of demand for credit, in Portugal.
LIQUIDITY
CGD’s funding from the Eurosystem at the end of June 2016 totalled €3,597 million, a
change of €832 million over December 2015 and €691 million over June 2015 and
currently representing 3.6% of total assets.
CGD’s liquidity remained at a highly comfortable level with an LCR (liquidity coverage ratio)
of 193.5%, far in excess of regulatory requirements. Net Stable Funding Ratio (NSFR) was
133.4% in June 2016 (135.9% in December 2015).
The phased-in and fully implemented Common Equity Tier 1 (CET 1) ratios, calculated
according to CRD IV/CRR rules were 10.0% and 9.2%, respectively in June 2016,
complying with the regulatory requirements.
The Leverage fully implemented ratio was 5.2% at the end of June 2016, which compares
with 5.7% in December 2015.

CGD BOARD OF DIRECTORS’ REPORT – 1st HALF 2016 7
HIGHLIGHTS
CGD: HIGHLIGHTS
(million euros)
RESULTS 2015-06 2015-12 2016-06 Total (%)
Net interest income 538.9 - 568.7 29.8 5.5%
Net inter. income incl. inc. from equity investm. 582.1 - 598.3 16.3 2.8%
Commissions (net) 247.7 - 230.1 -17.6 -7.1%
Non-interest income 572.1 - 156.3 -415.8 -72.7%
Total Operating Income 1,154.2 - 754.7 -399.5 -34.6%
Operating costs 652.5 - 639.3 -13.3 -2.0%
Net Operating Income before Impairments 501.6 - 115.4 -386.2 -77.0%
Net Income before tax and non-controlling interests 213.5 - -193.1 -406.6 -
Net income 47.1 - -205.2 -252.3 -
BALANCE SHEET
Net assets 100,238 100,901 99,355 -883 -0.9%
Cash and loans and advances to credit instit. 6,090 7,664 5,145 -945 -15.5%
Securities investments (1) 19,951 19,649 20,640 689 3.5%
Loans and advances to customers (net) (2) 66,639 66,178 65,284 -1,355 -2.0%
Loans and advances to customers (gross) (2) 71,855 71,376 70,674 -1,181 -1.6%
Central banks' and credit institutions' resources 6,019 5,433 5,769 -251 -4.2%
Customer resources 70,242 73,426 72,442 2,199 3.1%
Debt securities 8,170 6,700 6,117 -2,053 -25.1%
Shareholders' equity 6,391 6,184 5,745 -646 -10.1%
RESOURCES TAKEN FROM CUSTOMERS 100,057 103,018 100,968 911 0.9%
PROFIT AND EFFICIENCY RATIOS
Gross return on equity - ROE (3) (4) 6.3% -0.3% -6.3%
Net return on equity - ROE (4) 2.8% -1.3% -5.9%
Gross return on assets - ROA (3) (4) 0.4% 0.0% -0.4%
Net return on assets - ROA (4) 0.2% -0.1% -0.4%
Cost-to-income (3) 54.9% 66.6% 82.5%
Employee costs / Total Operating Income (3) 31.7% 39.3% 48.4%
Operating costs / Average net assets 1.3% 1.4% 1.3%
Total Operating Income / Average net assets (3) 2.4% 2.1% 1.6%
Change
2016-06 vs 2015-06
(1) Includes assets with repo agreements and trading derivatives.
(2) Includes assets with repo agreements.
(3) Ratios defined by the Bank of Portugal (instruction 23/2012).
(4) Considering average shareholders' equity and net asset values (13 observations).

8 BOARD OF DIRECTORS’ REPORT – 1st HALF 2016 CGD
HIGHLIGHTS
(%)
CREDIT QUALITY AND COVER LEVELS 2015-06 2015-12 2016-06
Overdue credit ratio 7.9% 7.6% 8.1%
Credit more than 90 days overdue ratio 7.4% 7.2% 7.4%
Non-performing credit ratio 9.7% 9.3% 9.8%
Non-performing credit (net) ratio (3) 2.6% 2.2% 2.3%
Credit at risk ratio (3) 12.4% 11.5% 12.2%
Credit at risk (net) ratio (3) 5.5% 4.5% 4.9%
Restructured credit ratio (5) 10.1% 10.0% 10.3%
Restr. crd. not incl. in crd. at risk ratio (5) 5.3% 5.6% 5.9%
Credit more than 90 days overdue coverage 99.1% 102.2% 103.2%
Crd. Imp. (P&L) / Loans & adv. custom. (aver.) 0.66% 0.78% 0.86%
STRUCTURE RATIOS
Loans & adv. customers (net) / Net assets 66.0% 65.2% 65.4%
Loans & adv. custom. (net) / Custom. dep. (3) 94.8% 90.1% 90.1%
SOLVENCY AND LIQUIDITY RATIOS (CRD IV/CRR)
Common equity tier 1 - includ. DTA (phased-in) 11.0% 10.9% 10.0%
Tier 1 - includ. DTA (phased-in) 11.0% 10.9% 10.0%
Total - includ. DTA (phased-in) 12.5% 12.3% 11.2%
Common equity tier 1 - includ. DTA (fully implemented) 9.8% 10.0% 9.2%
LEVERAGE AND LIQUIDITY RATIOS (CRD IV/CRR)
Leverage ratio (fully implemented) 5.6% 5.7% 5.2%
Liquidity coverage ratio 135.9% 143.1% 193.5%
Net stable funding ratio 134.4% 135.9% 133.4%
OTHER INDICATORS
Number of branches - CGD Group 1,225 1,253 1,221
Number of branches - CGD Portugal 760 764 729
(3) Ratios defined by the Bank of Portugal (instruction 23/2012). (5) Ratios defined by the Bank of Portugal (instruction 32/2013)
Note: Calculation of indicators as in the glossary:

CGD BOARD OF DIRECTORS’ REPORT – 1st HALF 2016 9
EVOLUTION OF CGD GROUP
1.2. Evolution of CGD Group
BRANCH OFFICE NETWORK
CGD Group’s branch office network, at the end of June 2016, comprised 1,221 branches
against an end of 2015 total of 1,253. This reduction reflected the furtherance of the
streamlining programme on CGD’s branch office network in Portugal, considering strategic
commitments to improve its levels of operational efficiency and rationalise its distribution
costs.
CGD (Portugal) had 729 units at the end of June 2016, comprising 663 branches with face-
to-face services (32 fewer than at the end of 2015), 40 self-service branches and 26 Caixa
Empresas “corporate offices”.
Banking coverage abroad was, at the same time, increased by 3 branches to a total of 491,
owing to the expansion of the Banco Comercial e de Investimentos (BCI) network, in
Mozambique, with an additional two branch offices and Banco Nacional Ultramarino, and in
Macau, with one new branch.
NUMBER OF GROUP BANK BRANCHES
2015-06 2015-12 2016-06
CGD (Portugal) 759 764 729
Physical branches 695 695 663
Self-service branches 38 43 40
Corporate offices 26 26 26
Caixa - Banco de Investimento (Lisbon+Madrid) 2 2 2
France Branch 48 48 48
Banco Caixa Geral (Spain) 110 110 110
Banco Nacional Ultramarino (Macau) 18 18 19
B. Comercial e de Investimentos (Mozambique) 171 191 193
Banco Interatlântico (Cape Verde) 9 9 9
Banco Comercial Atlântico (Cape Verde) 33 34 34
Mercantile Lisbon Bank Holdings (South Africa) 15 14 14
Banco Caixa Geral Brasil (Brazil) 2 1 1
Banco Caixa Geral Angola 37 40 40
Other CGD branch offices 21 22 22
Total 1,225 1,253 1,221
Representative offices (*) 12 12 12
(*) Including the representative office in Algeria pending the issue of a permit from the Algerian authorities.
HUMAN RESOURCES
CGD Group had 16,106 employees at the end of June 2016, down 94 over June 2015,
owing to the reduction of staff engaged in domestic operations (down 469 employees) in
conjunction with an increase of 375 employees engaged in international operations.

10 BOARD OF DIRECTORS’ REPORT – 1st HALF 2016 CGD
EVOLUTION OF CGD GROUP
NUMBER OF CGD GROUP EMPLOYEES
The international branch office network was also the reason for the increase in the total
number of employees in comparison to the end of 2015, owing to the expansion of the
Group’s activity in Africa and the Orient, namely in BCI Moçambique, with an additional 33
employees and Banco Caixa Geral Angola with a further 16 employees.
CAIXA BRAND, PRIZES AND AWARDS
Caixa Geral de Depósitos celebrated its 140th
anniversary on 10 April last when 21 branch offices
opened their doors to celebrate with the community
in which they operate, from north to south, including
Madeira and the Azores, promoting diverse local
activities such as exhibitions, musical events,
handicrafts, tertúlias (gatherings) and sharing
stories, animations and financial literacy activity
games for children.
The celebrations included a solidary book-collecting
action (comprising a total of 2,500 books) on behalf
of charitable institutions for children and old people.
The MRI (“Marktest Reputation Index”) ranked Caixa as the brand with the best reputation
in the Portuguese financial sector, in 2016, based on its assessment of the following
indicators: Familiarity, Credibility, Image, “WOM” (Word of Mouth), Admiration, Satisfaction
and Recommendation.
According to BrandFinance CGD was the most valuable brand in the Portuguese financial
sector, in 2016.
In CGD Group’s investment banking area, Caixa Banco de Investimento (CaixaBI)
renewed several of its international prizes in 2016, having additionally been awarded a
series of distinctions in respect of 2015:
Best Investment Bank in Portugal 2016 (Euromoney)
Best Investment Bank in Portugal 2016 (Global Finance)
Best Investment Bank in Portugal 2016 (World Finance)
Best Investment Bank in Portugal 2015 (EMEA Finance)
Best sovereign bond in Europe 2015 (EMEA Finance)
Best covered bond 2015 (EMEA Finance)
Best supranational private equity investment 2015 (EMEA Finance)
2015-06 2015-12 2016-06
Domestic activity 10,006 9,546 9,537
International activity 6,194 6,512 6,569
Total 16,200 16,058 16,106

CGD BOARD OF DIRECTORS’ REPORT – 1st HALF 2016 11
EVOLUTION OF CGD GROUP
Reference should be made to the following prizes in respect of the group’s international
activity
BNU Macau was considered the “Best Retail Bank – Macau” and the “Best Bank
for Social Responsibility – Macau” (IFM) in 2015
BCI was chosen as the “Best Retail Bank Mozambique 2015” and the “Best
Commercial Bank Mozambique 2015” by World Finance and IFM
BCA won the “Cape Verdean’s Brand of Confidence” award for the sixth
consecutive time in 2015” (Afrosondagem)
Caixa, centring its discourse on certainty and strengthening the values of trust, financial
strength and prestige, also introduced other attributes such as “innovative, modern and
young” it wishes to see reinforced in 2016.
In terms of institutional campaigns, reference should also be made to the strengthening of
the “Caixa. Of course.” concept, changing the communication to a more natural, relaxed,
simple tone.
Pursuant to the furtherance of its commercial and communicational strategy, the 1st half
year was marked by the following campaigns:
Launch of the new concept focusing on innovation and investment, two strategic
issues for Caixa, in 2016, with the objective of strengthening the obvious choice of
Caixa when deciding upon the best financial partner, based on the repetition of the
“Caixa. Of course” catchphrase;
RE Páscoa (Residents abroad Easter Campaign), for customers residing abroad in
which the new type of emigration is increasingly important;
Imóveis Caixa (“Caixa Property”) to provide information on specific conditions for
the purchase of residential or non-residential property from the Caixa portfolio;
Caixa 2020, information on Caixa’s support for companies interesting in applying
for the Portugal 2020 programme;
Sectoral offer, in the sphere of communication targeted at companies with the
launch of the first campaign focusing on internationalisation and exports.
SOCIAL RESPONSIBILITY
CGD’s sustainability strategy for the three year period 2015/2017 is in alignment with
the United Nations' Sustainable Development Goals (SDGs). The bank has been a
member of the SDG Coordinating Committee since March 2016.
CGD posted an improvement of 6% over 2013 in the DJSI-Dow Jones sustainability
index and is 2% from the lowest and 15% from the highest score, placing it in one of
the TOP 15 in the DJSI’s official report.
CGD was considered the most attractive place to work in the banking sector, according
to the “Portugal's Most Attractive Employers” ranking produced by Universum with the
backing of Universidade Católica and based on online searches and surveys of
university students. Reference should also be made to its 7th place in the general
classification.
In the sphere of the recognition of social responsibility practice 2016, the Associação
Portuguesa de Ética Empresarial (Portuguese Association of Corporate Ethics)
recognised CGD for its Young Volunteam and bank cards recycling projects which
were singled out as good social responsibility practices in the Voluntary and
Environmental categories (Reduction of Impacts), respectively.
12 BOARD OF DIRECTORS’ REPORT – 1st HALF 2016 CGD
EVOLUTION OF CGD GROUP
The Young VolunTeam programme is a voluntary programme for young people
promoted by Caixa Geral de Depósitos and developed in partnership with
ENTRAJUDA and Sair da Casca. It also relies upon the backing of the Directorate
General of Education of the Ministry of Education, Portuguese Institute for Sport and
Young People, the Youth in Action Programme of the European Commission and SEA
– Agência de Empreendedores Sociais (“Social Entrepreneurs Agency”). Since the
2014/2015 edition, the fact of benefiting from the support of the High Patronage of His
Excellency the President of the Republic has confirmed the value of this project,
reaffirming the objective of backing ideas with the future of Portugal as their primary,
basic element.
The 2015/16 edition of this programme, involving 2,185 young leaders or
“ambassadors”, had an impact on more than 9,000 students and raised more than
€25,000 and a metric tonne of pedagogical material.
Reference should be made, in respect of the bank cards recycling project, to the fact
that the 5 metric tonnes of cards collected permitted the production of the first items of
urban furniture which were delivered, in May, to two charitable institutions identified by
Entreajuda: the S. João das Lampas Social and Parochial Centre in Sintra (nursery,
pre-school, leisure time activities, day centre and old people’s home) and the
Brotherhood of S. Vicente de Paulo (pre-school and old people’s home) in Lisbon. The
same programme also saw the installation of 4 recycling bins (200 kilos of recycled
plastic) in the garden of CGD’s headquarters building, to incentivise selective waste
collection. This project was distinguished by Quercus with Caixa being considered as a
pioneer in the banking sector, and particularly so in the media with a presence in RTPs
Minuto Verde programme.
Reference should also be made to the consolidation of the Social Innovation pilot-
project with ASSIS (Social Solidarity and Social Welfare Association) to test the
acceptance of prepaid cards operating in a private payments system (exclusively for
pharmacies) which are credited by a platform of donations of funds for old people.

CGD BOARD OF DIRECTORS’ REPORT – 1st HALF 2016 13
ECONOMIC-FINANCIAL FRAMEWORK
1.3. Economic-Financial Framework
Early 2016 was marked by heightened fears over the cooling of the emerging market
economy countries, particularly in the case of China, owing to the doubts raised by the
impact of the sharp drop in the main commodity prices and, of no less relevance, the
tendentially less expansionary context of US monetary policy. Demand for lower risk assets
at the time in question fuelled across-the-board falls in world equity indices, with the MSCI
World Index sinking to its lowest level of almost three years, in mid February.
A gradual improvement in sentiment was, however, witnessed during the course of the first
quarter, as a consequence of the implementation of more incentives by Chinese
policymakers, the expected strengthening of monetary stimuli by the European Central
Bank (ECB) and the conviction that the US Fed would soften its key rate hike policy in
2016, in a context of plentiful liquidity.
There were also improvements in the evolution of consumer prices and assessments of
expectations regarding inflation, assuaging fears over a deflationary scenario in several
economies, in a period of the recovery of oil and other commodity prices in the international
marketplace and a stabilising of economic indicators in the emerging bloc.
Uncertainty levels, both political and economic, were once again raised by the result of the
end of June referendum in the United Kingdom (commonly referred to as “Brexit”), which
decided in favour of leaving the European Union. Several days of marked retraction in the
demand for risk assets and an increase in the demand for “safe” securities were followed
by a new upsurge in market sentiment owing to investors’ increased expectations to the
effect that the action of the main central banks would involve the strengthening of monetary
stimuli across the second half year.
Even prior to the advent of the Brexit scenario, the main central banks effectively continued
to focus on the ultra-accommodative policy in force across the last few years, with the
objective of reaccelerating economies and providing for deflationary scenarios. Even in the
US, whose monetary policy cycle is at a different stage and geared to rate hikes, the
uncertainties related with the international environment contributed towards the Fed's
adoption of a more prudent approach in its strategy for the normalisation of its key lending
rate.
The Bank of Japan, accordingly, set the tone, in January by setting negative deposit rates,
in a decision which was not only unheard of but also unexpected. Other central banks in
developed economies such as Australia, New Zealand, Norway and Switzerland also
announced cuts in their key reference rates.
Several central banks in the emerging economies, particularly India, Russia and Indonesia,
also changed the level of their respective key reference rates, in the vast majority of cases,
downwards. In China, the central bank announced a reduction of 50 bps in the reserves
ratios of the major as well as the smaller banks, to 17.0% and 15.0%, respectively.
In the Euro Area, the ECB strengthened its monetary stimuli, by reducing its key reference
rates in March. The deposit rate was down 10 bps to -0.40%, with the interest rate on the
main refinancing operations being reduced by 5 bps to 0%. The ECB's council of governors
also voted in favour of a €20 billion/month expansion of the quantitative easing programme
to €80 billion and the expansion of its corporate assets purchase programme in addition to
the launch of an additional four LTROs.
In growth terms, several supranational bodies downgraded their projections for worldwide
GDP growth in 2016, to close to 3.0%, as in 2015. Contributory factors were the slowdown
in the US and particularly the slow rate of first quarter growth (no more than a consecutive,

14 BOARD OF DIRECTORS’ REPORT – 1st HALF 2016 CGD
ECONOMIC-FINANCIAL FRAMEWORK
annualised 0.8%), with the second quarter also turning out to be modest in accordance
with the initial estimate. The situation was reversed in the dynamics of other geographies
which produced a surprisingly positive first quarter, as in the case of the Euro Area and
Japan, with deceleration in the second quarter or even stagnation, in the case of Japan.
The US, following disappointing first quarter GDP growth, witnessed an improved level of
economic activity in the second quarter, driven by household consumption and the
construction sector. The performance of the labour market albeit continuing to create jobs
at a high rate, was more moderate in comparison to the preceding halves. A particularly
negative reference should be made to gross fixed capital formation whose performance
was, once again lower than expected. As regards inflation, the underlying growth of
consumer prices in the six months up to June always remained above the 2.0% mark
(closing the half at 2.3%). The last time this occurred was in second half 2008.
Reference should be made to first quarter growth (a consecutive not annualised 0.6%) in
the Euro Area. This was higher than posted in the US and UK and had only happened
once over the last five years. Special reference should be made to the strong contribution
of domestic demand. The sentiment indicators of businesspeople and consumers remained
stable in the second quarter of the year, and, albeit consistent with a moderating level of
economic activity, continued to perform better than in other developed or emerging market
economy countries. A particularly positive reference should be made to the recovery of
lending. As regards inflation, the year-on-year change, which slipped into negative territory
on several occasions ended the half at 0.1%. This was, even so, less than at the end of the
preceding year and, for the forty first month, less than the ECB's objective of 2.0%.
GDP in Portugal was up by a consecutive, not annualised 0.2%, both in the first and
second quarter, as at the end of 2015, decelerating year-on-year from 1.3% to 0.8%, its
lowest level in six quarters Recovery continued to be speared by domestic demand,
particularly private consumption. The second quarter unemployment rate of 10.8% was at
its lowest value since first quarter 2011. The year-on-year change in inflation remained in
positive territory across the whole of the first half at an average 0.5%, in line with the
annual average in 2015.
The addition of fresh monetary stimuli to the Euro Area economy by the ECB, with inflation
remaining at low levels, expectations of moderate economic growth and one-off
movements of risk aversion, continued to translate into low and falling 10 year yields, which
accentuated even further after the results of the UK referendum were announced. At the
end of June, new minimum lows were reached in Germany, with negative rates for the first
time, as in France and the United Kingdom.
Yields in the peripheral countries continued to benefit from ECB backing, falling to their
lowest levels in just over a year in Spain and Italy at the end of June. Higher risk premia
were, however, demanded, across the first two quarters of the year, comprising higher
spreads on the respective rates in comparison to the German benchmark. This increase
was more marked in the case of Portugal where, as opposed to its peers, the respective
yield posted an increase across first half 2016, having inclusively, in February, exceeded
4.0%, its highest since early 2014.
The strengthening of the accommodative nature of the ECB's monetary policy and fresh
reduction of key lending rates helped to maintain Euribor rates and, inclusively accentuate
their downwards trend. The main maturities, all of which in negative territory, fell to new
minimum lows.
In a half year marked by the volatility of prices of financial assets, the foreign exchange
market was no exception. The euro continued to trend to appreciation against the dollar, in
line with the decline in investors’ expectations of the diminishing probability of the Fed’s
announcement of a new increase in its lending rate, in June, in an environment marked by

CGD BOARD OF DIRECTORS’ REPORT – 1st HALF 2016 15
ECONOMIC-FINANCIAL FRAMEWORK
economic improvement in the Euro Area. The 2.2% appreciation recorded in the first half
was, however, insufficient to cancel out the depreciation of more than 2.5% noted in the
last six months of last year.
Reference should also be made, in the first half, to the significant 14.4% appreciation of the
Japanese yen. This derived, on the one hand, from the absence of new measures taken by
the Bank of Japan after January and, on the other, its nature as a safe haven in times of
increased uncertainty. In this context, following Brexit, the Japanese currency reached its
highest level of the last two years. The result of the referendum in the United Kingdom had
a substantial effect on sterling which posted an accrued depreciation of 11.1% and 8.9%
against the dollar and euro, respectively, over the two days following the holding of the
referendum, closing the half year at a 31 year low against the US currency.
Of the main share indices in the developed economies, only the US S&P 500 and UK’s
Footsie 100 made half yearly gains of 1.0% and 3.0%. On the contrary, in the case of the
countries on the European periphery, share indices closed the half year with accumulated
losses of 20.8% in the case of Greece, which was only surpassed by the Italian index’s
losses of 24.4%, the latter having been heavily penalised by the uncertainties existing in
the local financial sector. Half yearly losses of 16.2% on the PSI20, were higher than the
losses of 9.8% by Eurostoxx600 and 9.9% by Germany’s DAX. Spain’s IBEX was also
down 14.5%.
Performance among the BRICs was positive, with the exception of the Chinese Shanghai
index with first half losses of 17.2% following its second half losses of 17.3%. Particularly
significant were the 7.4% increase in the Russian financial market and 18.9% increase in
the case of Brazil's Bovespa.
16 BOARD OF DIRECTORS’ REPORT – 1st HALF 2016 CGD
OPERATING SEGMENTS
1.4. Operating Segments
1.4.1. COMMERCIAL BANKING
Caixa retained its strategic focus on its backing for companies and developing its level of
service in 1st half 2016, strengthening the quality of its customer care and improving its
customer ties, loyalty and satisfaction.
Also herein and considering the strategic commitments to strengthen its levels of
operational efficiency and rationalise its distribution costs, CGD furthered its Transforma
project, aimed at improving the efficiency of its branch office network, leveraging quality of
service and reducing costs by optimising the management of its human and physical
resources. The domestic physical retail network therefore totaled 663 “universal” (i.e.
general) branch offices at the end of June 2016 (32 fewer than at the end of 2015) and 26
Caixa Empresas “corporate offices” to a grand total of 689 branch offices plus 40 self-
service branches.
Notwithstanding this reduction, Caixa continued to be the only bank with a branch office
network having a physical presence in all municipal districts on national territory. It
continues to focus on positive differentiation in terms of customer experience and
commercial dynamics, by expanding dedicated management services to cover around 1
million individual and corporate customers.
1.4.1.1. CUSTOMER SEGMENTATION
CGD’s commercial dynamics in the corporate segment continued to focus on consolidating
its Caixa Empresas service model, underpinned by a personalised customer care and
financial advisory service for SMEs, based on a proprietary network of 26 offices with 97
dedicated account managers as well as for self-employed businesspeople and micro-
enterprises, with a team of 322 dedicated account managers and Caixa Empresas spaces
at CGD branch offices.
Individual customer management focuses on the following segments:
Affluent: 969 customer account managers (226 with a customer portfolio in more
than 1 branch office) for around 230 thousand Caixazul customers at 656 branch
offices;
Mass Affluent: 680 thousand customers managed by 1,328 commercial assistants
at 637 branch offices and 18.5 thousand with personalised distance management
provided by 16 commercial assistants;
Residents abroad: 7 customer account managers managing 2.5 thousand
customers (Caixazul Internacional) and 12 commercial assistants for 22.6
thousand customers (Caixadirecta Internacional);
Caixadirecta Mais: 12 commercial assistants managing 14.5 thousand recent
graduate customers who are entering the labour market;
Universal: transversal to the branch office network, thru 663 branches with face-to-
face services in June.

CGD BOARD OF DIRECTORS’ REPORT – 1st HALF 2016 17
OPERATING SEGMENTS
1.4.1.2. COMPANIES
Commercial promotions for companies were centred on a campaign structure comprising a
sectoral offer geared to customer relationships and designed to improve the level of service
provided and the partnership relationship deriving from global involvement between Caixa
and the company. At the same time, Caixa monitored the cross-border business of its
“internationalised” companies for the markets in which it has a presence, directly backing
local investment projects.
This structure is organised into 3 structuring segments: finding new customers; retaining
the loyalty of current customers and adding value (focusing on profitability of customers).
To back companies in all aspects of their activity, the enhanced commercial dynamics were
based on contracting for financial limits for the treasury support function, foreign trade
operations, commercial discounting, credit card limits and the acquisition of current
equipment and issuance of bank guarantees, improving quality of service and optimising
customer response times.
Caixa took a series of steps to enhance its offer, namely:
The launch of Caixa Comércio e Serviços [“Commerce and Services”] package, as
an integrated banking products and services solution, including POS, with special
prices for one-off sales of products and payment of a fixed instalment;
Launch of new line of Support Credit for the Qualification of the Offer for
Companies in the Tourism Sector designed to strengthen its offer to companies in
one of the sectors making the largest contribution to domestic GDP growth;
Boosting and promotion of several special/governmental lines of credit which
particularly include the PME Crescimento [“SME Growth”] line 2015, with the
objective of backing the growth and internationalisation of domestic companies.
Its commitment to these lines of credit has given Caixa the status as the
Portuguese bank financing Portuguese companies, owing to its lead of the SNGM
(National Mutual Guarantee System) and PME Crescimento [“SME Growth ”] lines;
Promotion of the EIB 2015 line of credit for a broad range of projects, with
extended maturities and price reductions based on the existence of commercial
relationships in which more than 90% of the agreed €300 million has already
been used;
Broadening of consultancy service partnerships, to the PDR (Regional
Development Programme), POSEUR (Operational Programme for Sustainability and the
Efficient Use of Resources) and POCI (Operational Programme for Competitiveness and
Internationalisation) programmes, to provide the branch office network with
alternatives to strengthen support/advisory services for corporate customers, in
the sphere of the Portugal 2020 programme;
Caixadirecta Empresas provided a file conversion service to assist companies in
the application of EU regulation 260/2012 under which all direct credit and debit
transfers in euros must use the same format.

18 BOARD OF DIRECTORS’ REPORT – 1st HALF 2016 CGD
OPERATING SEGMENTS
Caixadirecta Empresas
There was a significant evolution of the range of functionalities of the Caixadirecta
Empresas corporate banking channel. Particular reference should be made to: the viewing
feature on renting agreements entered into with Locarent; stock exchange and investment
funds trading and the viewing feature on leasing agreements entered into with Caixa
Leasing e Factoring. This evolution made a decisive contribution to the 9.8% growth in the
number of frequent use contracts and increase in operations and amounts traded (up
12.4%), over the same period 2015.
1.4.1.3. INDIVIDUAL CUSTOMERS
Caixa’s developed its offer of solutions for the individual customers segment to facilitate
day-to-day financial management, the performance of projects, protection and
safeguarding of the future, based on customers’ financial profiles. “Involvement recovery
actions” enabling Caixa to identify the main reasons for the break in the relationship and
the provision of information on the most adequate offer for customers were also launched.
With the objective of providing continuity to the strategic priority of retaining and finding
new resources with adequate returns and retaining them on maturity, Caixa launched
several savings and investment solutions in first half 2016, covering its various types of
products (integrated deposits, funds and financial insurance).
In 1st half 2016, in the sphere of its usual pricing reviews, adjustments were made to its
global deposits offer on several maturities and deposit-type families and several
characteristics of its standard term deposits and savings offer were reformulated.
Forty one short and medium term indexed deposits with guaranteed capital on maturity and
varied interest structures were commercialised. These included, inter alia, interest rates on
shares, share indices, exchange rates and commodities. The launch of 5 of these deposits
was associated with Caixa’s 140th anniversary celebrations, “Woman’s Month” and “Family
Month” with 60 free tickets for Lisbon Zoo, as well as in the sphere of the Easter campaign
for residents abroad.
Two medium/long term capitalisation insurance products with a guarantee of capital and
fixed interest on maturity were commercialised in the financial insurance sphere. There
were also three promotional actions for the Leve PPR retirement pension plan. A new
insurance product in the form of unit-linked insurance, comprising an individual life
insurance policy linked to long term investment funds, classified as a “structured savings
instrument” and as a “complex financial product” were also launched. Three medium/long
term unit-linked funds with a green graphic alert – 1, with guaranteed capital and fixed
interest on maturity were commercialized.
There were also six monthly actions to promote Caixa’s standing range of investment funds
and four monthly actions to promote its standing range of three pension funds.
Reference should also be made to the following initiatives:
Participation in the Benfica Sports Club (“Benfica SAD”) 2016-2019 public
subscription offer;
Participation in the Portuguese Republic’s variable interest May 2021 treasury
subscription offer issued by IGCP.
A campaign, based on customers’ profiles with solutions designed to facilitate day-to-day
financial management was launched. Special reference should be made to wage deposit
accounts and their associated benefits. Work also began on a commercial action, to
increase the integrated sale of debit cards and Caixadirecta, when opening new current
accounts.

CGD BOARD OF DIRECTORS’ REPORT – 1st HALF 2016 19
OPERATING SEGMENTS
As regards the project performance initiatives and the protection and safeguarding of the
future, reference should be made to the launch of the campaigns geared to specific
customer segments, to increase business and generate emotional and relational
involvement:
Women’s Month – promotion of solutions geared to women to safeguard and plan
for the future (Caixa Woman March 2019 deposit and Seguro Caixa Woman and
prestige products valued by the segment;
Fathers’ Day – advertising of prestige products with preferred conditions based on
use of the credit card;
Family month – communication of offer geared to families, with associated
advantages such as Caixa Proteção Familiar insurance with a discount on
annuities and Depósito Cabaz Família 2019_PFC, with free tickets for Lisbon Zoo;
Easter and summer campaigns for residents abroad: focusing on the association
with Portugal, diversification of savings and unrestricted worldwide access to
Caixa;
Split payments campaign associated with the summer festivals: free tickets for
customers who split up their payments when using home banking – promotion of
the advantages of Caixa credit cards;
CGD continued to play an important role in the university segment as a higher education
support bank across first half 2016, in the form of the promotion of knowledge and
academic merit comprising:
Activation campaigns for products targeted at students (savings, Caixa IU, Caixa
ISIC and wage deposit accounts) with fresh information on changes to personal
data at the time of each contact;
Contacts with customers who no longer have a university card (Caixa IU),
incentivising the use of wage deposit accounts and activating a replacement card;
Sending of a monthly offer comprising 10 additional discount vouchers for
vantagenscaixa partners, via Caixadirecta messages, incentivising the activation of
the home banking service;
Commercial actions at higher educational establishments having agreements with
CGD, with information on products and the advantages of Caixa in higher
education for professionals or students, subscribing for the issue of an ID card;
Presence at academic weeks in Bragança, Minho, Porto, Aveiro, Lisbon and Faro
with an action to boost and activate the Caixa PLIM and Caixadirecta apps, with
the objective of finding new users.
Caixadirecta
This channel allows individual customers to use their accounts via web, telephone, mobile
phone, sms and Windows, Android and iOS apps as well as smartwatches. 1st half 2016
witnessed an increase in the number of frequent use contracts and more than 205 million
operations (up 6.5% year-on-year 2015).
Starting February, Caixadirecta provided for subscriptions to the new 3D Secure
authentication method permitting the use of SMS Token accreditation to safely validate all
internet purchases.

20 BOARD OF DIRECTORS’ REPORT – 1st HALF 2016 CGD
OPERATING SEGMENTS
1.4.1.4. MEANS OF PAYMENT
Caixa continues to have the largest share of the domestic market for bank cards, in the
means of payment and services area. Portfolio management initiatives designed to keep
pace with the new regulatory framework and continuing to cut costs were strengthened in
2016.
In terms of new electronic commerce services, Caixa upgraded its 3D Secure service for
cards using the MasterCard/Maestro and Visa/Visa Electron network to optimise the
security of online payments and improve levels of usability.
1.4.1.5. RESOURCES
Caixa launched various campaigns across the first six months of 2016, designed to take in
and diversify resources with the objective of continuing to afford strategic priority to
retaining and taking-in suitably profitable resources. In addition to its presentation of
savings and investment solutions for various types of products (deposits, automatic
savings solutions, tracker deposits, financial insurance and funds), Caixa also revised its
pricing, as part of its deposit facilities price adjustments process.
In overall Group terms, the resources-taken balance (excluding the interbank market) at
the end of June 2016 amounted to €108,436 million, i.e. a 0.6% reduction of €609 million in
comparison to the same date in 2015. The balance sheet resources balance was very
similar to the preceding year (up 0.1%).
RESOURCE-TAKING BY GROUP – BALANCES (million euros)
2015-06 2015-12 2016-06 Total (%) Total (%)
Balance sheet 80,838 82,555 80,958 120 0.1% -1,597 -1.9%
Retail 71,850 74,494 73,490 1,640 2.3% -1,004 -1.3%
Customer deposits 69,818 72,996 72,065 2,247 3.2% -931 -1.3%
Other customer resources 2,032 1,498 1,425 -607 -29.9% -73 -4.9%
Institutional investors 8,088 7,161 6,568 -1,519 -18.8% -593 -8.3%
EMTN 2,346 1,456 1,086 -1,260 -53.7% -370 -25.4%
Covered bonds 5,557 5,584 5,412 -145 -2.6% -172 -3.1%
Other 185 121 70 -115 -62.1% -51 -41.9%
Portuguese state - Conting. convert. bonds 900 900 900 0 0.0% 0 0.0%
Off-balance sheet 28,207 28,525 27,478 -729 -2.6% -1,046 -3.7%
Investment funds 3,936 4,186 3,698 -238 -6.1% -488 -11.7%
Real estate investment funds 1,292 1,246 1,160 -132 -10.2% -86 -6.9%
Pension funds 3,343 3,414 3,315 -28 -0.8% -99 -2.9%
Wealth management 19,636 19,679 19,305 -331 -1.7% -373 -1.9%
Total 109,045 111,080 108,436 -609 -0.6% -2,644 -2.4%
Total (excl. inst. inv. and Portuguese state) 100,057 103,018 100,968 911 0.9% -2,051 -2.0%
Change Change
2016-06 vs 2015-06 2016-06 vs 2015-12
Off-balance sheet assets under management were down 2.6% by €729 million over June
2015 to €27,478 million. A particularly significant contributory factor was the 1.7% reduction
of €331 million in amounts allocated to wealth management.
Not considering resources taken from institutional investors and CoCo bonds, the year-on-
year change was up 0.9% by €911 million.
The Group’s customer deposits were up 3.2% by €2,247 million year-on-year to €72,065

CGD BOARD OF DIRECTORS’ REPORT – 1st HALF 2016 21
OPERATING SEGMENTS
million.
CUSTOMER RESOURCES – BALANCES (million euros)
2015-06 2015-12 2016-06 Total (%) Total (%)
Customers deposits 69,818 72,996 72,065 2,247 3.2% -931 -1.3%
Sight deposits 21,778 25,198 25,070 3,292 15.1% -128 -0.5%
Term and savings deposits 47,734 47,490 46,693 -1,041 -2.2% -797 -1.7%
Mandatory deposits 306 309 302 -4 -1.2% -6 -2.0%
Other resources 424 430 377 -48 -11.2% -53 -12.3%
Total 70,242 73,426 72,442 2,199 3.1% -984 -1.3%
Change Change
2016-06 vs 2015-06 2016-06 vs 2015-12
By category, term deposits and savings accounts amounting to €46,693 million at the end
of June stabilised in comparison to the end of 2015 at around 65% of total customer
deposits.
The customer deposits balance in CGD Portugal was up 2.5% by €1,341 million in the
same period, benefiting from the highly favourable performance of individual customers’
deposits which were up 4.7% by €2,101 million. The corporate segment also witnessed a
1.8% positive change of €106 million, over the preceding year. The 0.9% reduction of €502
million over December 2015 derived from one-off movements of major institutional
customers, although individual customers’ deposits were up 1.7% by €807 million.
The international area with €16,616 million (up 4.7% over June 2015) also continued to
make a highly favourable contribution to the deposits total. Particular reference should be
made to the branches in Asia and Spain.
CUSTOMER DEPOSITS IN THE INTERNATIONAL AREA
(%)
Spain16%
France14%
Asia41%
PALOP22%
Other7%
PALOP - Portuguese language speaking african countries
The market share of customer deposits therefore remained dominant in Portugal,
increasing since the start of the year from 28.2% to 28.5% in June 2016, particularly
individual customers’ deposits with 31.6%.

22 BOARD OF DIRECTORS’ REPORT – 1st HALF 2016 CGD
OPERATING SEGMENTS
CUSTOMER DEPOSITS – MARKET SHARES (PORTUGAL)
BY CUSTOMER SEGMENT (%)
2015-06 2015-12 2016-06
Corporate 11.8% 11.6% 12.6%
General government 35.2% 30.4% 34.8%
Individual customers 31.6% 31.8% 31.6%
Emigrants 39.2% 40.4% 41.2%
Total 28.3% 28.2% 28.5%
The debt securities balance, influenced by the maturity of several EMTN programme
issuances, was down 8.7% by €583 million over the end of 2015.
DEBT SECURITIES (million euros)
2015-06 2015-12 2016-06 Total (%) Total (%)
EMTN programme issues (a) 2,358 935 590 -1,767 -75.0% -345 -36.9%
Covered bonds 5,557 5,584 5,412 -145 -2.6% -172 -3.1%
Other 255 181 114 -141 -55.1% -66 -36.7%
Total 8,170 6,700 6,117 -2,053 -25.1% -583 -8.7%
Change
2016-06 vs 2015-06 2016-06 vs 2015-12
Change
(a) Does not include issuances classified as subordinated liabilities.
Subordinated liabilities remained stable (down 1.2% over the end of 2015) at €2.4 billion.
SUBORDINATED LIABILITIES (million euros)
2015-06 2015-12 2016-06 Total (%) Total (%)
EMTN programme issues (a) 1,047 1,056 1,026 -21 -2.0% -29 -2.8%
Contingent convertible (Coco) bonds 900 900 900 0 0.0% 0 0.0%
Other 479 473 473 -6 -1.2% 0 0.0%
Total 2,426 2,429 2,400 -26 -1.1% -29 -1.2%
Change
2016-06 vs 2015-06 2016-06 vs 2015-12
Change
(a) Does not include issuances classified as debt securities.
1.4.1.6. CREDIT
CGD has continued to have a very high and comprehensive level of involvement in backing
the investment projects of major Portuguese enterprises (micro, SME and major
enterprises), in 2016, translating into €934 million of funding for new medium and long
term operations in first half 2016.
The economic environment in Portugal and its main Eurozone trading partners has
conditioned corporate demand for credit, both in terms of amounts and type.
Notwithstanding the fact that CGD is fulfilling its guideline strategy for funding small and
medium sized enterprises, as shown by the year-on-year growth of new operations, both
on the individual customers and corporate network (up 3%), and the “corporate office”
network (up 3%), in the areas of commerce and industry, it has still not been possible to
restore the portfolio’s natural rate of maturities. There was a year-on-year portfolio
decrease of 1.0%, across all companies, in the first six months of 2016, influenced by
contraction in the institutionals segment.

CGD BOARD OF DIRECTORS’ REPORT – 1st HALF 2016 23
OPERATING SEGMENTS
Around €165 million in new loans were issued in the first six months of 2016 in the sphere
of PME Investe/Crescimento [“SME Invest/Growth”] lines of credit to a total of €1,512 million
in portfolio loans at the end of June 2016.
Caixa is the market leader in terms of the amount of funding authorised under the PME
Crescimento [“SME Growth”] 2015 line with an 18.1% share, coming in 2nd place in the
number of authorised operations with a market share of 15.4%.
Notwithstanding strong competition from banks in the corporate segment in Portugal, there
was an expressive increase in CGD’s market share of credit in this segment from 17.7% in
December 2015 to 17.9% in June 2016. Reference should be made to the market share of
credit for “more than 5 years” which increased from 20.9% to 21.3%, in the same period.
MARKET SHARES – LOANS AND ADVANCES TO COMPANIES (PORTUGAL)
(%)
15.5%
16.4% 16.4%
17.3%
18.1% 18.1%
17.7%17.9%
14%
15%
16%
17%
18%
19%
2008-12 2009-12 2010-12 2011-12 2012-12 2013-12 2015-12 2016-06
In consolidated terms, loans and advances to customers (gross) were down 1.0% by €702
million to €70,674 million between December 2015 and June 2016.
LOANS AND ADVANCES TO CUSTOMERS - CONSOLIDATED (a)
(million euros)
2015-06 2015-12 2016-06 Total (%) Total (%)
Companies 29,891 29,860 29,777 -114 -0.4% -83 -0.3%
General government 5,571 5,462 5,499 -72 -1.3% 37 0.7%
Individual customers 36,393 36,053 35,398 -995 -2.7% -656 -1.8%
Mortgage loans 33,325 32,995 32,505 -820 -2.5% -491 -1.5%
Other 3,068 3,058 2,893 -175 -5.7% -165 -5.4%
Total 71,855 71,376 70,674 -1,181 -1.6% -702 -1.0%
2016-06 vs 2015-12
Change Change
2016-06 vs 2015-06
(a) Consolidated Activity. Before impairment and including repurchase agreements.
Loans and advances to customers of CGD Portugal totaled €52,788 million, representing
around 75% of the Group’s total. Corporate credit was a slight 0.2% up over the beginning
of the year.
As regards other Group units, reference should be made to international activity’s loans
and advances to customers (gross) of €15,140 million at the end of first half 2016. In
Europe reference should be made to growth in BCG Spain, up 7.1% by €213.6 million over
the preceding year. In Africa, BCG Angola posted a 36.0% increase of €138.4 million over

24 BOARD OF DIRECTORS’ REPORT – 1st HALF 2016 CGD
OPERATING SEGMENTS
June last year. In Asia reference should be made to the 8.3% growth of €234 million in the
BNU Macau portfolio.
In the case of consolidated operations, lending to companies was down 0.3% by €83
million over December 2015, translating a lesser degree of CRE (“commercial and real
estate”) operations which were down 6.4% by €725 million. At the same time, reference
should be made to the extractive and manufacturing industries which were up 8% by €303
million.
LOANS AND ADVANCES TO CORPORATE AND INSTITUTIONAL SECTORS -
BY SECTORS OF ACTIVITY (a)
(million euros)
2015-06 2015-12 2016-06 Total (%) Total (%)
Agriculture, forestry and fishing 470 505 578 108 22.9% 73 14.5%
Mining and manufacturing 3,874 3,805 4,108 234 6.0% 303 8.0%
Construction and real estate activities 11,614 11,412 10,687 -927 -8.0% -725 -6.4%
Electricity, gas and water 1,399 1,451 1,351 -48 -3.4% -100 -6.9%
Wholesale and retail trade 2,950 3,134 3,240 290 9.8% 106 3.4%
Transports and warehousing 1,151 1,169 1,141 -10 -0.9% -28 -2.4%
Financial activities and other 8,433 8,383 8,672 239 2.8% 289 3.4%
Total 29,891 29,860 29,777 -114 -0.4% -83 -0.3%
Change Change
2016-06 vs 2015-06 2016-06 vs 2015-12
(a) Consolidated Activity. Before impairment and including repurchase agreements.
LOANS AND ADVANCES TO CORPORATE – JUNE 2016
(%)
Construction & real estate
actv.35.9%Mining &
manufacturing13.8%
Electricity, gas and water
4.5%
Trade10.9%
Transports and
warehousing3.8%
Financial actv. and other
31.1%
The loans and advances to individual customers balance of €35,398 million at the end of
the 1st half was down 1.8% by €656 million over December 2015, particularly deriving from
the 1.5% decrease of €491 million in mortgage lending, owing to the fact that the volume of
repayments and settlements was higher than the amount of new operations.
There were 6,995 new mortgage lending operations in first half 2016 in CGD (Portugal)
comprising a 67.6% increase of €257 million over first half 2015 to €637.5 million.

CGD BOARD OF DIRECTORS’ REPORT – 1st HALF 2016 25
OPERATING SEGMENTS
MORTGAGE CREDIT PORTFOLIO - BRANCH OFFICE NETWORK (PORTUGAL)
NEW OPERATIONS
(million euros)
380.5
637.5
0.0
100.0
200.0
300.0
400.0
500.0
600.0
700.0
2015-06 2016-06
67.6%
Caixa continued to take various steps to promote and commercialise real estate not used
for its principal activity and real estate built with Caixa finance, in first half 2016, providing
customers with special financing terms with a more attractive fixed rate across the first 5 or
10 years of the agreement and a reduction of the spread on the operations and extended
repayment periods, across the remaining period of the agreement.
CGD had a 21.9% market share of loans and advances to customers in June 2016, similar
to the 21.8% posted at the start of the year.
LOANS AND ADVANCES TO CUSTOMERS – MARKET SHARES (PORTUGAL)
BY CUSTOMER SEGMENT
(%)
2015-06 2015-12 2016-06
Corporate 18.1% 17.7% 17.9%
Individual customers 23.4% 23.5% 23.4%
Mortgage loans 26.4% 26.5% 26.4%
Consumer 6.4% 7.0% 7.8%
General government 30.8% 33.0% 34.4%
Total 21.9% 21.8% 21.9%
1.4.2. INVESTMENT BANKING
Caixa – Banco de Investimento, S.A.’s good performance in its core business, as
evidenced by its leading positions in the main sector rankings, continued to be recognised
by international analysts. CaixaBI was, once again, the winner of the “Best Investment
Bank in Portugal” international prizes from the prestigious Euromoney, Global Finance and
World Finance organisations, in 2016, having also been distinguished by a series of Emea
Finance awards for 2015.
A regards activity, CaixaBI achieved total operating income of €31.9 million in its statutory
accounts, in the first six months of the year in which contributory factors were net interest
income of €10.4 million, net commissions of €17.5 million and income from financial assets
of €4.4 million. Cost-to-income was 37.2%, with provisions and impairment of €14.7 million
in the period.

26 BOARD OF DIRECTORS’ REPORT – 1st HALF 2016 CGD
OPERATING SEGMENTS
As regards the activity performed during the period, reference should be made to CaixaBI’s
financial advisory services on the disposal of the full amount of the equity capital of Prado –
Cartolinas da Lousã and the full amount of the equity capital of Sagrotel. Reference should
also be made to the restructuring of SAG Group and its respective financial liabilities, in
which the Bank was the financial advisor in the M&A and structured finance areas.
Reference should be made, in the structured finance sphere, to the structuring and
organisation of the process for reorganising the financial liabilities of Spain’s Blinker Group.
In terms of capital market operations, reference should be made to the continued
leadership of the Bloomberg ranking for advisory services on bonds issued by domestic
entities and particularly its role as joint lead manager and bookrunner for the syndicated
placement of the new Portuguese Republic 10 year benchmark (PGB 2.875% maturing in
2026) in addition to the Brisa and REN eurobond issuances. Reference should also be
made to its role of joint global coordinator for the Portuguese Republic’s first retail issuance
of variable income treasury bonds.
Reference should also be made to the organisation and lead of the bond issuances of
Secil, Mystic Invest (inaugural issuance), Sonae, Altri/Celbi, The Navigator, Semana and
Sonae Investimentos, in addition to the joint lead for the Autonomous Region of Madeira
issuance.
As a specialised securities trader, CaixaBI was also involved in the public debt auctions of
9 March (PGB 3.85% 2021 and PBG 2.875% 2026), 23 March (PGB 3.85% 2021 and
PGB 3.875% 2030), 11 May (PGB 2.875% 2026) and 8 June (PGB 3.85% 2021 and PGB
2.875% 2026).
As regards venture capital activity, comprising five funds under management, 135
investment opportunities were analysed in the half year, with 18 operations, corresponding
to a potential investment of around €15.9 million, having been approved. Reference should
also be made to the second edition of the Caixa Empreender Award, in which the seven
projects selected for funding in the sphere of the acceleration programmes involving the
partnership with Caixa Capital were presented.
1.4.3. SPECIALISED CREDIT
At the end of June 2016 the estimates disclosed by Associação Portuguesa de Leasing,
Factory e Renting, concerning the performance of the property leasing, equipment leasing
and factoring sectors revealed positive trends, with year-on-year growths of 29.8%,11.3%
and 9.2%, respectively.
Caixa Leasing e Factoring
Caixa Leasing e Factoring, Instituição Financeira de Crédito, S.A. (CLF) represents CGD
Group in the specialised credit sector and operates in the financial leasing (property and
equipment), factoring and consumer credit sectors.
The performance of the company’s commercial operations was positive in first half 2016,
particularly in the leasing and confirming areas.
CGD BOARD OF DIRECTORS’ REPORT – 1st HALF 2016 27
OPERATING SEGMENTS
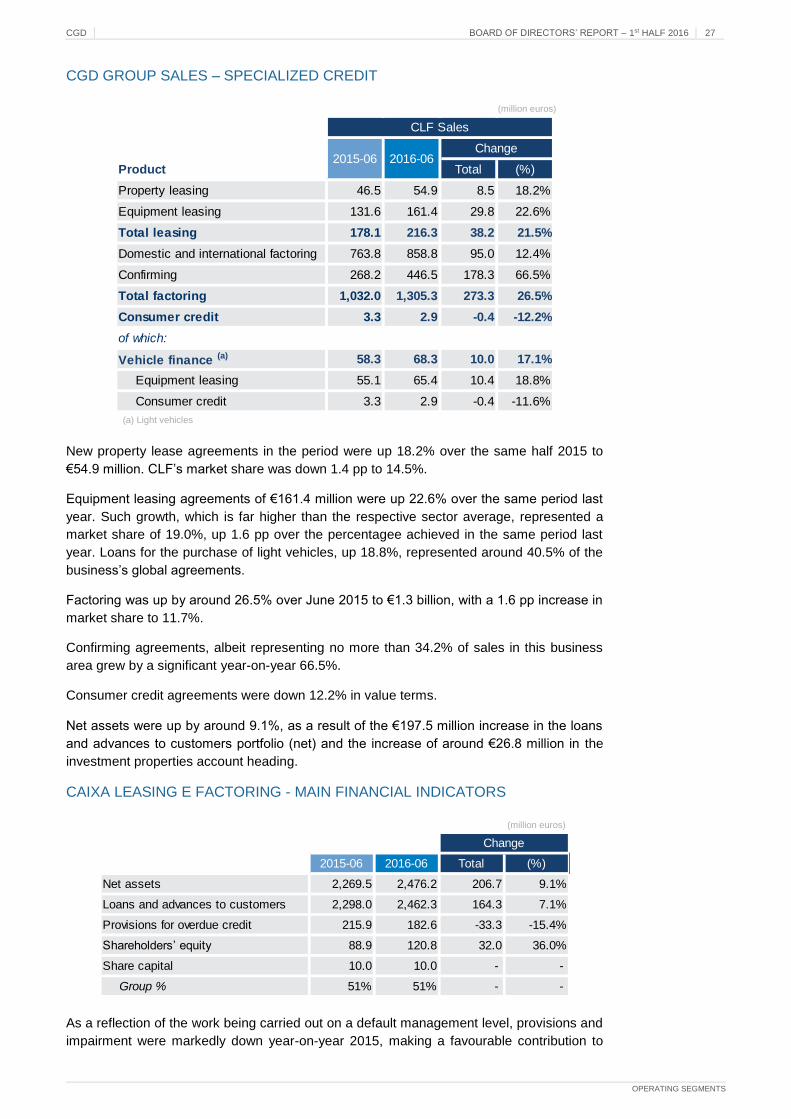
CGD GROUP SALES – SPECIALIZED CREDIT
(million euros)
Product Total (%)
Property leasing 46.5 54.9 8.5 18.2%
Equipment leasing 131.6 161.4 29.8 22.6%
Total leasing 178.1 216.3 38.2 21.5%
Domestic and international factoring 763.8 858.8 95.0 12.4%
Confirming 268.2 446.5 178.3 66.5%
Total factoring 1,032.0 1,305.3 273.3 26.5%
Consumer credit 3.3 2.9 -0.4 -12.2%
of which:
Vehicle finance (a) 58.3 68.3 10.0 17.1%
Equipment leasing 55.1 65.4 10.4 18.8%
Consumer credit 3.3 2.9 -0.4 -11.6%
CLF Sales
2015-06 2016-06Change
(a) Light vehicles
New property lease agreements in the period were up 18.2% over the same half 2015 to
€54.9 million. CLF’s market share was down 1.4 pp to 14.5%.
Equipment leasing agreements of €161.4 million were up 22.6% over the same period last
year. Such growth, which is far higher than the respective sector average, represented a
market share of 19.0%, up 1.6 pp over the percentagee achieved in the same period last
year. Loans for the purchase of light vehicles, up 18.8%, represented around 40.5% of the
business’s global agreements.
Factoring was up by around 26.5% over June 2015 to €1.3 billion, with a 1.6 pp increase in
market share to 11.7%.
Confirming agreements, albeit representing no more than 34.2% of sales in this business
area grew by a significant year-on-year 66.5%.
Consumer credit agreements were down 12.2% in value terms.
Net assets were up by around 9.1%, as a result of the €197.5 million increase in the loans
and advances to customers portfolio (net) and the increase of around €26.8 million in the
investment properties account heading.
CAIXA LEASING E FACTORING - MAIN FINANCIAL INDICATORS
(million euros)
2015-06 2016-06 Total (%)
Net assets 2,269.5 2,476.2 206.7 9.1%
Loans and advances to customers 2,298.0 2,462.3 164.3 7.1%
Provisions for overdue credit 215.9 182.6 -33.3 -15.4%
Shareholders’ equity 88.9 120.8 32.0 36.0%
Share capital 10.0 10.0 - -
Group % 51% 51% - -
Change
As a reflection of the work being carried out on a default management level, provisions and
impairment were markedly down year-on-year 2015, making a favourable contribution to

28 BOARD OF DIRECTORS’ REPORT – 1st HALF 2016 CGD
OPERATING SEGMENTS
Caixa Leasing e Factoring’s net income. The company contributed €6.9 million to CGD’s
consolidated net income in first half 2016.
Locarent
Sales of 135,240 light vehicles, in Portugal, in June 2016, translated into a positive change
of 17.6% year-on-year 2015. This growth was driven, in the first quarter by the advance
purchase of light vehicles on account of the increase in vehicle tax and, in the second
quarter, by the good performance of the tourism sector in the form of rent-a-car activities.
Renting agreements accounted for around 10.3% of the automobile total with 13,909
vehicles, up 12.1% over the same period 2015.
Locarent – Companhia Portuguesa de Aluguer de Viaturas, S.A. is the CGD Group
company that specialises in renting which consists of the hiring of new vehicles with an
associated package of services, guaranteeing all of the management service components
in respect of corporate and individual customers’ vehicles.
The company’s strategic positioning is based on outsourcing the operational risk and
capitalising upon the banking channel as a source of prospecting for business. The product
is sold across CGD’s banking network under the Caixarenting logo.
Locarent’s renting business of €44.9 million in first half 2016, was up by a year-on-year
22%, comprising a 24.2% increase in the number of vehicles. Its market share of the
segment totalled 17.1% in June 2016.
LOCARENT SALES
(million euros)
Product Total (%)
Renting (number of vehicles) 1,918 2,383 465 24.2%
Renting (value in Eur millions) 36.7 44.9 8.2 22.3%
Locarent Sales
2015-06 2016-06Change
Locarent remains the second largest player in the market, both on a portfolio and sales
level. Locarent’s portfolio grew 3.7% over December 2015, with an additional 538 to a total
of 14,917 vehicles with a value of €227.3 million (up €7.7 million over the end of of 2015).
LOCARENT PORTFOLIO
(million euros)
Product Total (%)
Renting (number of vehicles) 14,379 14,917 538 3.7%
Renting (value in Eur millions) 219.6 227.3 7.7 3.5%
Locarent Portfolio
2015-12 2016-06Change
The 4% increase in Locarent’s net assets over December 2015 translated the good
performance of its renting portfolio. The continued growth of its shareholders’ equity to
around €28.3 million has enabled the copmpany to strengthen its financial structure. In light
of the above performance, the company contributed €1.4 million to CGD Group’s
consolidated net income in first half 2016.
CGD BOARD OF DIRECTORS’ REPORT – 1st HALF 2016 29
OPERATING SEGMENTS
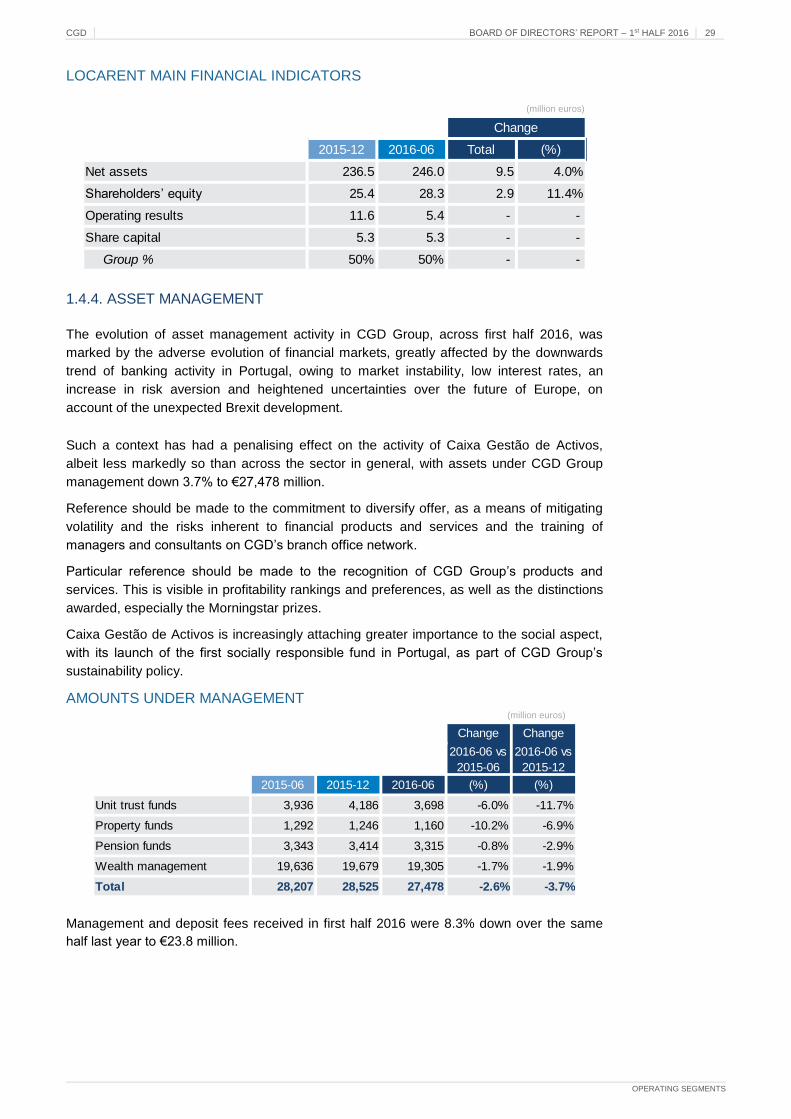
LOCARENT MAIN FINANCIAL INDICATORS
(million euros)
1.4.4. ASSET MANAGEMENT
The evolution of asset management activity in CGD Group, across first half 2016, was
marked by the adverse evolution of financial markets, greatly affected by the downwards
trend of banking activity in Portugal, owing to market instability, low interest rates, an
increase in risk aversion and heightened uncertainties over the future of Europe, on
account of the unexpected Brexit development.
Such a context has had a penalising effect on the activity of Caixa Gestão de Activos,
albeit less markedly so than across the sector in general, with assets under CGD Group
management down 3.7% to €27,478 million.
Reference should be made to the commitment to diversify offer, as a means of mitigating
volatility and the risks inherent to financial products and services and the training of
managers and consultants on CGD’s branch office network.
Particular reference should be made to the recognition of CGD Group’s products and
services. This is visible in profitability rankings and preferences, as well as the distinctions
awarded, especially the Morningstar prizes.
Caixa Gestão de Activos is increasingly attaching greater importance to the social aspect,
with its launch of the first socially responsible fund in Portugal, as part of CGD Group’s
sustainability policy.
AMOUNTS UNDER MANAGEMENT (million euros)
2015-06 2015-12 2016-06 (%) (%)
Unit trust funds 3,936 4,186 3,698 -6.0% -11.7%
Property funds 1,292 1,246 1,160 -10.2% -6.9%
Pension funds 3,343 3,414 3,315 -0.8% -2.9%
Wealth management 19,636 19,679 19,305 -1.7% -1.9%
Total 28,207 28,525 27,478 -2.6% -3.7%
Change
2016-06 vs
2015-06
Change
2016-06 vs
2015-12
Management and deposit fees received in first half 2016 were 8.3% down over the same
half last year to €23.8 million.
2015-12 2016-06 Total (%)
Net assets 236.5 246.0 9.5 4.0%
Shareholders’ equity 25.4 28.3 2.9 11.4%
Operating results 11.6 5.4 - -
Share capital 5.3 5.3 - -
Group % 50% 50% - -
Change

30 BOARD OF DIRECTORS’ REPORT – 1st HALF 2016 CGD
OPERATING SEGMENTS
GROSS COMMISSIONS RECEIVED (million euros)
2015-06 2016-06 (%)
Unit trust funds 10.6 9.9 -6.0%
Property funds 6.4 5.2 -18.8%
Pension funds 3.2 2.9 -8.9%
Wealth management 5.8 5.7 -0.5%
Total 25.9 23.8 -8.3%
Change
Unit trust investment funds - Caixagest
The unit trust investment funds market was down 9.6% in total assets under management
in first half 2016. Contributory factors were the instability in financial markets and interest
rates in the money market which fell to historic lows. Caixagest managed funds, down by a
net €487 million over December 2015, were not immune from this trend.
FUNDS UNDER MANAGEMENT
(million euros)
2015-06 2015-12 2016-06 Total (%) Total (%)
Treasury funds 2,125 2,287 1,930 -195 -9.2% -357 -15.6%
Bond funds 340 400 367 27 7.9% -33 -8.3%
Multi-assets funds 375 417 419 44 11.8% 2 0.5%
Share funds 377 409 395 18 4.9% -14 -3.4%
Special investment funds 567 546 458 -109 -19.2% -88 -16.1%
Protected capital funds 152 126 128 -23 -15.5% 2 1.3%
Total 3,936 4,186 3,698 -238 -6.0% -489 -11.7%
Change Change
2016-06 vs 2015-06 2016-06 vs 2015-12
Notwithstanding this environment, Caixagest has succeeded in growing its multiactive and
equity funds, over the last twelve months, in line with the strategy defined by the company,
as opposed to the other fund managers.
Caixagest managed 28 unit trust investment funds for an amount of €3,968 million at the
end of June, having invested in diverse international financial markets. Gross commissions
earned by unit trust investment funds in the first six months were down 6.0% year-on-year
2015 to €9.9 million.
Property funds – Fundger
The 25 property funds managed by Fundger totalled €1,160 million, at the end of June. The
Fundimo fund posted a decrease in its net worth in first half 2016 owing to adjustments
made to the valuations of several items of property.
The activity of closed-end funds continued to slow, owing to the fact that most of them have
been allocated to development and property promotion.

CGD BOARD OF DIRECTORS’ REPORT – 1st HALF 2016 31
OPERATING SEGMENTS
PROPERTY FUNDS UNDER MANAGEMENT (million euros)
2015-06 2015-12 2016-06 Total (%) Total (%)
Fundimo open-ended fund 628 598 562 -66 -10.5% -36 -5.9%
Closed-end funds 664 648 598 -66 -9.9% -50 -7.7%
Total 1,292 1,246 1,160 -132 -10.2% -86 -6.9%
Change Change
2016-06 vs 2015-06 2016-06 vs 2015-12
Gross commissions earned by property funds were down 18.8% over the same half 2015
to €5.2 million, owing to the drop in commissions from the Fundimo fund and the exit of a
closed-end fund.
Pension funds - CGD Pensões
As a result of the high level of open pension fund redemptions, the net worth of the funds
managed by CGD Pensões at the end of June 2016 was down 2.9% over the beginning of
the year to €3,315 million.
FUNDS UNDER MANAGEMENT (million euros)
2015-06 2015-12 2016-06 Total (%) Total (%)
Open-ended funds 537 525 447 -90 -16.8% -78 -14.9%
Closed-end funds 2,806 2,889 2,868 62 2.2% -21 -0.7%
Total 3,343 3,414 3,315 -28 -0.8% -99 -2.9%
Change Change
2016-06 vs 2015-06 2016-06 vs 2015-12
Commissions earned by pension funds up until the end of June were down 8.9% over first
half 2015 to €2.9 million.
Wealth management - Caixagest
The value of wealth management portfolios (not including pension funds) was down 1.9%
over the beginning of the year to €19,305 million, at the end of June, particularly on
account of the institutionals segment. This was accompanied by the continued
development of the individual customers portfolio management service, based on a
proximity approach to CGD’s branch office network, with the aim of finding new customers.
The revenue stream of €5.7 million from the portfolio management service in the first half,
was in line with the amount for first half 2015.
PORTFOLIOS UNDER MANAGEMENT (million euros)
2015-06 2015-12 2016-06 Total (%) Total (%)
Insurance portfolios 13,047 13,007 12,857 -190 -1.5% -149 -1.1%
Institutional 6,332 6,381 6,128 -204 -3.2% -253 -4.0%
Individual and corporate
customers257 291 320 63 24.5% 29 10.1%
Total 19,636 19,679 19,305 -331 -1.7% -373 -1.9%
Change Change
2016-06 vs 2015-06 2016-06 vs 2015-12
The asset management area contributed €2.6 million to CGD Group’s consolidated net
income in 2016.

32 BOARD OF DIRECTORS’ REPORT – 1st HALF 2016 CGD
OPERATING SEGMENTS
1.4.5. INTERNATIONAL AREA ACTIVITY
In continuing its international business initiatives and activities developed in 2015, across
first half 2016, CGD continued to affirm its status as a financial group with a broad,
diversified international platform.
These activities have made it possible to further increase knowledge and information
sharing, translating into a more dynamic articulation and leveraging of international
business, with a global increase in the number of new customers and inherent contribution
of international business to CGD Group’s consolidated net income.
Work in the corporate business segment continued to be carried out on initiatives and
activities for integrating the international business developed in 2015, with the aim of
maximising synergies between the domestic and international branch office networks.
Caixa, together with its foreign branches in Spain, France, Angola, Brazil, Mozambique,
South Africa and China/Macau, therefore remained profoundly committed to maximising
the synergies of its international platform for developing business with “internationalised”
customers in the Group’s markets as well as increasing its foreign trade operations.
The development of information systems adapted to business requirements and
international business desks dynamics has allowed the growing systemisation of business
opportunities, greater knowledge and information sharing, translating into a greater
dynamic in the articulation and leverage of international business, comprising an overall
increase in the number of new customers and the inherent growing contribution of
international business to CGD Group’s consolidated net income.
Caixa continued to improve the value proposal of its foreign trade products and services in
first half 2016, via the functionalities supplied on the CaixaDireta Empresas platform, based
on the improvement of the level of information on trade opportunities for consultation and
the provision of advances on export remittances facility, inter alia.
Caixa also launched a new B2B intelligence service with selected information on external
markets, with a description of the main opportunities by sectors, most relevant projects in
progress, international tenders and Caixa Group’s specific offer for such markets. Actions
up to June involved Algeria, Colombia, Mexico, China/Macau, Chile, Peru, India, South
Africa, France, US and Canada.
87 operations, including renewals of limits and new operations totalling €1,443 million were
analysed in articulation with the Group’s foreign business branches, in first half 2016, up by
a year-on-year 42.6% in terms of volume and 43.5% by amount, with BCG Spain as the
foreign branch having made the largest contribution to this increase, both by volume and
amount of credit operations analysed and put up for a decision.
A significant collection of letters of intent in the sphere of financing import credit operations
with the aim of backing customers’ exports of Portuguese products and services was
prepared and approved.
Disbursements under Portuguese export lines, both concessionary and commercial
amounted to around €10 million.
Negotiations with various parties also continued to be held for new lines of credit for
Portuguese exports, in addition to the activation of concessionary lines.
Caixa continued to focus on promoting and consolidating relationships through its branch
office network and specific customer care/service models for the individual customers
resident abroad segment in the form of Caixazul Internacional and Caixadirecta
Internacional.

CGD BOARD OF DIRECTORS’ REPORT – 1st HALF 2016 33
OPERATING SEGMENTS
Caixa had a presence in 11 of the 12 main countries of destination of Portuguese
emigration in 2014, and also provides a 24/7 dedicated banking telephone helpdesk.
CGD’s individual customers resident abroad business across the said period was up, both
in terms of resource-taking and the global lending operations aggregate, having made a
favourable contribution to Caixa’s net income.
This business area is going through a particularly challenging period owing to the wave of
emigration being witnessed in Portugal, characterised by very young highly qualified
people in search of opportunities or qualified workers who are relocating abroad via their
corporate employers.
As regards the main activities across this period, reference should be made to the
promotion of thematic campaigns targeted at this segment, taking advantage of the fact
that many customers return to Portugal, namely in the Easter holiday period.
The Summer 2016 campaign which will run through to 31 August was also launched in first
half 2016.
Caixa’s 20th anniversary celebrations in Germany set the stage for initiatives designed to
promote Portuguese culture while, at the same time, affording the opportunity to provide
information and promote the presence of the Caixa brand with the Portuguese community
in Germany.
Also targeted at ensuring proximity with customers resident abroad, CGD, organised
several festive dates with the Portuguese community. They included “Portugal Day” with
the sponsorship of various events in its representative offices in the different countries in
which CGD Group has a presence.
In the banks segment and in line with the trend of the last few years, CGD’s correspondent
banking network continues to play an important role in meeting the business requirements
of companies, particularly as regards the funding of foreign trade operations. This is a
particularly relevant factor in terms of the strengthening of the internationalisation of the
Portuguese economy in less traditional markets.
CGD Group’s international area contributed an amount of €117.2 million in consolidated
net income in first half 2016, up €72.5 million over the same half of the preceding year.
Particular reference should be made to the France branch with net income of €55.3 million,
BNU Macau, with €31.0 million BCG Spain with €10.5 million.
INTERNATIONAL AREA’S CONTRIBUTION TO CONSOLIDATED NET INCOME
(million euros)
2015-06 2016-06 Change
BNU Macau 28.5 31.0 2.5
France Branch 18.0 55.3 37.3
Banco Caixa Geral (Spain) 15.6 10.5 -5.1
Banco Caixa Geral Angola 10.6 6.9 -3.7
Banco Comercial de Investimento (Mozambique) 8.6 6.7 -2.0
Other -36.6 6.9 43.5
Total International 44.7 117.2 72.5
Net operating income before impairment of subsidiaries and branches abroad, on a
consolidated basis, was up 1.2% by €2.4 million over the preceding year.

34 BOARD OF DIRECTORS’ REPORT – 1st HALF 2016 CGD
OPERATING SEGMENTS
Also in the international area, loans and advances to customers, net of impairment, were
up 3.8% by €522 million to €14.4 billion, whereas the €16.8 billion in resources taken from
customers was up 4.8% by €742 million. Consolidated net assets in the international area
were up by a year-on-year 2.8% to €22.6 billion.
CGD Group's main geographies
Spain
BCG continued to grow its business, in 2016, mainly with companies operating in the
Iberian market and in other markets in which CGD Group has a significant presence,
principally in Africa.
Complying with the restructuring programme agreed between the Group and the European
competition authorities, which, as BCG has fully complied with the objectives defined for
2015, conditioning the bank’s continuity as a CGD Group member, entered a second
phase involving the consolidation of BCG as a profitable subsidiary and essential for
consolidating the market share of companies owned by CGD in Portugal and to enable the
Group to provide adequate backing for Portuguese companies present in the Spanish
market.
BCG’s credit portfolio grew 7% by €214 million, year-on-year, on the back of the 34%
increase of €271 million in lending to companies, in spite of the fact that the Spanish
market continues to witness a fall in its total volume of lending to companies and
households. The credit portfolio at the end of the half year was in excess of €3,200 million,
with a growing proportion of loans to companies and the Group’s corporate customers in
Portugal and Spain. This growth was accompanied by a similar increase in customer
deposits which enabled the loans-to-deposits ratio to remain at 116%, complying with the
new liquidity ratio requirements.
Continuing its efforts to contain costs, structural expenditure was down by more than 3%
and, without benefiting from one off-gains, the cost-to-income ratio was 57%.
The cost of risk also fell as a reflection of low risk and the diversity of the bank’s current
credit portfolio, in which the overdue credit ratio which, at 3.7%, was already in line with the
lowest level in Spanish banking, was now brought down to 3.1%, also making it possible to
reduce the impact of impairment on half yearly costs.
The maintenance of negative Euribor rates across practically the whole of the half year had
a penalising effect on the net interest income of all of the banks and BCG was no exception
to the rule. Credit portfolio growth, however, permitted the €6.6 million drop in net interest
income to be entirely ascribed to the effect of the fall of the market prices of income from
the public debt portfolio and BCG’s deposits with the Group. As a whole, these two income
sources were down €9.5 million over first half 2015. Non-interest income, discounting the
effect of the one-off gains, remained at the level of the first half of the preceding year.
Recurrent income before tax was €13.7 million in first half 2016, up 4% over first half 2015,
with net income of €10.5 million. The annualised returns on capital employed (ROCE), at
more than 9%, compared favourably with the rest of the sector.
BCG contributed €10.5 million to CGD Group’s consolidated net income in first half 2016.

CGD BOARD OF DIRECTORS’ REPORT – 1st HALF 2016 35
OPERATING SEGMENTS
France
CGD France’s total assets of €4,696 million in June 2016, were down over the same date
2015. A particular contributory factor was the reduction of cash and claims at credit
institutions.
Loans and advances to customers (net), based on lending to companies, were up 14.7% to
€3,894 million.
On the liabilities side, customer resources were down by a year-on-year 11%, as were
credit institutions’ resources and debt securities.
Net interest income was up by a year-on-year 9% owing to portfolio evolution and lower
funding costs.
Non-interest income was up year-on-year owing to the contribution made by the slightly
higher level of net commissions.
CGD France posted net income of €63.5 million in first half 2016, up €45.7 million year-on-
year 2015, including capital gains of €43 million from a treasury operation. Excluding this
amount, income before tax from CGD France’s current operations amounted to €32.8
million, in which a contributory factor was the branch office network’s income before tax of
€15.2 million and current treasury activity with income before tax of €17.6 million.
France branch contributed €55.3 million to CGD’ Group’s consolidated net income in first
half 2016, against €18.0 million for the same period 2015.
Macau
BNU Macau, first half year 2016 saw a high level of performance in terms of the growth of
its business revenues with a year-on-year increase of 18.5%, notwithstanding the
intensification of competition in the banking sector and its consequent impact on margins,
deposit-taking and loans and advances to individual customers. Reference should also be
made to the continued decrease in revenue from interbank investments.
Total assets were up by a year-on-year 20%, with the credit overdue for more than 90 days
ratio down from 0.5% to 0.2%.
The loans-to-deposits ratio at the end of June 2016 was 52.1% against the preceding
year’s 60.7%.
As a consequence of liquidity management optimisation and an increase in the size of the
credit portfolio, net interest income was up 14% by 46.1 million patacas in the first six
months of 2016, in comparison to the same period of the preceding year.
Net commissions were down 1% by 0.747 million patacas across the period owing to the
reduction of commissions income on credit operations, although credit card revenues were
up 4.2%. Reference should be made to BNU’s launch of new products and services in the
first six months of the year, particularly its MGM “Affinity” credit card and the “BNU Life”
smartphone app.
Total operating income was 1% up over the same period of the preceding year to 493.5
million patacas.
Structural costs were up 1%, with a reduction of the efficiency ratio during the period under
analysis to 30.3%, in line with best international practice.
BNU Macau’s contribution to CGD Group’s consolidated net income in the first half totalled
€31 million against €28.5 million for the same half 2015.

36 BOARD OF DIRECTORS’ REPORT – 1st HALF 2016 CGD
OPERATING SEGMENTS
Mozambique
BCI Moçambique’s balance sheet posted a 25.5% year-on-year increase in assets to
133,760 million meticais.
Largely deriving from an increase in lending to the corporate segment, the net credit
portfolio grew by 24.4% to 79,696 million meticais. In turn, deposits taken from customers
were 25,5% up year-on-year by 19,740 million to 97,100 meticais. The combination of such
evolution produced a loans-to-deposits ratio of 82.2%, against 83.1% in June 2015.
The performance of net interest income, in local currency, in comparison to the preceding
year, was highly positive owing to the evolution of interest on loans and advances to
customers with a 38.9% growth of 1,330.5 million meticais.
Net commissions were up by 102.6 million meticais (+15%) over the same half 2015.
Reductions of other operating income (down 132.7 million meticais) and income from
financial operations (down 115.4 million meticais) led to a 7.2% decline of 145.4 million
meticais in non-interest income. However, given the previously referred to positive
evolution, total operating income was up 13.8% by 551.1 million meticais over the same
period last year to 4,554.7 million meticais.
The solvency ratio, calculated according to Basel II rules, showed an expressive
improvement from 12.7% in December 2015 to 13.9% in June 2016.
BCI Moçambique’s contribution to CGD Group’s consolidated net income in the first half
amounted to €6.7 million.
Angola
Banco Caixa Geral Angola, operating in a highly adverse environment, in first half 2016,
took a series of steps which have enabled it to recover from the unfavourable results
achieved in the first quarter of the year.
Reference should be made to the evolution of net credit, in terms of BCG Angola’s balance
sheet, which was up 36.6% to €505.2 million.
Performance in terms of the bank’s net interest income, with a 9.5% increase of €4.0
million over the same period of the preceding year, was positive. However, the highly
unfavourable evolution of income from financial operations had a penalising effect on total
operating income, which was down 20.2% by €14.8 million over the end of first half 2015.
This evolution had the effect of worsening the cost-to-income ratio to 44.7% (against 39.0%
for the same half year 2015), although it is still one of the best in the market.
BCG Angola contributed €6.9 million to CGD Group’s consolidated net income in first half
2016.
Reference should lastly be made to the fact that Banco Caixa Geral Angola was
considered the best Angolan bank in terms of customer service by a study recently
published by a specialised entity.

CGD BOARD OF DIRECTORS’ REPORT – 1st HALF 2016 37
OPERATING SEGMENTS
South Africa
As a sign of the dynamism of its commercial activity, at the end of June 2016, Mercantile
Bank posted a 15.2% increase in its net loans and advances to customers over June 2015,
leading to a 19.5% increase of total assets to 9,919 million rand. Customer resources were
up by a year-on-year 24.2%.
Net interest income for 1st half 2016, positively influenced by the volume and price effects
of loans and advance to customers, was up 23.4% over the same period last year to 236.6
million rand. Non-interest income was up 12.8% to 104.9 million rand.
Mercantile Bank contributed €4.6 million to CGD Group’s consolidated net income.
Cape Verde
In first half 2016, Banco Comercial do Atlântico – BCA’s net loan portfolio was up 2.1%
over June 2015 to 44,720 million Cape Verde escudos, particularly owing to the 10%
increase in loans and advances to companies. Loans and advances to individual
customers were down 0.3%, owing to the drop in loans for mortgages and other purposes.
Customer resources were up 5.6% over June 2015 to 71,226 million Cape Verde escudos
in June 2016. Sight and term deposits accounted for 38.1% and 60.5% of total customer
resources respectively against 35.2% and 63.1%, respectively, at the end of June of the
preceding year.
In first half 2016, the bank’s operating income was practically nil at 0.6 million Cape Verde
escudos, in comparison to 241.3 million Cape Verde escudos in June 2015. This drop
particularly derived from a lower level of income from credit and decrease of foreign
exchange income, in light of a marginal decline in operating costs.
Owing to the drop in operating income and sharp increase in provisions and impairment for
the year, BCA contributed €419 thousand to CGD Group’s consolidated net income in the
first half.
Banco Interatlântico – BI’s net loans and advances to customers portfolio at the end of
June 2016 was up 9.6% year-on-year to 16,598 million Cape Verde escudos.
Customer resources were up 19.1% over June 2015 to 23,445 million Cape Verde
escudos, with a 29.5% increase in sight deposits to 8,996 million Cape Verde escudos.
The bank’s net interest income for the first six months of 2016, was down 3.8% over the
same period last year to 237 million Cape Verde escudos particularly on account of the
decline in average lending rates.
First half 2016 property-related impairment (payments in kind) was 43.7 million Cape Verde
escudos.
Accordingly, on account of lower revenue and higher impairment, Banco Interatlântico
made a negative contribution of €52 thousand to CGD Group’s consolidated net income.

38 BOARD OF DIRECTORS’ REPORT – 1st HALF 2016 CGD
OPERATING SEGMENTS
Brazil
Investments in credit institutions and BCG Brasil’s credit portfolio at the end of June 2016,
were up 32.9% and 32.5%, respectively, over June 2015. The gross credit portfolio was
also up 2.2% over the same period of the preceding year to 825 million reais. However,
owing to significantly higher impairment, the credit portfolio was down 1.2% to 773 million
reais.
The 13.9% reduction in the bank’s customer resources to 591 million reais was offset by a
58.1% increase in resources taken from credit institutions.
Net interest income was down 13.7% over first half 2015 to 50.3 million reais. Non-interest
income was a negative 4.5 million particularly on account of the fact that the amount of the
revaluation of assets and liabilities at fair value (128 million reais) was insufficient to offset
the negative foreign exchange income of 138 million Brazilian reais, most of which related
with the increase in foreign exchange futures in USD.
BCG Brasil’s contribution of €1.2 million to CGD Group’s consolidated net income in first
half 2016 was up 69.3% over the same period of the preceding year.
East Timor
CGD’s Timor branch benefited from large amounts of investment by the ZEESM (Special
Social Economic Zones of the Market of East Timor) in first half 2016, which contributed
towards a 71.7% increase in customer resources to USD 217.8 million and a positive
impact in terms of net interest income.
The net credit portfolio was down 2.2% over the end of June 2015 to USD 27.9 million,
owing to greater difficulty in promoting business. Reference should, however, be made to
the evolution of mortgage lending, with a 7.5% portfolio increase over June 2015.
Owing to the increase in total operating income and lower provisions and impairment
needs, on account of the improvement in the quality of the credit portfolio, CGD’s Timor
branch’s contribution of €1.8 million to CGD Group’s consolidated income in first half 2016,
was up 49.3% over the same half 2015.
São Tomé e Príncipe
The first six months of 2016, in spite of the increase of its offer of new products at more
attractive rates, witnessed a decline of the credit portfolio and increase of credit in default
in Banco Internacional de São Tomé e Príncipe’s balance sheet, partly on account of the
fact that the economic environment affected the capacity of economic agents to meet their
liabilities.
In operating terms, reference should be made to the stabilising of the amount of net-
interest income, increase in non-interest income by way of net commissions and a lower
level of impairment and provisions appropriations.
The bank’s contribution of €167 thousand to CGD Group’s consolidated net income in first
half 2016 was up 9.8% over the same period 2015.

CGD BOARD OF DIRECTORS’ REPORT – 1st HALF 2016 39
RESULTS, BALANCE SHEET, LIQUIDITY AND SOLVENCY
1.5. Results, Balance Sheet, Liquidity and Solvency
1.5.1. CONSOLIDATED ACTIVITY
1.5.1.1. RESULTS
At the end of the first half 2016, core operating income (sum of net interest income and
commissions, net of operating costs), saw an increase of 19.1% in the period to €159.6
million, influenced by the good performance of net interest income and operating costs.
CGD Group’s net interest income, in first half 2016, was up 5.5% by €29.8 million over the
same half 2015 to €568.7 million.
As was the case across 2015, this half yearly growth in net interest income was a major
beneficiary of the 17.5% reduction of €171.7 million in funding costs which surpassed the
reduction also felt in interest on lending (down 9.3% by €141.8 million). The cost of the
CoCo bonds in the first half was €40.4 million. Income from equity instruments was, in turn,
down €13.5 million to €29.6 million.
Net commissions for the half year, totalled €230.1 million, with the 7.1% year-on-year
decline reflecting the significant reduction of the amounts received (-6.5%) owing to strong
competitive and regulatory pressure on commissions charges.
COMMISSIONS (NET) – CONTRIBUTION BY BUSINESS AREAS
(million euros)
Income from financial operations were negative at €47.4 million, influenced by high
volatility experienced in international financial markets, including public debt, associated
with the United Kingdom's referendum about remaining in the European Union.
The €26.4 million deficit on the ‘other operating income' account heading in first half 2016
was affected by the amount of €25.9 million in respect of CGD’s ex ante contribution to the
Single Resolution Fund for 2016. The amount of the said contribution for 2015 was only
paid in December.
CGD’s total operating income for the half year was down €399.5 million over the same half
2015 to €754.7 million, having been strongly influenced by the negative change of €349.4
million in income from financial operations.
2015-06 2016-06 Total (%)
CGD Portugal 146.7 139.5 -7.2 -4.9%
International operations 69.4 62.3 -7.1 -10.3%
Investment banking 18.1 16.0 -2.1 -11.4%
Asset management 16.2 15.1 -1.1 -6.7%
Other -2.7 -2.8 -0.1 -
Total 247.7 230.1 -17.6 -7.1%
Change

40 BOARD OF DIRECTORS’ REPORT – 1st HALF 2016 CGD
RESULTS, BALANCE SHEET, LIQUIDITY AND SOLVENCY
CGD’s half yearly operating costs were down 2.0%, benefiting from the containment felt
across all of its components, namely administrative expenditure (down 3.1%) and
depreciation (down 7.6%). Employee costs were slightly down by 0.7%, notwithstanding
the first half year provisions in the sphere of the Horizonte Plan.
OPERATING COSTS AND DEPRECIATION (million euros)
2015-06 2016-06 Total (%)
Employee costs 377.0 374.5 -2.5 -0.7%
Other administrative expenses 223.5 216.7 -6.8 -3.1%
Depreciation and amortisation 52.0 48.0 -3.9 -7.6%
Total 652.5 639.3 -13.3 -2.0%
Change
With the elimination of the referred to provisioning effect, employee costs and operating
costs would have been down 6.0% and 5.1%, respectively.
Notwithstanding the reduction of operating costs, the above referred to drop in total
operating income led to a cost-to-income indicator of 82.5%.
EFFICIENCY RATIOS (%)
2015-06 2015-12 2016-06
Cost-to-income (consolidated operations) (1) 54.9% 66.6% 82.5%
Employee costs / Total Operating Income (1) 31.7% 39.3% 48.4%
Extern. supplies and serv. / net operat. income 19.4% 28.7% 28.7%
Operating costs / average net assets 1.3% 1.4% 1.3%
(1) Calculated in accordance with Bank of Portugal Instruction 23/2012.
Net Operating Income before Impairments for first half 2016 was therefore €115.4 million.
NET OPERATING INCOME BEFORE IMPAIRMENTS CONTRIBUTION BY
BUSINESS AREAS
(million euros)
2015-06 2016-06
Domestic commercial banking 243.4 -83.6 -326.9
International activity 203.0 205.3 2.4
Investment banking 28.3 -13.0 -41.3
Other 27.0 6.7 -20.3
Net Operating Income before Impairments 501.6 115.4 -386.2
Change
Special reference should be made to international activity’s contribution of €205.3 million to
consolidated operating income. Particularly noteworthy was the performance of the France
branch and BNU Macau with €77.1 million and €36.9 million, respectively.
There was a 2.1% increase of €6.7 million in provisions and impairment for the period to
€328.4 million, with a cost of credit risk of 0.86%.
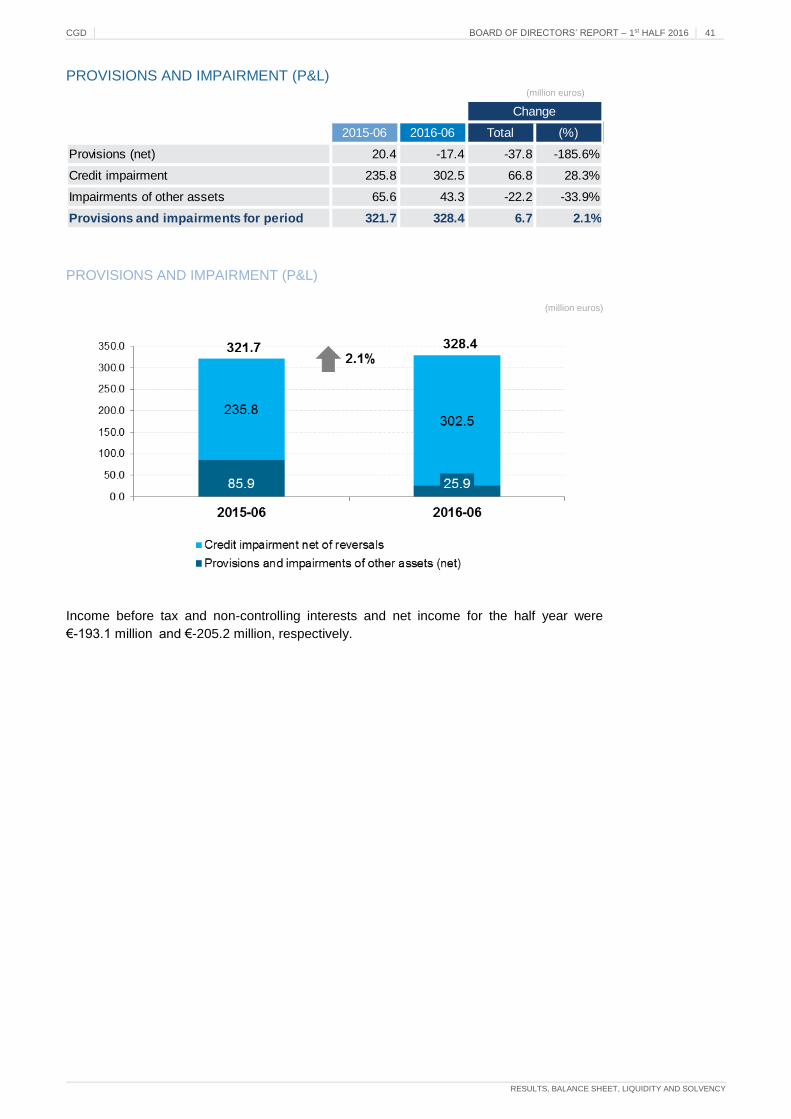
CGD BOARD OF DIRECTORS’ REPORT – 1st HALF 2016 41
RESULTS, BALANCE SHEET, LIQUIDITY AND SOLVENCY
PROVISIONS AND IMPAIRMENT (P&L) (million euros)
PROVISIONS AND IMPAIRMENT (P&L)
(million euros)
Income before tax and non-controlling interests and net income for the half year were
€193.1 million and €-205.2 million, respectively.
2015-06 2016-06 Total (%)
Provisions (net) 20.4 -17.4 -37.8 -185.6%
Credit impairment 235.8 302.5 66.8 28.3%
Impairments of other assets 65.6 43.3 -22.2 -33.9%
Provisions and impairments for period 321.7 328.4 6.7 2.1%
Change

42 BOARD OF DIRECTORS’ REPORT – 1st HALF 2016 CGD
RESULTS, BALANCE SHEET, LIQUIDITY AND SOLVENCY
CONSOLIDATED INCOME STATEMENT (thousand euros)
2015-06 2016-06 Total (%)
Interest and similar income 1,519,979 1,378,132 -141,848 -9.3%
Interest and similar costs 981,115 809,435 -171,681 -17.5%
Net interest income 538,864 568,697 29,833 5.5%
Income from equity instruments 43,188 29,640 -13,548 -31.4%
Net interest inc. incl. inc. from eq. investm. 582,052 598,337 16,285 2.8%
Income from services and commissions 311,869 291,489 -20,380 -6.5%
Costs of services and commissions 64,165 61,341 -2,824 -4.4%
Commissions (net) 247,703 230,148 -17,556 -7.1%
Income from financial operations 301,989 -47,418 -349,407 -
Other Operating Income 22,418 -26,407 -48,825 -
Non-interest income 572,110 156,322 -415,788 -72.7%
Total Operating Income 1,154,163 754,660 -399,503 -34.6%
Employee costs 377,023 374,528 -2,494 -0.7%
Other administrative expenses 223,536 216,700 -6,836 -3.1%
Depreciation and amortisation 51,984 48,041 -3,943 -7.6%
Operating costs and depreciation 652,543 639,270 -13,273 -2.0%
Net Operating Income before Impairments 501,620 115,390 -386,230 -77.0%
Provisions and impairments of other assets (net) 85,936 25,898 -60,037 -69.9%
Credit impairment net of reversals 235,762 302,522 66,760 28.3%
Provisions and impairments 321,697 328,420 6,723 2.1%
Income from subsidiaries held for sale -349 0 349 -
Income from associated companies 33,909 19,920 -13,989 -41.3%
Net Inc. before tax and non-controlling
interest213,483 -193,110 -406,593 -
Tax 119,605 -12,537 -132,142 -
Current and deferred 88,739 -52,235 -140,974 -
Extraordinary contrib. on the banking sector 30,866 39,698 8,832 28.6%
Consolidated net income for period 93,878 -180,573 -274,451 -
of which:
Non-controlling interest 46,817 24,670 -22,146 -47.3%
Net income attrib. to CGD shareholder 47,061 -205,243 -252,305 -
Change

CGD BOARD OF DIRECTORS’ REPORT – 1st HALF 2016 43
RESULTS, BALANCE SHEET, LIQUIDITY AND SOLVENCY
1.5.1.2. BALANCE SHEET
CGD Group’s consolidated net assets of €99,355 million at the end of June 2016, were
slightly down, both in comparison to the preceding year (by 0.9%) and December 2015 (by
1.5%).
CGD GROUP – CONSOLIDATED NET ASSETS
(million euros)
CGD'S GROUP Total Structure Total Structure Total Structure
Caixa Geral de Depósitos (1) 71,284 71.1% 71,292 70.7% 70,093 70.5%
Banco Caixa Geral (Spain) 4,610 4.6% 4,591 4.5% 4,761 4.8%
Banco Nacional Ultramarino, SA (Macau) 4,499 4.5% 5,577 5.5% 5,694 5.7%
Caixa Banco de Investimento 1,536 1.5% 1,500 1.5% 1,465 1.5%
Caixa Leasing e Factoring 2,245 2.2% 2,380 2.4% 2,452 2.5%
Banco Comercial Investimento (Mozambique) 2,422 2.4% 2,323 2.3% 1,845 1.9%
Banco Comercial do Atlântico (Cape Verde) 689 0.7% 707 0.7% 732 0.7%
Mercantile Lisbon Bank Holdings (South Africa) 681 0.7% 562 0.6% 662 0.7%
BCG Angola 2,022 2.0% 1,943 1.9% 1,859 1.9%
Other companies (2) 10,251 10.2% 10,027 9.9% 9,793 9.9%
Consolidated net assets 100,238 100.0% 100,901 100.0% 99,355 100.0%
2016-062015-06 2015-12
(1) Separate activity
(2) Includes units registered by the equity accounting method.
Total securities investments, including assets with repurchase agreements and trading
derivatives, were up 3.5% by €689 million over the end of the preceding year to €20,640
million, owing to a good liquidity situation, in which CGD continued to pursue a strategy of
greater diversification in terms of portfolio composition, across the half year.
SECURITIES INVESTEMENTS (CONSOLIDATED) (a)
(million euros)
2015-06 2015-12 2016-06
Fin. assets at fair value through profit or loss 2,847 3,366 6,734
Available for sale financial assets 17,104 16,283 13,668
Investments held to maturity 0 0 238
Total 19,951 19,649 20,640
(a) After impairment and includes assets with repo agrements and trading derivatives.
Loans and advances to customers (including credit with repurchase agreements) at the
end of June amounted to €70,674 million (gross) and €65,284 million (net), comprising
credit balance reductions of 1.6% and 2.0% respectively over the end of 2015.
Notwithstanding the growth recorded in comparison to the same period of the preceding
year, new loan operations entered into in first half 2016 were insufficient to offset portfolio
maturities.
The credit more than 90 days overdue ratio of 7.4%, was identical to that of June of the
preceding year. Its respective impairment coverage was 103.2% (against 99.1% in June
2015).
The credit at risk and restructured credit ratios, calculated in accordance with Bank of
Portugal criteria, were 12.2% and 10.3%, respectively.
Credit at risk provisions and impairment coverage was 63.2%, and the level of coverage of
credit at risk for individuals was 46.5% and 73.7% for corporate customers.
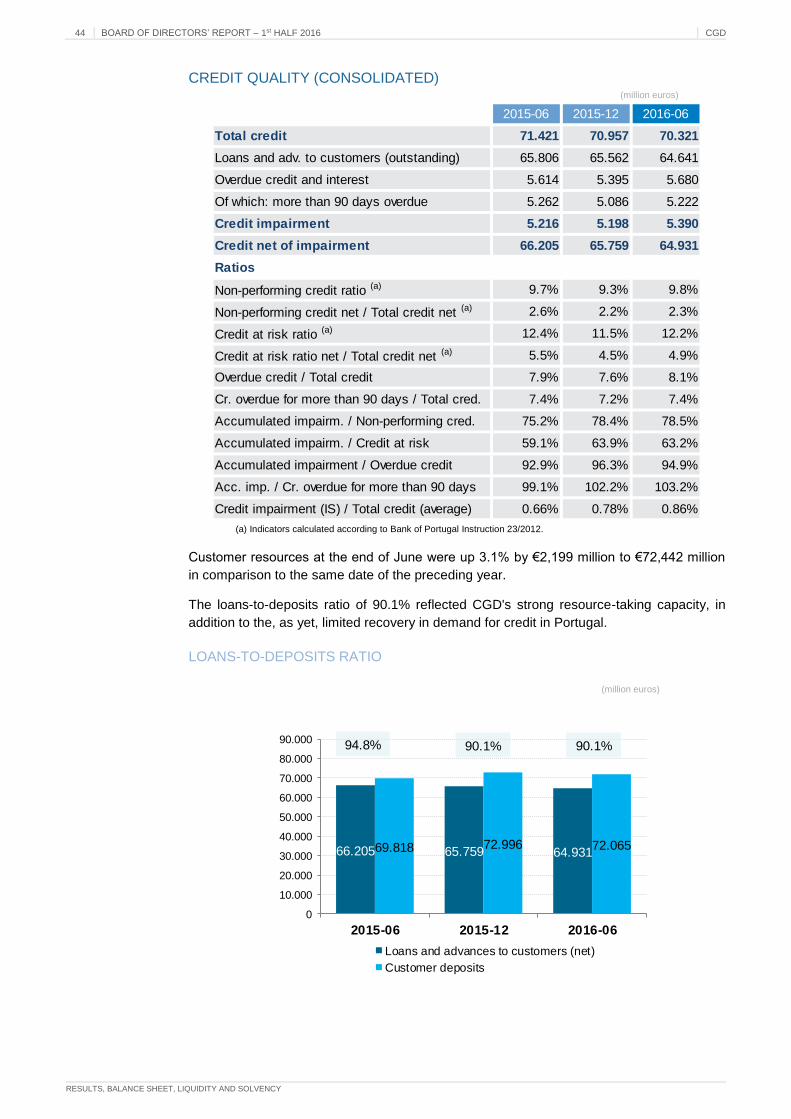
44 BOARD OF DIRECTORS’ REPORT – 1st HALF 2016 CGD
RESULTS, BALANCE SHEET, LIQUIDITY AND SOLVENCY
CREDIT QUALITY (CONSOLIDATED) (million euros)
(a) Indicators calculated according to Bank of Portugal Instruction 23/2012.
Customer resources at the end of June were up 3.1% by €2,199 million to €72,442 million
in comparison to the same date of the preceding year.
The loans-to-deposits ratio of 90.1% reflected CGD's strong resource-taking capacity, in
addition to the, as yet, limited recovery in demand for credit in Portugal.
LOANS-TO-DEPOSITS RATIO
(million euros)
66.205 65.759 64.93169.818 72.996 72.065
0
10.000
20.000
30.000
40.000
50.000
60.000
70.000
80.000
90.000
2015-06 2015-12 2016-06
Loans and advances to customers (net)
Customer deposits
94.8% 90.1%90.1%
2015-06 2015-12 2016-06
Total credit 71.421 70.957 70.321
Loans and adv. to customers (outstanding) 65.806 65.562 64.641
Overdue credit and interest 5.614 5.395 5.680
Of which: more than 90 days overdue 5.262 5.086 5.222
Credit impairment 5.216 5.198 5.390
Credit net of impairment 66.205 65.759 64.931
Ratios
Non-performing credit ratio (a) 9.7% 9.3% 9.8%
Non-performing credit net / Total credit net (a) 2.6% 2.2% 2.3%
Credit at risk ratio (a) 12.4% 11.5% 12.2%
Credit at risk ratio net / Total credit net (a) 5.5% 4.5% 4.9%
Overdue credit / Total credit 7.9% 7.6% 8.1%
Cr. overdue for more than 90 days / Total cred. 7.4% 7.2% 7.4%
Accumulated impairm. / Non-performing cred. 75.2% 78.4% 78.5%
Accumulated impairm. / Credit at risk 59.1% 63.9% 63.2%
Accumulated impairment / Overdue credit 92.9% 96.3% 94.9%
Acc. imp. / Cr. overdue for more than 90 days 99.1% 102.2% 103.2%
Credit impairment (IS) / Total credit (average) 0.66% 0.78% 0.86%

CGD BOARD OF DIRECTORS’ REPORT – 1st HALF 2016 45
RESULTS, BALANCE SHEET, LIQUIDITY AND SOLVENCY
CONSOLIDATED BALANCE SHEET (million euros)
Assets 2015-06 2015-12 2016-06 Total (%) Total (%)
Cash and cash equivalents with central banks 1,903 2,880 1,503 -401 -21.1% -1,377 -47.8%
Loans and advances to credit institutions 4,186 4,785 3,642 -544 -13.0% -1,143 -23.9%
Loans and advances to customers 66,205 65,759 64,931 -1,274 -1.9% -828 -1.3%
Securities investments 19,073 18,986 20,137 1,064 5.6% 1,150 6.1%
Assets with repurchase agreement 1,312 1,081 856 -457 -34.8% -226 -20.9%
Non-current assets held for sale 838 830 749 -88 -10.6% -81 -9.7%
Investm. in subsid. and associated companies 295 277 267 -28 -9.4% -10 -3.8%
Intangible and tangible assets 818 754 707 -112 -13.7% -48 -6.3%
Current tax assets 51 37 41 -10 -20.1% 4 9.7%
Deferred tax assets 1,461 1,474 1,559 98 6.7% 85 5.8%
Other assets 4,096 4,037 4,964 868 21.2% 927 23.0%
Total assets 100,238 100,901 99,355 -883 -0.9% -1,547 -1.5%
Liabilities
Central banks' and credit institutions' resources 6,019 5,433 5,769 -251 -4.2% 336 6.2%
Customer resources 70,242 73,426 72,442 2,199 3.1% -984 -1.3%
Financial liabilities 1,794 1,739 2,262 468 26.1% 523 30.1%
Debt securities 8,170 6,700 6,117 -2,053 -25.1% -583 -8.7%
Provisions 859 992 896 36 4.2% -97 -9.8%
Subordinated liabilities 2,426 2,429 2,400 -26 -1.1% -29 -1.2%
Other liabilities 4,337 3,998 3,726 -611 -14.1% -273 -6.8%
Sub-total 93,847 94,718 93,610 -237 -0.3% -1,108 -1.2%
Shareholders' equity 6,391 6,184 5,745 -646 -10.1% -439 -7.1%
Total 100,238 100,901 99,355 -883 -0.9% -1,547 -1.5%
Change Change
2016-06 vs 2015-06 2016-06 vs 2015-12
1.5.1.3. LIQUIDITY
During the course of first half 2016, keeping pace with the ECB’s strengthening of its
monetary stimuli measures across the period and taking into account the reduction of
funding costs and liquidity management optimisation, CGD substituted the full amount of its
TLTRO funding by the new TLTRO II. It also decided to increase the amount of its
borrowings from the ECB to increase its capability to back the economy and Portuguese
companies.
CGD’s funding from the ECB therefore rose from €1,250 million at the end of 2015 to
€2 billion at the end of June this year. Across the same period, there was also an increase
in CGD’s assets eligible for the ECB pool from €1,022 million to €10,898 million at the end
of June 2016.
On a CGD Group level and exploiting the terms of long term funding operations, resources
with the ECB were up €831 million over the end of 2015, to €3,597 million at the end of first
half 2016. This increase was accompanied by an increase in the eligible assets portfolio
allocated to the Eurosystem pool from €11,604 million in December last to €12,665 million
at the end of June 2016.

46 BOARD OF DIRECTORS’ REPORT – 1st HALF 2016 CGD
RESULTS, BALANCE SHEET, LIQUIDITY AND SOLVENCY
ECB FUNDING (CONSOLIDATED)
(million euros)
6.335
3.110 2.7663.597
0
1.000
2.000
3.000
4.000
5.000
6.000
7.000
2013-12 2014-12 2015-12 2016-06
-43.2%
vs. 2013-12
The outstanding EMTM programme issuances balance continued to reduce, following the
maturity of several issuances.
The LCR (liquidity coverage ratio) indicator, with a comfortable 193.5% (143.1% at the end
of December 2015), was well above regulatory requirements.
Confirming CGD Group’s comfortable liquidity situation, its NSFR (net stable funding ratio)
at the end of June was 133.4% against 135.9% at the end of 2015.
1.5.1.4. SOLVENCY
The Group’s shareholders’ equity, at the end of June 2016, was down 7.1% by €439 million
to €5,745 million, in comparison to the end of December 2015, influenced by the evolution
of fair value reserves and other reserves and retained earnings.
SHAREHOLDERS’ EQUITY (million euros)
2015-06 2015-12 2016-06
Share capital 5,900 5,900 5,900
Fair value reserves 201 259 111
Other reserves and retained earnings -757 -691 -913
Non-controlling interests 1,000 887 852
Net income 47 -171 -205
Total 6,391 6,184 5,745
The phased-in and fully implemented Common Equity Tier 1 (CET 1) estimated ratios,
calculated according to CRD IV /CRR rules were 10.0% and 9.2%, respectively in June
2016, complying with the regulatory requirements.

CGD BOARD OF DIRECTORS’ REPORT – 1st HALF 2016 47
RESULTS, BALANCE SHEET, LIQUIDITY AND SOLVENCY
SOLVENCY RATIOS
(million euros)
2015-12 2016-06
Own funds
Common equity tier I (CET I) 6,551 6,009
Tier I 6,551 6,013
Total 7,410 6,736
Total weighted assets 60,282 60,016
Solvency ratios
CET I 10.9% 10.0%
Tier I 10.9% 10.0%
Total 12.3% 11.2%
CET I ratio 10.0% 9.2%
CRD IV / CRR Regulation
Phased-in
Fully Implemented
The 10.9% to 10.0% evolution of the phased-in CET 1 ratio between 31 December 2015
and June 2016 derives from the combination effect of progression over time associated
with the application of transitional dispositions leading to a reduction of 0.21% in the ratio
and the effect of CGD’s own consolidated activity, comprising negative net income (with an
impact of -0.35% on the ratio) and several other effects (namely the negative foreign
exchange effect associated with equity investments in subsidiaries abroad) with an effect of
-0.30% on the ratio.
The fully implemented leverage ratio at the end of June 2016 was 5.2% against 5.7% at the
end of 2015.
1.5.2. SEPARATE OPERATIONS
1.5.2.1. RESULTS
The separate activity of Caixa Geral de Depósitos generated a core operating income (sum
of net interest income and commissions, net of operating costs) of 38.6 million euros in the
first half of 2016, which meant an increase of 40.8 million over the same period last year.
Contributory factors to this favourable performance were, on the one hand, the €38.4
million increase in interest margin (up 13.4% over June 2015) and, on the other, operating
costs which were down by a year-on-year €8.7 million (-1.9%).
Income from equity instruments was, in turn, down €17.6 million to €41.8 million. Net
commissions earnings for the half, reflecting a year-on-year decrease of 3.7% were €164.7
million.
The high level of volatility felt in financial markets, including public debt, associated with the
referendum in the United Kingdom on whether to leave the European Union were factors
having an influence on the negative amount of €62.3 million in income from financial
operations.
The “other operating income” account was 34.2 million below to the one made during the
1st half of 2015, affected by the already referred accounting for ex ante contribution of
CGD for the resolution of the Single Fund for the year 2016, contribution during 2015 was

48 BOARD OF DIRECTORS’ REPORT – 1st HALF 2016 CGD
RESULTS, BALANCE SHEET, LIQUIDITY AND SOLVENCY
only confirmed in December.
Given such evolution, total operating income from CGD’s separate banking operations in
the half year amounted to €457.6 million, down €499.3 million over the same half 2015.
The provisioning reinforcement checked in the first half in the sphere of the Horizonte plan
in the amount of €20.0 million made a decisive contribution to the 1.4% increase in
employee costs. Notwithstanding, total operating costs as a whole were down 1.9% given
the 6.3% decrease in administrative expenditure and 5.3% decrease in depreciation.
Without such provision, employee costs and operating costs would have reduced €16.4
million (-6.3%) and €28.7 million (-6.3%), respectively, compared to the same period of
2015.
Income before tax and net income for the half were therefore €321.4 million negative and €302.5 million negative respectively.
1.5.2.2. BALANCE SHEET
Net assets in respect of CGD’s separate operations, at the end of June 2016, totalled
€89,454 million, down 1.5% by €1,351 million over December 2015. In terms of the
evolution of the different components, particular reference should be made to the
reductions noted during the half in the cash and claims at central banks (down 65.7% by
€1,165.3 million) and investments in credit institutions (down 11.5% by 570 million euros)
compensated by the increase in the securities portfolio (4.0% by €823.6 million).
Loans and advances to customers of €53,629 million were down 1.4% by €741.5 million in
the half year.
Total liabilities, amounting to €85,024 million, were 1.1% down by €924 million in the half
year. Contributory factors particularly included the 1.1% reductions of €661 million in
customer resources and debt securities which fell short of December 2015’s amount by
€571 million.
Shareholders’ equity of €4,430 million at the end of June 2016, down 8.8% by €427 million
over December last, reflected the unfavourable change in revaluation reserves and income
for the period.

CGD BOARD OF DIRECTORS’ REPORT – 1st HALF 2016 49
MAIN RISKS AND UNCERTAINTIES IN 2nd HALF 2016
1.6. Main Risks and Uncertainties in 2nd half 2016
The global economy across the first half year continued its cyclical, albeit moderate
upswing beginning some seven years previously. Its rate of expansion across the second
half is likely to be more subdued, based on the start of a very positive year for Europe, an
accelerating US economy in the second quarter and stabilising growth in the main
emerging market economy countries.
Positive economic growth was based on the transition of diverse favourable aspects from
the first to the second half of the year, in which reference should be made to the
maintenance of energy prices, particularly oil, at relatively low levels, a fiscal policy guided
by greater neutrality and the effects of the quantitative easing programmes implemented by
diverse central banks.
In the transition between half years, global growth is, however, subject to various, mainly
downside risks. These particularly include uncertainty over the impact of the vote in the
United Kingdom in favour of leaving the European Union, which may translate into the
postponement of consumption and investment decisions by British economic agents, thus
affecting economic growth, both in the United Kingdom and that of its trading partners.
Notwithstanding signs of stabilisation in emerging market economy countries, consideration
should continue to be given to the potential negative effects on the global economy of a
possible cooling of activity in emerging economy regions, particularly in China. In this area,
the reaction on a level of financial and particularly the foreign exchange markets, namely
as regards the eventual occurrence of new periods of increased volatility and risk aversion,
translating into capital outflows from such economies, will also be particularly important.
The evolution of oil prices will continue to be an important aspect to be monitored given the
multiple effects it could have in the current context. On the one hand and also as regards
diverse emerging market economy countries, signs of a certain recovery in the price of this
commodity may represent an important development from a viewpoint of economic growth
and the performance of their respective public and external accounts. On the other hand,
for the developed economies which tend to be oil importers, price swings, owing to the
extremely low level of inflation, currently signify a fundamental element in the formation of
expectations regarding the future evolution, firstly of inflation and, consequently, monetary
policy.
It is precisely in this latter domain that reference should be made to the continued
uncertainty over the actions of the US Fed. Following the rate increase announced in
December 2015, and as opposed to financial market estimates, this year, to-date has not
witnessed any change in the level of interest rates in the US, owing to factors deriving from
both the performance of the local economy and elements of uncertainty and disturbance
abroad. The improvement of US indicators, including labour statistics and the greater
stability of the global economy and international markets, give rise, however, to the finding
of new solutions. In addition to the uncertainty over any change, reference should also be
made to the risks attached to such a decision, both from a viewpoint of its impacts on the
US domestic economy as on the reaction of the financial and foreign exchange markets. In
the US, reference should also be made to the holding of legislative and presidential
elections in early November.
Several constraints and challenges remain in the Euro Area in spite of the more robust
economic growth noted at the start of the year. In addition to the already referred to
negative impact related with the uncertainties triggered by the result of the June
referendum in the United Kingdom, reference should be made to the economic
performance of the rest of the world and particularly in emerging market economy countries

50 BOARD OF DIRECTORS’ REPORT – 1st HALF 2016 CGD
MAIN RISKS AND UNCERTAINTIES IN 2nd HALF 2016
and geopolitical type issues, such as the intensification of extremist activities in Europe, or
the holding of the constitutional referendum in Italy.
The framework of moderate growth, with its mainly downside risks and very low inflation
will, in turn, help to keep the European Central Bank at the centre of the attention of
investors and diverse economic agents, owing to the possibility that it may, in the event of
the materialisation of several negative risks, strengthen the expansionary nature of
monetary policy in the Euro Area. Any decision herein may come in various shapes,
depending on the respective instruments chosen by the monetary authority, which creates
a factor of uncertainty regarding the potential impacts, both on the economy and financial
sector, owing to greater incidence e.g. on a level of interest rates or the configuration of the
quantitative easing programme.
Activity and confidence indicators, in Portugal, remained practically unchanged in the first
half year. In spite of the positive performance of consumption, the performance of fixed
investment was less dynamic, with exports having reflected an evolution of the global
economy which has suffered across the course of the year from a decline in growth
expectations. A close eye should therefore be kept on the level of any improvement of
external prospects and reacceleration of demand for Portuguese exports in the second
half, and, in terms of domestic demand, the performance of fixed investment, in addition to
the evolution of the international financial markets and the financing costs of domestic
economic agents.

CGD BOARD OF DIRECTORS’ REPORT – 1st HALF 2016 51
GROUP RATINGS
1.7. Group Ratings
CGD’s short and long term ratings from the diverse international rating agencies were
reaffirmed in 1st half 2016.
Accordingly, Standard & Poor’s, on 21 March and Fitch Ratings, on 12 May, reaffirmed
their long and short term ratings on CGD of ‘BB-‘ and ‘B’, respectively, with a positive
outlook from the former and a stable outlook from the latter.
On 6 June 2016, Moody’s placed the Bank’s B1 ratings on deposits and long term senior
debt on “review for downgrade”. Other CGD issuances, in addition to the BCA (Baseline
Credit Assessment) were placed under “review with direction uncertain”.
RATINGS
RATING
Standard & Poor's B BB- 2016-07 B BB+ 2016-03
FitchRatings B BB- 2016-05 B BB+ 2016-03
Moody's N/P B1 2016-06 N/P Ba1 2014-07
DBRS R-2 (mid) BBB (low) 2015-11 R-2 (mid) BBB (low) 2016-04
Long
Term
CGD Portugal
Short
Term
Long
Term
Date(last
assessment)
Short
Term
Date(last
assessment)
On 29 July 2016, Standard & Poor’s once again reaffirmed its long and short term ratings
on CGD of ‘BB-‘ and ‘B’, respectively, with outlook remaining positive.

52 BOARD OF DIRECTORS’ REPORT – 1st HALF 2016 CGD
STATEMENTS OF THE BOARD OF DIRECTORS
1.8. Statements of the Board of Directors
1.8.1. STATEMENT OF CONFORMITY OF THE PRESENTATION OF FINANCIAL
INFORMATION
Under the terms of sub-paragraph c) of no. 1 of article 246 of the Securities Market Code,
we declare that the condensed financial statements for 1st half 2016, have, to the best of
our knowledge, been produced in conformity with the applicable accounting standards and
provide a true and appropriate image of the assets and liabilities, financial situation and
results of Caixa Geral de Depósitos, SA and the companies included in its consolidation
perimeter and that the board of directors’ interim report gives an accurate account of the
important events occurring in the respective period and the impact of the respective
financial statements and contains a description of the main risks and uncertainties for the
next six months.
Lisbon, 30 August 2016
Board of Directors
Chairman
Álvaro José Barrigas do Nascimento
Vice-Chairman
José Agostinho Martins de Matos
Members
João Nuno de Oliveira Jorge Palma
José Pedro Cabral dos Santos
Ana Cristina de Sousa Leal
Pedro Miguel Valente Pires Bela Pimentel
José Luís Mexia Fraústo Crespo de Carvalho
José Ernst Henzler Vieira Branco
Eduardo Manuel Hintze da Paz Ferreira
Daniel Abel Monteiro Palhares Traça
Pedro Miguel Ribeiro de Almeida Fontes Falcão

CGD BOARD OF DIRECTORS’ REPORT – 1st HALF 2016 53
STATEMENTS OF THE BOARD OF DIRECTORS
1.8.2. STATEMENT OF THE AUDITING OF THE ACCOUNTS
Under no. 3 of article 8 of the Securities Code, we declare that the financial information for
1st half 2016 relating to Caixa Geral de Depósitos, SA and the companies included in its
consolidation perimeter have not been audited.
Lisbon, 30 August 2016
Board of Directors
Chairman
Álvaro José Barrigas do Nascimento
Vice-Chairman
José Agostinho Martins de Matos
Members
João Nuno de Oliveira Jorge Palma
José Pedro Cabral dos Santos
Ana Cristina de Sousa Leal
Pedro Miguel Valente Pires Bela Pimentel
José Luís Mexia Fraústo Crespo de Carvalho
José Ernst Henzler Vieira Branco
Eduardo Manuel Hintze da Paz Ferreira
Daniel Abel Monteiro Palhares Traça
Pedro Miguel Ribeiro de Almeida Fontes Falcão

54 BOARD OF DIRECTORS’ REPORT – 1st HALF 2016 CGD
BONDS HELD BY MEMBERS OF THE BOARD OF DIRECTORS
1.9. Bonds held by members of the Board of
Directors
(ARTICLE 447 OF THE COMMERCIAL COMPANIES CODE)
Bondholders
Members of the
Board of Directors:
Security
Number of
bonds at
30/06/2016
João Nuno Palma Subordinated bonds CGD – 2009/2019 – Anniversary 50

CGD BOARD OF DIRECTORS’ REPORT – 1st HALF 2016 55
INFORMATION ON CGD’S SHAREHOLDERS
1.10. Information on CGD’s Shareholders
(ARTICLE 448 OF THE COMMERCIAL COMPANIES CODE)
Shareholders Share Capital at 30/06/2016% Equity Stake
at 30/06/2016
Portuguese State € 5,900,000,000 100%

56 BOARD OF DIRECTORS’ REPORT – 1st HALF 2016 CGD
SEPARATE AND CONSOLIDATED FINANCIAL STATEMENTS
1.11. Separate and Consolidated Financial Statements
CAIXA GERAL DE DEPÓSITOS, S.A.
BALANCE SHEET (SEPARATE) (euros)
31-1
2-2
015
01-0
1-2
015
AS
SE
TS
Am
ounts
befo
re
im
pairm
ent,
am
ort
isation a
nd
depre
cia
tion
Pro
visio
ns,
im
pairm
ent
and
am
ort
isation a
nd
depre
cia
tion
Net
assets
Net
assets
(resta
ted)
Net
assets
(resta
ted)
LIA
BIL
ITIE
S A
ND
EQ
UIT
Y
30-0
6-2
016
31-1
2-2
015
(resta
ted)
01-0
1-2
015
(resta
ted)
Cash a
nd c
ash e
quiv
ale
nts
at
centr
al banks
608,5
23,8
98
-
608,5
23,8
98
1,7
73,8
56,6
81
1,2
01,6
71,3
51
R
esourc
es o
f centr
al banks
2,0
86,6
44,3
52
1,3
42,7
53,2
78
1,6
06,6
21,6
98
Cash b
ala
nces a
t oth
er
cre
dit institu
tions
133,6
55,5
05
-
133,6
55,5
05
449,4
01,3
47
419,9
94,7
61
F
inancia
l lia
bili
ties h
eld
for
tradin
g2,2
41,8
77,9
65
1,7
06,5
24,4
17
2,1
71,8
79,5
13
Fin
ancia
l assets
held
for
tradin
g6,0
63,5
88,5
79
-
6,0
63,5
88,5
79
2,5
78,2
28,5
84
2,2
25,7
63,4
04
R
esourc
es o
f oth
er
cre
dit institu
tions
3,7
51,8
33,8
12
4,3
64,0
64,4
38
4,4
13,2
64,9
54
Oth
er
financia
l assets
at
fair v
alu
e t
hro
ugh p
rofit
or
loss
549,6
80,4
61
-
549,6
80,4
61
570,1
18,1
26
584,0
21,9
29
C
usto
mer
resourc
es a
nd o
ther
loans
61,2
88,6
87,0
59
61,9
50,1
20,1
28
61,7
61,6
88,8
26
Ava
ilable
-for-
sale
fin
ancia
l assets
14,9
95,8
69,3
12
(436,2
58,3
71)
14,5
59,6
10,9
41
17,2
00,8
95,1
38
17,8
78,6
54,2
18
Debt
securities
6,1
14,8
93,1
67
6,6
86,1
30,9
48
7,1
20,4
11,7
42
Fin
ancia
l assets
with r
epurc
hase a
gre
em
ent
493,1
24,7
57
-
493,1
24,7
57
770,7
10,8
62
1,0
94,4
05,8
15
F
inancia
l lia
bili
ties a
ssocia
ted w
ith t
ransfe
rred a
ssets
4,2
20,6
00,5
51
4,3
47,7
59,0
72
4,5
67,3
90,8
45
Loans a
nd a
dva
nces t
o c
redit institu
tions
4,3
88,4
31,5
83
(7
,125,0
00)
4,3
81,3
06,5
83
4,9
51,9
61,1
10
3,6
45,5
95,4
29
H
edgin
g d
eriva
tive
s7,6
16,6
17
15,2
90,8
89
20,0
40,0
95
Loans a
nd a
dva
nces t
o c
usto
mers
58,5
71,1
83,9
37
(4,9
42,2
15,7
88)
53,6
28,9
68,1
49
54,3
70,4
68,5
56
56,1
53,6
88,9
61
Pro
visio
ns
780,6
89,1
76
845,0
94,7
27
702,6
79,5
77
Hedgin
g d
eriva
tive
s16,0
40,2
06
-
16,0
40,2
06
46,4
68,3
19
80,3
07,8
88
C
urr
ent
tax lia
bili
ties
10,5
73,1
53
8,0
38,1
32
2,3
78,8
43
Non-c
urr
ent
assets
held
for
sale
515,5
79,5
31
(121,6
45,6
50)
393,9
33,8
81
386,8
12,9
00
377,7
40,2
13
D
efe
rred t
ax lia
bili
ties
87,0
63,6
48
120,4
71,3
81
149,8
03,8
76
Inve
stm
ent
pro
pert
ies
2,7
00,6
23
-
2,7
00,6
23
3,0
00,6
23
2,9
50,6
23
Oth
er
subord
inate
d lia
bili
ties
2,5
76,9
77,9
83
2,6
04,4
04,3
29
2,6
06,2
73,3
52
Oth
er
tangib
le a
ssets
1,2
37,5
33,3
67
(9
03,1
49,5
84)
334,3
83,7
83
347,9
40,0
82
378,3
49,5
12
O
ther
liabili
ties
1,8
56,1
80,7
94
1,9
57,0
61,3
19
1,6
92,3
18,3
57
Inta
ngib
le a
ssets
695,4
96,2
79
(617,2
18,4
91)
78,2
77,7
88
81,0
38,4
23
85,5
27,2
43
Tota
l Lia
bili
ties
85,0
23,6
38,2
77
85,9
47,7
13,0
58
86,8
14,7
51,6
78
Inve
stm
ents
in a
ssocia
tes,
subsid
iaries a
nd join
t ve
ntu
res
4,4
50,1
86,5
68
(6
58,8
55,0
15)
3,7
91,3
31,5
53
3,7
65,0
78,0
21
3,3
21,2
19,7
60
S
hare
capital
5,9
00,0
00,0
00
5,9
00,0
00,0
00
5,9
00,0
00,0
00
Curr
ent
tax a
ssets
20,6
48,5
44
-
20,6
48,5
44
15,6
37,9
64
22,7
63,4
97
R
eva
luation r
eserv
es
237,1
38,2
21
368,0
24,6
07
473,9
28,8
11
Defe
rred t
ax a
ssets
1,3
66,2
08,8
18
-
1,3
66,2
08,8
18
1,2
62,8
62,9
74
1,2
65,4
65,2
01
O
ther
reserv
es a
nd r
eta
ined e
arn
ings
(1,4
04,5
06,3
11)
(1,5
86,4
03,4
83)
(1,7
16,1
17,1
55)
Oth
er
assets
3,2
93,3
65,8
90
(2
61,6
19,4
87)
3,0
31,7
46,4
03
2,2
30,5
66,9
50
2,7
34,4
43,5
29
N
et
incom
e for
the p
eriod
(302,5
39,7
15)
175,7
12,4
78
-
Tota
l E
quity
4,4
30,0
92,1
95
4,8
57,3
33,6
02
4,6
57,8
11,6
56
To
tal
Ass
ets
97,4
01,8
17,8
58
(7,9
48,0
87,3
86)
89,4
53,7
30,4
72
90,8
05,0
46,6
60
91,4
72,5
63,3
34
To
tal
Lia
bil
itie
s a
nd
Eq
uit
y89,4
53,7
30,4
72
90,8
05,0
46,6
60
91,4
72,5
63,3
34
30-0
6-2
016

CGD BOARD OF DIRECTORS’ REPORT – 1st HALF 2016 57
SEPARATE AND CONSOLIDATED FINANCIAL STATEMENTS
CAIXA GERAL DE DEPÓSITOS, S.A.
INCOME STATEMENT (SEPARATE)
(euros)
30-06-201630-06-2015
(restated)
Interest and similar income 1,014,228,247 1,137,830,699
Interest and similar costs (689,279,614) (851,292,067)
NET INTEREST INCOME 324,948,633 286,538,632
Income from equity instruments 41,823,620 59,429,673
Income from services and commissions 205,467,665 213,893,524
Costs of services and commissions (40,749,100) (42,835,666)
Net results of assets and liabilities measured at fair value through profit or loss (139,857,708) 131,797,676
Net gain on available-for-sale financial assets 75,270,254 115,716,116
Net foreign exchange revaluation gain 2,316,657 1,675,301
Net gain on the sale of other assets (10,368,660) 157,768,976
Other operating income (1,231,486) 32,971,983
TOTAL OPERATING INCOME 457,619,875 956,956,215
Employee costs (264,092,329) (260,546,442)
Other administrative costs (154,685,345) (165,157,542)
Depreciation and amortisation (32,267,819) (34,089,124)
Provisions net of reversals 12,886,318 (26,746,089)
Impairment of credit net of reversals (292,671,416) (214,336,221)
Impairment of other financial assets net of reversals (34,043,233) (35,184,336)
Impairment of other assets net of reversals (14,189,138) (9,639,991)
INCOME BEFORE TAX (321,443,087) 211,256,470
Income tax
Current (77,893,722) (71,229,318)
Deferred 96,797,094 (7,421,779)
18,903,372 (78,651,097)
NET INCOME FOR THE PERIOD (302,539,715) 132,605,373
Average number of ordinary shares outstanding 1,180,000,000 1,180,000,000
Earnings per share (in Euros) (0.26) 0.11
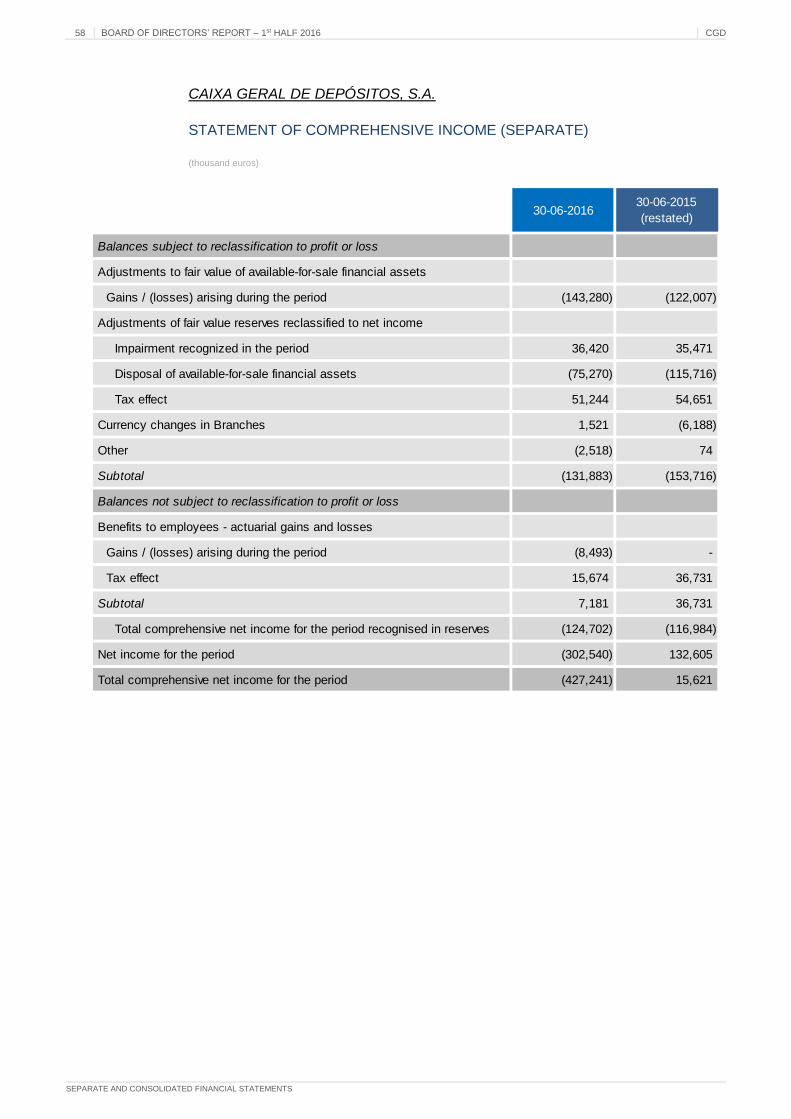
58 BOARD OF DIRECTORS’ REPORT – 1st HALF 2016 CGD
SEPARATE AND CONSOLIDATED FINANCIAL STATEMENTS
CAIXA GERAL DE DEPÓSITOS, S.A.
STATEMENT OF COMPREHENSIVE INCOME (SEPARATE)
(thousand euros)
30-06-201630-06-2015
(restated)
Balances subject to reclassification to profit or loss
Adjustments to fair value of available-for-sale financial assets
Gains / (losses) arising during the period (143,280) (122,007)
Adjustments of fair value reserves reclassified to net income
Impairment recognized in the period 36,420 35,471
Disposal of available-for-sale financial assets (75,270) (115,716)
Tax effect 51,244 54,651
Currency changes in Branches 1,521 (6,188)
Other (2,518) 74
Subtotal (131,883) (153,716)
Balances not subject to reclassification to profit or loss
Benefits to employees - actuarial gains and losses
Gains / (losses) arising during the period (8,493) -
Tax effect 15,674 36,731
Subtotal 7,181 36,731
Total comprehensive net income for the period recognised in reserves (124,702) (116,984)
Net income for the period (302,540) 132,605
Total comprehensive net income for the period (427,241) 15,621

CGD BOARD OF DIRECTORS’ REPORT – 1st HALF 2016 59
SEPARATE AND CONSOLIDATED FINANCIAL STATEMENTS
CAIXA GERAL DE DEPÓSITOS, S.A.
CASH FLOW STATEMENTS (SEPARATE)
(thousand euros)
30-06-2016 30-06-2015
OPERATING ACTIVITIES
Cash flows from operating activities before changes in assets and liabilities
Interest, commissions and similar income received 1,267,276 1,408,260
Interest, commissions and similar costs paid (615,629) (867,798)
Recovery of principal and interest 7,729 7,241
Payments to employees and suppliers (376,266) (405,609)
Payments and contributions to pensions funds and other benefits (49,605) (37,206)
Other results 1,608 31,651
235,113 136,538
(Increases) decreases in operating assets:
Loans and advances to credit institutions and customers 1,062,124 (477,106)
Assets held for trade and other assets at fair value through profit or loss (3,080,800) 1,009
Other assets (843,003) 286,005
(2,861,679) (190,092)
Increases (decreases) in operating liabilities:
Resources of central banks and other credit institutions 134,940 (179,411)
Customer resources (600,806) (930,114)
Other liabilities (191,265) 373,755
(657,131) (735,771)
Net cash from operating activities before taxation (3,283,698) (789,325)
Income tax (52,569) (31,277)
Net cash from operating activities (3,336,267) (820,602)
INVESTING ACTIVITIES
Capital gains from subsidiary and associated companies 38,099 42,313
Capital gains from available-for-sale financial assets 3,724 20,845
Acquisition of investments in subsidiary and associated companies, net of disposals (8,641) -
Acquisition of available-for-sale financial assets, net of disposals 2,581,537 (445,653)
Acquisition of tangible and intangible assets, net of disposals (18,462) (14,054)
Net cash from investing activities 2,596,257 (396,548)
FINANCING ACTIVITIES
Interest on subordinated liabilities (64,133) (64,989)
Interest on debt securities (135,482) (103,783)
Issue of subordinated liabilities, net of repayments (21,000) -
Issue of debt securities, net of repayments (520,173) 1,003,471
Net cash from financing activities (740,788) 834,699
Increase (decrease) in cash and cash equivalents (1,480,798) (382,452)
Cash and cash equivalents at beginning of period 2,223,258 1,621,666
Effects of the exchange rate change on cash and cash equivalents (281) 2,082
Net change of cash and cash equivalents (1,480,798) (382,452)
Cash and cash equivalents at end of period 742,179 1,241,296

60 BOARD OF DIRECTORS’ REPORT – 1st HALF 2016 CGD
SEPARATE AND CONSOLIDATED FINANCIAL STATEMENTS
CAIXA GERAL DE DEPÓSITOS, S.A.
STATEMENT OF CHANGES IN EQUITY (SEPARATE)
(thousand euros)
Fair v
alu
e
reserv
es
Reserv
es for
defe
rred t
ax
Fix
ed a
ssets
Tota
lLegal
reserv
eO
ther
reserv
es
Reta
ined
earn
ings
Tota
l
Bala
nces a
t D
ecem
ber
31,
2014
5,9
00,0
00
500,3
49
(136,8
46)
110,4
25
473,9
29
862,9
06
(128,7
09)
(2,1
91,3
64)
(1,4
57,1
66)
(1,1
39,3
20)
3,7
77,4
43
Effe
cts
of th
e c
hange in t
he a
ccounting p
olic
y (
Notice 5
/2015)
--
--
--
-435,0
14
435,0
14
445,3
56
880,3
69
Pro
form
a B
ala
nces a
t D
ecem
ber
31,
2014
5,9
00,0
00
500,3
49
(136,8
46)
110,4
25
473,9
29
862,9
06
(128,7
09)
(1,7
56,3
50)
(1,0
22,1
52)
(693,9
65)
4,6
57,8
12
Appro
priation o
f net
incom
e for
2014:
Tra
nsfe
r to
reserv
es a
nd r
eta
ined e
arn
ings
--
--
--
-(6
93,9
65)
(693,9
65)
693,9
65
-
Oth
er
entr
ies d
irectly r
ecord
ed in e
quity:
Measure
ment
gain
/ (
losses)
on a
vaila
ble
-for-
sale
fin
ancia
l assets
-(2
02,2
52)
54,6
51
-(1
47,6
02)
--
--
-(1
47,6
02)
Em
plo
yee b
enefit
s -
actu
arial gain
s a
nd losses
--
--
--
36,7
31
-36,7
31
-36,7
31
Curr
ency c
hanges in B
ranches
--
--
--
(6,1
88)
-(6
,188)
-(6
,188)
Oth
er
--
--
--
74
-74
-74
Tota
l gain
s a
nd losses f
or
the p
eriod r
ecognis
ed in e
quity
-(2
02,2
52)
54,6
51
-(1
47,6
02)
-30,6
17
-30,6
17
-(1
16,9
84)
Recla
ssifi
cations b
etw
een r
eserv
es a
nd r
eta
ined e
arn
ings
--
--
--
(5,2
11)
5,2
11
--
Net
incom
e for
the p
eriod
--
--
--
--
-132,6
05
132,6
05
Bala
nces a
t Ju
ne 3
0,
2015
5,9
00,0
00
298,0
97
(82,1
95)
110,4
25
326,3
27
862,9
06
(103,3
02)
(2,4
45,1
04)
(1,6
85,5
00)
132,6
05
4,6
73,4
33
Bala
nces a
t D
ecem
ber
31,
2015
5,9
00,0
00
354,5
76
(96,9
77)
110,4
25
368,0
25
862,9
06
(6,3
95)
(3,3
30,2
02)
(2,4
73,6
91)
12,2
11
3,8
06,5
44
Effe
cts
of th
e c
hange in t
he a
ccounting p
olic
y (
Notice 5
/2015)
--
--
--
-887,2
88
887,2
88
163,5
02
1,0
50,7
90
Pro
form
a B
ala
nces a
t D
ecem
ber
31,
2015
5,9
00,0
00
354,5
76
(96,9
77)
110,4
25
368024.9
5862,9
06
(6,3
95)
(2,4
42,9
15)
(1,5
86,4
03)
175,7
12
4,8
57,3
34
Appro
priation o
f net
incom
e for
2015:
Tra
nsfe
r to
reserv
es a
nd r
eta
ined e
arn
ings
--
--
-2,4
42
-173,2
70
175,7
12
(175,7
12)
-
Oth
er
entr
ies d
irectly r
ecord
ed in e
quity:
Measure
ment
gain
/ (
losses)
on a
vaila
ble
-for-
sale
fin
ancia
l assets
-(1
82,1
31)
51,2
44
(130,8
86)
--
--
-(1
30,8
86)
Em
plo
yee b
enefit
s -
actu
arial gain
s a
nd losses
--
--
--
7,1
81
-7,1
81
-7,1
81
Curr
ency c
hanges in B
ranches
--
--
--
1,5
21
-1,5
21
-1,5
21
Oth
er
--
--
--
(2,5
18)
-(2
,518)
-(2
,518)
Tota
l gain
s a
nd losses f
or
the p
eriod r
ecognis
ed in e
quity
-(1
82,1
31)
51,2
44
-(1
30,8
86)
-6,1
85
-6,1
85
-(1
24,7
02)
Recla
ssifi
cations b
etw
een r
eserv
es a
nd r
eta
ined e
arn
ings
--
--
--
(17,2
19)
17,2
19
--
-
Net
incom
e for
the p
eriod
--
--
--
--
-(3
02,5
40)
(302,5
40)
Bala
nces a
t Ju
ne 3
0,
2016
5,9
00,0
00
172,4
45
(45,7
32)
110,4
25
237,1
39
865,3
48
(17,4
29)
(2,2
52,4
26)
(1,4
04,5
06)
(302,5
40)
4,4
30,0
92
Share
capital
Reva
luation r
eserv
es
Oth
er
reserv
es a
nd r
eta
ined e
arn
ings
Net
incom
e for
the p
eriod
Tota
l

CGD BOARD OF DIRECTORS’ REPORT – 1st HALF 2016 61
SEPARATE AND CONSOLIDATED FINANCIAL STATEMENTS
CAIXA GERAL DE DEPÓSITOS, S.A.
CONSOLIDATED BALANCE SHEET
(euros)
31-1
2-2
015
AS
SE
TS
Note
s
Am
ounts
befo
re
impairm
ent,
am
ort
isation a
nd
depre
cia
tion
Impairm
ent,
am
ort
isation a
nd
depre
cia
tion
Net
assets
Net
assets
LIA
BIL
ITIE
S A
ND
EQ
UIT
Y
Note
s30-0
6-2
016
31-1
2-2
015
Cash a
nd c
ash e
quiv
ale
nts
at
centr
al banks
41,5
02,6
63,5
34
-1,5
02,6
63,5
34
2,8
79,6
44,9
47
Resourc
es o
f centr
al banks a
nd o
ther
cre
dit institu
tions
18
5,7
68,6
02,1
39
5,4
33,0
70,3
65
Cash b
ala
nces a
t oth
er
cre
dit institu
tions
5440,1
87,4
08
-440,1
87,4
08
773,1
63,0
78
Custo
mer
resourc
es a
nd o
ther
loans
19
72,4
41,8
12,7
89
73,4
26,2
64,5
96
Loans a
nd a
dva
nces t
o c
redit institu
tions
63,2
08,9
09,7
12
(7,1
25,0
00)
3,2
01,7
84,7
12
4,0
11,5
14,9
33
Debt
securities
20
6,1
16,8
72,3
66
6,7
00,0
80,5
95
5,1
51,7
60,6
54
(7,1
25,0
00)
5,1
44,6
35,6
54
7,6
64,3
22,9
58
78,5
58,6
85,1
55
80,1
26,3
45,1
91
Fin
ancia
l assets
at
fair v
alu
e t
hro
ugh p
rofit
or
loss
76,7
34,1
96,0
87
-6,7
34,1
96,0
87
3,3
65,8
76,8
36
Fin
ancia
l lia
bili
ties a
t fa
ir v
alu
e t
hro
ugh p
rofit
or
loss
10
2,2
61,9
06,3
67
1,7
38,5
96,8
59
Ava
ilable
-for-
sale
fin
ancia
l assets
813,5
48,6
54,9
71
(384,0
52,9
87)
13,1
64,6
01,9
84
15,6
20,4
41,7
46
Hedgin
g d
eriva
tive
s10
3,6
11,4
53
10,8
11,5
89
Fin
ancia
l assets
with r
epurc
hase a
gre
em
ent
9856,5
58,4
72
(967,1
64)
855,5
91,3
08
1,0
81,1
65,7
20
Pro
visio
ns for
em
plo
yee b
enefit
s21
613,3
87,8
80
642,9
58,3
45
Hedgin
g d
eriva
tive
s10
16,0
40,2
06
-16,0
40,2
06
46,4
68,3
19
Pro
visio
ns for
oth
er
risks
21
282,2
03,9
04
349,5
05,5
35
Held
-to-m
atu
rity
inve
stm
ents
11
237,8
50,0
99
-237,8
50,0
99
-C
urr
ent
tax lia
bili
ties
16
47,0
15,6
93
15,8
63,7
40
21,3
93,2
99,8
35
(385,0
20,1
51)
21,0
08,2
79,6
84
20,1
13,9
52,6
21
Defe
rred t
ax lia
bili
ties
16
131,8
76,8
03
253,2
24,0
10
Loans a
nd a
dva
nces t
o c
usto
mers
12
70,3
20,9
35,4
35
(5,3
89,8
46,1
80)
64,9
31,0
89,2
55
65,7
59,0
32,6
56
Oth
er
subord
inate
d lia
bili
ties
22
2,3
99,5
24,6
31
2,4
28,9
25,4
99
Non-c
urr
ent
assets
held
for
sale
13
1,1
17,6
42,5
57
(368,1
54,2
55)
749,4
88,3
02
830,4
01,6
01
Oth
er
liabili
ties
23
3,5
43,1
03,2
80
3,7
18,4
56,5
05
Inve
stm
ent
pro
pert
ies
14
1,1
83,9
49,9
27
-1,1
83,9
49,9
27
1,1
25,0
44,3
72
Tota
l lia
bili
ties
93,6
09,9
17,3
05
94,7
17,7
57,6
38
Oth
er
tangib
le a
ssets
1,6
37,6
88,9
59
(1,0
65,1
04,1
22)
572,5
84,8
37
619,3
69,8
53
Share
capital
24
5,9
00,0
00,0
00
5,9
00,0
00,0
00
Inta
ngib
le a
ssets
846,6
59,1
24
(712,6
44,6
99)
134,0
14,4
25
135,0
31,7
33
Fair v
alu
e r
eserv
es
25
111,2
63,8
55
258,8
15,9
35
Inve
stm
ents
in a
ssocia
tes a
nd join
tly c
ontr
olle
d e
ntities
15
267,0
51,2
32
-267,0
51,2
32
277,4
95,7
50
Oth
er
reserv
es a
nd r
eta
ined e
arn
ings
25
(913,3
15,4
94)
(690,7
01,7
92)
Curr
ent
tax a
ssets
16
40,7
21,5
76
-40,7
21,5
76
37,1
26,3
44
Net
incom
e a
ttributa
ble
to t
he s
hare
hold
er
of C
GD
25
(205,2
43,4
15)
(171,4
52,9
59)
Defe
rred t
ax a
ssets
16
1,5
58,6
78,7
91
-1,5
58,6
78,7
91
1,4
73,9
17,5
13
Equity a
ttributa
ble
to t
he s
hare
hold
er
of C
GD
4,8
92,7
04,9
46
5,2
96,6
61,1
84
Oth
er
assets
17
4,0
79,7
20,1
76
(315,2
76,8
54)
3,7
64,4
43,3
22
2,8
65,7
71,8
82
Non-c
ontr
olli
ng inte
rests
26
852,3
14,7
54
887,0
48,4
61
Tota
l equity
5,7
45,0
19,7
00
6,1
83,7
09,6
45
To
tal
ass
ets
107,5
98,1
08,2
66
(8,2
43,1
71,2
61)
99,3
54,9
37,0
05
100,9
01,4
67,2
83
To
tal
lia
bil
itie
s a
nd
eq
uit
y99,3
54,9
37,0
05
100,9
01,4
67,2
83
30-0
6-2
016

62 BOARD OF DIRECTORS’ REPORT – 1st HALF 2016 CGD
SEPARATE AND CONSOLIDATED FINANCIAL STATEMENTS
CAIXA GERAL DE DEPÓSITOS, S.A.
CONSOLIDATED INCOME STATEMENTS
(euros)
Notes 30-06-2016 30-06-2015
Interest and similar income 27 1,378,131,831 1,519,979,367
Interest and similar expenses 27 (809,434,788) (981,115,362)
Income from equity instruments 28 29,640,442 43,188,356
NET INTEREST INCOME 598,337,485 582,052,361
Income from services rendered and commissions 29 291,488,557 311,868,555
Cost of services and commissions 29 (61,341,007) (64,165,255)
Results from financial operations 30 (47,418,090) 301,989,104
Other operating income 31 (26,407,198) 22,418,086
TOTAL OPERATING INCOME 754,659,747 1,154,162,851
Employee costs 32 (374,528,492) (377,022,656)
Other administrative costs 33 (216,700,005) (223,536,035)
Depreciation and amortisation (48,041,407) (51,984,466)
Provisions net of reversals 21 17,425,172 (20,367,842)
Loan impairment net of reversals and recoveries 34 (302,521,553) (235,761,650)
Other assets impairment net of reversals and recoveries 34 (43,323,647) (65,567,958)
Results of subsidiaries held for sale - - (348,696)
Results of associates and jointly controlled entities 19,920,279 33,909,310
INCOME BEFORE TAX AND NON CONTROLLING INTERESTS (193,109,906) 213,482,858
Income tax
Current 18 (105,280,644) (106,867,146)
Deferred 18 117,817,617 (12,737,955)
12,536,973 (119,605,101)
CONSOLIDATED NET INCOME FOR THE PERIOD, of which: (180,572,933) 93,877,757
Non-controlling interests 26 (24,670,482) (46,816,662)
NET INCOME ATTRIBUTABLE TO THE SHAREHOLDER OF CGD (205,243,415) 47,061,095
Average number of ordinary shares outstanding 24 1,180,000,000 1,180,000,000
Earnings per share (in Euros) (0.17) 0.04

CGD BOARD OF DIRECTORS’ REPORT – 1st HALF 2016 63
SEPARATE AND CONSOLIDATED FINANCIAL STATEMENTS
CAIXA GERAL DE DEPÓSITOS, S.A.
CONSOLIDATED STATEMENT OF COMPREHENSIVE INCOME
(thousand euros)
30-06-2016 30-06-2015
Balances subject to reclassification to profit or loss
Adjustments to fair value of available-for-sale financial assets
Gains / (losses) arising during the period (182,044) (191,707)
Adjustments of fair value reserves reclassified to net income
Impairment recognized in the period 36,420 34,255
Disposal of available-for-sale financial assets (75,270) (131,671)
Tax effect 45,838 78,884
Foreign exchange difference
Gains / (losses) arising during the period (69,539) (4,853)
Adjustments of exchange reserves reclassification to results
Impairment recognized in the period for available-for-sale financial assets
- Investment units in foreign currency 7 (67)
Tax effect 1,172 (2,498)
Other (3,810) 16,976
(247,227) (200,683)
Balances not subject to reclassification to profit or loss
Employee benefits - actuarial gains and losses
Gains / (losses) arising during the period (8,493) -
Tax effect 15,674 36,731
7,181 36,731
Total comprehensive net income for the period recognised in reserves (240,047) (163,951)
Net income for the period (180,573) 93,878
TOTAL COMPREHENSIVE NET INCOME FOR THE PERIOD, of which: (420,619) (70,073)
Non-controlling interests 18,588 (29,586)
TOTAL COMPREHENSIVE NET INCOME ATTRIBUTABLE TO THE SHAREHOLDER OF CGD(402,031) (99,659)
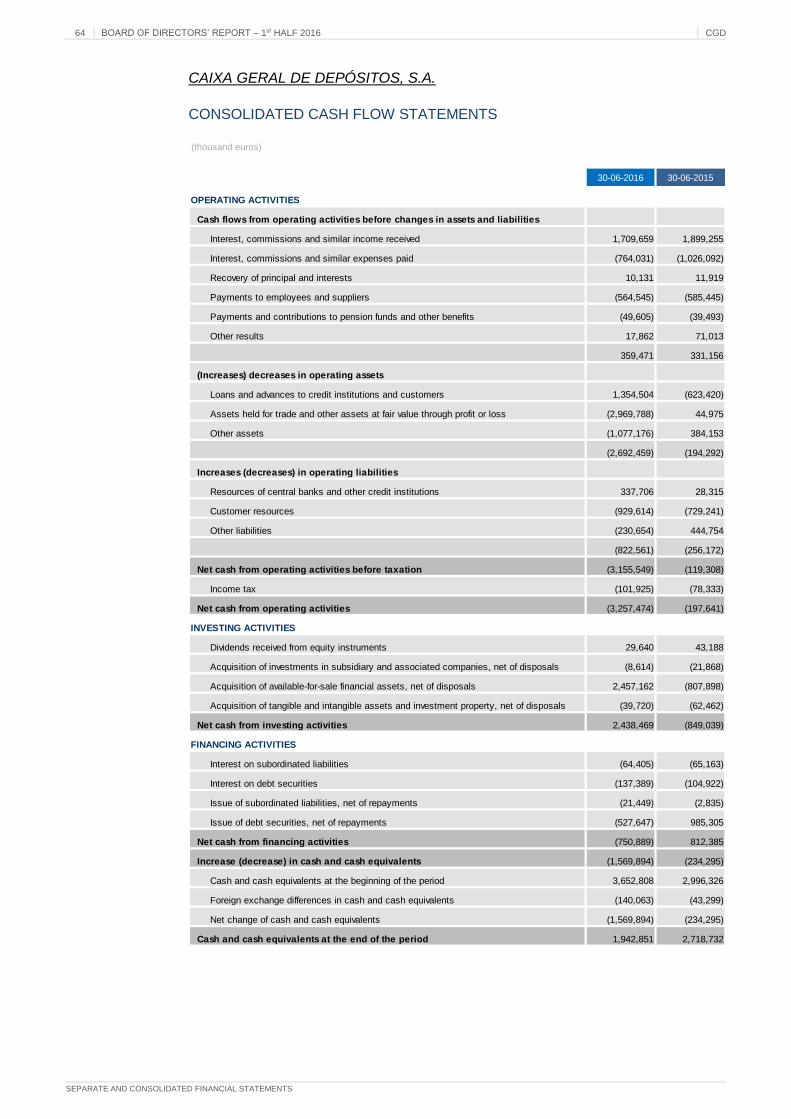
64 BOARD OF DIRECTORS’ REPORT – 1st HALF 2016 CGD
SEPARATE AND CONSOLIDATED FINANCIAL STATEMENTS
CAIXA GERAL DE DEPÓSITOS, S.A.
CONSOLIDATED CASH FLOW STATEMENTS
(thousand euros)
30-06-2016 30-06-2015
OPERATING ACTIVITIES
Cash flows from operating activities before changes in assets and liabilities
Interest, commissions and similar income received 1,709,659 1,899,255
Interest, commissions and similar expenses paid (764,031) (1,026,092)
Recovery of principal and interests 10,131 11,919
Payments to employees and suppliers (564,545) (585,445)
Payments and contributions to pension funds and other benefits (49,605) (39,493)
Other results 17,862 71,013
359,471 331,156
(Increases) decreases in operating assets
Loans and advances to credit institutions and customers 1,354,504 (623,420)
Assets held for trade and other assets at fair value through profit or loss (2,969,788) 44,975
Other assets (1,077,176) 384,153
(2,692,459) (194,292)
Increases (decreases) in operating liabilities
Resources of central banks and other credit institutions 337,706 28,315
Customer resources (929,614) (729,241)
Other liabilities (230,654) 444,754
(822,561) (256,172)
Net cash from operating activities before taxation (3,155,549) (119,308)
Income tax (101,925) (78,333)
Net cash from operating activities (3,257,474) (197,641)
INVESTING ACTIVITIES
Dividends received from equity instruments 29,640 43,188
Acquisition of investments in subsidiary and associated companies, net of disposals (8,614) (21,868)
Acquisition of available-for-sale financial assets, net of disposals 2,457,162 (807,898)
Acquisition of tangible and intangible assets and investment property, net of disposals (39,720) (62,462)
Net cash from investing activities 2,438,469 (849,039)
FINANCING ACTIVITIES
Interest on subordinated liabilities (64,405) (65,163)
Interest on debt securities (137,389) (104,922)
Issue of subordinated liabilities, net of repayments (21,449) (2,835)
Issue of debt securities, net of repayments (527,647) 985,305
Net cash from financing activities (750,889) 812,385
Increase (decrease) in cash and cash equivalents (1,569,894) (234,295)
Cash and cash equivalents at the beginning of the period 3,652,808 2,996,326
Foreign exchange differences in cash and cash equivalents (140,063) (43,299)
Net change of cash and cash equivalents (1,569,894) (234,295)
Cash and cash equivalents at the end of the period 1,942,851 2,718,732

CGD BOARD OF DIRECTORS’ REPORT – 1st HALF 2016 65
SEPARATE AND CONSOLIDATED FINANCIAL STATEMENTS
CAIXA GERAL DE DEPÓSITOS, S.A.
CONSOLIDATED STATEMENT OF CHANGES IN EQUITY
(thousand euros)
Bala
nces a
t D
ecem
ber
31,
2014
5,9
00,0
00
411,8
10
1,8
14,5
58
(2,2
52,4
95)
(437,9
37)
(348,0
44)
5,5
25,8
29
966,9
31
6,4
92,7
60
Appro
priation o
f net
incom
e for
2014:
Tra
nsfe
r to
reserv
es a
nd r
eta
ined e
arn
ings
--
791,2
76
(1,1
39,3
20)
(348,0
44)
348,0
44
--
-
Oth
er
entr
ies d
irectly r
ecord
ed in e
quity:
Gain
/(lo
sses)
on a
vaila
ble
-for-
sale
fin
ancia
l assets
-(2
10,9
43)
3,2
45
-3,2
45
-(2
07,6
98)
(2,5
42)
(210,2
40)
Em
plo
yee b
enefit
s -
actu
arial gain
s a
nd losses
--
36,7
31
-36,7
31
-36,7
31
-36,7
31
Fore
ign c
urr
ency d
iffere
nces in s
ubsid
iaries a
nd b
ranches
--
15,8
33
-15,8
33
-15,8
33
(23,2
51)
(7,4
19)
Oth
er
--
8,4
14
-8,4
14
-8,4
14
8,5
62
16,9
76
Tota
l gain
s a
nd losses f
or
the p
eriod r
ecognis
ed in e
quity
-(2
10,9
43)
64,2
23
-64,2
23
-(1
46,7
20)
(17,2
31)
(163,9
51)
Writt
en-p
ut
ove
r non c
ontr
olli
ng inte
rests
- P
art
ang
--
(35,0
14)
-(3
5,0
14)
-(3
5,0
14)
-(3
5,0
14)
Inve
stm
ents
carr
ied o
ut
by n
on-c
ontr
olli
ng inte
rests
-
--
--
--
22,2
90
22,2
90
Div
idends p
aid
on p
refe
rence s
hare
s a
nd o
ther
div
idends p
aid
to n
on-c
ontr
olli
ng inte
rests
--
--
--
-(1
8,8
99)
(18,8
99)
Recla
ssifi
cations b
etw
een r
eserv
es a
nd r
eta
ined e
arn
ings
--
(66,3
42)
66,3
42
--
--
-
Net
incom
e for
the p
eriod
--
--
-47,0
61
47,0
61
46,8
17
93,8
78
Bala
nces a
t Ju
ne 3
0,
2015
5,9
00,0
00
200,8
67
2,5
68,7
01
(3,3
25,4
73)
(756,7
73)
47,0
61
5,3
91,1
55
999,9
08
6,3
91,0
63
Bala
nces a
t D
ecem
ber
31,
2015
5,9
00,0
00
258,8
16
2,7
00,6
32
(3,3
91,3
33)
(690,7
02)
(171,4
53)
5,2
96,6
61
887,0
48
6,1
83,7
10
Appro
priation o
f net
incom
e for
2015:
Tra
nsfe
r to
reserv
es a
nd r
eta
ined e
arn
ings
--
(344,7
23)
173,2
70
(171,4
53)
171,4
53
--
-
Oth
er
entr
ies d
irectly r
ecord
ed in e
quity:
Gain
/(lo
sses)
on a
vaila
ble
-for-
sale
fin
ancia
l assets
-(1
47,5
52)
(25,5
60)
-(2
5,5
60)
-(1
73,1
12)
(1,9
44)
(175,0
56)
Em
plo
yee b
enefit
s -
actu
arial gain
s a
nd losses
--
7,1
81
-7,1
81
-7,1
81
-7,1
81
Fore
ign c
urr
ency d
iffere
nces in s
ubsid
iaries a
nd b
ranches
--
(29,8
38)
-(2
9,8
38)
-(2
9,8
38)
(38,5
23)
(68,3
61)
Oth
er
--
(1,0
18)
-(1
,018)
-(1
,018)
(2,7
92)
(3,8
10)
Tota
l gain
s a
nd losses f
or
the p
eriod r
ecognis
ed in e
quity
-(1
47,5
52)
(49,2
36)
-(4
9,2
36)
-(1
96,7
88)
(43,2
59)
(240,0
47)
Writt
en-p
ut
ove
r non-c
ontr
olli
ng inte
rests
- P
art
ang
--
(1,9
25)
-(1
,925)
-(1
,925)
-(1
,925)
Inve
stm
ents
carr
ied o
ut
by n
on-c
ontr
olli
ng inte
rests
-
--
--
-(2
,212)
(2,2
12)
Div
idends p
aid
on p
refe
rence s
hare
s a
nd o
ther
div
idends p
aid
to n
on-c
ontr
olli
ng inte
rests
--
--
--
(13,9
33)
(13,9
33)
Recla
ssifi
cations b
etw
een r
eserv
es a
nd r
eta
ined e
arn
ings
--
(939,7
12)
939,7
12
--
--
-
Net
incom
e for
the p
eriod
--
--
-(2
05,2
43)
(205,2
43)
24,6
70
(180,5
73)
Bala
nces a
t Ju
ne 3
0,
2016
5,9
00,0
00
111,2
64
1,3
65,0
35
(2,2
78,3
51)
(913,3
15)
(205,2
43)
4,8
92,7
05
852,3
15
5,7
45,0
20
Net
incom
e for
the p
eriod
Subto
tal
Non-c
ontr
olli
ng
inte
rests
Tota
l
Oth
er
reserv
es a
nd r
eta
ined e
arn
ings
Share
capital
Fair v
alu
e
reserv
eO
ther
reserv
es
Reta
ined
earn
ings
Tota
l

66 NOTES ON THE ACCOUNTS CGD
NOTES TO THE CONSOLIDATED FINANCIAL STATEMENTS
2. NOTES ON THE ACCOUNTS
2.1. Notes to the Consolidated Financial
Statements
(Amounts expressed in thousand euros – unless otherwise indicated)
1. INTRODUCTORY NOTE
Caixa Geral de Depósitos, S.A., (Caixa or CGD), founded in 1876, is an exclusively state-
owned public liability limited company. Caixa became a state-owned company on 1
September 1993 under decree law 287/93 of August 20, which also approved its
respective articles of association. Banco Nacional Ultramarino, S.A. (BNU) was merged
with Caixa on July 23, 2001.
At June 30, 2016, CGD had a nationwide network of 731 branch offices, with a branch in
France having 48 offices, a branch in Timor with 14 offices, a branch in Luxembourg with
2 offices and branches in Spain, London, New York, Cayman Islands, Zhuhai and Macau.
Caixa also has direct and indirect equity stakes in a significant number of domestic and
foreign companies, in Spain, Cape Verde, Angola, Mozambique, South Africa, Brazil and
Macau, in which it has majority shareholdings. These companies comprise Caixa Geral
de Depósitos group (group) and operate in various sectors such as banking, investment
banking, brokerage, venture capital, the property area, asset management, specialised
credit, e-commerce and cultural activities. Caixa also has equity stakes in companies
operating in non-financial sectors of the Portuguese economy.
The consolidated financial statements, at June 30, 2016, were approved by the board of
directors at August 30, 2016.
The European Commission approved CGD’s restructuring plan, as submitted by the
Portuguese state, in July 2013, as part of its respective recapitalisation process.
The recapitalisation was required in the context of the new regulatory requirements
imposed by the European Banking Authority (EBA) which resulted in the need for
additional capital of €1,650 million (€750 million in the form of a capital increase and €900
million in core tier 1 equity instruments (note 22), subscribed for in June 2012 by its state
shareholder but considered by the European Commission to be state aid.
CGD’s approved restructuring plan focuses on the institution’s role in backing companies
and individual customers in Portugal and was based on three main operating areas which
reinforce the strategy which is already being implemented:
- Deleveraging of CGD group’s balance sheet with the disposal of its
insurance arm and non-strategic investments (already done), in addition to
its run-down of non-core assets;
- Improvement of operational efficiency, continuing its endeavours, already in
progress, to reduce operating costs by optimising the number of branches
and employees and renegotiating service agreements;
- Restructuring of activity and streamlining of CGD’s branch office network in
Spain with the objective of ensuring its long term feasibility and autonomy
from CGD in funding terms, in addition to ensuring a positive contribution to
group income. This restructuring operation, involving the streamlining of its

CGD NOTES ON THE ACCOUNTS 67
NOTES TO THE CONSOLIDATED FINANCIAL STATEMENTS
branch office network and optimisation of services and processes, resulted
in a downsizing of employee numbers and the concentration of CGD’s non-
core assets in its Spain branch which was given responsibility for the
respective run-off.
The first phase of the implementation of the plan for Spain was completed in
December 2015, with the defined KPIs having been fully complied with.
CGD and CGD group undertook:
a) Not to make any equity investments or acquire any collection of assets
comprising the performance of an activity, in excess of certain limits. This
commitment, however, does not apply in certain situations, such as acquisitions
in the sphere of CGD’s current activity related with the management of loans to
customers in distress;
b) Not to implement aggressive commercial strategies;
c) To reduce proprietary trading activities to the minimum required by the treasury
function;
d) Not to make reference to state aid or any advantages therefrom deriving for
advertising purposes;
e) Not to pay any dividends, coupons or interest to holders of preference shares or
subordinated debt, when such payments do not derive from a contractual or legal
obligation. Such payments are, however, permitted if it can be shown that any
failure to make such payments may prejudice the redemption of the core tier 1
capital instruments issued by CGD and subscribed for by the state in June 2012;
f) To invest €30 million per annum in a fund to invest in the equity of Portuguese
SMEs and mid-caps, under the recapitalisation plan agreed with the Portuguese
state and in Portuguese mid-caps. Investment in excess of the said amount must
be approved in advance by the European Commission;
g) To continue to expand its operational risk monitoring policy and implement
prudent, safe commercial policies geared to sustainability;
h) To appoint a monitoring trustee, responsible for overseeing the implementation
and execution of the measures contained in the restructuring plan;
i) Not to set up new business units in geographies in which CGD group was not
previously present;
j) To comply with all regulations and legal requirements on remuneration policies.

68 NOTES ON THE ACCOUNTS CGD
NOTES TO THE CONSOLIDATED FINANCIAL STATEMENTS
2. ACCOUNTING POLICIES
2.1. Presentation bases
The consolidated financial statements, at June 30, 2016, were prepared on the basis of
the international financial reporting standards (IFRS), as adopted in the European Union,
under European Council and Parliament regulation (EC) 1606/2002 of July 19 and decree
law 35/2005 of February 17.
These financial statements are set out in conformity with the requirements of IAS 34 –
“interim financial reporting” but do not include all of the information required for the
preparation of the annual financial statements.
The accounting policies described in this note have been consistently applied across all
of the periods set out in the financial statements.
2.2. Consolidation principles
The consolidated financial statements include the accounts of CGD and entities directly
and indirectly controlled by the group (note 3), including special purpose entities.
As required by IFRS 10, the group considers that it wields control when it is exposed or
has rights to the variable returns generated by a specific entity (referred to as a
"subsidiary") and when it may, based on the application of the power retained by it and its
relevant capacity to superintend their activities, take control of them (de facto power).
The accounts of CGD’s subsidiaries were consolidated by the integral consolidation
method in which significant transactions and balances between the consolidated
companies have been eliminated. Consolidation adjustments are also made, when
applicable, to ensure the consistent application of the group’s accounting principles.
The amount of third party investment in subsidiaries is recognised in "non-controlling
interests" in equity. In the specific case of investment funds included in the consolidation
perimeter, whenever holders of non-controlling interests have redemption options on an
investment at its equity value, this is recognised in "Other liabilities" (note 23), whose
corresponding changes are recognised in a respective profit and loss account.
Consolidated profit is based on CGD’s and its subsidiaries’ aggregate net income in
proportion to their effective stakes, after consolidation adjustments, i.e. the elimination of
dividends received and capital gains and losses made on transactions between
companies included in the consolidation perimeter.
2.3. Business combinations and goodwill
Acquisitions of subsidiaries are recognised by the purchase method. The acquisition cost
comprises the aggregate fair value of assets delivered, equity instruments issued and
liabilities incurred or assumed in exchange for achieving control over the acquired entity.
The costs incurred on the acquisition, when directly attributable to the operation are
recognised as costs for the period on the purchase date. On the acquisition date, which is
the date upon which the group achieves control over the subsidiary, identifiable assets,
liabilities and contingent liabilities meeting the recognition requirements of IFRS 3 –
“Business combinations” are recognised at their respective fair value.
Goodwill is the positive difference, between the cost of a subsidiary’s acquisition and the
fair value attributable to the acquisition of its respective assets, liabilities and contingent
liabilities on the purchase date. Goodwill is recognised as an asset and is not
depreciated.

CGD NOTES ON THE ACCOUNTS 69
NOTES TO THE CONSOLIDATED FINANCIAL STATEMENTS
If the fair value of the identifiable assets, liabilities and contingent liabilities acquired in the
transaction exceeds the acquisition cost, the excess should be recognised as income in
profit and loss for the year.
The acquisition of non-controlling interests after control over a subsidiary has been
achieved is recognised as an operation with shareholders and no additional goodwill is
recognised. The difference between the value attributed to non-controlling interests and
the respective acquisition cost, on the transaction date, is directly recognised as a charge
to reserves. The impacts of disposals of non-controlling interests which do not entail a
loss of control over a subsidiary are also recognised in reserves. Profit or loss on
disposals of non-controlling interests, when entailing changes in control over the
subsidiary, are recognised by the group as a charge to profit and loss on the transaction
date.
The group performs impairment tests on balance sheet goodwill, at least once a year, in
accordance with the requirements of IAS 36 – “Impairment of assets”. For this purpose,
goodwill is allocated to cash flow generating units and its respective recoverable value is
based on future cash flow estimates at discount rates considered by the group to be
appropriate. Impairment losses associated with goodwill are recognised in profit and loss
for the period and cannot be reversed.
Up to January 1, 2004, as permitted by the accounting policies defined by the Bank of
Portugal, goodwill was fully deducted from equity in the year of the acquisition of the
subsidiaries. As permitted under IFRS 1, as the group did not make any changes to this
procedure, goodwill, generated on operations, up to January 1, 2004, continued to be
deducted from reserves.
Accounting of written put options
Liabilities resulting from put options written over non-controlling interests are initially
recognised by the group as a charge to “Other reserves”. Subsequent changes to the fair
value of the put option measured on the basis of the agreed terms, are also recognised
as a charge to “Other reserves”, except for the funding costs on the recognition of the
liability, which are recognised in “Interest and similar costs” in profit and loss.
2.4. Investments in associates and jointly controlled enterprises
Associated companies are entities over which the group wields significant influence, but
whose management it does not effectively control. Significant influence is presumed to
exist whenever the group has a direct or indirect equity stake or voting rights of 20%,
unless it can clearly be shown that this is not the case. In parallel, no significant influence
is considered to exist whenever the referred to investment is less than 20%, unless the
opposite, in this case, can also be clearly shown.
According to IAS 28 requirements, a significant influence by the group usually comprises
one of the following:
. A seat on the board of directors or equivalent management body;
. Participation in the process for defining policies, including resolutions on dividends or
other appropriations;
. The occurrence of material transactions between associate and group;
. The existence of interchange between members of management;
. The supply of essential technical information.
There are also situations in which the group, in conjunction with other entities, wields joint
control over the activity of a company in which the equity stake is held ("jointly controlled

70 NOTES ON THE ACCOUNTS CGD
NOTES TO THE CONSOLIDATED FINANCIAL STATEMENTS
entities"), usually structured on a basis of the sharing of voting rights and similar
decisions.
Investments in associates and jointly controlled enterprises are recognised by the equity
accounting method. Under this method, investments are initially valued at their respective
acquisition cost which is subsequently adjusted on the basis of the group’s effective
percentage of changes in its associates’ equity (including its results). The equity
accounting method is applied up to the time when the accumulated losses incurred by the
associate or jointly controlled entity and recognised by the group, exceed the
investment’s respective balance sheet value from which time it is discontinued, unless
any legal or constructive obligation requires a provision to be set up on such losses.
In the case of materially relevant differences, adjustments are made to the equity of the
companies, used for the application of the equity accounting method, to comply with the
group’s accounting principles.
Goodwill, comprising the positive difference between the acquisition cost and fair value
attributed to the acquisition of the respective assets, liabilities and contingent liabilities,
continues to be recognised in the investment’s respective carrying amount, whose full
balance sheet amount is subject to annual impairment tests.
Unrealised gains or losses on transactions with associated companies and jointly
controlled entities are eliminated to the extent of the group’s effective stake in the said
entities.
2.5. Translation of balances and transactions in foreign currency
The separate accounts of each group entity included in the consolidation are prepared in
accordance with the currency used in the economic area in which they operate and
referred to as the “functional currency”. In the consolidated accounts, the results and
financial position of each entity are expressed in euros as CGD group’s functional
currency.
Foreign currency transactions are recognised in Caixa’s and its subsidiaries’ separate
financial statements on the basis of the reference exchange rates in force on the
transaction dates.
Monetary assets and liabilities in foreign currency, at each balance sheet date, are
translated into each entity’s functional currency at the exchange rate in force. Non-
monetary assets measured at fair value are translated on the basis of the exchange rate
in force on the last measurement date. Non-monetary assets carried at historical cost,
including tangible and intangible assets, continue to be recognised at their original
exchange rate.
Exchange rate gains and losses arising on translation are recognised in profit and loss for
the period, except for those arising on non-monetary financial instruments recognised at
fair value, such as shares classified as available-for-sale financial assets, which are
recognised in a specific equity account until disposal.
In the consolidated accounts, the assets and liabilities of entities with a functional
currency other than the euro are translated at the closing exchange rate, as opposed to
income and expenses which are translated at the average rate for the period. Under this
method, translation differences are recognised in “Other reserves” in shareholders’ equity
and their respective balance is transferred to profit and loss at the time of the disposal of
the respective subsidiaries.
As permitted by IFRS 1, the group opted not to recalculate and therefore did not
recognise the impact of the translation of its subsidiaries’ financial statements when
expressed in foreign currency up to December 31, 2003 in “Other reserves”. Accordingly

CGD NOTES ON THE ACCOUNTS 71
NOTES TO THE CONSOLIDATED FINANCIAL STATEMENTS
in the case of the disposal of subsidiaries or associates after the said date, only
exchange rate gains/losses originating from January 1, 2004 will be reclassified to profit
and loss.
2.6. Financial instruments
a) Financial assets
Financial assets are recognised at their respective fair value at the agreement date. In
the case of financial assets measured at fair value through profit or loss, the costs directly
attributable to the transaction are recognised in “Cost of services and commissions”. In
the remaining categories, such costs are added to the asset’s book value. Upon initial
recognition, they are classified in one of the following IAS 39 categories:
i) Financial assets at fair value through profit or loss
This category includes:
Financial assets held for trading, essentially comprising
securities acquired to realise gains on short term market price
fluctuations. This category also includes derivatives, excluding
derivatives complying with hedge accounting requirements; and
Financial assets irrevocably designated at fair value through
profit or loss (“Fair value option”) upon initial recognition. This
designation is limited to situations whose adoption results in the
production of more relevant financial information, i.e.
If their application eliminates or significantly reduces an
accounting mismatch which would otherwise occur as a
result of measuring related assets and liabilities or an
inconsistency in the recognition of gains and losses thereon;
groups of managed financial assets, financial liabilities, or
both, whose performance is assessed on a fair value basis,
in accordance with formally documented risk management
and investment strategies and when information thereon is
internally distributed to management bodies.
Financial instruments containing one or more embedded
derivatives may also be recognised in this category, unless:
- The embedded derivatives do not significantly modify the
cash flows which would otherwise have been produced
under the agreement;
- It is evident, with little or no analysis, that the implicit
derivatives should not be separated out.
Financial assets classified in this category are recognised at fair
value and the gains and losses generated by their subsequent
measurement are recognised in profit and loss for the period in
“Income from financial operations”. Interest is recognised in the
appropriate “Interest and similar income” accounts.
72 NOTES ON THE ACCOUNTS CGD
NOTES TO THE CONSOLIDATED FINANCIAL STATEMENTS
ii) Loans and accounts receivable
These are financial assets with fixed or determinable payments
which are not listed in an active market. This category includes loans
and advances to group customers (including securitised loans),
amounts to be received from other credit institutions and for the
provision of services or disposals of assets, recognised in “Other
assets”.
These assets are initially recognised at fair value, net of any
commissions included in the effective interest rate, plus all
incremental costs directly attributable to the transaction. The assets
are subsequently recognised in the balance sheet at amortised cost,
net of impairment losses. Interest is recognised by the effective
interest rate method, which enables amortised cost to be calculated
and interest to be split up over the period of the operations. The
effective interest rate is the rate used to discount the estimated future
cash flows associated with the financial instrument, enabling the
present value to be matched to the value of the financial instrument
on the initial recognition date.
iii) Available-for-sale financial assets
This category includes the following financial instruments:
Variable-income securities not classified as financial assets at fair
value through profit or loss, including stable equity investments. It
therefore also includes equity instruments held under the group’s
venture capital operations, without associated options;
Bonds and other fixed-income securities;
Investment units in unit trust investment funds.
Available-for-sale financial assets are measured at fair value, except
for equity instruments not listed on an active market whose fair value
cannot be reliably measured, which continue to be recognised at
cost. Revaluation gains and losses are recognised directly in “Fair
value reserves” in shareholder’s equity. At the time of sale or if
impairment is declared, accumulated fair value gains or losses are
transferred to income or costs for the period and recognised in
“Income from financial operations” or “Impairment of other assets,
net of reversals and recoveries”, respectively.
To assess the proceeds on sale, assets sales are measured at their
weighted acquisition cost.
Interest on debt instruments classified in this category is calculated
by the effective interest rate method and recognised in “Interest and
similar income” in profit and loss.
Dividends on equity instruments classified in this category are
recognised as income in “Income from equity instruments”, when the
group’s right to receive them has been established.

CGD NOTES ON THE ACCOUNTS 73
NOTES TO THE CONSOLIDATED FINANCIAL STATEMENTS
Reclassification of financial assets
The entry into force of the amendment to the wording of IAS 39 on October 13, 2008
entitled the group to reclassify several financial assets recognised as “Financial assets
held for trading” or “Available-for-sale financial assets” to other financial assets
categories. Reclassifications to “Financial assets at fair value through profit or loss”
categories continued to be prohibited. Under this standard, the reference date of
reclassifications made by November 1, 2008 was accordingly July 1, 2008.
Reclassifications after this date had an impact as from the reference date of the referred
to transfer between the different categories of financial instruments.
Information on reclassifications made under the terms of the referred to amendment is set
out in note 8.
Fair value
As referred to above, financial assets recognised in “Fair value through profit or loss” and
“Available-for-sale financial assets” categories are measured at fair value.
A financial instrument’s fair value is the amount at which a financial asset or liability may
be sold or settled between independent, knowledgeable parties in arm’s length
transactions.
The fair value of financial assets is assessed by a Caixa body which is independent from
the trading function, based on:
The closing price, at the balance sheet date, for instruments
traded in active markets;
Measurement methods and techniques used for debt instruments
not traded in active markets (including unlisted securities or
securities with low liquidity) include the following:
- Bid prices published by financial information services such as
Bloomberg and Reuters, including market prices available on
recent transactions;
- Bid prices obtained from financial institutions operating as
market-makers;
- Internal measurement models based on market data which
would be used to define a financial instrument’s price,
reflecting market interest rates and volatility, in addition to the
instrument’s associated liquidity and credit risks.
Unit trust investment funds not traded in active markets are
measured on the basis of their last available NAV (net asset
value).
The measurement of unlisted equity instruments allocated to
venture capital activity is based on the following:
- Prices of materially relevant transactions entered into by
independent entities over the last six months;
- Multiples of comparable companies in terms of activity, size
and profitability;
- Discounted cash flows, whose discount rates are tailored to
the risk attached to the assets held.

74 NOTES ON THE ACCOUNTS CGD
NOTES TO THE CONSOLIDATED FINANCIAL STATEMENTS
The measurements incorporate discount factors reflecting the
securities’ lack of liquidity. In the event of a right or contractual
obligation to dispose of a specific asset, its respective
measurement will also fall within a range of measurements
resulting from the above referred to methods and the present
value of the asset’s disposal price, adjusted, when applicable, to
reflect counterparty credit risk.
Other unlisted equity instruments whose fair value cannot be
reliably measured (e.g. no recent transactions) continue to be
recognised at cost, net of any impairment losses.
Amortised cost
Financial instruments at amortised cost are initially recognised at fair value, net of the
income or costs directly attributable to the transaction. Interest is recognised by the
effective interest rate method.
Whenever an estimate of payments or collections associated with financial instruments
measured at amortised cost is revised, the respective book value is adjusted to reflect the
revised cash flows. The new amortised cost is measured by calculating the present value
of future cash flows discounted at the financial instrument’s initial effective interest rate.
The adjustment of the amortised cost is recognised in profit and loss.
b) Financial liabilities
Financial liabilities are recognised on their agreement dates, at their respective fair value,
net of the costs directly attributable to the transaction. Financial liabilities are classified in
the following categories:
i) Financial liabilities at fair value through profit or loss
Financial liabilities at fair value through profit or loss include
derivatives with negative fair value, in addition to the short selling of
fixed and variable-income securities. These liabilities are recognised
at fair value. Gains or losses resulting from their subsequent
measurement are recognised in “Income from financial operations”.
ii) Other financial liabilities
This category includes credit institutions’ and customers’ resources,
bond issuances, subordinated liabilities and liabilities incurred on the
payment of services or purchase of assets, recognised in “Other
liabilities”.
These financial liabilities are measured at amortised cost. Any
interest thereon is recognised in accordance with the effective
interest rate method.
c) Derivatives and hedge accounting
The group performs derivative operations as part of its activity to meet the needs of its
customers and reduce its exposure to foreign exchange, interest rate and stock market
fluctuations.
Derivatives are recognised at their fair value on their agreement dates. They are also
recognised in off-balance sheet account headings at their respective notional value.
Derivatives are subsequently measured at their respective fair value. Fair value is
assessed:

CGD NOTES ON THE ACCOUNTS 75
NOTES TO THE CONSOLIDATED FINANCIAL STATEMENTS
On prices obtained in active markets (e.g. futures trading in
organised markets);
On models incorporating measurement techniques accepted in the
market, including discounted cash flows and options measurement
models.
The assessment of the fair value of derivatives also incorporates specific adjustments to
reflect own credit risk, based on a market discount curve which is considered to reflect
the associated risk profile. The group simultaneously adopts a similar methodology to
reflect counterparty credit risks on derivatives with positive fair value.
Embedded derivatives
Derivatives embedded in other financial instruments are separated out from the host
agreement and processed separately under IAS 39, whenever:
The embedded derivative’s economic characteristics and risks are
not closely related to the economic characteristics and risks of the
host agreement as defined in IAS 39; and
The total amount of the combined financial instrument is not
recognised at fair value, with the respective changes being
recognised in profit and loss.
The main impact of this procedure on the group’s activity consists of the need to separate
out and measure the derivatives embedded in deposits and debt instruments, i.e.
instruments whose returns are not in the form of interest (e.g. when indexed to share
prices or indices, exchange rates, inter alia). At the time of separation, the derivative is
recognised at its respective fair value, with the initial amount of the host agreement
comprising the difference between the total value of the combined agreement and the
derivative’s initial revaluation. Therefore, no income is recognised on the operation’s
initial recognition.
Hedge derivatives
These derivatives are contracted for to hedge the group’s exposure to the risks inherent
to its activity. Classification as a hedge derivative and the use of hedge accounting rules,
as described below, are contingent upon compliance with IAS 39 requirements.
At June 30, 2016 and December 31, 2015, the group only hedged its exposure to
changes in the fair value of financial instruments recognised in its balance sheet and
referred to as “Fair value hedges”.
The group prepares formal documentation when a hedge relationship is entered into, to
include the following minimum aspects:
Risk management objectives and strategy associated with the hedge
operation, in accordance with defined risk hedging policies;
Description of the respective risk(s);
Identification and description of hedged and hedging financial
instruments;
Hedge effectiveness and periodicity assessment method.
Monthly hedge effectiveness tests are performed and documented by comparing the
change in fair value of the hedging instrument and hedged item (part attributable to the
hedged risk). To enable the use of hedge accounting, under IAS 39, the ratio should fall
within a range of 80% to 125%. Prospective effectiveness tests are also performed to
estimate the hedge’s future effectiveness.
76 NOTES ON THE ACCOUNTS CGD
NOTES TO THE CONSOLIDATED FINANCIAL STATEMENTS
Hedge derivatives are recognised at fair value and their results are recognised daily in
income and costs for the period. If the hedge is shown to be effective, i.e. an
effectiveness ratio of between 80% and 125%, the group also recognises the change in
fair value of the hedged item attributable to the hedged risk in profit and loss for the
period in “Income from financial operations”. In the case of instruments with an interest
component (e.g. interest rate swaps), accrued interest for the current period and realised
cash flows are recognised in “Interest and similar income” and “Interest and similar costs”
in net interest income.
Hedge accounting is discontinued whenever hedges cease to meet the hedge accounting
requirements defined by the standard or if Caixa revokes this designation. In such
situations the adjustments made to hedged items up to the date upon which hedge
accounting ceases to be effective or if a decision is taken to revoke the designation, are
then recognised in profit and loss up to the financial asset’s or liability’s maturity, based
on the effective interest rate method.
Positive and negative revaluations of hedge derivatives are recognised in specific assets
and liabilities account headings, respectively.
Measurements of hedged items are posted to the balance sheet account headings in
which the instruments are recognised.
Trading derivatives
Trading derivatives include all derivatives not associated with effective hedge
relationships in accordance with IAS 39, i.e.
Assets or liabilities hedge derivatives recognised at fair value through
profit or loss, thus rendering hedge accounting unnecessary;
Risk hedge derivatives which do not meet IAS 39 hedge accounting
requirements, owing to the difficulty in specifically identifying the
hedged items, in cases other than micro-hedges or if the results of
the effectiveness tests fall outside the range permitted by IAS 39;
Derivatives contracted for trading purposes.
Trading derivatives are recognised at fair value, the results of whose revaluations are
recognised daily in income and costs for the period in “Income from financial operations”,
except for the part relating to accrued and liquidated interest, which is recognised in
“Interest and similar income” and “Interest and similar costs”. Positive and negative
revaluations are recognised in “Financial assets at fair value through profit or loss” and
“Financial liabilities at fair value through profit or loss”, respectively.
d) Impairment of financial assets
Financial assets at amortised cost
The group periodically performs impairment tests on its financial assets at amortised cost,
i.e. “Investments in credit institutions”, “Loans and advances to customers” and amounts
receivable recognised in “Other assets”.
Signs of impairment are assessed separately in the case of financial assets with
significant exposure amounts and collectively in the case of like-for-like assets, whose
debtor balances are not individually relevant.

CGD NOTES ON THE ACCOUNTS 77
NOTES TO THE CONSOLIDATED FINANCIAL STATEMENTS
Under IAS 39, the following events are considered to be signs of impairment on financial
assets at amortised cost:
A breach of contractual clauses such as interest or principal in
arrears;
A record of defaults in the financial system;
Existence of credit or credit restructuring negotiations;
Difficulties in terms of the capacity of partners and management,
notably when leading partners or key employees leave the company
or in the event of disputes between partners;
A debtor’s or debt issuing entity’s significant financial difficulties;
The strong probability of a debtor’s or debt issuing entity’s
bankruptcy;
The worsening of a debtor’s competitive position;
A track record of collections suggesting that the nominal value will
not be fully recovered.
Whenever signs of impairment on separately assessed assets are identified, any
impairment loss comprises the difference between the present value of expected future
cash flows (recoverable value), discounted at the asset’s effective original interest rate
and book value at the time of analysis.
Assets which are not included in a specific analysis are included in a collective
impairment analysis and classified in like-for-like groups with similar risk characteristics
(based on counterparty and credit type) based on the identification of the above referred
to signs of impairment. Future cash flows are based on historical information on defaults
on and recoveries of assets with similar characteristics.
Separately analysed assets on which no objective signs of impairment have been
identified are also included in collective impairment assessments, as described in the
preceding paragraph.
Impairment losses, calculated in the collective analysis, include the time effect of the
discounting of estimated cash flows receivable on each operation at the balance sheet
date.
The amount of impairment is recognised in costs in “Credit impairment, net of reversals
and recoveries” and “Impairment of other assets net of reversals and recoveries” and
recognised separately in the balance sheet as a deduction from the amount of the
respective assets.
Write-offs/downs of principal and interest
The group periodically writes-off/down its non-recoverable credit using the respective
accumulated impairment following a specific analysis by the structural bodies responsible
for overseeing and recovering credit and the approval of the board of directors of the
various bodies involved. Any recoveries of written-off/down credit are recognised as a
deduction from the impairment losses balance in “Credit impairment net of reversals and
recoveries” in profit and loss.
In accordance with the policies in force within the group, interest on overdue credit
without a real guarantee is written-off up to three months from an operation’s due date or
first overdue instalment. Unrecognised interest on the above referred to credit is only
recognised in the year in which it is charged.

78 NOTES ON THE ACCOUNTS CGD
NOTES TO THE CONSOLIDATED FINANCIAL STATEMENTS
Interest on overdue credit on mortgage loans or other real guarantees is not written-
off/down when the accumulated amount of outstanding principal and overdue interest is
less than the amount of the collateral.
Available-for-sale financial assets
As referred to in note 2.6. a), available-for-sale financial assets are recognised at fair
value with changes to fair value being recognised in the “Fair value reserve” equity
account heading.
Whenever there is objective evidence of impairment, the accumulated capital losses
recognised in reserves are transferred to costs for the period in the form of impairment
losses and recognised in “Impairment of other assets net of reversals and recoveries”.
In addition to the above referred to signs of impairment on financial assets at amortised
cost, IAS 39 also provides for the following specific signs of impairment on equity
instruments:
Information on significant changes having an adverse effect on the
technological, market, economic or legal environment in which the
issuing entity operates, indicating that the cost of the investment may
not be fully recovered;
A significant or prolonged decline in market value below cost.
The group performs an impairment analysis on available-for-sale financial assets at each
financial statement’s reference date, taking the referred to assets’ nature and specific,
separate characteristics into consideration.
In addition to the results of the analysis, the following events were considered to be signs
of objective evidence of impairment on equity instruments:
Existence of unrealised capital losses of more than 50% of the
respective acquisition cost;
When the fair value of a financial instrument remains below its
respective acquisition cost for a period of more than 24 months.
The existence of unrealised capital losses of more than 30% for a period of more than
nine months was also considered to be objective evidence of impairment.
As impairment losses on equity instruments cannot be reversed, any unrealised capital
gains arising after the recognition of impairment losses are recognised in the “Fair value
reserve”. Impairment, recognised in profit and loss for the period, is always considered to
exist on any additional capital losses.
The group also performs periodic impairment analyses on financial assets recognised at
cost, i.e. unlisted equity instruments whose fair value cannot be reliably measured. The
recoverable value, in this case, is the best estimate of the future cash flows receivable on
the asset, discounted at a rate which adequately reflects the risk attached to holding the
asset.
The amount of the impairment loss is recognised directly in profit and loss for the period.
Impairment losses on such assets cannot be reversed.

CGD NOTES ON THE ACCOUNTS 79
NOTES TO THE CONSOLIDATED FINANCIAL STATEMENTS
2.7. Non-current assets held-for-sale and groups of assets and liabilities for disposal
IFRS 5 – “Non-current assets held-for-sale and discontinued operations” applies to
separate as well as groups of assets for disposal, either by sale or other aggregate
means, in a single transaction in addition to all liabilities directly associated with such
assets, which may be transferred in the operation (referred to as “groups of assets and
liabilities for disposal”).
Non-current assets or groups of assets and liabilities for disposal are classified as held-
for-sale whenever their book value is expected to be recovered by sale and not their
continued use. The following requirements must be met for an asset (or group of assets
and liabilities) to be classified under this account heading:
There must be a strong probability of sale;
The asset must be available for immediate sale in its present state;
The sale should be expected to occur within a year from the asset’s
classification in this account heading.
Assets recognised in this account heading are not depreciated and are measured at their
acquisition cost or fair value, whichever less, net of the costs incurred on the sale. The
assets’ fair value is calculated by appraisers.
Impairment losses are recognised in “Impairment of other assets, net of reversals and
recoveries when the assets’ book value exceeds their fair value, net of sales costs.
Property and other assets which have been auctioned for overdue credit recovery
purposes are also recognised in this account heading at their bid price.
These assets are not depreciated. The value of property received in kind for credit
recovery purposes is periodically assessed. Impairment losses are recognised when the
amount of the valuation, net of the estimated costs to be incurred on the sale, is less than
their book value.
Auctioned property is written-off from assets on sale and the respective gains or losses
thereon recognised in “Other operating income”.
2.8. Investment properties
Investment properties are properties held by the group with the objective of obtaining
income from rentals and/or appreciation in their value.
Investment properties are not depreciated and are recognised at fair value by appraisers.
Fair value changes are recognised in “Other operating income” in profit and loss.
2.9. Other tangible assets
Other tangible assets are recognised at their acquisition cost, revalued under the
applicable legal dispositions and net of accumulated depreciation and impairment losses.
The costs of repairs, maintenance and other expenses associated with their use are
recognised as a cost for the period in “Other administrative expenses”.
Up to January 1, 2004, Caixa and several of its subsidiaries revalued their tangible assets
under the terms of the applicable legislation. As permitted under IFRS 1, in the transition
to IFRS, their book value, incorporating the effect of the referred to revaluations, was
considered to be a cost, as the result, at the time of the revaluation generally
corresponded to cost or depreciated cost under international accounting standards,
adjusted to reflect changes to price indices. In the case of companies headquartered in
Portugal, as 40% of the increase in depreciation on these revaluations is not tax
deductible, the corresponding deferred tax liabilities thereon have been recognised.

80 NOTES ON THE ACCOUNTS CGD
NOTES TO THE CONSOLIDATED FINANCIAL STATEMENTS
Depreciation is recognised on a straight line basis over the assets’ estimated useful lives,
comprising the periods in which the assets are expected to be available for use, i.e.
Land is not depreciated.
The cost of works on and improvements to property leased by the group under operating
leases is capitalised in this account heading and depreciated over an average period of
10 years.
Depreciation is recognised as a cost for the period.
Tests to identify signs of impairment on other tangible assets are periodically performed.
Impairment losses are recognised in profit and loss for the period in “Impairment of other
assets net of reversals and recoveries” whenever the net book value of tangible assets is
higher than their recoverable value (value in use or fair value whichever the higher).
Impairment losses may be reversed and also have an impact on profit and loss in the
event of a subsequent increase in an asset’s recoverable value.
The group makes an annual assessment of the adequacy of its tangible assets’ useful
lives.
2.10. Finance leases
Finance lease operations are recognised as follows:
As lessee
Assets purchased under finance lease agreements are recognised at their fair value in
“Other tangible assets” and in liabilities, in line with the processing of their respective
repayments.
Lease instalments are divided up in accordance with the respective financial schedule,
whose liabilities are reduced by repayments of principal. Interest payments are
recognised in “Interest and similar costs”.
As lessor
Leased assets are recognised in the balance sheet as “Loans and advances to
customers” whose principal is repaid in accordance with the agreements’ repayments
schedules. Interest included in the instalments is recognised in “Interest and similar
income”.
Years of useful life
Property for own use 50 - 100
Equipment:
Furniture and material 8
Machines and tools 5 - 8
Computer equipment 3 - 8
Interior fittings 3 - 10
Transport material 4 - 6
Security equipment 4 - 10

CGD NOTES ON THE ACCOUNTS 81
NOTES TO THE CONSOLIDATED FINANCIAL STATEMENTS
2.11. Intangible assets
This account heading essentially comprises the cost of acquiring, developing or preparing
software used to further the group’s activities. In cases in which the requirements of IAS
38 – “Intangible assets” are met, the direct internal costs incurred on the development of
software are capitalised as intangible assets. These costs essentially comprise employee
costs.
Intangible assets are recognised at their acquisition cost net of accumulated amortisation
and impairment losses.
Depreciation is recognised on a straight line basis over the assets’ estimated useful lives,
which is normally between 3 and 6 years.
Software maintenance costs are recognised as a cost for the period in which they are
incurred.
2.12. Income tax
Current tax
CGD is subject to the fiscal regime set out in the IRC (corporate income tax) code and,
starting 2012, was taxed under the special tax regime for corporate groupings of article
69 et seq. of the respective code. The group perimeter covered by the referred to tax
regime, of which CGD is the dominant entity, comprises all companies with headquarters
and effective management in Portugal, whose total income is subject to the general IRC
tax regime, at the highest standard rate, in whose equity capital it has had either a direct
or indirect stake of at least 75%, for a period of more than a year and when the equity
stake gives it more than 50% of the voting rights.
The group’s taxable profit is calculated on the algebraic sum of the taxable profit and
losses made by each of the companies in the perimeter. Branch accounts are accordingly
included in the respective headquarters accounts under the principle of the taxation of
global profit provided for in article 4 of the IRC code. In addition to being subject to IRC,
in Portugal, branch net income may also be subject to local taxes in the
countries/territories in which they are established. Local taxes are deductible from the
group’s IRC tax bill as a tax credit under double taxation agreements and article 91 of the
respective code.
Current tax is calculated on taxable profit for the period, which differs from accounting
income owing to adjustments for expenses or income which are not relevant for fiscal
purposes or only considered in other accounting periods.
Adjustments to accounting income
- Income earned by non-resident subsidiaries subject to a more favourable tax
regime
Under Article 66 of the IRC code, the profit made by non-resident companies
benefiting from a clearly more favourable tax regime is allocated to Caixa, in
proportion to its equity stake and notwithstanding its appropriation, provided that
Caixa has a direct or indirect equity stake of at least 25% or at least 10% if 50% of
the non-resident company is either directly or indirectly owned by resident
partners.
A company is considered to benefit from a clearly more favourable regime (i)
when it is resident in a territory listed in ministerial order 292/2011 of November 8,
or (ii) when it is not subject to local income taxes which are identical or similar to
IRC, or (iii) when the applicable income tax payable on its activity is equal to or

82 NOTES ON THE ACCOUNTS CGD
NOTES TO THE CONSOLIDATED FINANCIAL STATEMENTS
less than 60% of the IRC that would have been payable if the company were
resident in Portugal.
In these cases, the profit is included in Caixa’s taxable income for the period in
which the end of the non-resident company’s tax period is included and
corresponds to the net profit earned by it, based on Caixa’s share of the equity.
The amount of the profit included is deductible from the taxable profit for the year
in which the referred to profits may eventually be distributed to Caixa.
- Provisions and impairment on credit
Caixa considered the effect of the following standards in assessing its taxable
profit for 2015:
The dispositions of no. 2 of article 28-A of the IRC code under
which (i) the provisions for general credit risks (as defined by the
Bank of Portugal’s official notice 3/95) from January 1, 2013,
and (ii) country-risk provisions with reference to January 1,
2015, are not tax deductible;
The dispositions of article 28-C of the IRC code and regulatory
decree 19/2015 of September 30, under which provisions for
specific credit risk in the case of loans collateralised by real
rights over property are not tax deductible;
During the course of first half 2016, based on the application of the Bank of
Portugal’s official notice 5/2015 which revoked official notices 1/2005 and 3/95
which were also issued by the Bank of Portugal, Caixa started to prepare its
financial statements on its separate activity in accordance with the dispositions of
the international financial reporting standards as adopted at any time under
European Union regulation, considering IAS 39 requirements on provisions for
credit and other amounts receivable from January 1, of the referred to year.
- Employee costs
CGD has considered its employee costs, processed and recognised in the
accounts, including, inter alia, the costs associated with pensions liabilities and
other post-employment benefits to be tax deductible, up to the limit of the
contributions effectively paid into the pension fund. This procedure is in line with
the respective understanding of the secretary of state for fiscal affairs of January
19, 2006, according to which, the amounts recognised in costs under the terms of
the applicable accounting regulations, limited by the amount of the contribution
effectively made to the pension fund in the same or past periods, and in line with
article 43 of the IRC code, are tax deductible.
Also herein and as a result of the change in accounting policy on the recognition
of actuarial gains and losses on pension plans and other post-employment
benefits, with reference to December 31, 2011, the deferred net liabilities balance
recognised in Caixa’s balance sheet at the said date was recognised in full as a
charge to reserves. As the component of €60,837 thousand relating to pensions
liabilities complied with the requirements of article 183 of law 64-B/2011 of
December 30 approving the state budget law for 2012, the negative equity
changes originated in 2011, which were not considered for tax purposes, in the
period, will be recognised as a deduction from taxable profit, in equal parts, in the
ten years starting on or after January 1, 2012.

CGD NOTES ON THE ACCOUNTS 83
NOTES TO THE CONSOLIDATED FINANCIAL STATEMENTS
- Settlement results
According to article 92 of the IRC code, amended by the state budget law for
2011, taxable income, net of deductions for international double taxation and tax
benefits, may not be less than 90% of the amount which would have been
assessed if the taxpayer (i) had not enjoyed tax benefits, (ii) had not made
supplementary contributions to pension funds and the like to cover retirement
pension liabilities.
The referred to limitation does not apply to the tax benefits referred to in no. 2 of
the same article.
CGD did not adjust its assessment of taxable income for the six months ended
June 30, 2016 and for the year 2015 as a result of the application of this article.
Deferred tax
Total income tax recognised in profit and loss includes current and deferred tax.
Deferred tax consists of the impact on tax recoverable/payable in future periods resulting
from temporary deductible or taxable differences between the book value of assets and
liabilities and their fiscal basis, used to assess taxable profit.
Deferred tax liabilities are normally recognised for all temporary taxable differences,
whereas deferred tax assets are only recognised to the extent that it is probable that
sufficient future taxable profit allowing the use of the corresponding deductible tax
differences or carry-back of tax losses is generated. Neither are deferred tax assets
recognised in cases in which their recoverability is questionable on account of other
situations, including issues regarding the interpretation of current tax legislation.
Notwithstanding, deferred taxes on temporary differences originating from the initial
recognition of assets and liabilities in transactions which do not affect accounting income
or taxable profit are not recognised.
The main situations originating temporary differences on a CGD level are temporary non-
tax deductible provisions and impairment.
Deferred taxes are calculated at the tax rates expected to be in force on the temporary
differences’ reversal date, comprising the full or substantially approved rates at the
balance sheet date.
Income tax (current or deferred) is recognised in profit and loss for the period, except for
cases in which the originating transactions have been recognised in other shareholders’
equity accounts. The corresponding tax, in these situations, is also recognised as a
charge to equity.
2.13. Provisions and contingent liabilities
A provision is set up whenever a present (legal or constructive) obligation resulting from
past events is likely to entail a future outflow of resources and when the amount thereof
may be reliably assessed. The amount of the provision comprises the best estimate of
the amount of the liability to be paid at the balance sheet date.
A contingent liability exists when the future outflow of resources is unlikely. Contingent
liabilities require no more than a disclosure procedure, unless the probability of their
occurrence is remote.

84 NOTES ON THE ACCOUNTS CGD
NOTES TO THE CONSOLIDATED FINANCIAL STATEMENTS
Provisions for other risks are for:
Liabilities for guarantees provided and other off-balance sheet
commitments, based on a risk analysis of operations and respective
customers;
Legal, fiscal and other contingencies resulting from the group’s activity.
2.14. Employee benefits
Liabilities for employee benefits are recognised in accordance with IAS 19 – Employee
benefits principles. The main benefits granted by Caixa include retirement and survivors’
pensions, healthcare costs and other long term benefits.
Pension and healthcare liabilities
CGD group has several pension plans, including defined benefit plans and in several
situations, defined contribution plans. Caixa is therefore liable for the payment of its
employees’ retirement, disability and survivors’ pensions. Other group companies, such
as Banco Comercial do Atlântico, S.A., Banco Caixa Geral and Banco Nacional
Ultramarino (Macau) also have defined benefit plans.
Healthcare for CGD’s (headquarters) active and retired employees is also provided by
Caixa Geral de Depósitos’s social services department and funded by contributions from
CGD headquarters and its employees. Caixa also has liabilities for contributions to SAMS
(healthcare services) for former BNU employees who had retired prior to the July 23,
2001 merger between BNU and CGD.
The liability for defined benefit plans recognised in the balance sheet comprises the
difference between the present value of liabilities and fair value of pension funds’ assets.
Total liabilities are calculated annually by specialised actuaries, using the unit credit
projected method and adequate actuarial presuppositions. The rate used for liabilities
discounting procedures is based on market interest rates on investment grade corporate
bonds denominated in the currencies in which the liabilities are paid and with similar
periods to maturity to the average settlement period on liabilities.
Gains and losses on differences between the actuarial and financial presuppositions used
and the effective amounts of liabilities and expected pension fund yields, as well as on
changes in actuarial presuppositions are recognised as a charge to “Other reserves”.
In the case of defined contribution plans, the group does not usually assume any liability
other than its annual contributions and no additional costs are accordingly recognised.
Retirement pensions and healthcare costs for the period, including current servicing costs
and net interest expenses, are aggregated and recognised in the appropriate “Employee
costs” heading.
The impact of employees’ early retirements, as defined in the actuarial study, is directly
recognised in “Employee costs”. Caixa also recognises a specific liability for the impact of
the change to non-active status of employees with whom it has agreed to suspend their
labour agreement. This provision is also recognised as a charge to “Employee costs” in
profit and loss.

CGD NOTES ON THE ACCOUNTS 85
NOTES TO THE CONSOLIDATED FINANCIAL STATEMENTS
Other long term benefits
The group also has other liabilities for long term benefits to its employees, including
liabilities for seniority bonuses and death grants prior to the standard retirement age.
Death grants after the standard retirement age are the responsibility of the pension fund.
Liabilities for such benefits are also based on actuarial calculations. Actuarial gains and
losses are recognised in full as a charge to profit and loss for the period, under the
dispositions of IAS 19 for the type of benefits identified.
Short term benefits
Short term benefits, including employees’ productivity bonuses, are recognised on an
accrual basis in “Employee costs”.
2.15. Commissions
As referred to in note 2.6., commissions on credit operations and other financial
instruments, i.e. commissions charged or paid on originating operations, are included in
amortised cost and recognised over the course of the operation, by the effective interest
rate method, in “Interest and similar income”.
Commissions for services provided are usually recognised as income over the period
during which the service is provided or as a lump sum if resulting from single acts.
2.16. Issuance of equity instruments
The issuance of equity instruments is recognised at the fair value of the compensation
received, net of the issuance’s direct costs.
Preference shares issued by the group are classified in accordance with the criteria
defined in IAS 32. Accordingly, in situations in which payments of dividends and/or
redemptions are exclusively at the group’s discretion, the securities issued are
considered to be equity instruments. Preference shares issued by subsidiaries complying
with these requirements are recognised in “Non-controlling interests” in the consolidated
balance sheet.
2.17. Securities and other items held under custody
Securities and other items held under custody, i.e. customers' securities, are recognised
in off-balance sheet accounts, at their nominal value.
2.18. Cash and cash equivalents
For the preparation of its cash flow statements, the group considers “Cash and cash
equivalents” as the “Cash and claims at central banks” and “Claims at other credit
institutions” total.
2.19. Critical accounting estimates and more relevant judgmental issues for the application of
accounting policies
The application of the above described accounting policies requires Caixa’s executive
committee and group companies to make estimates. The following are the estimates with
the greatest impact in the group's consolidated financial statements.

86 NOTES ON THE ACCOUNTS CGD
NOTES TO THE CONSOLIDATED FINANCIAL STATEMENTS
Calculation of impairment losses on loans and other amounts receivable
The calculation of impairment losses on loans is based on the methodology defined in
note 2.6. d). Impairment on separately analysed assets, is, accordingly, based on a
specific assessment made by Caixa, based on its knowledge of a customer’s
circumstance and guarantees associated with the operations in question.
The assessment of impairment on a collective basis is based on historical parameters for
comparable types of operations, considering default and recovery estimates.
Caixa considers that impairment based on this methodology enables the risks on its loan
portfolio to be adequately recognised, in line with the requirements of IAS 39.
Assessment of impairment losses on assets measured as a charge to fair value reserves
According to the measurement requirements on such assets, capital losses on the
depreciation of such assets’ market value are recognised as a charge to the “Fair value
reserve”. Whenever there are objective signs of impairment, accumulated capital losses
recognised in the “Fair value reserve” should be transferred to costs for the period.
Assessments of impairment losses on equity instruments may be subjective. The group
assesses whether impairment on such assets exists on the basis of a specific analysis at
each balance sheet date, considering the signs defined in IAS 39 (see note 2.6. d)). As a
general rule, impairment is always assessed whenever it is considered that the amount
invested is unlikely to be fully recovered based on the size of the referred to capital loss.
In the case of debt instruments classified in this category, the capital losses are
transferred from the fair value reserve to profit and loss whenever there are any signs of
a possible default on contractual cash flows, i.e. owing to an issuing entity’s financial
difficulties, defaults on other financial liabilities or a significant downgrade of the issuing
entity’s rating.
Measurement of financial instruments not traded in active markets
Under IAS 39, the group measures all financial instruments at fair value, except for those
recognised at amortised cost. The measurement models and techniques described in
note 2.6. are used to measure the value of financial instruments not traded in liquid
markets. The measurements obtained comprise the best estimate of the fair value of the
referred to instruments at the balance sheet date. To ensure an adequate level of
segregation between functions, the measurement of these financial instruments is the
responsibility of a body which is independent from the trading function.
Employee benefits
As referred to in note 2.14. above, the group’s liabilities for its employees’ post-
employment and other long term benefits are assessed on an actuarial basis. The
actuarial appraisals incorporate, inter alia, financial and actuarial presuppositions on
mortality, disability, salary and pension growth, respective asset yields and discount
rates. The presuppositions are the group’s and its actuaries’ best estimates of the future
performance of the respective variables.
Impairment of goodwill
As referred to in note 2.3. above, the group performs impairment tests on balance sheet
goodwill at least once a year. These tests are based on the estimated future cash flows
on each unit, discounted at appropriate rates.
The projections include a broad range of assumptions on the evolution of the units’ future
activities, which may or not occur. Such assumptions, however, reflect the group’s best
estimate at the balance sheet date.

CGD NOTES ON THE ACCOUNTS 87
NOTES TO THE CONSOLIDATED FINANCIAL STATEMENTS
Assessment of income tax
Income tax (current and deferred) is assessed by group companies on the basis of the
rules defined in the current tax legislation of the countries in which they operate. In some
cases, however, tax legislation is not sufficiently clear and objective and may give rise to
different interpretations. Although the amounts recognised, in such cases, represent the
best understanding of Caixa’s and its group companies’ responsible bodies, on the
correctness of their operations, they may be questioned by the tax authorities.
The group's recognition of deferred tax assets is based on expectations of future taxable
profit enabling the use thereof. Deferred tax generated by the carry-back of tax losses is
only recognised if it is concluded that they may be reversed during the periods lawfully
defined for the purpose. The assessment is naturally contingent upon the existence of the
presuppositions considered.

88 NOTES ON THE ACCOUNTS CGD
NOTES TO THE CONSOLIDATED FINANCIAL STATEMENTS
3. GROUP COMPANIES AND TRANSACTIONS IN PERIOD
The group’s structure in terms of its main subsidiaries, by sectors of activity and the
respective financial data taken from their separate statutory financial accounts, unless
otherwise expressly indicated, is summarised below:
Activity / Entity Head office
% Effective
participating
interest
Equity
(a)Net income
Equity
(a)Net income
Holding Companies
Caixa - Gestão de Activos, SGPS, S.A. Lisbon 100.00% 27,053 9,349 25,057 7,353
Caixa - Participações, SGPS, S.A. Lisbon 100.00% 88,580 4,745 108,602 36,205
Caixa Desenvolvimento, SGPS, S.A. Lisbon 99.72% 321 (42) 363 (73)
Caixa Seguros e Saúde, SGPS, S.A. Lisbon 100.00% 1,202,702 10,554 1,224,661 49,460
Parbanca, SGPS, S.A. Madeira 100.00% 41,698 6,668 67,947 19,164
Parcaixa SGPS, S.A. Lisbon 51.00% 1,018,339 8,491 1,009,518 57,624
Partang, SGPS, S.A. Lisbon 100.00% 147,762 8,442 146,701 29,374
Wolfpart, SGPS, S.A. Lisbon 100.00% 20,902 3,517 18,937 (21,823)
Banking
Banco Caixa Geral, S.A. Vigo 99.79% 457,760 10,124 459,750 25,222
Banco Comercial do Atlântico, S.A. Praia 57.91% 44,622 1,284 44,174 3,345
Banco Comercial e de Investimentos, S.A.R.L. Maputo 52.13% 176,966 12,804 211,815 39,547
Banco Caixa Geral Brasil, S.A. São Paulo 100.00% 92,858 2,286 72,576 (8,405)
Banco Interatlântico, S.A.R.L. Praia 70.00% 15,776 29 15,830 104
Banco Nacional Ultramarino, S.A. (Macau) Macau 100.00% 708,910 31,211 720,997 57,598
Caixa - Banco de Investimento, S.A. (b) Lisbon 99.72% 325,568 2,629 321,399 7,057
CGD - North America Finance Delaware 100.00% - - 1 -
CGD Investimentos CVC, S.A. São Paulo 99.86% 851 289 432 (3,387)
Mercantile Bank Holdings, Ltd. (b) Johannesburg 100.00% 124,139 4,585 119,190 10,379
Banco Caixa Geral Angola, S.A. Luanda 51.00% 241,348 25,522 272,159 84,728
Specialised Credit
Caixa Leasing e Factoring - Instituição Financeira de Crédito, S.A. Lisbon 51.00% 120,840 13,447 107,393 24,256
Promoleasing - Sociedade de Locação Financeira, S.A. Praia 57.91% 297 4 298 7
Asset Management
Caixagest - Técnicas de Gestão de Fundos, S.A. Lisbon 100.00% 26,933 731 32,642 6,439
CGD Pensões - Sociedade Gestora de Fundos de Pensões, S.A. Lisbon 100.00% 7,071 868 6,703 2,070
Fundger - Sociedade Gestora de Fundos de Investimento Imobiliário, S.A. Lisbon 100.00% 3,200 1,000 4,700 2,500
Venture Capital
A Promotora, Sociedade de Capital de Risco, S.A.R.L. Praia 45.30% 3,254 62 3,201 (40)
Caixa Capital - Sociedade de Capital de Risco, S.A. Lisbon 99.72% 26,381 1,528 24,853 4,508
Real Estate
Imobci, Lda. Maputo 45.21% 67 (216) 340 18
Imocaixa - Gestão Imobiliária, S.A. Lisbon 100.00% 5,869 (949) 6,818 (1,978)
Caixa Imobiliário, S.A. Lisbon 100.00% 23,783 3,645 20,138 (22,552)
Inmobiliaria Caixa Geral S.A.U. Madrid 100.00% (65,180) (3,655) (61,524) (9,560)
Cibergradual, Investimento Imobiliário, S.A. Lisbon 100.00% (57,728) (747) (56,981) (6,516)
Other Financial Entities
CGD Finance Cayman 100.00% 2,560 (10) 2,569 1
Caixa Geral Finance (c) Cayman 0.00% 111,215 (4) 111,219 -
(a) Equity includes net income for the period.
(b) Data taken from consolidated f inancial statements.
(c) Share capital comprises 1 000 ordinary shares of EUR 1 and 110 728 non-voting preference shares of EUR 1 000 each (110 728 preference shares in 31-12-2015).
30-06-2016 31-12-2015

CGD NOTES ON THE ACCOUNTS 89
NOTES TO THE CONSOLIDATED FINANCIAL STATEMENTS
Information on group subsidiaries’ principal movements in the six months’ period ended
June 30, 2016 and in 2015 is given below:
Banco Comercial e de Investimentos, S.A.
In first half 2015, Banco Comercial e de Investimentos, S.A.’s general meeting of
shareholders approved an equity increase of which 3,081,274,880 MZN in the form of an
incorporation of reserves and 1,789,709,460 MZN based on the issuance of 72,752,418
new shares. Caixa group’s equity investment in this operation was made through
Parbanca, SGPS, S.A., which has a 51% equity stake in BCI, having subscribed for
912,751,820 MZN in new shares at a unit price of 24.60 MZN (including a share issuance
premium of 14.60 MZN).
In March 2016, Banco Comercial e de Investimentos, S.A.’s general meeting of
shareholders approved the company’s acquisition of shares which had been subscribed
for but not paid up by the shareholder Insitec in the 2015 share capital increase, with the
referred to shares now being treasury shares.
Ibéria - Fundo Especial de Investimento Imobiliário
On January 8, 2016, the investors meeting approved a capital increase of €59,977
thousand for Fundo Especial de Investimento Imobiliário, to be paid up in kind. This
operation comprised the transfer of several properties owned by Caixa Imobiliário, S.A. to
Activity / Entity Head office
% Effective
participating
interest
Equity
(a)Net income
Equity
(a)Net income
Other Companies
Caixanet - Telemática e Comunicações, S.A. Lisbon 80.00% 1,849 15 1,842 37
Caixatec, Tecnologias de Comunicação, S.A. Lisbon 100.00% (1,879) (422) (1,349) (231)
HPP International - Luxembourg, S.A.R.L. Luxembourg 100.00% - - (33,698) (14)
Complementary Corporate Groupings
Groupment d'Interet Economique Paris 100.00% - - - -
Sogrupo - Compras e Serviços Partilhados, ACE Lisbon 90.00% - - - -
Sogrupo - Sistemas de Informação, ACE Lisbon 80.00% - - - -
Sogrupo IV - Gestão de Imóveis, ACE Lisbon 82.00% - - - -
Special Purpose Entities and Investment Funds
Fundo de Capital de Risco - Grupo CGD - Caixa Capital Lisbon 100.00% 238,041 6,552 231,488 (4,015)
Fundo de Capital de Risco Empreender Mais Lisbon 100.00% 20,009 (789) 20,798 2,791
Fundo de Capital de Risco Caixa Fundos Lisbon 100.00% 69,949 (702) 60,650 1,510
Fundo de Capital de Risco Caixa Crescimento Lisbon 100.00% 36,814 1,250 35,564 26
Fundo de Capital de Risco Caixa Tech Trsf Accelerator Ventures Lisbon 100.00% 3,073 (123) 3,196 (104)
Fundo de investimento Imobiliário Fechado para Arrendamento
Habitacional - Caixa Arrendamento Lisbon 100.00% 113,968 (473) 114,441 (557)
Fundo Especial de Investimento Aberto Estratégias Alternativas Lisbon 73.65% 12,475 (456) 13,118 (129)
Caixa Imobiliário - Fundo de Investimento Fechado de Arrendamento
Habitacional Lisbon 100.00% 41,837 (258) 42,095 (1,857)
Caixagest Private Equity - Fundo Especial de Investimento Lisbon 41.17% 113,624 1,733 137,036 19,698
Caixagest Imobiliário Internacional - Fundo Especial de Investimento Lisbon 40.53% 215,940 5,169 273,115 18,346
Caixagest Infra-Estruturas - Fundo Especial de Investimento Lisbon 22.51% 100,285 6,472 106,401 16,832
Beirafundo - Fundo de Investimento Imobiliário Fechado Lisbon 95.88% (1,242) (1,437) 195 (5,672)
Cidades de Portugal - Fundo de Investimento fechado de Arrendamento
Habitacional Lisbon 100.00% 30,347 645 29,703 (1,212)
Caixa Reabilita - Fundo Especial de Investimento Imobiliário Lisbon 100.00% 4,974 68 4,906 (374)
Fundolis - Fundo de Investimento Imobiliário Fechado Lisbon 100.00% 56,774 (476) 57,250 (2,069)
Fundimo - Fundo de Investimento Imobiliário Aberto Lisbon 57.87% 562,267 (10,996) 597,781 2,421
Fundo especial de investimento - Obrigacoes Rendimento Nacional Lisbon 26.11% 98,599 1,705 97,166 1,956
Fundiestamo - Fundo de Investimento Imobiliário Fechado Lisbon 77.92% 146,212 1,003 145,209 4,750
Fundo Especial de Investimento Imobiliário Fechado - Iberia Lisbon 100.00% 82,750 (688) 23,461 (1,352)
(a) Equity includes net income for the period.
30-06-2016 31-12-2015

90 NOTES ON THE ACCOUNTS CGD
NOTES TO THE CONSOLIDATED FINANCIAL STATEMENTS
Ibéria - Fundo Especial de Investimento Imobiliário as payment in kind for the capital
subscribed for in this operation.
Fundo de Capital de Risco Caixa Crescimento
This Fundo de Capital de Risco Caixa Crescimento (Caixa Crescimento venture fund)
was formed on June 28, 2013. Its corporate object is to operate in the venture capital
area by investing in SMEs or midcaps headquartered in Portugal which require funding
for their respective investment plans to strengthen their production capacity, expand into
new markets, sustain their growth strategies or increase funding for the structuring
requirements of their operating cycle.
An increase in fund capital was approved in first half 2016 based on the issuance of
30,000 investment units for a nominal amount of €1,000 each, fully paid up by Caixa. This
capital increase follows the capital increase made in 2015, also for the amount of €30,000
thousand and also subscribed for by CGD.
An amount of €35,700 thousand of the Fund's total capital had been paid up, at June 30,
2016 and at December 31, 2015.
Fundo de Capital de Risco Caixa Tech Transfer Accelerator Ventures
The Caixa Tech Transfer Accelerator Ventures fund was formed on March 16, 2015, with
a start-up capital of €6,000 thousand, comprising 6,000 investment units with a nominal
value of €1,000 each, fully subscribed for by Fundo de Capital de Risco Caixa Fundos.
The fund’s corporate object is to perform a venture capital activity by investing in
technology companies with medium to high growth potential, with projects in the scientific
field deriving from the domestic and international science-technology system.
An amount of €3,300 thousand of the fund's total capital had been paid up, at June 30,
2016 and December 31, 2015.
Fundo de Investimento Imobiliário Fechado para Arrendamento Habitacional – Caixa
Arrendamento (FIIAH – Caixa Arrendamento)
CGD acquired the non-controlling interest of 8.83% in FIIAH - Caixa Arrendamento from
Fidelidade - Companhia de Seguros, S.A, in 2015, for the amount of €10,278 thousand.
This transaction was complemented by the acquisition of the residual equity stakes of
3.09% and 0.23%, from the Império Bonança and FIIF - Fundicapital funds, respectively.
These operations provided Caixa with full control over the fund’s equity capital.
Fundo de Capital de Risco Grupo CGD
Formed in 1995, CGD group’s venture capital fund has a paid up capital of €296,145
thousand in the form of 5,680 investment units following the capital reduction based on
the October 2015 elimination of 1,420 investment units comprising 20% of the fund’s
capital.
Accompanying the capital reduction operation, CGD acquired the investment units
hitherto held by Caixa - Banco de Investimento, S.A and Caixa Capital - Sociedade de
Capital de Risco, S.A., therefore becoming the fund’s sole investor.
Gerbanca, SGPS, S.A.
In complying with the resolutions of its shareholders Caixa Geral de Depósitos, S.A. and
Caixa Participações, SGPS, S.A., at a general meeting of shareholders held on
December 31, 2014, the process for the dissolution and liquidation of Gerbanca, SGPS,
S.A. was completed in first half 2015.

CGD NOTES ON THE ACCOUNTS 91
NOTES TO THE CONSOLIDATED FINANCIAL STATEMENTS
The company’s net assets, essentially comprising its equity stake in Caixa - Banco de
Investimento, S.A, were distributed among its shareholders in proportion to their
respective investments (90% and 10%, respectively).
Wolfpart, SGPS, S.A.
The conversion of partners’ loans of €236,626 thousand into accessory capital payments,
to increase the company’s equity was approved at the general meeting held in March
2015.
Caixa Imobiliário, S.A.
The conversion of partners’ loans of €158,200 thousand into supplementary capital
payments to increase the company’s equity was approved at the general meeting held in
March 2015.
Caixa Seguros e Saúde, SGPS, S.A. (Caixa Seguros e Saúde) and Fidelidade -
Companhia de Seguros, S.A. (Fidelidade)
According to the provisions of the agreement for the sale of Fidelidade – Companhia de
Seguros, S.A., Caixa Seguros e Saúde, SGPS, S.A., would have a maximum stake of
15% with the sale of 5% of its capital to its workers. The public offer for sale took place on
October 15, 2014 with 16,860 shares having been sold to workers. The remaining shares
making up 5% of the equity of Fidelidade – Companhia de Seguros, S.A., were acquired
by Fosun group on January 8, 2015.
The disposal of these investments led to a reduction of the percentage held by the group
in several of its subsidiaries, namely those held by Fidelidade – Companhia de Seguros,
S.A.
In parallel and during the course of first half 2015, providing continuity to the process of
reorganising its investments, Caixa Seguros e Saúde, SGPS, S.A. completed the
procedures for the liquidation of HPP International (Ireland).
Banco Caixa Geral Angola, S.A.
On July 8, 2015, Banco Santander Totta, S.A. and Santotta - Internacional, SGPS,
Sociedade Unipessoal, Lda. exercised their put option on 49% of the equity of Partang,
SGPS, S.A. under the terms of the agreement entered into between the three entities in
July 2009. Following the exercising of this option, CGD acquired 1,072,348,380 shares
for the amount of €173,696 thousand (USD 191,483,786) giving it 100% of the share
capital of Partang, SGPS, S.A., which, in turn, has a 51% equity stake in Banco Caixa
Geral Totta Angola, S.A..
LCS - Linha de Cuidados de Saúde, S.A.
A promissory sales agreement for 100% of the equity capital of the company LCS - Linha
de Cuidados de Saúde, S.A. was entered into between Caixa Seguros e Saúde, SGPS,
S.A.; Optimus - Comunicações, S.A. (NOS Comunicações, S.A.) and Teleperformance
Portugal, S.A. on September 27, 2013. Following the issuance of the required regulatory
authorisation the operation for an amount of €5 thousand, took place during the month of
July 2015 with the group having recognised a capital loss of €1,610 thousand on the said
date.

92 NOTES ON THE ACCOUNTS CGD
NOTES TO THE CONSOLIDATED FINANCIAL STATEMENTS
4. CASH AND CLAIMS AT CENTRAL BANKS
This account heading comprises the following:
The objective of Caixa’s sight deposits with the Bank of Portugal is to comply with the
minimum cash reserves requirements of the European Central Bank’s system. Interest is
paid on these deposits which comprise 1% of deposits and debt securities with maturities
of up to two years, except for the deposits and debt securities of institutions subject to the
ECB system’s minimum cash reserve requirements.
The funds deposited with central banks by Caixa and group banks at June 30, 2016 and
December 31, 2015, complied with the minimum limits defined by the regulations in force
in the countries in which they operate.
30-06-2016 31-12-2015
Cash 660,414 720,949
Demand deposits in central banks 842,245 2,158,642
1,502,659 2,879,591
Interest on demand deposits in central banks 5 54
1,502,664 2,879,645

CGD NOTES ON THE ACCOUNTS 93
NOTES TO THE CONSOLIDATED FINANCIAL STATEMENTS
5. CLAIMS AT OTHER CREDIT INSTITUTIONS
This account heading comprises the following:
Cheques pending settlement comprise the cheques of customers of other banks sent for
clearing. These amounts are collected in the first few days of the subsequent period.
30-06-2016 31-12-2015
Cheques for collection
- Portugal 52,990 59,753
- Abroad 22,239 23,120
75,229 82,873
Demand deposits
- Portugal 163,202 159,039
- Abroad 201,375 528,725
364,577 687,763
Accrued interest 381 2,527
440,187 773,163

94 NOTES ON THE ACCOUNTS CGD
NOTES TO THE CONSOLIDATED FINANCIAL STATEMENTS
6. INVESTMENTS IN CREDIT INSTITUTIONS
This account heading comprises the following:
As a result of the reorganisation process on the assets and liabilities structure of the
former Banco Português de Negócios, S.A. (BPN), currently Banco BIC Português, S.A.
(BIC), in the sphere of the said financial institution’s reprivatisation (completed in first
quarter 2012), Caixa entered into a commercial paper programme with this entity with a
limit of €400,000 thousand.
The referred to programme was backed by the Portuguese state up to its maturity in
March 2015. Caixa also, herein, issued a current account line of credit up to a limit of
€300,000 thousand, maturing in March 2016, whose possibility of use is conditioned by
the amount of the deposits of the former BPN’s customers.
During the course of the disposal process on the bank, the ownership of the vehicles
Parvalorem, S.A., Parups, S.A. and Parparticipadas, S.A. (holding a collection of assets
transferred from BPN as a result of the implementation of its post-privatisation
restructuring process) and ipso facto the debts contracted for by these companies with
Caixa Geral de Depósitos in the form of loans and advances to customers and bond
issuances, were transferred to the sphere of the Portuguese state. The nominal amount
of these issuances at June 30, 2016 and December 31, 2015, totalled €2,097,771
thousand (note 6). The remaining loans were settled in full at the said dates.
The state also assumed liabilities for the commercial paper programme subscribed for by
Caixa for the amount of €1,000,000 thousand, owing to the transfer of the contractual
30-06-2016 31-12-2015
Term deposits
- Portugal 78,720 129,762
- Abroad 1,203,217 1,938,720
Loans
- Portugal 315 321
- Abroad 125,811 172,786
Other applications
- Portugal 26,331 59,312
- Abroad 1,490,026 1,593,770
Purchase operations with resale agreement 282,470 125,540
Overdue loans and interest 7,152 7,158
3,214,041 4,027,370
Adjustments to assets under hedging operations (3,998) (4,473)
Accrued interest 1,319 2,341
Deferred income (2,453) (2,327)
3,208,910 4,022,909
Impairment (Note 34) (7,125) (11,394)
3,201,785 4,011,515

CGD NOTES ON THE ACCOUNTS 95
NOTES TO THE CONSOLIDATED FINANCIAL STATEMENTS
position between BPN and Parvalorem (note 12). Therefore, starting March 30, 2012, the
referred to company became this commercial paper programme’s issuing entity.
The corporate vehicles are repaying the debt to CGD under the terms agreed between
the Portuguese state, European Central Bank, International Monetary Fund and
European Union. As provided for in the referred to settlement plan, any amounts received
from the recovery of assets held by the corporate vehicles shall be set against these loan
settlements.
At June 30, 2016 and December 31, 2015, the accumulated impairment balance on
investments in credit institutions included €7,125 thousand and 11,392 thousand,
respectively, for exposures to banks headquartered in the Republic of Iceland.
At June 30, 2016 and December 31, 2015, the "Purchase operations with repurchase
agreements" account heading referred to agreements for the acquisition of financial
instruments with a resale agreement at a future date at a predefined price. The financial
instruments acquired in these operations are not recognised in the balance sheet with the
purchase price continuing to be recognised as a loan to credit institutions, measured at its
respective amortised cost. The referred to operations were contracted for under GMRAs
(global master repurchase agreements) providing for mechanisms to strengthen the
collateral associated with such transactions on the basis of the evolution of their
respective market price which is assessed on the specifications agreed between the
counterparties, usually in the form of surety deposits.
Information on the impairment of investments in credit institutions for the half years ended
June 30, 2016 and 2015, is set out in note 34.

96 NOTES ON THE ACCOUNTS CGD
NOTES TO THE CONSOLIDATED FINANCIAL STATEMENTS
7. FINANCIAL ASSETS HELD FOR TRADING AND OTHER ASSETS AT FAIR
VALUE THROUGH PROFIT OR LOSS
These account headings comprise the following:
Financial assets held for trading and other financial assets at fair value through profit or
loss, at June 30, 2016 and December 31, 2015, included investment units in unit trust
and property investment funds managed by group entities for the amounts of €28,816
thousand and €102,698 thousand, respectively, including property investments funds for
the amount of €9,916 thousand, at December 31, 2015.
Held for
trading
At fair value
through profit
or loss
TotalHeld for
trading
At fair value
through profit
or loss
Total
Debt instruments
- Public issuers:
. Public debt securities 3,259 - 3,259 11,127 - 11,127
. Treasury bills 1,684,664 - 1,684,664 - - -
. Bonds of other public
Foreign 2,370,842 - 2,370,842 897,040 - 897,040
- Other issuers:
. Bonds and other securities:
Issued by residents 815 - 815 3,260 5,014 8,274
Issued by non-residents 7,120 3,322 10,443 13,876 1,667 15,543
4,066,700 3,322 4,070,023 925,303 6,681 931,984
Equity instruments
Residents 2,808 69,728 72,536 472 71,803 72,275
Non-residents 25,406 98,026 123,432 44,111 98,766 142,878
28,214 167,754 195,968 44,583 170,570 215,153
Other financial instruments
- Trust fund units
Residents - 89,807 89,807 - 175,428 175,428
Non-residents - 464,304 464,304 - 464,043 464,043
- Other
Non-residents - - - 15 - 15
- 554,110 554,110 15 639,471 639,486
Derivatives with positive fair value
(Note 10)
- Swaps 1,511,313 - 1,511,313 1,330,986 - 1,330,986
- Futures and other forward operations 27,312 - 27,312 13,614 - 13,614
- Options - shares and currency 67,830 - 67,830 57,639 - 57,639
- Caps and floors 307,347 - 307,347 176,985 - 176,985
- Other 293 - 293 30 - 30
1,914,095 - 1,914,095 1,579,254 - 1,579,254
6,009,010 725,186 6,734,196 2,549,155 816,722 3,365,877
30-06-2016 31-12-2015

CGD NOTES ON THE ACCOUNTS 97
NOTES TO THE CONSOLIDATED FINANCIAL STATEMENTS
8. AVAILABLE-FOR-SALE FINANCIAL ASSETS
This account heading comprises the following:
“Debt instruments – public debt” at June 30, 2016 and December 31, 2015 included
securities allocated to covered bond issuances with a balance sheet carrying amount of
€137,640 thousand and €144,294 thousand, respectively (note 20)
“Debt instruments – issued by other entities” at June 30, 2016 and December 31, 2015
included €2,239,193 thousand and €2,276,990 thousand respectively, for bonds issued
by Parvalorem, S.A., Parups, S.A. and Parparticipadas, S.A. as part of the liquidity re-
organisation support operations for BPN (note 6). These bonds are backed by a
Portuguese state guarantee.
“Other instruments” and “Impairment - other instruments”, at June 30, 2016, included
€870,995 thousand and €190,335 thousand (€876,078 thousand and €159,381 thousand
respectively at December 31, 2015) in subscriptions for investments in corporate vehicles
set up in the sphere of transfers of financial assets (loans and advances to customers).
Following their transfer (to the company itself or other companies held by the corporate
vehicle in which CGD has a stake), the referred to assets were derecognised from the
balance sheet, as it was considered that the respective IAS 39 requirements, i.e. the
transfer of a substantial part of the risks and benefits associated with credit operations
and their respective control, had been met. It should be noted that the corporate vehicles
in which CGD has a non-controlling interest continue to enjoy management autonomy. To
ensure the neutrality of operations, at the time of performance, impairment for the
30-06-2016 31-12-2015
Debt instruments
- Public debt 5,815,887 8,637,184
- Other public issuers 1,641,001 1,619,286
- International financial organisations 199,496 -
- Other issuers 4,135,404 3,923,359
11,791,788 14,179,830
Equity instruments
- Measured at fair value 262,223 255,483
- Measured at historical cost 180,763 182,653
442,986 438,136
Other instruments 1,313,881 1,363,175
13,548,655 15,981,141
Impairment (Note 34)
- Equity instruments (112,518) (112,532)
- Debt instruments (784) (1,029)
- Other instruments (270,751) (247,138)
(384,053) (360,699)
13,164,602 15,620,442

98 NOTES ON THE ACCOUNTS CGD
NOTES TO THE CONSOLIDATED FINANCIAL STATEMENTS
estimated losses on the transferred assets was declared on the amount of the investment
in the respective corporate vehicles. Following initial recognition, these positions reflect
the revaluation of such companies' assets.
The group’s exposure, at June 30, 2016 and December 31, 2015, was as follows:
To complement the investments in these vehicles, Caixa also made shareholders' loans
and accessory capital payments for certain operations, recognised in "Other assets", with
a fully provisioned balance sheet carrying amount of €51,352 thousand and €50,834
thousand, at June 30, 2016 and December 31, 2015, respectively.
The balance on the amount of these securities in comparison to net impairment on the
assets transferred during the course of first half 2016 and in 2015, amounted to €43,692
thousand and €44,067 thousand, respectively, recognised in "Provisions for other risks
and liabilities".
Net balance sheet impairment on investment units in unit trust and property investment
funds managed by group entities and recognised in the available-for-sale financial assets
portfolio at June 30, 2016, totalled €8,700 thousand and €23,602 thousand, respectively
(€8,115 thousand and €25,193 thousand, respectively, at December 31, 2015).
Impairment of “Other instruments”, at June 30, 2016 and December 31, 2015, included
30-06-2016
Securities acquiried on asset transfer operations
Value before
impairment
Accumulated
impairmentNet
Fair value
reserve
Fundo Imobiliário Aquarius 196,461 (36,750) 159,710 4,593
Fundo Recuperação, FCR 180,000 (51,820) 128,180 -
Flit-Ptrel SICAV 117,317 (10,536) 106,781 9,986
Discovery Portugal Real Estate Fund 127,542 (25,121) 102,421 23,565
OXI Capital, SCR 81,324 (3,329) 77,996 1,992
Fundo Recuperação Turismo, FCR 53,267 (13,597) 39,670 7,500
Fundo Imobiliário Vega 44,950 (13,663) 31,287 -
Vallis Construction Sector 63,567 (34,030) 29,537 -
Nexponor - Sociedade Especial de Investimento
Imobiliário de Capital Fixo - SICAFI 6,567 (1,490) 5,077 184
870,995 (190,335) 680,659 47,821
31-12-2015
Securities acquiried on asset transfer operations
Value before
impairment
Accumulated
impairmentNet
Fair value
reserve
Fundo Imobiliário Aquarius 201,484 (38,590) 162,893 7,776
Fundo Recuperação, FCR 180,000 (44,323) 135,677 -
Flit-Ptrel SICAV 117,927 (10,536) 107,391 11,044
Discovery Portugal Real Estate Fund 125,319 (25,121) 100,197 22,014
OXI Capital, SCR 81,102 (3,329) 77,774 1,771
Vallis Construction Sector 70,936 (10,197) 60,739 7,536
Fundo Recuperação Turismo, FCR 53,890 (13,597) 40,293 8,124
Fundo Imobiliário Vega 39,028 (12,199) 26,829 -
Nexponor - Sociedade Especial de Investimento
Imobiliário de Capital Fixo - SICAFI 6,393 (1,490) 4,903 10
876,078 (159,381) 716,697 58,274

CGD NOTES ON THE ACCOUNTS 99
NOTES TO THE CONSOLIDATED FINANCIAL STATEMENTS
€6,662 thousand and €5,071 thousand, respectively, for property investment funds
managed by group companies with a prolonged decline in market value at below cost.
At June 30, 2016 and December 31, 2015, equity instruments included the following
investments:
The following criteria were used to prepare the above tables:
- The “Investment banking and venture capital” column includes the securities
held by Caixa - Banco de Investimento and the group’s venture capital area,
including consolidated venture capital funds (note 3);
- The securities held by the remaining entities were allocated to “Banking
activity”.
30-06-2016
Banking
Investment
banking and
venture capital
Value before
impairment
Accumulated
impairmentNet amounts
Fair value
reserve
Effective
participating
interest (%)
Measured at fair value
SICAR NovEnergia II - 68,720 68,720 - 68,720 26,297 11.12
Inapa - Investimentos, Participações e Gestão, S.A. - 22,333 22,333 - 22,333 (4,467) 16.84
Galp Energia, SGPS, S.A. - 13,319 13,319 - 13,319 744 0.07
La Seda Barcelona, S.A. 52,878 - 52,878 (52,878) - - 14.24
Finpro, SGPS, S.A. - 23,818 23,818 (23,818) - - 17.17
A.Silva & Silva - Imobiliário e Serviços, S.A. - 21,300 21,300 (21,300) - - 19.64
VISA Inc Classe C (série US92826C3007) 13,077 - 13,077 - 13,077 11,572 -
VISA Inc Classe C (série US92826C7974) 10,198 - 10,198 - 10,198 - -
Foreign entities' shares 1,784 - 1,784 - 1,784 657
Other - 34,797 34,797 (6,580) 28,217 8,769
77,936 184,287 262,223 (104,575) 157,648 43,571
Measured at historical cost
Águas de Portugal, S.A. 153,003 - 153,003 - 153,003 - 9.69
VAA - Vista Alegre Atlantis, S.A. 4,058 711 4,769 (1,178) 3,591 - 4.48
Other 20,072 2,919 22,991 (6,765) 16,226 -
177,133 3,630 180,763 (7,943) 172,820 -
255,069 187,917 442,986 (112,518) 330,468 43,571
31-12-2015
Banking
Investment
banking and
venture capital
Value before
impairment
Accumulated
impairmentNet amounts
Fair value
reserve
Effective
participating
interest (%)
Measured at fair value
SICAR NovEnergia II - 63,996 63,996 - 63,996 21,574 11.12
Visa Europe Limited 22,341 - 22,341 - 22,341 22,341 0.01
Inapa - Investimentos, Participações e Gestão, S.A. 22,333 - 22,333 - 22,333 (4,467) 16.84
Galp Energia, SGPS, S.A. 11,423 - 11,423 - 11,423 (1,153) 0.07
La Seda Barcelona, S.A. 52,878 - 52,878 (52,878) - - 14.24
Finpro, SGPS, S.A. - 23,818 23,818 (23,818) - - 17.17
A.Silva & Silva - Imobiliário e Serviços, S.A. - 21,300 21,300 (21,300) - - 19.64
Foreign entities' shares 1,732 - 1,732 - 1,732 641
Other 3 35,659 35,662 (6,593) 29,070 9,411
110,710 144,773 255,483 (104,588) 150,895 48,347
Measured at historical cost
Águas de Portugal, S.A. 153,003 - 153,003 - 153,003 - 9.69
VAA - Vista Alegre Atlantis, S.A. 4,058 711 4,769 (1,178) 3,591 - 4.48
Other 24,522 359 24,881 (6,766) 18,115 -
181,583 1,070 182,653 (7,944) 174,709 -
292,293 145,843 438,136 (112,532) 325,604 48,347

100 NOTES ON THE ACCOUNTS CGD
NOTES TO THE CONSOLIDATED FINANCIAL STATEMENTS
Information on the composition of impairment of equity instruments recognised by the
group as a charge to profit and loss for the half years ended June 30, 2016 and 2015, is
set out below (note 34):
The fair value reserve for available-for-sale financial assets, at June 30, 2016 and
December 31, 2015, comprised the following:
The main equity instruments movements in available-for-sale financial assets in the
period ended June 30, 2016 and in 2015, were as follows:
Finangeste, S.A.
Caixa made capital losses of €931 thousand (note 30) on its sale of 247,375 Finangeste
shares for a total amount of €1,582 thousand in June 2015.
VISA Europe Limited and VISA Incorporated Class C
Deriving from the process of reorganising its Visa network operations and after obtaining
the necessary approvals from the relevant regulators, Visa Inc’s proposal for the
acquisition of Visa Europe was successfully completed in June 2016. Caixa made capital
gains of €38,941 thousand on this operation, arising from the transfer of the ownership of
its equity investment in Visa Europe with a nominal value of €10 (note 30).
The assessment of the capital gains on the operation included the valuation of the various
components incorporated in the agreed procedure for settling the transaction, which
included: (i) a cash payment on the date of the close of the sale (ii) a deferred cash
payment on the date of the sale’s third anniversary, and (iii) the delivery of 9,608
convertible preference shares (Class C).
The referred to preference shares’ balance sheet carrying amount, at June 30, 2016,
totalled €10,198 thousand.
30-06-2016 30-06-2015
Finpro, SGPS, S.A. - 4,635
Other 32 18
32 4,652
30-06-2016 31-12-2015
Fair value reserve (Note 25)
(gross amount before non-controlling interests)
Debt instruments 355 163,632
Equity instruments 43,571 48,347
Other instruments 97,674 118,783
141,599 330,762
Deferred tax reserve (46,608) (91,358)
94,991 239,404
Balance attributable to non-controlling interests 3,579 1,646
98,570 241,050

CGD NOTES ON THE ACCOUNTS 101
NOTES TO THE CONSOLIDATED FINANCIAL STATEMENTS
Reclassification of securities
Caixa Geral de Depósitos
In 2008 and across first half 2010, under the terms of the October 2008 amendments to
IAS 39, as described in greater detail in note 2.6. and owing to the exceptional
circumstances noted in the financial markets in the referred to periods, Caixa transferred
a collection of securities from financial assets held for trading to available-for-sale
financial assets.
Caixa’s reclassifications, arising from the instability and volatility of financial markets,
particularly in 2010, as regards the evolution of credit markets which were heavily
influenced by the destabilisation of the funding of Eurozone countries’ sovereign debt,
changed Caixa’s outlook on the sale of these assets which was no longer expected to
take place over the short term. The transfer of securities in first half 2010, essentially
comprised sovereign debt instruments, securities issued by government agencies and
other credit instruments issued by financial institutions directly affected by the turmoil in
Eurozone public debt markets.
Caixa also reclassified bonds from available-for-sale financial assets to loans and
advances to customers in first half 2010.
The impact of the reclassification of the referred to securities in profit and loss and fair
value reserves was as follows:
Securities reclassified in 2008
Financial assets at fair value
as a charge to revaluation
reserves
Financial assets at amortised
cost
Book value at reclassification date 1,001,797 n.a
Book value at 31-12-2008 873,101 n.a
Book value at 31-12-2009 560,350 n.a
Book value at 31-12-2010 336,275 n.a
Book value at 31-12-2011 261,035 n.a
Book value at 31-12-2012 156,972 n.a
Book value at 31-12-2013 138,888 n.a
Book value at 31-12-2014 165,911 n.a
Book value at 31-12-2015 139,266 n.a
Book value at 30-06-2016 72,757 n.a
Fair value of securities reclassified at 30-06-2016 72,757 n.a
Fair value reserve of securities reclassified at 30-06-2016 8,716 n.a

102 NOTES ON THE ACCOUNTS CGD
NOTES TO THE CONSOLIDATED FINANCIAL STATEMENTS
Gains / (losses) associated with the change of the fair value of securities
between 31-12-2008 and 31-12-2009
Unrealised capital gains/ (losses) recognised as a charge to fair value
reserves 6,315 n.a
Impairment for the year (6,673) n.a
Other gains and losses recognised as a charge to net income (60,758) n.a
Gains / (losses) associated with the change of the fair value of securities
between 31-12-2009 and 31-12-2010
Unrealised capital gains/ (losses) recognised as a charge to fair value
reserves 57,186 n.a
Impairment for the year (52,234) n.a
Other gains and losses recognised as a charge to net income (2,247) n.a
Gains / (losses) associated with the change of the fair value of securities
between 31-12-2010 and 31-12-2011
Unrealised capital gains/ (losses) recognised as a charge to fair value
reserves (17,620) n.a
Other gains and losses recognised as a charge to net income (487) n.a
Gains / (losses) associated with the change of the fair value of securities
between 31-12-2011 and 31-12-2012
Unrealised capital gains/ (losses) recognised as a charge to fair value
reserves 14,112 n.a
Impairment for the year (3,210) n.a
Other gains and losses recognised as a charge to net income 7,457 n.a
Gains / (losses) associated with the change of the fair value of securities
between 31-12-2012 and 31-12-2013
Unrealised capital gains/ (losses) recognised as a charge to fair value
reserves 5,907 n.a
Impairment for the year (3,580) n.a
Other gains and losses recognised as a charge to net income (671) n.a
Gains / (losses) associated with the change of the fair value of securities
between 31-12-2013 and 31-12-2014
Unrealised capital gains/ (losses) recognised as a charge to fair value
reserves 31,767 n.a
Impairment for the year - n.a
Other gains and losses recognised as a charge to net income - n.a
Gains / (losses) associated with the change of the fair value of securities
between 31-12-2014 and 31-12-2015
Unrealised capital gains/ (losses) recognised as a charge to fair value
reserves 4,433 n.a
Impairment for the year - n.a
Other gains and losses recognised as a charge to net income 9,293 n.a
Gains / (losses) associated with the change of the fair value of securities
between 31-12-2015 and 30-06-2016
Unrealised capital gains/ (losses) recognised as a charge to fair value
reserves (18,780) n.a
Impairment for the period - n.a
Other gains and losses recognised as a charge to net income 18,674 n.a

CGD NOTES ON THE ACCOUNTS 103
NOTES TO THE CONSOLIDATED FINANCIAL STATEMENTS
The amounts set out in the table do not include the fiscal effect.
“Gains/ (losses) recognised as a charge to profit and loss” include proceeds from the
disposal of securities after the reclassification date and foreign exchange revaluation and
exclude income and interest and commissions costs.
Securities reclassified in 2010
Financial assets at fair value
as a charge to revaluation
reserves
Financial assets at amortised
cost
Book value at reclassification date 1,414,007 503,466
Book value at 31-12-2010 1,039,972 504,393
Book value at 31-12-2011 483,799 495,037
Book value at 31-12-2012 342,668 477,515
Book value at 31-12-2013 170,473 444,652
Book value at 31-12-2014 2,993 374,652
Book value at 31-12-2015 160 -
Book value at 30-06-2016 154 -
Fair value of securities reclassified at 30-06-2016 154 -
Fair value reserve of securities reclassified at 30-06-2016 (97) n.a
Gains / (losses) associated with the change in securities fair value between
reclassification date and 31-12-2010
Unrealised capital gains/ (losses) recognised as a charge to fair value
reserves (36,589) n.a
Gains / (losses) associated with the change of the fair value of securities
between 31-12-2010 and 31-12-2011
Unrealised capital gains/ (losses) recognised as a charge to fair value
reserves (47,894) n.a
Other gains and losses recognised as a charge to net income (1,234) n.a
Gains / (losses) associated with the change of the fair value of securities
between 31-12-2011 and 31-12-2012
Unrealised capital gains/ (losses) recognised as a charge to fair value
reserves 70,581 n.a
Other gains and losses recognised as a charge to net income 604 n.a
Gains / (losses) associated with the change of the fair value of securities
between 31-12-2012 and 31-12-2013
Unrealised capital gains/ (losses) recognised as a charge to fair value
reserves 7,898 n.a
Other gains and losses recognised as a charge to net income 2,564 n.a
Gains / (losses) associated with the change of the fair value of securities
between 31-12-2013 and 31-12-2014
Unrealised capital gains/ (losses) recognised as a charge to fair value
reserves 6,270 n.a
Other gains and losses recognised as a charge to net income 20,310 n.a
Gains / (losses) associated with the change of the fair value of securities
between 31-12-2014 and 31-12-2015
Unrealised capital gains/ (losses) recognised as a charge to fair value
reserves (360) n.a
Other gains and losses recognised as a charge to net income 268 n.a
Gains / (losses) associated with the change of the fair value of securities
between 31-12-2015 e 30-06-2016
Unrealised capital gains/ (losses) recognised as a charge to fair value
reserves (3) n.a
Other gains and losses recognised as a charge to net income - n.a

104 NOTES ON THE ACCOUNTS CGD
NOTES TO THE CONSOLIDATED FINANCIAL STATEMENTS
The amounts of securities reclassified in 2008 as financial assets at fair value as a
charge to reserves include investment units in funds which were latterly included in the
consolidation perimeter. Information on this asset, at June 30, 2016 and December 31,
2015, is set out below:
30-06-2016 31-12-2015
Financial assets at fair value as a charge to revaluation reserves
Book value 11,044 52,600
Fair value of securities reclassified 11,044 52,600
Fair value reserve of securities reclassified 3,431 9,367
Gains / (losses) associated with the change of the fair value of securities
Unrealised capital gains/ (losses) recognised as a charge to fair value
reserves (5,936) 4,321
Other gains and losses recognised as a charge to net income 7,297 -

CGD NOTES ON THE ACCOUNTS 105
NOTES TO THE CONSOLIDATED FINANCIAL STATEMENTS
9. FINANCIAL ASSETS WITH REPURCHASE AGREEMENTS
The following is a breakdown of financial assets with repurchase agreements, at June 30,
2016 and December 31, 2015:
The group entered into operations for the sale of financial assets with purchase
agreements at a future date at a pre-established price with financial institutions and
customers in the six months ended June 30, 2016 and in 2015.
Financial instruments loaned in sales operations with repurchase agreements are not
derecognised in the balance sheet and continue to be measured in accordance with the
accounting policies applicable to the underlying assets. The difference between their
sales and repurchase prices is recognised as interest income and deferred over the
period of the agreement.
Liabilities on the repurchase agreement are recognised as a liability in “Other credit
institutions’ resources – Sales operations with repurchase agreements” (note 18) and
“Customers’ resources and other loans – other resources – sales operations with
repurchase agreements” (note 19).
30-06-2016 31-12-2015
At fair value through revaluation reserves
Debt instruments
- From public issuers:
. Portuguese debt securities 364,069 290,317
. Foreign debt securities 4,662 4,651
- From other issuers:
. Bonds and other securities:
Residents 116,335 120,686
Non-residents 18,825 246,646
503,892 662,300
At fair value through revaluation reserves
Debt instruments
Residents 352,666 418,866
352,666 418,866
Impairment (Note 34) (967) -
855,591 1,081,166

106 NOTES ON THE ACCOUNTS CGD
NOTES TO THE CONSOLIDATED FINANCIAL STATEMENTS
10. DERIVATIVES
The group performs derivative operations as part of its activity to meet the needs of its
customers and reduce its exposure to foreign exchange, interest rate and stock market
fluctuations.
The group controls the risk of its derivatives activities on the basis of operations approval
procedures, a definition of exposure limits per product and customer and its daily
monitoring of the respective income.
At June 30, 2016 and December 31, 2015, these operations were measured in
accordance with the criteria described in note 2.6. c). A breakdown of the operations’
notional and book values at the said dates is given below:
Assets Liabilities
Forward foreign exchange transactions
Forwards exchange 2,533 (4,132) - - (1,599)
Purchase 1,189,244 - 1,189,244
Sale 1,236,349 - 1,236,349
NDF's (Non Deliverable Forward ) 13,800 (3,082) - - 10,718
Purchase 144,210 - 144,210
Sale 127,328 - 127,328
FRA (forward rate agreements) 60,000 - 60,000 111 - - - 111
Swaps
Currency swaps 6,988 (16,005) (9,017)
Purchase 1,431,750 - 1,431,750
Sale 1,440,634 - 1,440,634
Shares and indexes 33 - - - 33
Purchase 2,041 - 2,041
Sale 2,041 - 2,041
Interest rate swaps and cross currency
interest rate swaps 1,504,270 (1,843,111) 16,040 (3,611) (326,412)
Purchase 59,011,149 163,652 59,174,801
Sale 58,899,581 160,771 59,060,352
Credit default swaps 23 (170) - - (147)
Purchase 72,059 - 72,059
Sale 70,037 - 70,037
Futures
Currency - - - - -
Long positions 136,361 - 136,361
Short positions 67,630 - 67,630
Interest rate 87 (118) - - (31)
Long positions 413,379 - 413,379
Short positions 2,937,393 - 2,937,393
Shares and indexes 382 (147) - - 235
Long positions 7,834 - 7,834
Short positions 15,257 - 15,257
Other - 10,398 (3,870) - - 6,528
Long positions 289,242 289,242
Short positions 670,357 670,357
Options
Currency 2,031 (2,227) - - (196)
Purchase 128,636 - 128,636
Sale 70,603 - 70,603
Shares and indexes 65,602 (68,613) - - (3,011)
Purchase 915,463 - 915,463
Sale 800,058 - 800,058
Shares and indexes 197 (305) - - (108)
Purchase 53,600 - 53,600
Sale 904 - 904
Interest rates (Caps & Floors) 307,347 (318,587) - - (11,240)
Purchase 2,417,678 - 2,417,678
Sale 2,666,801 - 2,666,801
Other - - - 293 (420) - - (127)
135,277,619 324,423 135,602,042 1,914,095 (2,260,787) 16,040 (3,611) (334,263)
Total
Assets held for
trading
(Note 7)
Liabilities held
for trading
Hedging derivatives
Total
30-06-2016
Notional value Book value
Trading
derivatives
Hedging
derivatives

CGD NOTES ON THE ACCOUNTS 107
NOTES TO THE CONSOLIDATED FINANCIAL STATEMENTS
At June 30, 2016, the “liabilities held for trading” account also included €1,120 thousand
in respect of liabilities deriving from the short selling of debt instruments.
Derivatives recognised in "Assets held for trading", "Liabilities held for trading", "Hedge
derivatives – assets" and "Hedge derivatives – liabilities", at June 30, 2016 and
December 31, 2015", included operations collateralised by surety accounts with the aim
of hedging the fair value of lending and borrowing exposures between Caixa and diverse
financial institutions. The balances deposited by the referred to financial institutions with
Caixa and by Caixa with the said financial institutions on the said dates are recognised in
"Other liabilities - resources - surety account" (note 23) and "Other assets - debtors and
other assets - other debtors" accounts (note 17), respectively.
Assets Liabilities
Forward foreign exchange transactions
Forwards exchange 2,145 (14,823) - - (12,678)
Purchase 833,099 - 833,099
Sale 845,006 - 845,006
NDF's (Non Deliverable Forward ) 961 (3,496) - - (2,535)
Purchase 212,628 - 212,628
Sale 216,481 - 216,481
FRA (forward rate agreements) 10,000 10,000 - (13) - - (13)
Swaps
Currency swaps 1,965 (3,757) (1,792)
Purchase 661,197 - 661,197
Sale 663,566 - 663,566
Interest rate swaps and cross currency
interest rate swaps 1,329,001 (1,459,131) 46,468 (10,812) (94,474)
Purchase 58,562,454 236,205 58,798,659
Sale 58,463,001 239,099 58,702,100
Credit default swaps 21 (305) - - (284)
Purchase 73,482 - 73,482
Sale 70,926 - 70,926
Futures
Currency - - - - -
Long positions 153,166 - 153,166
Short positions 251,182 - 251,182
Interest rate - - - - -
Long positions 951,203 - 951,203
Short positions 932,690 - 932,690
Shares and indexes 547 (234) - - 313
Long positions 12,169 - 12,169
Short positions 4,657 - 4,657
Other - 9,960 - - - 9,960
Long positions 323,250 - 323,250
Short positions 497,762 - 497,762
Options
Currency 3,043 (3,227) - - (184)
Purchase 417,466 - 417,466
Sale 391,024 - 391,024
Shares and indexes 54,596 (61,821) - - (7,225)
Purchase 460,616 - 460,616
Sale 392,220 - 392,220
Interest rates (Caps & Floors) 176,985 (183,274) - - (6,289)
Purchase 2,630,247 - 2,630,247
Sale 3,159,459 - 3,159,459
Other - - - 30 (8,516) - - (8,486)
131,188,951 475,304 131,664,255 1,579,254 (1,738,597) 46,468 (10,812) (123,687)
31-12-2015
Notional value Book value
Trading
derivatives
Hedging
derivativesTotal
Assets held for
trading
(Note 7)
Liabilities held
for trading
Hedging derivatives
Total

108 NOTES ON THE ACCOUNTS CGD
NOTES TO THE CONSOLIDATED FINANCIAL STATEMENTS
11. HELD-TO-MATURITY INVESTMENTS
The composition of the balances of investments to be held to maturity at June 30, 2016,
was as follows:
The debt instruments recognised in this category fundamentally refer to the sovereign
debt instruments of Banco Caixa Geral Angola’s portfolio.
30-06-2016
Debt instruments
Other public issuers 233,619
Other issuers
Other non-residents 4,231
237,850

CGD NOTES ON THE ACCOUNTS 109
NOTES TO THE CONSOLIDATED FINANCIAL STATEMENTS
12. LOANS AND ADVANCES TO CUSTOMERS
This account heading comprises the following:
“Domestic credit – other loans” at June 30, 2016 and December 31, 2015, included
€64,866 thousand and €67,625 thousand, respectively, relating to CGD’s mortgage and
personal loans for employees.
The “Other loans and amounts receivable – securitised – commercial paper” account
heading, at June 30, 2016 and December 31, 2015, included liabilities deriving from the
commercial paper programme subscribed for by Caixa with BPN for the amount of
€1,000,000 thousand, formalised by the transfer of the contractual position between the
bank and Parvalorem (note 6).
30-06-2016 31-12-2015
Domestic and foreign loans
Loans 46,905,674 47,701,256
Current account loans 2,591,380 2,523,881
Other loans 6,070,002 6,038,376
Other loans and amounts receivable - securitised
. Commercial Paper 2,748,663 2,767,128
. Other 2,060,328 1,948,366
Property leasing operations 1,176,669 1,179,946
Discounts and other loans secured by bills 928,211 1,267,535
Equipment leasing operations 760,005 736,179
Factoring 918,217 840,682
Overdrafts 359,471 397,602
64,518,621 65,400,951
Adjustment to assets under hedging operations - 95
Accrued interest 207,448 241,548
Deferred income, commissions and other cost and
income associated with amortised cost (84,979) (80,788)
64,641,090 65,561,806
Overdue loans and interest 5,679,846 5,394,933
70,320,935 70,956,739
Impairment (Note 34) (5,389,846) (5,197,706)
64,931,089 65,759,033

110 NOTES ON THE ACCOUNTS CGD
NOTES TO THE CONSOLIDATED FINANCIAL STATEMENTS
The “Loans” account heading, at June 30, 2016 and December 31, 2015, includes
mortgage loans issued by Caixa in the sphere of securitisation operations. Information on
these loan movements, for the half ended June 30, 2016, is as follows:
As all of the liabilities associated with this operation are held by the group, they are
eliminated in the preparation of the consolidated financial statements.
The “Loans” account heading, at June 30, 2016 and December 31, 2015, includes
mortgage loans allocated to the issuance of covered bonds with a book value of
€9,956,026 thousand and €10,478,994 thousand, respectively.
The assets pool collateralising the referred to issuances, at June 30, 2016 and December
31, 2015, also included debt securities with a book value of €137,640 thousand and
€144,294 thousand, at the said dates, respectively (note 8).
Information on the seniority structure of “Overdue loans and interest” at June 30, 2016
and December 31, 2015, is set out below:
Nostrum
Mortgages nº2
Balances at 31-12-2015 4,265,537
Payments (110,758)
Repurchase (6,282)
Other (13,119)
Balances at 30-06-2016 4,135,378
30-06-2016 31-12-2015
Up to three months 457,444 308,758
Three to six months 179,256 125,146
Six months to one year 188,945 226,858
One to three years 1,236,440 1,353,364
Over three years 3,617,760 3,380,807
5,679,846 5,394,933

CGD NOTES ON THE ACCOUNTS 111
NOTES TO THE CONSOLIDATED FINANCIAL STATEMENTS
13. NON-CURRENT ASSETS AND LIABILITIES HELD-FOR-SALE
The non-current assets held-for-sale balances account heading, at June 30, 2016 and
December 31, 2015, comprised the following:
30-06-2016 31-12-2015
ASSETS
Property and equipment 1,117,643 1,241,911
Impairment - property and equipment (Note 34) (368,154) (411,509)
749,488 830,402

112 NOTES ON THE ACCOUNTS CGD
NOTES TO THE CONSOLIDATED FINANCIAL STATEMENTS
14. INVESTMENT PROPERTIES
The investment properties owned by the group at June 30, 2016 and December 31, 2015,
are recognised at their fair value. Gains and losses on the revaluation of these properties
are recognised as a charge to “Other operating income” (note 2.8.) in profit and loss.
Measurement methodologies and fair value assessment
The measurement of the fair value of investment properties, in addition to other relevant
factors, takes into consideration the nature, characteristics and geography of properties,
with the objective of assessing the best price on disposal under normal market
conditions. Fair value is assessed by individual appraisers who should use at least two of
the following methods:
Market comparison method: This method estimates the amount of a specific
transaction using prices and other relevant information on market deals involving
identical or comparable (similar) properties. It generally uses statistical methods after
harmonising the various market data. This is the main method used whenever there
is a significant number of known transactions;
Income method: This method estimates a property’s value by capitalising the annual
amount of rents or annual operating income generated by the activity being
performed in the property. When, over time, changes in income are more significant
than generally expected in the market, the DCF (discounted cash flows) technique is
used. The income method is applied in the case of an effective rental of the property,
when the property is for rent, when the rental market for the type of property being
valued is active or when the property is to be exploited economically;
Cost method: This estimates the value of the property on the basis of the amount
which would currently be needed to obtain alternative property, as a replica of the
original or with an equivalent use, adjusted for obsolescence. It is obtained from the
sum of the acquisition cost of the land and construction costs, including charges,
depreciation in accordance with a property’s present physical, functional,
environmental and economic conditions plus commercialisation costs and a
developer's margin/risk. This is the principal method used when no market
information is available on transactions of similar property and there is no potential
income associated with the property.
The availability of relevant data and its relative subjectivity may affect the choice of
the valuation method/techniques. The choice, in each case, should be particularly
based on those which maximise the use of relevant observable variables.
The most relevant variables considered for each of the above referred to valuation
methods are as follows:
(i) Market comparison method
- the presumed sales price per sqm or presumed sales price per unit (when what is
relevant is not the area but rather the use given to the property: e.g. car parks). In liquid
markets, these variables are provided by directly or indirectly observable data in the
transaction market, although they may need to be adjusted (harmonised) depending on
the specific characteristics of the property being valued.
(ii) Income method
Capitalisation technique
- amount of the monthly rent per sqm or monthly rent per unit (when what is relevant is
not the area but rather the use provided by the property: e.g. car parks). In active rental

CGD NOTES ON THE ACCOUNTS 113
NOTES TO THE CONSOLIDATED FINANCIAL STATEMENTS
markets, these variables are provided by directly or indirectly observable data in the
transaction market, although they may need to be adjusted (harmonised) depending on
the specific characteristics of the property being valued.
- variables which contribute towards the assessment of operating income generated by
the property. These variables may vary in line with the type of property and are
generally assessed on the property’s potential income generating capacity, taking into
account the information available on the assumptions of market players. The data
supplied by the entity operating the property may be used in the absence of reasonably
available information indicating that market players would employ assumptions.
- capitalisation rate, which is associated with the risk on capital invested, income, liquidity,
tax burden, risk-free interest rate, expectations of market evolution. In active markets, it
establishes the existence of a linear relationship at a certain point of time between the
rental and purchase/sales market, for a certain geography and a specific property
product segment, with an identical risk and identical evolution of rents.
Discounted cash flow technique
Diverse variables may contribute to the estimated cash flows based on the type of
property. This technique is reliant on current expectations of changes in the values and
times of the occurrence of future cash flows. It is usually necessary to include a risk
adjustment factor based on the uncertainty of this type of measurement.
- discount rate, considered to be the value of money over time, associated with a risk-free
interest rate and the price to be paid on the inherent uncertainty of cash flows (risk
premium).
(iii) Cost method
- the construction cost per sqm variable is essentially reliant on the construction
characteristics of the property but in which a contributory factor is the place of
construction. It is based on directly or indirectly observable construction market data.

114 NOTES ON THE ACCOUNTS CGD
NOTES TO THE CONSOLIDATED FINANCIAL STATEMENTS
In compliance with the requirements of IFRS 13, the following table sets out information
on the group’s investment properties, at June 30, 2016 and December 31, 2015,
classified by type, development status as regards their preparation for use and current
occupancy, considering the methodologies used to measure fair value:
Property type State development Occupation Book value Measurement techniques Relevants inputsReference range of
relevant inputs
Shoping center Concluded Rented 83,277 Income capitalisation method Discount rate [7,0%]
16,871Income capitalisation method
Estimated rental value per m2 (area
less than 250 m2) 5
100,148
Offices Concluded Rented 10,491 Income capitalisation method Estimated rental value per m2 5-7,5
122,071
Market comparable method /
Income capitalisation methodEstimated rental value per m2
4-15,5
223,920 Market comparable method Estimated sale value per m2 417,97-2345,94
95,294 Market comparable method Estimated sale value per m2 2000,29-3785,37
Capitalisation /
sale 967
Market comparable method /
Income capitalisation method
Estimated rental value per m2 /
Estimated rental value per m2 720-1670 / 2,9-10,3
6,386
Replacement cost method / DCF /
Market comparable methodEstimated sale value per m2
1700-1900
Under constructionCapitalisation /
sale 12,273
Replacement cost method / DCF /
Market comparable method Estimated sale value per m2 1700-1900
471,402
Housing Concluded Rented 144 Income capitalisation method Estimated rental value per m2 4,2
34,042
Income capitalisation method /
Market comparable methodEstimated rental value per m2
1025 - 1100
100
Income capitalisation method /
Market comparable method / Costh
method
Estimated rental value per m2
2
Capitalisation /
sale 82,705
Income capitalisation method /
Market comparable methodEstimated rental value per m2
0,4-4,8
Estimated sale value per m2 190-2210
37,797
Income capitalisation method /
Market comparable methodEstimated rental value per m2
4,0-13,3
Under constructionCapitalisation /
sale 25,098
Replacement cost method / DCF /
Market comparable method Estimated sale value per m2
[500-625]
[1400-1875]
179,887
Stores Concluded Rented 704 Market comparable method Estimated sale value per m2 400-1700
1,358 Income capitalisation method Estimated rental value per m2 2,5-7,5
76,131
Income capitalisation method /
Market comparable methodEstimated sale value per m2
[352-17664]
Capitalisation /
sale 5,595
Income capitalisation method /
Market comparable methodEstimated rental value per m2
0,4-25
Under constructionCapitalisation /
sale 2,848
Replacement cost method / DCF /
Market comparable method Estimated sale value per m2
350-550
800-1600
86,635
Parking Concluded Rented 1,862 Income capitalisation method Estimated rental monthly amount 5-7,5
22,439 Market comparable method Value of sales per parking 4800-16600
32,425 Market comparable method Value of sales per parking 16082-47919
2,321
Market comparable method /
Income capitalisation methodValue of sales per parking
100-130
Capitalisation /
sale 2,897
Income capitalisation method /
Market comparable methodEstimated rental monthly amount
6-166
Under constructionCapitalisation /
sale 840
Replacement cost method / DCF /
Market comparable methodValue of sales per parking
600-650
572
Replacement cost method / DCF /
Market comparable methodValue of sales per parking
7200-8500
63,354
Land n.a.Capitalisation /
sale 54,067
Replacement cost method / DCF /
Market comparable methodEstimated sale value per m2 / housing
1050-1200
6,516 Income capitalisation method Estimated rental value per m2 5-7,5
220
Market comparable method / Table
of expropriations Estimated value of the land per m2 5
290
Replacement cost method / Market
capitalisation method
Estimated value of the land per m2 of
construction 70-140
2,109
Income capitalisation method /
Market comparable method Estimated rental value per m2 1,3-30
63,203
Warehouses Concluded Rented 117,826 Market comparable method Estimated rental value per m2 303-974
4,193 Market comparable method Estimated rental value per m2 1449-3218
25,573 Income capitalisation method Discount rate / potential rental 8% / 7,5€ por m2
Capitalisation /
sale 1,833
Income capitalisation method /
Market comparable methodEstimated rental value per m2
1,1-4,9
149,424
1,114,054
Other 69,896
1,183,950
30-06-2016

CGD NOTES ON THE ACCOUNTS 115
NOTES TO THE CONSOLIDATED FINANCIAL STATEMENTS
As already stated, valuations of land and buildings maximise the use of observable
market data. However, as most valuation techniques also consider non-observable data,
they are classified at level 3 of the fair value ranking defined by IFRS 13.
Property type State development Occupation Book value Measurement techniques Relevants inputsReference range of
relevant inputs
Shoping
center
Under
construction Unoccupied
77.308 Income capitalisation method Discount rate [7,0%]
Concluded Rented16.871
Income capitalisation method Estimated rental value per m2 (area
less than 250 m2) 5
94.179
Offices Concluded Rented129
Income capitalisation method /
Market comparable method Estimated rental value per m2 1,00-3,7
124.065
Market comparable method /
Income capitalisation method Estimated rental value per m2 4,25-15,5
224.609
Replacement cost method / DCF /
Market comparable method Estimated sale value per m2 500-2193,71
108.941
Replacement cost method / DCF /
Market comparable method Estimated sale value per m2 2001,83-4435,65
Unoccupied 2.675
Market comparable method /
Income capitalisation method
Estimated rental value per m2 /
Estimated rental value per m2 790-1820 / 0,9-10,3
6.386
Replacement cost method / DCF /
Market comparable method Estimated sale value per m2 1700-1900
Under
construction
Capitalisation
/ sale 12.273
Replacement cost method / DCF /
Market comparable method Estimated sale value per m2 1700-1900
479.078
Housing Concluded Rented 144 Income capitalisation method Estimated rental value per m2 4
150
Income capitalisation method /
Market comparable method Estimated rental value per m2 0,6-0,8
142
Income capitalisation method /
Market comparable method / Costh
method
Estimated rental value per m2 2-7
Unoccupied78.290
Income capitalisation method /
Market comparable method Estimated rental value per m2 0,3-4,8
50.240
Income capitalisation method /
Market comparable method Estimated rental value per m2 4,0-13,4
Under
construction Capitalisation / sale
8.665
Replacement cost method / DCF /
Market comparable method Estimated sale value per m2
[390-490]
[1750-1875]
137.631
Stores Concluded Rented 976 Market comparable method Estimated sale value per m2 540-2400
390
Income capitalisation method /
Market comparable method Estimated rental value per m2 2,5-10
76.988
Replacement cost method / DCF /
Market comparable method Estimated sale value per m2 [417,64-17663,64]
Unoccupied 6.392
Income capitalisation method /
Market comparable method Estimated rental value per m2 0,4-32,5
Under
construction
Capitalisation
/ sale 2.848
Replacement cost method / DCF /
Market comparable method Estimated sale value per m2 800-1600
87.593
Parking Concluded Rented 2.235
Market comparable method /
Income capitalisation method Estimated rental monthly amount 85-125
56.999
Replacement cost method / DCF /
Market comparable method Unit value 5427-46701
Unoccupied 1.720
Income capitalisation method /
Market comparable method Estimated rental monthly amount 7-160
Under
construction
Capitalisation
/ sale 840
Replacement cost method / DCF /
Market comparable method Value of sales per parking 600-650
572
Replacement cost method / DCF /
Market comparable method Value of sales per parking 7200-8500
62.365
Land n.a. Capitalisation
/ sale 54.054
Replacement cost method / DCF /
Market comparable method Estimated sale value per m2 / housing 1050-1200
220
Market comparable method / Table
of expropriations Estimated value of the land per m2 5
355
Replacement cost method / Market
capitalisation method
Estimated value of the land per m2 of
construction 90-140
2.219
Income capitalisation method /
Market comparable method Estimated rental value per m2 1,3-3,7
56.848
Warehouses Concluded Rented 119.907
Replacement cost method / DCF /
Market comparable method Estimated rental value per m2 309-974
4.315
Replacement cost method / DCF /
Market comparable method Estimated rental value per m2 2814-3218
Unoccupied 671
Income capitalisation method /
Market comparable method Estimated rental value per m2 1,1-3
124.892
1.042.586
Other 82.458
1.125.044
31-12-2015
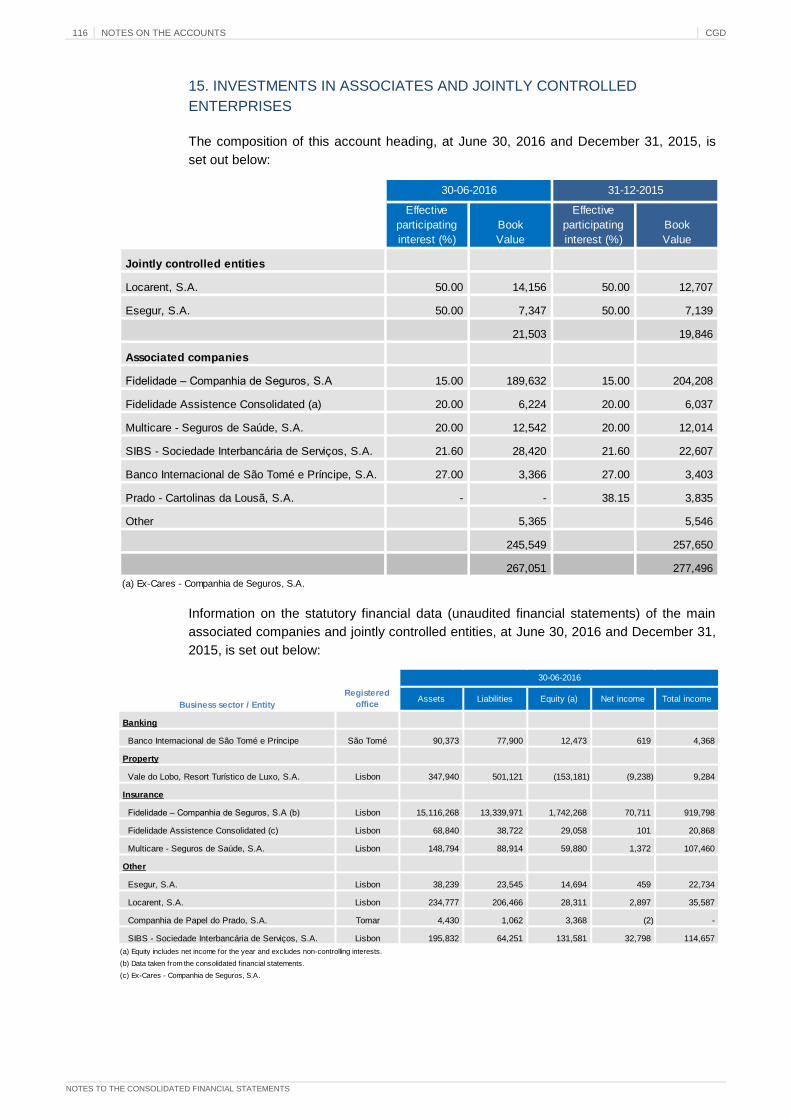
116 NOTES ON THE ACCOUNTS CGD
NOTES TO THE CONSOLIDATED FINANCIAL STATEMENTS
15. INVESTMENTS IN ASSOCIATES AND JOINTLY CONTROLLED
ENTERPRISES
The composition of this account heading, at June 30, 2016 and December 31, 2015, is
set out below:
Information on the statutory financial data (unaudited financial statements) of the main
associated companies and jointly controlled entities, at June 30, 2016 and December 31,
2015, is set out below:
Effective
participating
interest (%)
Book
Value
Effective
participating
interest (%)
Book
Value
Jointly controlled entities
Locarent, S.A. 50.00 14,156 50.00 12,707
Esegur, S.A. 50.00 7,347 50.00 7,139
21,503 19,846
Associated companies
Fidelidade – Companhia de Seguros, S.A 15.00 189,632 15.00 204,208
Fidelidade Assistence Consolidated (a) 20.00 6,224 20.00 6,037
Multicare - Seguros de Saúde, S.A. 20.00 12,542 20.00 12,014
SIBS - Sociedade Interbancária de Serviços, S.A. 21.60 28,420 21.60 22,607
Banco Internacional de São Tomé e Príncipe, S.A. 27.00 3,366 27.00 3,403
Prado - Cartolinas da Lousã, S.A. - - 38.15 3,835
Other 5,365 5,546
245,549 257,650
267,051 277,496
(a) Ex-Cares - Companhia de Seguros, S.A.
30-06-2016 31-12-2015
Business sector / Entity
Registered
officeAssets Liabilities Equity (a) Net income Total income
Banking
Banco Internacional de São Tomé e Príncipe São Tomé 90,373 77,900 12,473 619 4,368
Property
Vale do Lobo, Resort Turístico de Luxo, S.A. Lisbon 347,940 501,121 (153,181) (9,238) 9,284
Insurance
Fidelidade – Companhia de Seguros, S.A (b) Lisbon 15,116,268 13,339,971 1,742,268 70,711 919,798
Fidelidade Assistence Consolidated (c) Lisbon 68,840 38,722 29,058 101 20,868
Multicare - Seguros de Saúde, S.A. Lisbon 148,794 88,914 59,880 1,372 107,460
Other
Esegur, S.A. Lisbon 38,239 23,545 14,694 459 22,734
Locarent, S.A. Lisbon 234,777 206,466 28,311 2,897 35,587
Companhia de Papel do Prado, S.A. Tomar 4,430 1,062 3,368 (2) -
SIBS - Sociedade Interbancária de Serviços, S.A. Lisbon 195,832 64,251 131,581 32,798 114,657
(a) Equity includes net income for the year and excludes non-controlling interests.
(b) Data taken from the consolidated f inancial statements.
(c) Ex-Cares - Companhia de Seguros, S.A.
30-06-2016

CGD NOTES ON THE ACCOUNTS 117
NOTES TO THE CONSOLIDATED FINANCIAL STATEMENTS
During the course of first half 2016, the group made losses of €2,734 thousand on the
disposal of its equity stake in Prado Cartolinas da Lousã, S.A., for €1,400 thousand.
Business sector / Entity
Registered
officeAssets Liabilities Equity (a) Net income Total income
Banking
Banco Internacional de São Tomé e Príncipe São Tomé 93,379 80,771 12,608 1,172 8,695
Property
Vale do Lobo, Resort Turístico de Luxo, S.A. Lisbon 355,246 492,406 (137,160) (16,406) 17,549
Insurance
Fidelidade – Companhia de Seguros, S.A (b) Lisbon 15,092,905 13,167,774 1,891,367 286,287 1,931,041
Fidelidade Assistence Consolidated (c) Lisbon 65,310 35,860 28,122 6,121 43,510
Multicare - Seguros de Saúde, S.A. Lisbon 134,253 77,009 57,244 8,370 203,850
Other
Esegur, S.A. Lisbon 37,823 23,545 14,278 1,400 48,910
Locarent, S.A. Lisbon 234,974 209,560 25,414 7,500 76,724
Companhia de Papel do Prado, S.A. Tomar 4,430 1,054 3,376 (7) -
Prado - Cartolinas da Lousã, S.A. Lousã 14,758 4,705 10,053 1,060 16,761
SIBS - Sociedade Interbancária de Serviços, S.A. Lisbon 165,755 61,087 104,668 23,279 154,166
(a) Equity includes net income for the year and excludes non-controlling interests.
(b) Data taken from the consolidated f inancial statements.
(c) Ex-Cares - Companhia de Seguros, S.A.
31-12-2015

118 NOTES ON THE ACCOUNTS CGD
NOTES TO THE CONSOLIDATED FINANCIAL STATEMENTS
16. INCOME TAX
Tax assets and liabilities balances, on income, at June 30, 2016 and December 31, 2015,
were as follows:
Deferred tax movements, for the half years ended June 30, 2016 and 2015, were as
follows:
30-06-2016 31-12-2015
Current tax assets
Income tax recoverable 26,717 25,805
Other 14,005 11,321
40,722 37,126
Current tax liabilities
Income tax payable 37,813 (4,184)
Other 9,203 20,048
47,016 15,864
(6,294) 21,263
Deferred tax assets
Temporary differences 1,220,013 1,232,298
Reported tax losses 338,666 241,620
1,558,679 1,473,918
Deferred tax liabilities 131,877 253,224
1,426,802 1,220,694
Equity Profit or loss
Impairment losses on credit 790,487 - (2,145) 4,963 793,305
Employee benefits 199,145 (12,127) 4,309 (191) 191,136
Impairment and adjustments to property and tangible and intangible assets 34,072 261 (3,376) (2,405) 28,552
Measurement of available-for-sale assets (75,447) 48,313 - 121 (27,013)
Impairment and other value changes in equity stakes and other securities (10,637) - 20,485 - 9,848
Other provisions and impairment not tax deductible 38,191 - (3,161) 49,639 84,669
Tax loss carry forward 241,620 - 97,416 (370) 338,666
Other 3,263 - 4,289 89 7,641
1,220,694 36,446 117,818 51,846 1,426,802
Balance at
31-12-2015
Change inOther
Balance at
30-06-2016
Equity Profit or loss
Impairment losses on credit 669,206 - (70,272) 598,934
Employee benefits 183,080 (832) (2) 109 182,355
Impairment and adjustments to property and tangible and intangible assets 25,173 336 (6,440) (7) 19,062
Measurement of available-for-sale assets (126,699) 76,358 - 295 (50,046)
Impairment and other value changes in equity stakes and other securities (54,394) - (41,663) (3,479) (99,536)
Other provisions and impairment not tax deductible 33,986 - - (1,193) 32,793
Tax loss carry forward 337,947 - 111,343 - 449,290
Other (13,479) (5,704) 7,873 (11,309)
1,054,819 75,862 (12,738) 3,597 1,121,540
Balance at
31-12-2014
Change inOther
Balance at
30-06-2015

CGD NOTES ON THE ACCOUNTS 119
NOTES TO THE CONSOLIDATED FINANCIAL STATEMENTS
Caixa Geral de Depósitos and Caixa - Banco de Investimento applied for the special
deferred tax assets regime, in 2014, following the favourable resolution passed at their
respective general meetings of shareholders.
This regime, approved by law 61/2014 of August 26, as amended by law 23/2016 of
August 19, applies to deferred tax assets resulting from the non-deduction of expenses
and negative equity changes with impairment losses on loans (provided for in nos. 1 and
2 of article 28-A of the IRC code and respective exclusions) and with post employment or
long term benefits for employees.
The period of application of the amendments to the regime brought in by law 23/2016,
excluded the expenses and negative equity changes accounted for in the taxation period
starting on or after January 1, 2016, in addition to the deferred tax therewith associated.
The expenses and negative equity changes accounted for after the regime entered into
force (January 1, 2016) in addition to the eligible deferred tax recognised in the accounts
at December 31, 2014, are therefore included.
Deferred tax assets which are the result of the non-deduction of expenses and negative
equity changes with impairment losses on loans and with post employment or long term
benefits for employees are converted into tax credit when the taxpayers recognise
negative net income in the respective tax period or in the event of liquidation based on
voluntary dissolution or a legal ruling declaring insolvency. In a conversion scenario
resulting from negative net income, the amount of the tax credit to be attributed will be
based on the proportion between the negative net income for the period and the
taxpayers’ total equity (assessed before the deduction of this result), applied to the
eligible deferred tax balance. When the conversion is the result of a liquidation or
insolvency or when the taxpayers have negative equity, the full amount of the deferred
tax assets is converted.
In the conversion of the tax credit (other than on liquidation or insolvency) a special
reserve should be set up for the amount of the respective credit plus 10% together with
the issuance of securities with conversion rights to be attributed to the state, which, in the
case of Caixa Geral de Depósitos is also its sole shareholder. The consequence of
exercising the conversion right is to increase the taxpayers’ share capital based on the
incorporation of the special reserve and issuance of new ordinary shares for free delivery
to the state. On the date of issuance of the conversion rights, shareholders have the
potestative right to their acquisition in proportion to their respective holding.
Deriving from the application of this regime, no fiscal losses were reported at the close of
2015.
Information on the composition of the deferred tax assets posted by the group,
considered eligible under the regime, up to December 31, 2015, is set out below:
The group changed its accounting policy on the recognition of actuarial gains and losses
on pension plans and other post-employment benefits in 2011. Accordingly, actuarial
gains and losses arising from the revaluation of pensions and healthcare liabilities and
expected pension fund yields were fully recognised as a charge to a shareholders’ equity
account. Up to 2010 these gains and losses were processed by the corridor method.
Impairment losses on credit 1,037,628
Employee benefits 182,632
1,220,260
Deferred tax covered by the scope of incidence of the special arrangements
applicable to deferred tax assets

120 NOTES ON THE ACCOUNTS CGD
NOTES TO THE CONSOLIDATED FINANCIAL STATEMENTS
The amount of tax associated with the contributed component of the actuarial deviations
originated after the date on which the accounting policy was changed, considered
deductible under the terms of the eligible limits of numbers 2 and 3 of article 43 of the
IRC code, or those realised under number 8 of the referred to article are posted to an
equity account as a basis for the recognition of the originating liabilities.
Information on the costs of tax on profit recognised in profit and loss, in addition to the
fiscal burden measured by the relationship between the appropriation for tax on profit and
net profit for the period before tax, is set out below:
In the half years ended June 30, 2016 and in 2015, the composition of “Adjustments for
past years” was as follows:
30-06-2016 30-06-2015
Current tax
For the period 65,720 79,169
Extraordinary contribution on the banking sector 39,698 30,866
Prior year adjustments (net) (138) (3,167)
105,281 106,867
Deferred tax (117,818) 12,738
Total (12,537) 119,605
Consolidated income before tax and non-controlling interests (193,110) 213,483
Tax charge 6.49% 56.03%
30-06-2016 30-06-2015
Insufficiency / (excess) of estimated tax for
2015 and 2014 (524) (3,063)
Adjustments to previous years taxable income 395 -
Other (9) (104)
(138) (3,167)

CGD NOTES ON THE ACCOUNTS 121
NOTES TO THE CONSOLIDATED FINANCIAL STATEMENTS
Information on the reconciliation between the nominal and effective tax rate for the half
years ended June 30, 2016 and 2015 is set out below:
CGD’s nominal tax rate, for the six months ended June 30, 2016 and 2015, considering
the state surcharge applicable to its activity, was 27.35%.
The assessment of CGD’s nominal tax rate considers the increase in the municipal and
state surcharges on taxable profit. In the case of the state surcharge, reference should be
made to the change in the wording of article 87-A of the IRC code under law 2-2014 of
January 16 (IRC reform law) whose number 1 provides for the application of the following
rates on taxable profit classified in the following tax bands:
- a rate of 3% between €1,500 thousand and €7,500 thousand;
- a rate of 5% between €7,500 thousand and €35,000 thousand;
- a rate of 7% on more than €35,000 thousand.
Caixa derecognised deferred tax assets on its carry-back of tax losses in 2013 during the
course of second half 2015 for the amount of €124,651 thousand, owing to its
consideration of the remoteness of their recoverability up to the end of the respective
regulatory period (end of 2018). As a result of this cancellation, the whole of the deferred
tax assets balance, at December 31, 2015, associated with the carry-back of tax losses
which continues to be recognised in Caixa’s financial statements referred to 2014.
According to the changes pursuant to the law reforming the IRC code, the period for
reporting the carry-back of tax losses for tax periods starting after January 1, 2014 was
extended to 12 years. This period was reduced to 5 years for taxation periods starting on
or after January 1, 2017, under the dispositions of law 7-A/2016 of March 30 (approving
the state budget for 2016).
Rate Tax Rate Tax
Income before income tax (193,110) 213,483
Tax at the nominal rate 27.35% (52,816) 27.35% 58,388
Investments recorded in accordance with the equity method 2.82% (5,448) (4.30%) (9,179)
Impact of companies with tax rates different from the nominal rate in
Portugal (3.88%) 7,492 (2.28%) (4,860)
Definitive difference to be added:
Non deductible provisions (1.73%) 3,341 3.67% 7,844
Other (1.22%) 2,350 2.41% 5,150
Other permanent differences to be deducted 0.12% (233) (0.16%) (348)
Impairment on available-for-sale financial assets, net of write-offs 14.71% (28,408) 0.24% 515
Annulment of tax losses (not recoverable) (0.55%) 1,059 1.96% 4,178
Differential of tax rate on tax losses carry forward (*) (10.90%) 21,046 11.89% 25,380
Autonomous taxation (0.58%) 1,124 0.66% 1,418
Contribution on the banking sector (20.56%) 39,698 14.46% 30,866
Other (2.09%) 4,042 1.34% 2,854
3.50% (6,752) 57.24% 122,205
Tax adjustments relative to prior years
Insufficiency / (excess) of tax estimate, net of deferred tax 2.99% (5,776) (1.17%) (2,496)
Other 0.00% (9) (0.05%) (104)
3.00% (5,785) (1.22%) (2,600)
6.49% (12,537) 56.03% 119,605
(*) The computation of deferred taxes relating to tax losses carry forw ard is based on a regulatory tax rate of 21% and does not include State or Municipal
subcharges.
2016-06-30 30-06-2015

122 NOTES ON THE ACCOUNTS CGD
NOTES TO THE CONSOLIDATED FINANCIAL STATEMENTS
The deductibility of the carry-back of tax losses is limited to 70% of the taxable profit
assessed in the taxation period in which they are used.
Deriving from the dispositions of article 141 of the state budget law for 2011 (law 55-
A/2010 of December 31,), which introduced a new contribution regime applicable to the
banking sector, the group recognised costs of €39,698 thousand and €30,866 thousand
for the half years ended June 30, 2016 and 2015, respectively, in respect of the total
costs of this tax in the respective tax periods. The tax, regulated under the terms of
ministerial order 121/2011 of March 30, is levied on the amount of the liabilities of credit
institutions headquartered on Portuguese territory, net of own and complementary funds
therein included and the deposits covered by the deposit guarantee fund as well as the
notional amount of derivatives other than hedge derivatives. The tax is also payable by
the subsidiaries of credit institutions headquartered outside Portuguese territory as well
as by the branches in Portugal of credit institutions headquartered outside the European
Union.
The tax authorities are normally entitled to review the tax situation during a certain period,
which in Portugal is four years (unless tax losses have been carried back, in addition to
any other deduction or tax credit expiring in the same year as this right). Owing to
different interpretations of the legislation, this may result in the eventual possibility of
adjustments being made to the taxable profit of former years (2012 to 2015 in the case of
most entities headquartered in Portugal, with Caixa Geral de Depósitos having been
inspected in 2011 and 2013). Caixa’s board of directors considers, however, that any
adjustments for the above referred to years will not be significant in terms of the
consolidated financial statements.

CGD NOTES ON THE ACCOUNTS 123
NOTES TO THE CONSOLIDATED FINANCIAL STATEMENTS
17. OTHER ASSETS
This account heading comprises the following:
Information on impairment movements on debtors and other assets for the half years
ended June 30, 2016 and in 2015 is set out in note 34.
The amount receivable on the EDP disposal, at June 30, 2016 and December 31, 2015,
derives from CGD’s disposal of an equity stake in the company to Parpública.
The “Debtors and other assets – other debtors” account heading at June 30, 2016 and
December 31, 2015, included €1,124,714 thousand and €720,361 thousand, respectively,
for surety accounts in several financial institutions. The referred to sureties derive from
liquidity-providing operations collateralised by financial assets and from “Interest rate
swaps” (IRS) with these entities (note 10).
The “Debtors and other assets – other debtors” account heading, at June 30, 2016 and
December 31, 2015, included €50,282 thousand in respect of a Caixa surety deposit with
30-06-2016 31-12-2015
Other assets
Debt certificates of the Territory of Macau 817,597 770,810
Other 9,729 9,727
Debtors and other investments
Central and local government 14,678 7,840
Shareholders' loans 213,900 213,041
Debtors - futures contracts 51,256 41,335
Amount receivable from the sale of EDP 481,456 481,456
Other debtors 1,660,664 1,175,835
Grants receivable from
The State 20,597 22,237
Other entities 11,965 11,633
Amount receivable from the sale of assets received as settlement of
defaulting loans 543 18,168
Other 136,544 107,740
Commitments with pension and other employee benefits - 13,423
Income receivable 35,865 41,071
Deferred costs
Rent 5,732 5,103
Other 40,361 20,509
Deferred income (3,367) (4,674)
Operations pending settlement 573,362 176,278
Stock exchange operations 8,840 -
4,079,720 3,111,532
Impairment (Note 34) (315,277) (245,760)
3,764,443 2,865,772

124 NOTES ON THE ACCOUNTS CGD
NOTES TO THE CONSOLIDATED FINANCIAL STATEMENTS
the tax authorities as part of the proceedings for the suspension of the fiscal execution of
a tax settlement, referred to in greater detail in note 21.
The “Debtors and other assets – other debtors” account heading, at June 30, 2016,
included €4,574 thousand on a surety set up as a result of contributions to the European
single resolution fund in the form of an irrevocable commitment (note 31).
Under the agreement to issue notes entered into between Banco Nacional Ultramarino,
S.A. (Macau) and the Territory of Macau, the bank provides the Territory with convertible
currency corresponding to the counter value of notes in circulation, receiving in return, a
debt certificate for an equivalent amount to cover the liability resulting from the currency
issuance (note 23). The amounts to be provided to the Territory by BNU are reconciled
on a monthly basis, in the first fifteen days of each month, based on the preceding
month’s average daily balance. The debt certificate of the Macau government, at June
30, 2016 and December 31, 2015, totalled €817,597 thousand and €770,810 thousand,
respectively. No interest is payable on the certificate, as the consideration for the
functions attributed to Banco Nacional Ultramarino, S.A. (Macau) is in the form of a
permanent non-interest-bearing deposit.
Shareholders’ loans, at June 30, 2016 and December 31, 2015, comprised the following:
The details of shareholders’ loans to Locarent – Companhia Portuguesa de Aluguer de
Viaturas, S.A., at June 30, 2016 and December 31, 2015, are set out below:
A shareholders’ loan of €36,000 thousand at the 3 month Euribor rate plus a
spread of 0.75%. Interest is paid quarterly on February 1, May, August and
November of each year. An addendum to the loan extending the maturity up to
June 30, 2018 was signed in first half 2014.
A shareholders’ loan of €50,000 thousand. Quarterly interest at the 3 month
Euribor rate plus a spread of 3% is paid on this operation. Interest is paid
quarterly on January 1, April 1, July 1 and October 1 each year. In second half
2015, the parties agreed another addendum to the shareholders’ loan agreement
under which the scheduled maturity period of September 30 was extended for
another year with no other changes being made to the terms and conditions in
force.
Under the terms of the financial restructuring agreement for the Coelima, JMA - José
Machado de Almeida and AAF – António Almeida & Filhos textiles groups Caixa made
shareholders’ loans of €31,182 thousand to Moretextile, SGPS, S.A. Interest at the 6
month Euribor rate plus a spread of 2.5% is charged on these shareholders’ loans which
are repayable in full (principal and interest) in a lump sum on 13 May 2018, which term is
renewable for an additional period of five years. The repayment of these shareholders’
loans is subordinated to payment of the overdue and unpaid loans of other creditors by
Moretextil and its associates. Caixa recognised impairment on unrealised capital losses
30-06-2016 31-12-2015
Locarent - Companhia Portuguesa de Aluguer de Viaturas, S.A. 86,000 86,000
Moretextile, SGPS, S.A. 36,571 36,123
A. Silva & Silva - Imobiliário & Serviços, S.A. 28,977 28,977
Sagesecur - Estudo, Desenvolvimento e Participações em Projetos, S.A. 12,863 12,863
PP3E - Projetos e Participações em Empreendimentos de Energia Elétrica, S.A. 10,200 10,200
Other 39,289 38,878
213,900 213,041

CGD NOTES ON THE ACCOUNTS 125
NOTES TO THE CONSOLIDATED FINANCIAL STATEMENTS
for the amount of €36,751 thousand on this asset of which €448 thousand in first half
2016.
This account heading also included an assignment of credit rights over 19.5% of the
shareholders’ loans made to Sagesecur by Parpública to Parcaixa, at June 30, 2016 and
December 31, 2015, in the sphere of the payment of the entity’s share capital, at the date
of its formation.

126 NOTES ON THE ACCOUNTS CGD
NOTES TO THE CONSOLIDATED FINANCIAL STATEMENTS
18. CREDIT INSTITUTIONS' AND CENTRAL BANKS' RESOURCES
This account heading comprises the following:
The “Central banks’ resources – resources – European Central Bank” account heading at
June 30, 2016 and December 31, 2015, refers to loans obtained from the European
Central Bank, collateralised by debt instruments and other loans in the group’s portfolio.
30-06-2016 31-12-2015
Resources of central banks
Resources - European Central Bank
Loans, deposits and other resources
Caixa Geral de Depósitos 2,000,000 1,250,000
Other Group entities 1,597,220 1,515,574
Resources of other central banks
Deposits and other resources
Of domestic credit institutions 677 278
Of foreign credit institutions 85,839 90,334
Sales operations with repurchase agreement 6,287 -
Other resources 1,565 1,554
Interest payable 696 2,637
3,692,284 2,860,377
Resources of other credit institutions
Deposits and other resources
Of domestic credit institutions 577,449 668,123
Of foreign credit institutions 879,415 950,046
Interbank money market resources 14,500 14,300
Immediate short term resources
Of domestic credit institutions 122,386 192,891
Of foreign credit institutions 2,549 56,566
Loans
Of foreign credit institutions 22,019 18,572
Resources of international financial entities 100,697 79,652
Sale operations with repurchase agreement 351,816 587,298
Adjustments to liabilities under hedging operations (3,998) (4,473)
Interest payable 10,741 11,271
Charges with deferred cost (1,255) (1,551)
2,076,319 2,572,694
5,768,602 5,433,070

CGD NOTES ON THE ACCOUNTS 127
NOTES TO THE CONSOLIDATED FINANCIAL STATEMENTS
These assets are not available for free circulation and are recognised at their nominal
value in “Asset-backed guarantees” (note 21) in off-balance sheet account headings.
The “Sales operations with repurchase agreements” account heading, at June 30, 2016
and December 31, 2015, refers to contracts for the assignment of financial assets with an
agreement to purchase at a future date at a predefined price, entered into between the
group and various financial institutions.
The assignment of financial instruments in sales operations with repurchase agreements
is not derecognised in the balance sheet and continues to be measured in accordance
with the accounting policies applicable to the underlying assets (note 9). The difference
between sales and repurchase prices is recognised as an interest expense and deferred
over the contract's lifetime.
The referred to operations were contracted for under GMRAs (global master repurchase
agreements) or bilateral liquidity injection agreements, which provide mechanisms to
strengthen the collateral associated with these transactions based on the evolution of
respective market value, assessed in accordance with the specifications agreed between
the counterparties, usually comprising surety deposits.

128 NOTES ON THE ACCOUNTS CGD
NOTES TO THE CONSOLIDATED FINANCIAL STATEMENTS
19. CUSTOMERS’ RESOURCES AND OTHER LOANS
This account heading comprises the following:
30-06-2016 31-12-2015
Savings deposits 2,174,039 2,004,439
Other debts
Repayable on demand 25,063,609 25,185,826
Term
Deposits 43,018,121 44,034,310
Mandatory deposits 293,282 299,577
Other resources:
Cheques and orders payable 94,180 86,270
Loans 120,030 188,534
Operations with repurchase agreement 161,495 117,004
Other 1,303,090 1,241,509
44,990,198 45,967,205
70,053,807 71,153,031
Interest payable 227,590 253,757
Deferred costs net of deferred income (11,687) (13,807)
Commissions associated with amortised cost (deferred) (3,951) (3,834)
Adjustments to liabilities under hedging operations 2,014 32,679
213,966 268,794
72,441,813 73,426,265

CGD NOTES ON THE ACCOUNTS 129
NOTES TO THE CONSOLIDATED FINANCIAL STATEMENTS
20. DEBT SECURITIES
This account heading comprises the following:
The breakdown of the debt securities account heading, at June 30, 2016 and December
31, 2015, is net of the accumulated repurchased debt balances, broken down as follows:
CGD uses the following specific programmes to diversify its funding sources:
(i) Euro commercial paper and certificates of deposit (ECP and CCP)
Under the “€10 billion euro commercial paper and certificates of deposit”
programme, CGD (either directly or through its France and London branches) is
entitled to issue certificates of deposit (CD) and notes with a maximum maturity
of five years and one year, respectively, in euros, US dollars, sterling, Japanese
yen or any other currency agreed between the parties. Fixed or variable-rate
30-06-2016 31-12-2015
Bonds in circulation:
Bonds issued under the EMTN Programme
- Remuneration indexed to interest rates 40,000 40,000
- Fixed interest rate 351,315 638,483
- Remuneration indexed to exchange rates 160,421 201,416
551,736 879,899
Covered bonds 5,340,160 5,484,982
Other cash bonds
- Remuneration indexed to interest rates 21,119 42,430
21,119 42,430
5,913,015 6,407,311
Other
Issues under the Euro Commercial Paper and Certificates of Deposit
Programme
- Commercial Paper 70,000 110,500
Securities issued under securitisation operations
- Other collateralized emissions 14,593 11,915
84,593 122,415
Adjustments to liabilities under hedging operations 26,409 29,396
Deferred costs net of income (12,834) (16,022)
Interest payable 105,689 156,981
6,116,872 6,700,081
30-06-2016 31-12-2015
Bonds issued under the EMTN programme 15,000 15,000
Covered bonds 1,500,000 1,500,000
1,515,000 1,515,000

130 NOTES ON THE ACCOUNTS CGD
NOTES TO THE CONSOLIDATED FINANCIAL STATEMENTS
interest is payable on these issuances which may also be indexed to indices or
shares.
(ii) US commercial paper
Under this programme, CGD North America Finance LLC is entitled to issue
notes for up to a total amount of USD 2 billion. The notes have a maximum
maturity of 1 year and a minimum amount of USD 250,000. The notes may be
issued at a discount or at par. All issuances are guaranteed by CGD.
(iii) Euro medium term notes (EMTN)
CGD group, through CGD (either directly or through its France and London
branches) and CGD Finance, is entitled to issue debt securities under this
programme for a maximum amount of €15 billion. France branch guarantees all
CGD Finance issues.
Bonds may be issued in any currency with minimum maturities of one month
and 5 years for non-subordinated and subordinated issuances, respectively.
There are no maximum maturities on these operations.
These securities may be issued at a discount. Fixed or variable-rate interest is
payable on these issuances which may also be indexed to indices or shares.
(iv) Covered bonds
CGD set up a programme for the direct issuance of covered bonds up to a
current maximum amount of €15,000,000 thousand in November 2006. The
bonds to be issued are backed by a mortgage loan portfolio which must, at any
point of time, comply with the minimum conditions required by the regulations
applicable to issuances of this type of instruments, i.e. decree law 59/2006,
official notices 5, 6, 7 and 8 and Bank of Portugal instruction 13.
The bonds may be issued in any currency with a minimum term of 2 and a
maximum term of 50 years. Fixed or variable-rate interest is payable on these
issuances which may also be indexed to indices or shares.
These bonds entitle their holders to special credit rights – over any other
creditors – on assets which have been set aside in the issuing entity’s balance
sheet to guarantee the debt and available to bondholders, in the event of
insolvency.
Assets eligible for the constitution of an asset pool comprise mortgage loans for
housing or commercial purposes in a European Union member state or,
alternatively, loans and advances to the central governments or regional and
local authorities of one of the European Union member states and loans with an
express and legally binding guarantee of such entities. Mortgage loans cannot
exceed 80% of the mortgaged assets given as collateral in respect of property
for housing (60% for other property).
In accordance with the issuance conditions defined by the programme, the
following criteria must also be complied with during the period of the issuance:
- The total nominal value of covered bonds in circulation may not exceed
95% of the total value of mortgage loans and other assets allocated to the
referred to bonds;
- The average maturity of covered bonds issuances may not, as a whole,
exceed the average life of the associated mortgage loans;

CGD NOTES ON THE ACCOUNTS 131
NOTES TO THE CONSOLIDATED FINANCIAL STATEMENTS
- The total amount of interest payable on the covered bonds may not, for
issuances as a whole, exceed the amount of interest charged to the
borrowers of mortgage loans allocated to the referred to bonds;
- The present value of the covered bonds may not exceed the present value
of the assets allocated to them, which ratio must be maintained for parallel
shifts of 200 basis points on the yield curve.
The asset pool may also include autonomous assets, up to a maximum of 20% of its
value, namely deposits at the Bank of Portugal or securities eligible for Eurosystem credit
and other operations defined by law.
The nominal value of covered bonds issued by Caixa at June 30, 2016 and December
31, 2015, totalled €6,851,450 thousand and €7,001,450 thousand, respectively, with the
following characteristics:
The assets pool used to back the issues includes mortgage loans made in Portugal with a
book value of €9,956,026 thousand and €10,478,994 thousand, at June 30, 2016 and
December 31, 2015, respectively (note 12).
The assets pool used to collateralise the covered bonds, at June 30, 2016 and December
31, 2015, also comprised debt securities, with a book value of €137,640 and €144,294
thousand respectively (note 8).
Moody’s and Fitch ratings on these covered bonds, at June 30, 2016, were A3 and BBB,
respectively.
Details on bond issuances, by type of interest and period to maturity, in the financial
statements, at June 30, 2016 and December 31, 2015, were as follows:
30-06-2016 31-12-2015
Hipotecárias Série 1 2006/2016 1st tranche 1,256,450 1,256,450 06-12-2006 06-12-2016 Annually, on 6 December Fixed rate 3.875% 3.875%
Hipotecárias Série 4 2007/2022 250,000 250,000 28-06-2007 28-06-2022Quarterly, on 28 March, June, September
and December
3 month Euribor
rate + 0.05%
0.000% 0.000%
Hipotecárias Série 7 2008/2016 - 150,000 31-03-2008 15-03-2016Quarterly, on 15 March, June, September
and December
3 month Euribor
rate - 0.012%-
0.000%
Hipotecárias Série 1 2006/2016 2nd tranche 150,000 150,000 09-09-2008 06-12-2016 Annually, on 6 December Fixed rate 3.875% 3.875%
Hipotecárias Série 8 2008/2038 20,000 20,000 01-10-2008 01-10-2038 Annually, on 1 October Fixed rate 5.380% 5.380%
Hipotecárias Serie 9 15/09/2016 175,000 175,000 08-10-2009 15-09-2016Half yearly, on 15 March and 15
September
6 month Euribor
rate + 0.575%0.444% 0.612%
Hipotecárias Série 10 2010/2020 1,000,000 1,000,000 27-01-2010 27-01-2020 Annually, on 27 January Fixed rate 4.250% 4.250%
Hipotecárias Série 14 2012/2022 (*) 1,500,000 1,500,000 31-07-2012 31-07-2022Quarterly, on 31 January, April, July and
October
3 month Euribor
rate + 0.75%0.499% 0.683%
Hipotecárias Série 15 2013/2018 750,000 750,000 18-01-2013 18-01-2018 Annually, on 18 January Fixed rate 3.750% 3.750%
Hipotecárias Série 16 2013/2019 750,000 750,000 15-01-2014 15-01-2019 Annually, on 15 January Fixed rate 3.000% 3.000%
Hipotecárias Série 17 2015/2022 1,000,000 1,000,000 27-01-2015 27-01-2022 Annually, on 27 January Fixed rate 1.000% 1.000%
6,851,450 7,001,450
(*) Issue fully repurchased by CGD. These securities are collaterising liquidity providing operations w ith the European Central Bank
DESIGNATIONNominal
Date of issueDate of
redemptionInterest payment Remuneration
Interest rate at
30-06-2016
Interest rate at
31-12-2015
Exchange rate Interest rate
Sub
total
Up to one year 50,000 161,911 211,911 1,581,450 - 1,793,361
One to five years 67,254 140,636 207,890 2,492,301 21,119 2,721,310
Five to ten years 19,152 78,768 97,920 1,246,409 - 1,344,329
Over ten years 24,015 10,000 34,015 20,000 - 54,015
160,421 391,315 551,736 5,340,160 21,119 5,913,015
30-06-2016
Type of asset or underlying index used to
calculate the remunerationCovered bonds Other bonds Total
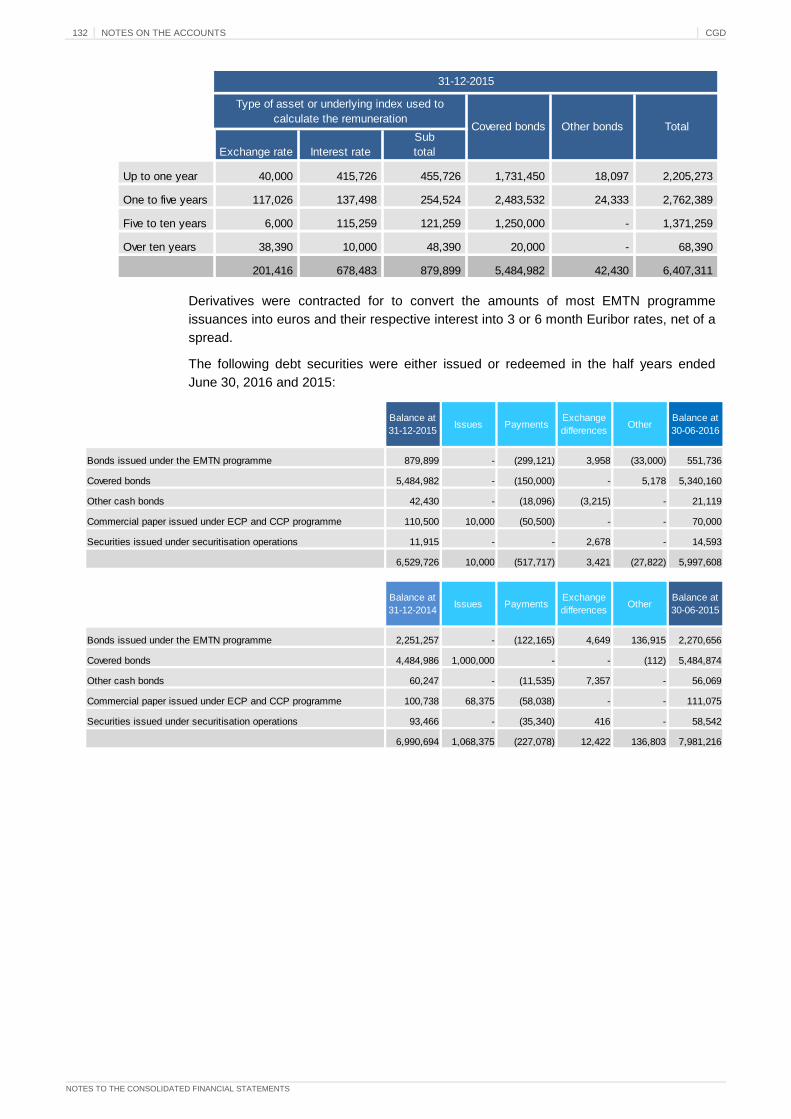
132 NOTES ON THE ACCOUNTS CGD
NOTES TO THE CONSOLIDATED FINANCIAL STATEMENTS
Derivatives were contracted for to convert the amounts of most EMTN programme
issuances into euros and their respective interest into 3 or 6 month Euribor rates, net of a
spread.
The following debt securities were either issued or redeemed in the half years ended
June 30, 2016 and 2015:
Exchange rate Interest rate
Sub
total
Up to one year 40,000 415,726 455,726 1,731,450 18,097 2,205,273
One to five years 117,026 137,498 254,524 2,483,532 24,333 2,762,389
Five to ten years 6,000 115,259 121,259 1,250,000 - 1,371,259
Over ten years 38,390 10,000 48,390 20,000 - 68,390
201,416 678,483 879,899 5,484,982 42,430 6,407,311
31-12-2015
Type of asset or underlying index used to
calculate the remunerationCovered bonds Other bonds Total
Balance at
31-12-2015Issues Payments
Exchange
differencesOther
Balance at
30-06-2016
Bonds issued under the EMTN programme 879,899 - (299,121) 3,958 (33,000) 551,736
Covered bonds 5,484,982 - (150,000) - 5,178 5,340,160
Other cash bonds 42,430 - (18,096) (3,215) - 21,119
Commercial paper issued under ECP and CCP programme 110,500 10,000 (50,500) - - 70,000
Securities issued under securitisation operations 11,915 - - 2,678 - 14,593
6,529,726 10,000 (517,717) 3,421 (27,822) 5,997,608
Balance at
31-12-2014Issues Payments
Exchange
differencesOther
Balance at
30-06-2015
Bonds issued under the EMTN programme 2,251,257 - (122,165) 4,649 136,915 2,270,656
Covered bonds 4,484,986 1,000,000 - - (112) 5,484,874
Other cash bonds 60,247 - (11,535) 7,357 - 56,069
Commercial paper issued under ECP and CCP programme 100,738 68,375 (58,038) - - 111,075
Securities issued under securitisation operations 93,466 - (35,340) 416 - 58,542
6,990,694 1,068,375 (227,078) 12,422 136,803 7,981,216

CGD NOTES ON THE ACCOUNTS 133
NOTES TO THE CONSOLIDATED FINANCIAL STATEMENTS
21. PROVISIONS AND CONTINGENT LIABILITIES
Provisions
Movements in provisions for employee benefits and for other risks, for the half years
ended June 30, 2016 and in 2015, were as follows:
"Provisions for employee benefits costs", in first half 2016, included an increase of
€20,000 thousand recognised in employee costs (note 32), resulting from the Horizonte
early retirement plan.
Provisions for other risks and liabilities cover contingencies arising from the group’s
activity.
Provisions for legal contingencies comprise the group’s best estimate of any amounts to
be spent on their resolution, based on estimates provided by the legal department and its
attendant lawyers.
Balance at
31-12-2015
Additions and
reversalsWrite-offs
Exchange
differences
Transfers and
other
Balance at
30-06-2016
Provision for employee benefits 642,958 637 (18,338) (894) (10,976) 613,388
Provision for litigation 15,740 (24) - 1,051 181 16,947
Provision for guarantees and other
commitments 156,006 (2,703) - 643 (40,888) 113,058
Provision for other risks and charges 177,760 (15,336) (3,752) (1,213) (5,261) 152,199
349,506 (18,062) (3,752) 481 (45,968) 282,204
992,464 (17,425) (22,089) (414) (56,944) 895,592
Balance at
31-12-2014
Additions and
reversalsWrite-offs
Exchange
differences
Transfers and
other
Balance at
30-06-2015
Provision for employee benefits 572,386 1,981 (12,888) (455) 12,370 573,395
Provision for litigation 15,928 (93) (5) (444) 430 15,815
Provision for guarantees and other
commitments 150,300 3,629 - 96 942 154,966
Provision for other risks and charges 103,044 14,851 (2,896) (165) 184 115,019
269,272 18,387 (2,901) (514) 1,556 285,800
841,658 20,368 (15,789) (969) 13,926 859,195

134 NOTES ON THE ACCOUNTS CGD
NOTES TO THE CONSOLIDATED FINANCIAL STATEMENTS
Contingent liabilities and commitments
Contingent liabilities associated with banking activity are recognised in off-balance sheet
account headings, as follows:
Asset-backed guarantees are as follows:
30-06-2016 31-12-2015
Contingent liabilities
Assets given as collateral 16,984,504 14,421,170
Guarantees and sureties 3,799,055 3,793,082
Open documentary credits 361,550 502,154
Stand by letters of credit 74,368 57,816
21,219,477 18,774,223
Commitments
Revocable commitments 8,709,394 8,690,214
Securities subscription 1,703,304 1,654,834
Irrevocable lines of credit 1,170,729 1,273,964
Term liabilities relating to annual contributions to the Deposit Guarantee
Fund 155,553 155,553
Term operations 90,363 100,500
Investor Compensation System 37,729 37,693
Other irrevocable commitments 79,167 2,230
Forward deposit agreements
To be created - 85,618
11,946,240 12,000,606
Deposit and custody of securities 40,470,954 40,103,407
30-06-2016 31-12-2015
Debt Instruments
Consigned resources
EIB - European Investment Bank 1,087,500 943,500
Council of Europe Development Bank 31,000 10,000
Bank of Portugal (*) 13,848,160 13,116,015
Agência de Gestão da Tesouraria e da Dívida Pública - IGCP, E.P.E. 162,407 133,272
Deposit Guarantee Fund 185,240 175,240
Royal Bank of Scotland 15,000 15,000
Investor Compensation System (futures) 21,000 21,000
Euronext 6,500 6,500
Other Assets
Other 199,013 643
15,555,820 14,421,170
(*) Includes the securities portfolio associated w ith liquidity-taking w ith the European Central Bank, as w ell as the securities
given to the Bank of Portugal as collateral, in the scope of the "Daily Market Credit Agreement" in the amount of EUR 500 million
and other interbank money market transactions.

CGD NOTES ON THE ACCOUNTS 135
NOTES TO THE CONSOLIDATED FINANCIAL STATEMENTS
Asset-backed guarantees, at June 30, 2016 and December 31, 2015, refer to debt
instruments classified as assets held for trading, available-for-sale financial assets, loans
and advances to customers and debt securities account headings. The market value of
debt instruments given as collateral, at June 30, 2016 and December 31, 2015, was
€15,628,941 thousand and €14,962,937 thousand, respectively.
The market value of securities collateralising the group’s term liabilities for annual
contributions to the deposit guarantee fund and the investors’ indemnity system was
€213,150 thousand and €205,290 thousand, at June 30, 2016 and December 31, 2015,
respectively.
The object of the deposit guarantee fund is to guarantee customers’ deposits in
conformity with the limits defined by the general credit institutions regime. This takes the
form of regular annual contributions. In past years a part of the liabilities took the form of
an irrevocable commitment to make the referred to contributions when requested by the
fund, with the amount not being posted as a cost. Commitments assumed since 1996
total €155,553 thousand. At June 30, 2016 and 2015, the group recognised liabilities of
€2,425 thousand and €4,945 thousand, respectively for its annual contribution to the
deposit guarantee fund.
Asset-backed guarantees are not available for the group’s free use and are recognised at
their nominal value in off-balance sheet accounts.
In 2009, CGD was notified by the Portuguese tax authorities of their inspection report for
2005 on an adjustment of taxable income for the year amounting to €155,602
thousand. In addition to other situations, the referred to amount included an adjustment of
€135,592 thousand owing to the fact that Caixa had benefited from the full elimination of
double taxation on its share of Caixa Brasil SGPS, S.A.’s results in the said period. Caixa
contested the referred to adjustments, considering that the procedure adopted by it was
in compliance with the fiscal legislation in force, as it was in possession of data enabling it
to show that Caixa Brasil, SGPS S.A.’s earnings were subject to taxation. The Lisbon tax
court issued a ruling, in 2014, annulling, inter alia, the adjustments made by the tax and
customs authorities during the said year on the component allocated to the gains on the
liquidation of Caixa Brasil.
In April 2015, Caixa was notified of the contents of the ruling of the southern central
administrative court of Lisbon which, in the second instance, decided to revoke the ruling
decreed in the first instance by the Lisbon tax court. Caixa decided to contest the court’s
ruling and appealed for a revision thereof in first half 2016. As a result of the allegations
made, the southern supreme administrative court recognised the legitimacy of the
appeal’s assumptions which awaits the decision of the supreme administrative court.
Notwithstanding Caixa’s board of directors’ conviction regarding the conformity of the
adopted procedures and having already taken the steps permitted by law to contest the
ruling, in light of the developments occurring in the meantime, a resolution was passed on
the adequacy of setting up a provision, at June 30, 2015, for the amount of €27,370
thousand (€26,878 thousand at December 31, 2015) to provide for the contingencies
inherent to this process.
As a result of these fiscal executive actions deriving from the referred to past
adjustments, during the course of 2010, Caixa took out a surety deposit as a guarantee in
respect of the suspension of the tax settlement procedure. The referred to surety deposit
for the amount of €50,282 thousand, has been recognised in “Other assets – debtors and
other assets – other debtors” (note 17).
On June 3, 2015, CGD in addition to fourteen other credit institutions, was charged by the
competition authority, with performing certain practices, namely exchanging information

136 NOTES ON THE ACCOUNTS CGD
NOTES TO THE CONSOLIDATED FINANCIAL STATEMENTS
with several of the said credit institutions, which, in the eyes of the said authority,
comprised concerted practices with the aim of significantly distorting market competition.
Based on the requests submitted by several of the said credit institutions, the initial period
was extended on more than one occasion and has still not expired. CGD has prepared a
full defence to comply with the initial period which expired on November 17, 2015.
CGD’s defence is based on its understanding that there are no de facto or legal
presuppositions leading to any sentence being imposed on Caixa Geral de Depósitos on
account of any restrictive market practice, for which reason it has expressly applied for
the process to be archived.
The resolution fund was created under decree law 31-A/2012 of February 10. It is funded
by resources arising from the payment of the contributions owed by the institutions
participating in the fund and the banking sector contribution. Whenever such resources
are shown to be insufficient to meet liabilities a provision is set up for the use of other
financing means, namely: (i) special contributions from credit institutions; and (ii) amounts
deriving from loans.
Application of a resolution measure to Banco Espírito Santo, S.A.
The board of trustees of the Bank of Portugal decided, on August 3, 2014, to apply a
resolution measure to Banco Espírito Santo, S.A. (“BES”), transferring most of its activity
and assets to Novo Banco S.A., a new transitional banking institution created for the
purpose, the total amount of whose capital is now owned by the resolution fund.
Following the resolution measure, Novo Banco, S.A. was deemed to have capital
requirements of €4,900,000 thousand to be realised by the sole shareholder under the
terms of the legislation in force. Considering that the resolution fund did not have the
necessary resources for the said operation on the referred to date, the capital was
subscribed for in the form of two loans:
- €3,900,000 thousand from the Portuguese state; and
- €700,000 thousand from eight fund member institutions (of which €174,000 thousand
from CGD).
In September 2015 the Bank of Portugal suspended the sales process on the resolution
fund’s investment in Novo Banco, which started in 2014 and completed the process in
progress without accepting any of the three binding proposals, considering that the terms
and conditions thereof were not satisfactory. In its announcement of December 21, 2015
the Bank of Portugal provided information on the agreement reached with the European
Commission, providing for, inter alia, an extension to the period for the full disposal of the
resolution fund’s equity investment in Novo Banco.
On December 29, 2015 the Bank of Portugal announced the approval of a series of
decisions to complete the resolution measure applied to BES. The Bank of Portugal
decided to return to BES the liability for the non-subordinated bonds issued by it for
institutional investors. The nominal amount of the bonds returned to BES was €1,941
million with a balance sheet carrying amount of €1,985 million. The bonds were initially
issued by BES and specifically sold to qualified investors. In addition to this measure, the
Bank of Portugal also clarified that the resolution fund is responsible for neutralising any
negative effects of future decisions resulting in contingent liabilities deriving from the
resolution process, by compensating Novo Banco.
The disposal process on the resolution fund’s equity investment in Novo Banco was
relaunched in January 2016 and is currently in progress.
In July 2016, deriving from the conclusion of the independent assessment process on the
level of recoverability of the credit in each category of BES creditors, in a hypothetical

CGD NOTES ON THE ACCOUNTS 137
NOTES TO THE CONSOLIDATED FINANCIAL STATEMENTS
August 2014 liquidation scenario, as an alternative to the application of the resolution
measure, the Bank of Portugal clarified that, in the event of it being verified, at the time of
the finalisation of the liquidation of BES, that creditors whose credit has not been
transferred to Novo Banco, would lose more than in this scenario, then they should be
compensated for the difference by the resolution fund.
Application of a resolution measure to Banif - Banco Internacional do Funchal, S.A.
According to the Bank of Portugal’s announcement of December 20, 2015, a decision
was made to sell off the activity of Banif – Banco Internacional do Funchal, S.A. (Banif)
and most of its assets and liabilities to Banco Santander Totta for €150 million. According
to the referred to announcement, the impositions of European institutions which rendered
the voluntary sale of Banif unviable, led to the disposal being made in the context of a
resolution measure.
Most of the assets which were not sold were transferred to the Oitante, S.A. (Oitante)
assets management vehicle, which was specifically created for the purpose, with the
resolution fund as its sole shareholder. Oitante, herein, issued debt bonds all of which
were acquired by Banco Santander Totta, with a guarantee having been issued by the
resolution fund with a counter guarantee from the Portuguese state.
The operation involved public finance of around €2,255 million to cover future
contingencies of which €489 million from the resolution fund and €1,766 million directly
from the Portuguese state, as a result of the options for the delimitation of the assets and
liabilities sold agreed between the Portuguese authorities, European instances and
Banco Santander Totta.
Up to the date of the board of directors’ approval of the accounts, CGD did not have
information enabling it to estimate, with a reasonable level of accuracy, if there will be any
resolution fund deficit, following these processes and, if applicable, the way in which it will
be financed.
Therefore, it is not possible, at the present, to assess any impact of this situation on
CGD’s financial statements, as any costs to be borne are contingent upon the conclusion
of the referred to processes and the decisions made by the ministry of finance, in
accordance with its legal remit.
According to the information currently available: (i) the resolution fund is unlikely to
propose the creation of a special contribution to finance the above referred to resolution
measures and the possibility of any special contribution fund appears to be remote, and
(ii) any resolution fund deficits are likely to be financed by periodic contributions under
article 9 of decree law 24/2013 of February 19, which stipulates that the periodic
contributions to the resolution fund should be paid by the institutions therein participating
and which are active on the last day of the month of April of the year to which the periodic
contribution refers.

138 NOTES ON THE ACCOUNTS CGD
NOTES TO THE CONSOLIDATED FINANCIAL STATEMENTS
22. OTHER SUBORDINATED LIABILITIES
This account heading comprises the following:
At June 29, 2012, CGD issued €900,000 thousand in hybrid financial instruments eligible
as core tier 1 own funds, fully subscribed for by the Portuguese state (conditions defined
in ministerial order 8840-C/2012 of 28 June 2012). These bonds are convertible into
shares in the following circumstances:
- CGD’s full or part cancellation or suspension of the payment of interest on the
hybrid financial instruments;
- Materially relevant non-compliance with the recapitalisation plan;
- CGD’s failure to repurchase the full amount of the hybrid financial instruments up
to the end of the investment period (five years);
- Exercising of conversion rights specified by the state in the issuance conditions;
- If the hybrid financial instruments cease to be eligible as core tier 1 own funds.
30-06-2016 31-12-2015
Bonds 2,384,037 2,385,982
Loans 209 21,209
2,384,246 2,407,191
Interest payable 30,931 40,575
Deferred income net of charges (15,635) (18,880)
Adjustment to liabilities under hedging operations (18) 39
2,399,525 2,428,925

CGD NOTES ON THE ACCOUNTS 139
NOTES TO THE CONSOLIDATED FINANCIAL STATEMENTS
The following is a summary of the conditions attached to the main issuances:
Issuer
Bonds
Curr
ency
Valu
e o
f
issue
Book v
alu
e a
t
30-0
6-2
016
Book v
alu
e a
t
31-1
2-2
015
Date
of is
sue
Date
of
redem
ption
Inte
rest
rate
/ paym
ent
Early r
edem
ption c
lause
Caix
a G
era
l de D
epósitos
Capital C
ore
Tie
r 1 c
apital in
str
um
ents
subscribed b
y t
he
Sta
te
EU
R900.0
00
900.0
00
900.0
00
29-0
6-2
012
29-0
6-2
017
1st
year
8.5
%,
2nd y
ear
8.7
5%
, 3rd
year
9%
, 4th
year
9.5
% a
nd 5
th y
ear
10%
. H
alf
yearly inte
rest
paym
ent
on 2
9 J
une a
nd
Decem
ber.
The r
edem
ption o
ption c
an
be m
ade a
t any t
ime,
with
prior
auth
orisation o
f th
e
Bank o
f P
ort
ugal.
Caix
a G
era
l de D
epósitos
Ste
p U
p S
witchable
Subord
inate
d N
ote
s d
ue M
ay 2
019
EU
R538.5
52
536.7
50
536.7
48
11-0
5-2
009
13-0
5-2
019
12 m
onth
Euribor
rate
+
1.1
5%
. If
there
is n
o e
arly
redem
ption,
12 m
onth
Euribor
rate
+ 1
.65%
.
Annual in
tere
st
paym
ent
on
11 M
ay.
With p
rior
auth
orisation o
f
the B
ank o
f P
ort
ugal in
the
paym
ent
date
of th
e
coupons a
s fro
m 1
1 M
ay
2014.
Caix
a G
era
l de D
epósitos
Caix
a S
ubord
inadas C
GD
2008/2
018 (
1st
issue)
EU
R369.0
45
368.5
27
368.5
30
03-1
1-2
008
05-1
1-2
018
2nd y
ear,
12 m
onth
Euribor
rate
+ 0
.125%
; 3rd
year,
12
month
Euribor
rate
+
0.2
50%
, 4th
year,
12 m
onth
Euribor
rate
+ 0
.500%
and
5th
year,
12 m
onth
Euribor
rate
+ 1
.00%
. If
there
is n
o
early r
edem
ption,
12 m
onth
Euribor
rate
+ 1
.50%
.
Annual in
tere
st
paym
ent
on
3 N
ove
mber.
With p
rior
auth
orisation o
f
the B
ank o
f P
ort
ugal in
the
paym
ent
date
of th
e
coupons a
s fro
m t
he 5
th
year.
Caix
a G
era
l de D
epósitos
Flo
ating R
ate
Note
s d
ue D
ecem
ber
2017
EU
R125.0
00
125.0
00
125.0
00
27-1
2-2
007
27-1
2-2
017
5.7
33%
. If th
ere
is n
o e
arly
redem
ption,
3 m
onth
Euribor
rate
+ 1
.70%
. A
nnual
inte
rest
rate
paym
ent
on 2
7
Decem
ber.
Quart
erly inte
rest
paym
ent
on 2
7 M
arc
h,
June,
Septe
mber
and D
ecem
ber
(
if th
ere
is n
o e
arly
redem
ption).
With p
rior
auth
orisation o
f
the B
ank o
f P
ort
ugal in
the
paym
ent
date
of th
e
coupons a
s fro
m 2
7
Decem
ber
2012.
Caix
a G
era
l de D
epósitos
Flo
ating R
ate
Note
s d
ue D
ecem
ber
2017
EU
R120.0
00
104.7
20
104.7
20
17-1
2-2
007
17-1
2-2
017
3 m
onth
Euribor
rate
+
1.0
8%
. 3 m
onth
Euribor
rate
+ 1
.58%
, if
there
is n
o e
arly
redem
ption .
Quart
erly
inte
rest
paym
ent
on 1
7
Marc
h,
June,
Septe
mber
and
Decem
ber.
With p
rior
auth
orisation o
f
the B
ank o
f P
ort
ugal in
the
paym
ent
date
of th
e
coupons a
s fro
m 1
7
Decem
ber
2012.
CG
D (
Fra
nce b
ranch)
Flo
ating R
ate
Undate
d S
ubord
inate
d N
ote
sE
UR
110.0
00
209
209
18-1
2-2
002
Perp
etu
al
3 m
onth
Euribor
rate
+
1.3
0%
. 3 m
onth
Euribor
rate
+ 2
.80%
, if
there
is n
o e
arly
redem
ption.
Quart
erly
inte
rest
paym
ent
on 1
8
Marc
h,
June,
Septe
mber
and
Decem
ber.
With p
rior
auth
orisation o
f
the B
ank o
f P
ort
ugal in
the
paym
ent
date
of th
e
coupons a
s fro
m 1
8
Decem
ber
2012.

140 NOTES ON THE ACCOUNTS CGD
NOTES TO THE CONSOLIDATED FINANCIAL STATEMENTS
Issuer
Bonds
Curr
ency
Valu
e o
f
issue
Book v
alu
e a
t
30-0
6-2
016
Book v
alu
e a
t
31-1
2-2
015
Date
of is
sue
Date
of
redem
ption
Inte
rest
rate
/ paym
ent
Early r
edem
ption c
lause
Caix
a G
era
l de D
epósitos
Low
er
Tie
r 2 d
ue M
arc
h 3
, 2028
EU
R100.0
00
100.0
00
100.0
00
03-0
3-2
008
03-0
3-2
028
5.9
80%
. A
nnual in
tere
st
paym
ent
on 3
Marc
h.
N/A
.
Caix
a G
era
l de D
epósitos
Caix
a S
ubord
inadas C
GD
2007/2
017 (
2nd issue)
EU
R81.5
95
81.2
45
81.2
45
12-1
1-2
007
13-1
1-2
017
1st
year
5.0
0%
, 2nd y
ear
5.5
0%
, 3rd
year
6.0
0%
, 4th
and 5
th y
ears
7.5
0%
and
10%
, if
the w
eig
ht
of all
underlyin
g a
ssets
is o
ver
its
initia
l va
lue,
oth
erw
ise it
will
pay 0
.00%
. 3
month
Euribor
rate
+ 0
.7%
, if
there
is n
o
early r
edem
ption.
Annual
inte
rest
paym
ent
on 1
2
Nove
mber.
Quart
erly inte
rest
paym
ent
on 1
2 F
ebru
ary
,
May,
August
and N
ove
mber
(if th
ere
is n
o e
arly
redem
ption).
With p
rior
auth
orisation o
f
the B
ank o
f P
ort
ugal in
the
paym
ent
date
of th
e
coupons a
s fro
m t
he
5th
year.
Caix
a G
era
l de D
epósitos
Flo
ating R
ate
Note
s d
ue D
ecem
ber
2017
EU
R50.0
00
50.0
00
50.0
00
28-1
2-2
007
28-1
2-2
017
3 m
onth
Euribor
rate
+
1.0
8%
. 3 m
onth
Euribor
rate
+ 1
.58%
, if th
ere
is n
o e
arly
redem
ption .
Quart
erly
inte
rest
paym
ent
on 2
8
Marc
h,
June,
Septe
mber
and
Decem
ber.
With p
rior
auth
orisation o
f
the B
ank o
f P
ort
ugal in
the
paym
ent
date
of th
e
coupons a
s fro
m
28
Decem
ber
2012.
CG
D (
Fra
nce b
ranch)
Flo
ating R
ate
Note
sE
UR
21.0
00
-21.0
00
14-0
7-2
005
28-0
6-2
016
6 m
onth
Euribor
rate
+
0.2
2%
. H
alf
yearly inte
rest
paym
ent
on 2
8 J
une a
nd
Decem
ber.
N/A
.
Caix
a G
era
l de D
epósitos
Fix
ed t
o F
loating R
ate
Note
s d
ue J
uly
2017
EU
R20.0
00
--
30-0
7-2
007
31-0
7-2
017
1st
coupon 2
1.0
0%
. 3 m
onth
Euribor
rate
+ 0
.65%
, if
there
is n
o e
arly r
edem
ption.
Inte
rest
paym
ent
on 3
0 J
uly
2008.
Quart
erly inte
rest
paym
ent
on 3
0 O
cto
ber,
January
, A
pril and J
uly
(if
there
is n
o e
arly
redem
ption).
With p
rior
auth
orisation o
f
the B
ank o
f P
ort
ugal in
the
paym
ent
date
of th
e
coupons a
s fro
m 3
0 J
uly
2012.
Caix
a G
era
l de D
epósitos
Fix
ed t
o F
loating R
ate
Note
s d
ue J
uly
2017
EU
R20.0
00
--
30-0
7-2
007
31-0
7-2
017
1st
coupon 2
1.5
0%
. 3 m
onth
Euribor
rate
+ 0
.65%
, if
there
is n
o e
arly r
edem
ption.
Inte
rest
paym
ent
on 3
0 J
uly
2009.
Quart
erly inte
rest
paym
ent
on 3
0 O
cto
ber,
January
, A
pril and J
uly
(if
there
is n
o e
arly
redem
ption).
With p
rior
auth
orisation o
f
the B
ank o
f P
ort
ugal in
the
paym
ent
date
of th
e
coupons a
s fro
m 3
0 J
uly
2012.
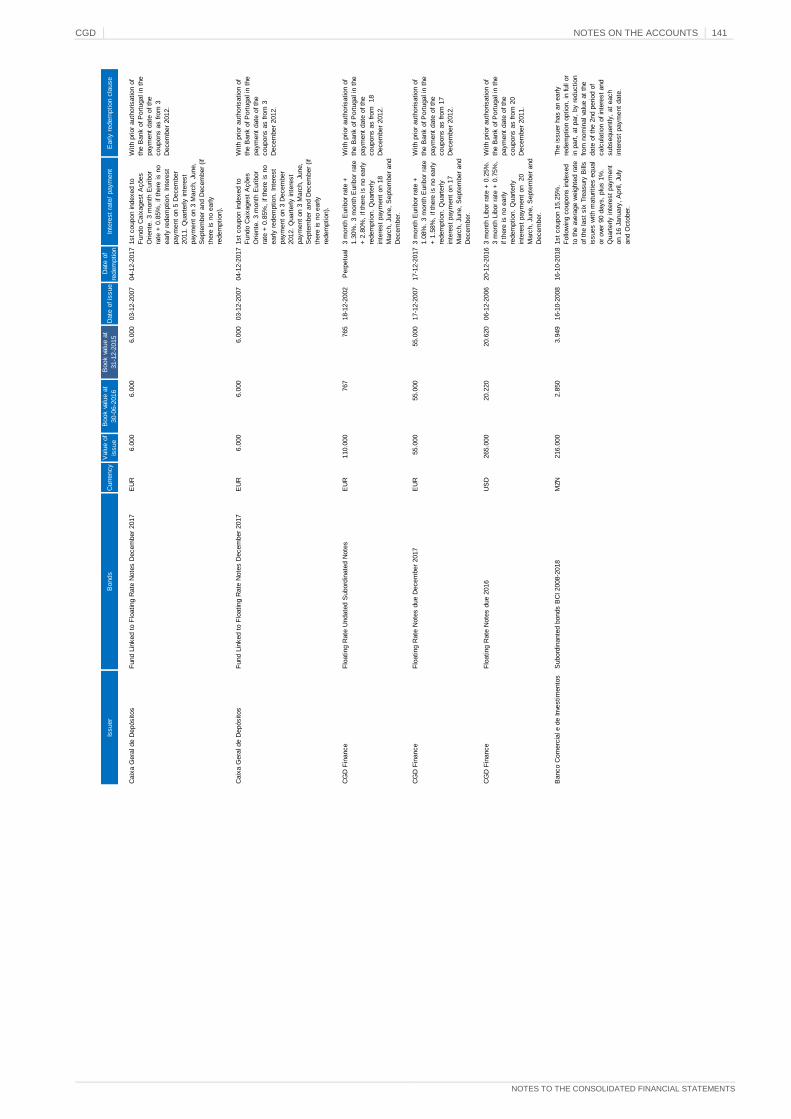
CGD NOTES ON THE ACCOUNTS 141
NOTES TO THE CONSOLIDATED FINANCIAL STATEMENTS
Issuer
Bonds
Curr
ency
Valu
e o
f
issue
Book v
alu
e a
t
30-0
6-2
016
Book v
alu
e a
t
31-1
2-2
015
Date
of is
sue
Date
of
redem
ption
Inte
rest
rate
/ paym
ent
Early r
edem
ption c
lause
Caix
a G
era
l de D
epósitos
Fund L
inked t
o F
loating R
ate
Note
s D
ecem
ber
2017
EU
R6.0
00
6.0
00
6.0
00
03-1
2-2
007
04-1
2-2
017
1st
coupon indexed t
o
Fundo C
aix
agest
Ações
Oriente
. 3 m
onth
Euribor
rate
+ 0
.85%
, if
there
is n
o
early r
edem
ption.
Inte
rest
paym
ent
on 5
Decem
ber
2011.
Quart
erly inte
rest
paym
ent
on 3
Marc
h,
June,
Septe
mber
and D
ecem
ber
(if
there
is n
o e
arly
redem
ption).
With p
rior
auth
orisation o
f
the B
ank o
f P
ort
ugal in
the
paym
ent
date
of th
e
coupons a
s fro
m 3
Decem
ber
2012.
Caix
a G
era
l de D
epósitos
Fund L
inked t
o F
loating R
ate
Note
s D
ecem
ber
2017
EU
R6.0
00
6.0
00
6.0
00
03-1
2-2
007
04-1
2-2
017
1st
coupon indexed t
o
Fundo C
aix
agest
Ações
Oriente
. 3 m
onth
Euribor
rate
+ 0
.85%
, if
there
is n
o
early r
edem
ption.
Inte
rest
paym
ent
on 3
Decem
ber
2012.
Quart
erly inte
rest
paym
ent
on 3
Marc
h,
June,
Septe
mber
and D
ecem
ber
(if
there
is n
o e
arly
redem
ption).
With p
rior
auth
orisation o
f
the B
ank o
f P
ort
ugal in
the
paym
ent
date
of th
e
coupons a
s fro
m 3
Decem
ber
2012.
CG
D F
inance
Flo
ating R
ate
Undate
d S
ubord
inate
d N
ote
sE
UR
110.0
00
767
765
18-1
2-2
002
Perp
etu
al
3 m
onth
Euribor
rate
+
1.3
0%
. 3 m
onth
Euribor
rate
+ 2
.80%
, if
there
is n
o e
arly
redem
ption.
Quart
erly
inte
rest
paym
ent
on 1
8
Marc
h,
June,
Septe
mber
and
Decem
ber.
With p
rior
auth
orisation o
f
the B
ank o
f P
ort
ugal in
the
paym
ent
date
of th
e
coupons a
s fro
m
18
Decem
ber
2012.
CG
D F
inance
Flo
ating R
ate
Note
s d
ue D
ecem
ber
2017
EU
R55.0
00
55.0
00
55.0
00
17-1
2-2
007
17-1
2-2
017
3 m
onth
Euribor
rate
+
1.0
8%
. 3 m
onth
Euribor
rate
+ 1
.58%
, if
there
is n
o e
arly
redem
ption.
Quart
erly
inte
rest
paym
ent
on 1
7
Marc
h,
June,
Septe
mber
and
Decem
ber.
With p
rior
auth
orisation o
f
the B
ank o
f P
ort
ugal in
the
paym
ent
date
of th
e
coupons a
s fro
m 1
7
Decem
ber
2012.
CG
D F
inance
Flo
ating R
ate
Note
s d
ue 2
016
US
D265.0
00
20.2
20
20.6
20
06-1
2-2
006
20-1
2-2
016
3 m
onth
Lib
or
rate
+ 0
.25%
.
3 m
onth
Lib
or
rate
+ 0
.75%
,
if th
ere
is n
o e
arly
redem
ption.
Quart
erly
inte
rest
paym
ent
on
20
Marc
h,
June,
Septe
mber
and
Decem
ber.
With p
rior
auth
orisation o
f
the B
ank o
f P
ort
ugal in
the
paym
ent
date
of th
e
coupons a
s fro
m 2
0
Decem
ber
2011.
Banco C
om
erc
ial e d
e Inve
stim
ento
sS
ubord
inante
d b
onds B
CI 2008-2
018
MZN
216.0
00
2.8
50
3.9
49
16-1
0-2
008
16-1
0-2
018
1st
coupon 1
5.2
5%
.
Follo
win
g c
oupons indexed
to t
he a
vera
ge w
eig
hte
d r
ate
of th
e last
six
Tre
asury
Bill
s
issues w
ith m
atu
rities e
qual
or
ove
r 90 d
ays,
plu
s 1
%.
Quart
erly inte
rest
paym
ent
on 1
6 J
anuary
, A
pril, J
uly
and O
cto
ber.
The issuer
has a
n e
arly
redem
ption o
ption,
in full
or
in p
art
, at
par,
by r
eduction
from
nom
inal va
lue a
t th
e
date
of th
e 2
nd p
eriod o
f
calc
ula
tion o
f in
tere
st
and
subsequently,
at
each
inte
rest
paym
ent
date
.

142 NOTES ON THE ACCOUNTS CGD
NOTES TO THE CONSOLIDATED FINANCIAL STATEMENTS
Issuer
Bonds
Curr
ency
Valu
e o
f
issue
Book v
alu
e a
t
30-0
6-2
016
Book v
alu
e a
t
31-1
2-2
015
Date
of is
sue
Date
of
redem
ption
Inte
rest
rate
/ paym
ent
Early r
edem
ption c
lause
Caix
a G
era
l de D
epósitos
Fix
ed t
o F
loating R
ate
Note
s d
ue J
uly
2017
EU
R20.0
00
--
30-0
7-2
007
31-0
7-2
017
1st
coupon 2
2.0
0%
. 3 m
onth
Euribor
rate
+ 0
.65%
, if
there
is n
o e
arly r
edem
ption.
Inte
rest
paym
ent
on 3
0 J
uly
2010.
Quart
erly inte
rest
paym
ent
on 3
0 O
cto
ber,
January
, A
pril and J
uly
(if
there
is n
o e
arly
redem
ption).
With p
rior
auth
orisation o
f
the B
ank o
f P
ort
ugal in
the
paym
ent
date
of th
e
coupons a
s fro
m 3
0 J
uly
2012.
Caix
a G
era
l de D
epósitos
Fund L
inked t
o F
loating R
ate
Note
s d
ue J
uly
2017
EU
R20.0
00
--
30-0
7-2
007
31-0
7-2
017
1st
coupon indexed t
o
Fundo C
aix
agest
Ações
Port
ugal. 3
month
Euribor
rate
+ 0
.65%
, if
there
is n
o
early r
edem
ption.
Inte
rest
paym
ent
on 3
0 J
uly
2011.
Quart
erly inte
rest
paym
ent
on 3
0 O
cto
ber,
January
,
April and J
uly
(if
there
is n
o
early r
edem
ption).
With p
rior
auth
orisation o
f
the B
ank o
f P
ort
ugal in
the
paym
ent
date
of th
e
coupons a
s fro
m 3
0 J
uly
2012.
Caix
a G
era
l de D
epósitos
Fund L
inked t
o F
loating R
ate
Note
s d
ue J
uly
2017
EU
R20.0
00
--
30-0
7-2
007
31-0
7-2
017
1st
coupon indexed t
o
Fundo C
aix
agest
Ações
Port
ugal. 3
month
Euribor
rate
+ 0
.65%
, if
there
is n
o
early r
edem
ption.
Inte
rest
paym
ent
on 3
0 J
uly
2012.
Inte
rest
paym
ent
on 3
0
Octo
ber,
January
, A
pril and
July
(if
there
is n
o e
arly
redem
tion).
With p
rior
auth
orisation o
f
the B
ank o
f P
ort
ugal in
the
paym
ent
date
of th
e
coupons a
s fro
m 3
0 J
uly
2012.
Caix
a G
era
l de D
epósitos
Fix
ed t
o F
loating R
ate
Note
s D
ecem
ber
2017
EU
R6.0
00
6.0
00
6.0
00
03-1
2-2
007
04-1
2-2
017
1st
coupon 2
2.5
0%
.3 m
onth
Euribor
rate
+ 0
.85%
, if
there
is n
o e
arly r
edem
ption.
Inte
rest
paym
ent
on 3
Decem
ber
2008.
Quart
erly
inte
rest
paym
ent
on 3
Marc
h,
June,
Septe
mber
and
Decem
ber
(if th
ere
is n
o
early r
edem
ption).
With p
rior
auth
orisation o
f
the B
ank o
f P
ort
ugal in
the
paym
ent
date
of th
e
coupons a
s fro
m 3
Decem
ber
2012.
Caix
a G
era
l de D
epósitos
Fix
ed t
o F
loating R
ate
Note
s D
ecem
ber
2017
EU
R6.0
00
6.0
00
6.0
00
03-1
2-2
007
04-1
2-2
017
1st
coupon 2
3.0
0%
. 3 m
onth
Euribor
rate
+ 0
.85%
, if
there
is n
o e
arly r
edem
ption.
Inte
rest
paym
ent
on 3
Decem
ber
2009.
Quart
erly
inte
rest
paym
ent
on 3
Marc
h,
June,
Septe
mber
and
Decem
ber
(if th
ere
is n
o
early r
edem
ption).
With p
rior
auth
orisation o
f
the B
ank o
f P
ort
ugal in
the
paym
ent
date
of th
e
coupons a
s fro
m 3
Decem
ber
2012.
Caix
a G
era
l de D
epósitos
Fix
ed t
o F
loating R
ate
Note
s D
ecem
ber
2017
EU
R6.0
00
6.0
00
6.0
00
03-1
2-2
007
04-1
2-2
017
1st
coupon 2
3.5
0%
. 3 m
onth
Euribor
rate
+ 0
.85%
, if
there
is n
o e
arly r
edem
ption.
Inte
rest
paym
ent
on 3
Decem
ber
2010.
Quart
erly
inte
rest
paym
ent
on 3
Marc
h,
June,
Septe
mber
and
Decem
ber
(if th
ere
is n
o
early r
edem
ption).
With p
rior
auth
orisation o
f
the B
ank o
f P
ort
ugal in
the
paym
ent
date
of th
e
coupons a
s fro
m 3
Decem
ber
2012.

CGD NOTES ON THE ACCOUNTS 143
NOTES TO THE CONSOLIDATED FINANCIAL STATEMENTS
Issuer
Bonds
Curr
ency
Valu
e o
f
issue
Book v
alu
e a
t
30-0
6-2
016
Book v
alu
e a
t
31-1
2-2
015
Date
of is
sue
Date
of
redem
ption
Inte
rest
rate
/ paym
ent
Early r
edem
ption c
lause
Banco C
om
erc
ial do A
tlântico
Bonds B
CA
Cre
scente
2017
CV
E500.0
00
1.3
45
1.7
94
17-1
2-2
010
17-1
2-2
017
1st
and 2
nd y
ears
5.7
5%
,
3rd
and 4
th y
ears
5.8
5%
,
5th
and 6
th y
ears
6%
and
7th
year
6.2
5%
. H
alf
yearly
inte
rest
paym
ent
on 1
7 J
une
and D
ecem
ber.
The issuer
has a
n e
arly
redem
ption o
ption a
t nom
inal
valu
e o
f outs
tandin
g d
ebt,
applic
able
as fro
m t
he 5
th
coupon,
and fro
m t
his
date
onw
ard
s,
eve
ry s
ix m
onth
s,
Banco Inte
ratlântico
Bonds B
I 2014
CV
E500.0
00
4.2
54
4.2
55
08-0
7-2
008
08-0
7-2
018
6 m
onth
Euribor
rate
+ 0
.9%
until th
e 2
nd c
oupon.
6.0
%
until Ju
ly 2
013 .
Fro
m t
his
date
on,
the r
ate
of th
e last
five y
ear
Tre
asury
Bonds
issue +
0,5
%.
Half
yearly
inte
rest
paym
ent
on 8
January
and J
uly
.
The issuer
has a
n e
arly
redem
ption o
ption a
t nom
inal
or
part
ly v
alu
e o
f th
e
outs
tandin
g d
ebt
at
the e
nd
of th
e
1st
year
and,
after
this
date
, eve
ry s
ix m
onth
s,
with a
0.5
% p
rem
ium
paym
ent
ove
r th
e n
om
inal
valu
e o
f th
e b
onds t
hat
would
Banco C
om
erc
ial e d
e Inve
stim
ento
sS
ubord
inate
d loan B
PI
US
D3.7
04
3.3
59
3.3
56
30-0
7-2
008
30-0
7-2
018
3 m
onth
Lib
or
rate
+ 3
.00%
.
Quart
erly inte
rest
paym
ent
on 3
0 J
anuary
, A
pril, J
uly
and O
cto
ber.
Early r
edem
ption o
f
princip
al, in full
or
part
, m
ay
only
occur
at
BC
I's initia
tive
and w
ith p
rior
auth
orisation
of th
e B
ank o
f M
ozam
biq
ue.

144 NOTES ON THE ACCOUNTS CGD
NOTES TO THE CONSOLIDATED FINANCIAL STATEMENTS
23. OTHER LIABILITIES
This account heading comprises the following:
The “Resources – collateral account” account heading at June 30, 2016 and December
31, 2015, included €141,009 thousand and €133,198 thousand respectively, relating to
interest rates swap (IRS) contracts deposits made in CGD by several financial
institutions.
At June 30, 2016 and December 31, 2015, the "Miscellaneous creditors - other" account
included €583,984 thousand and €644,807 thousand, respectively, in respect of financial
liabilities with minority investors in the unit trust investment funds included in CGD
group’s consolidation perimeter.
30-06-2016 31-12-2015
Creditors
Consigned resources 851,642 870,069
Suppliers of finance leasing assets 5,098 10,342
Other suppliers 27,360 63,059
Resources - collateral account 145,950 135,100
Resources - subscription account 66,198 68,668
Resources - secured account 12,298 2,264
Other creditors:
Creditors for factoring ceded 32,126 88,079
Caixa Geral de Aposentações 13,231 5,127
CGD's Pension Fund 40,967 360
Creditors for futures contracts 23,380 15,161
Other 786,913 878,528
Other liabilities:
Notes in circulation - Macau (Note 17) 838,486 790,046
Withholding taxes 48,507 43,058
Social Security contributions 14,023 11,313
Other taxes payable 8,238 5,585
Collections on behalf of third parties 103 490
Other 3,031 2,872
Accrued costs 215,882 213,803
Deferred income 67,747 61,550
Liabilities pending settlement 341,926 297,374
Stock exchange operations - 155,609
3,543,103 3,718,457

CGD NOTES ON THE ACCOUNTS 145
NOTES TO THE CONSOLIDATED FINANCIAL STATEMENTS
24. CAPITAL
At June 30, 2016 and December 31, 2015, CGD’s share capital was totally held by the
Portuguese state, as follows:
30-06-2016 31-12-2015
Number of shares 1,180,000,000 1,180,000,000
Unit price (Euros) 5 5
Share capital 5,900,000,000 5,900,000,000

146 NOTES ON THE ACCOUNTS CGD
NOTES TO THE CONSOLIDATED FINANCIAL STATEMENTS
25. RESERVES, RETAINED EARNINGS AND RESULTS ATTRIBUTABLE TO
THE SHAREHOLDER CGD
The composition of reserves and retained earnings, at June 30, 2016 and December 31,
2015, was as follows:
According to CGD’s articles of association, a minimum 20% of its annual profit must be
transferred to the legal reserve each year. This reserve may only be used to cover
accumulated losses or to increase capital.
“Other reserves and retained earnings” at June 30, 2016 and December 31, 2015,
include CGD’s legal reserves for the amount of €865,348 thousand and the legal
reserves, free reserves and legal revaluation reserves of its subsidiaries and associated
companies. The legal revaluation reserves may only be used to cover accumulated
losses or increase capital. In the case of CGD, the reserves which were not distributable
for this reason totalled €110,425 thousand in compliance with the following legislation:
The “Fair value reserve” recognises unrealised capital gains and losses on available-for-
sale financial assets and assets with repurchase agreements as a charge to
shareholders’ equity, net of the corresponding fiscal effect.
30-06-2016 31-12-2015
Fair value reserve, net of deferred tax
Available-for-sale financial assets (Note 8) 98,570 241,050
Assets with repurchase agreement 12,694 17,766
111,264 258,816
Other reserves and retained earnings
- Legal reserve - CGD 865,348 862,906
- Other reserves 499,687 1,837,725
- Retained earnings (2,278,351) (3,391,333)
(913,315) (690,702)
Net income attributable to the shareholder of CGD (205,243) (171,453)
(1,007,295) (603,339)
Tangible fixed assets
Decree-Law nº 219/82, of 2 June 1,752
Decree-Law nº 399 - G/84, of 28 December 1,219
Decree-Law nº 118 - B/86, of 27 May 2,304
Decree-Law nº 111/88, of 2 April 8,974
Decree-Law nº 49/91, of 25 January 22,880
Decree-Law nº 264/92, of 24 November 24,228
Decree-Law nº 31/98, of 11 February 48,345
Financial fixed assets 723
110,425

CGD NOTES ON THE ACCOUNTS 147
NOTES TO THE CONSOLIDATED FINANCIAL STATEMENTS
The currency translation reserve, which recognises the effect of translating subsidiaries’
financial statements expressed in foreign currency, is included in “Other reserves”.
The net contribution to CGD's consolidated profit made by branches and subsidiaries, at
June 30, 2016 and 2015, was as follows:
30-06-2016 30-06-2015
Caixa Geral de Depósitos, S.A.
Caixa Geral de Depósitos (327,549) (66,710)
France Branch 55,296 17,988
London Branch 2,486 3,361
New York Branch 1,850 2,156
East Timor Branch 1,818 1,218
Spain Branch (1,136) (29,927)
Luxembourg Branch (911) (806)
Cayman Branch 579 (11,185)
Macau Branch 143 236
Zhuhai Branch (38) (91)
(267,462) (83,763)

148 NOTES ON THE ACCOUNTS CGD
NOTES TO THE CONSOLIDATED FINANCIAL STATEMENTS
30-06-2016 30-06-2015
Contribution to net income
Subsidiaries:
Banco Nacional Ultramarino, S.A. (Macau) 30,972 28,453
Caixa – Banco de Investimento, S.A. (a) (24,231) 3,082
Caixa Seguros e Saúde, SGPS, S.A. (a) 10,675 27,748
Banco Caixa Geral, S.A. 10,489 15,611
Fundimo - Fundo de Investimento Imobiliário Aberto (7,227) 5,128
Banco Caixa Geral Angola, S.A. 6,912 10,637
Caixa Leasing e Factoring – Instituição Financeira de Crédito, S.A. 6,858 2,931
Banco Comercial e de Investimentos, S.A.R.L. 6,675 8,642
Mercantile Bank Holdings, Ltd. 4,585 4,840
Inmobiliaria Caixa Geral, S.A.U. (3,655) (4,493)
Parcaixa, SGPS, S.A. (a) 3,619 2,539
Fundo de Capital de Risco – Grupo CGD Caixa Capital 2,575 2,888
Caixagest Imobiliário Internacional - Fundo Especial de Investimento 2,095 11,273
Caixa Imobiliário, S.A. 2,020 (7,793)
Caixagest Infra-Estruturas - Fundo Especial de Investimento 1,456 4,317
Beirafundo - Fundo de Investimento Imobiliário Fechado (1,378) (4,021)
Banco Caixa Geral Brasil, S.A. 1,197 707
Partang, SGPS (1,008) (999)
Fundger - Sociedade Gestora de Fundos de Investimento Imobiliário, S.A. 1,000 1,364
CGD Pensões, S.A. 957 1,153
Imocaixa - Gestão Imobiliária, S.A. (949) (1,862)
Fundiestamo - Fundo de Investimento Imobiliário Fechado 781 1,570
Cibergradual, Investimento Imobiliário, S.A. (747) (5,173)
Caixagest - Técnicas de Gestão de Fundos, S.A. 731 1,286
Caixagest Private Equity - Fundo Especial de Investimento 713 17,273
Ibéria - Fundo Especial de Investimento Imobiliário Fechado (688) 186
Fundo de Investimento Imobiliário de Arrendamento Habitacional - Cidades de Portugal 645 (187)
Fundo de Capital de Risco Empreender Mais (573) 935
Fundo de Capital de Risco Caixa Fundos (561) 520
Fundolis - Fundo de Investimento Imobiliário Fechado (476) (236)
Banco Comercial do Atlântico, S.A.R.L. 419 1,009
CGD Investimentos CVC, S.A. 288 (2,558)
Caixa Imobiliário - Fundo Investimento Imobiliário Fechado para Arrendamento Habitacional (258) (307)
Other (345) (956)
53,567 125,508
Associates and jointly controlled entities:
SIBS – Sociedade Interbancária de Serviços, S.A. 6,468 683
Locarent, S.A. 1,449 1,149
Fundo Turismo 325 294
Esegur – Empresa de Segurança, S.A. 230 292
Torre Ocidente, Imobiliária S.A. - 2,315
Other 180 582
8,651 5,315
Consolidated net income attributable to the shareholder of CGD (205,243) 47,061
(a) Data taken from the consolidated f inancial statements.

CGD NOTES ON THE ACCOUNTS 149
NOTES TO THE CONSOLIDATED FINANCIAL STATEMENTS
Appropriation of net income for year
2015
A resolution was passed by the general meeting of shareholders, held in May 2016, to
recognise the amount of €12,211 thousand in losses, made in 2015, in the form of the
incorporation of €2,442 thousand in the legal reserve and €9,769 thousand in “Other
reserves and retained earnings”
2014
A resolution was passed by the general meeting of shareholders, held in May 2015, to
include €1,139,320 thousand in losses, made in 2014, in the “Other reserves and
retained earnings” balance sheet account heading.
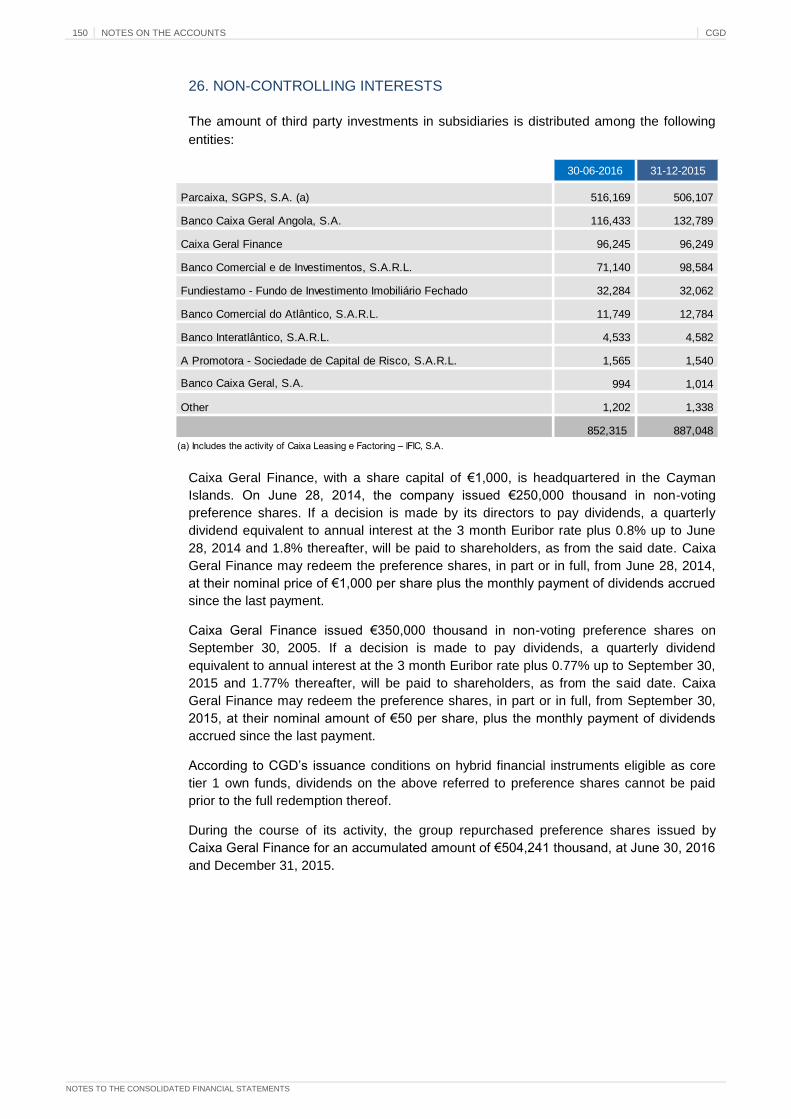
150 NOTES ON THE ACCOUNTS CGD
NOTES TO THE CONSOLIDATED FINANCIAL STATEMENTS
26. NON-CONTROLLING INTERESTS
The amount of third party investments in subsidiaries is distributed among the following
entities:
Caixa Geral Finance, with a share capital of €1,000, is headquartered in the Cayman
Islands. On June 28, 2014, the company issued €250,000 thousand in non-voting
preference shares. If a decision is made by its directors to pay dividends, a quarterly
dividend equivalent to annual interest at the 3 month Euribor rate plus 0.8% up to June
28, 2014 and 1.8% thereafter, will be paid to shareholders, as from the said date. Caixa
Geral Finance may redeem the preference shares, in part or in full, from June 28, 2014,
at their nominal price of €1,000 per share plus the monthly payment of dividends accrued
since the last payment.
Caixa Geral Finance issued €350,000 thousand in non-voting preference shares on
September 30, 2005. If a decision is made to pay dividends, a quarterly dividend
equivalent to annual interest at the 3 month Euribor rate plus 0.77% up to September 30,
2015 and 1.77% thereafter, will be paid to shareholders, as from the said date. Caixa
Geral Finance may redeem the preference shares, in part or in full, from September 30,
2015, at their nominal amount of €50 per share, plus the monthly payment of dividends
accrued since the last payment.
According to CGD’s issuance conditions on hybrid financial instruments eligible as core
tier 1 own funds, dividends on the above referred to preference shares cannot be paid
prior to the full redemption thereof.
During the course of its activity, the group repurchased preference shares issued by
Caixa Geral Finance for an accumulated amount of €504,241 thousand, at June 30, 2016
and December 31, 2015.
30-06-2016 31-12-2015
Parcaixa, SGPS, S.A. (a) 516,169 506,107
Banco Caixa Geral Angola, S.A. 116,433 132,789
Caixa Geral Finance 96,245 96,249
Banco Comercial e de Investimentos, S.A.R.L. 71,140 98,584
Fundiestamo - Fundo de Investimento Imobiliário Fechado 32,284 32,062
Banco Comercial do Atlântico, S.A.R.L. 11,749 12,784
Banco Interatlântico, S.A.R.L. 4,533 4,582
A Promotora - Sociedade de Capital de Risco, S.A.R.L. 1,565 1,540
Banco Caixa Geral, S.A. 994 1,014
Other 1,202 1,338
852,315 887,048
(a) Includes the activity of Caixa Leasing e Factoring – IFIC, S.A.

CGD NOTES ON THE ACCOUNTS 151
NOTES TO THE CONSOLIDATED FINANCIAL STATEMENTS
Information on the amount of consolidated profit attributable to non-controlling interest
shareholders, in June 30, 2016 and 2015, is set out below:
30-06-2016 30-06-2015
Banco Caixa Geral Angola, S.A. 6,641 30,438
Banco Comercial e de Investimentos, S.A.R.L. 6,129 9,175
Parcaixa, SGPS, S.A. (a) 11,467 7,011
Banco Comercial do Atlântico, S.A.R.L. 304 734
Fundiestamo - Fundo de Investimento Imobiliário Fechado 221 255
Other (93) (795)
24,670 46,817
(a) Includes the activity of Caixa Leasing e Factoring – IFIC, S.A.

152 NOTES ON THE ACCOUNTS CGD
NOTES TO THE CONSOLIDATED FINANCIAL STATEMENTS
27. INTEREST AND INCOME AND INTEREST AND SIMILAR COSTS
Information on the composition of these account headings is set out below:
30-06-2016 30-06-2015
Interest and similar income
Interest on loans and advances to domestic credit institutions 2,438 1,829
Interest on loans and advances to foreign credit institutions 19,638 16,903
Interest on domestic credit 438,627 504,263
Interest on foreign credit 314,381 311,440
Interest on overdue credit 17,726 14,818
Interest on financial assets held for trade
- Derivatives 275,540 315,433
- Securities 9,037 8,378
Interest on financial assets at fair value through profit or loss 185 411
Interest on available-for-sale financial assets 159,974 191,018
Interest on hedging derivatives 6,432 7,157
Interest on debtors and other investments 3,520 3,979
Interest on cash equivalents 1,117 2,863
Interest on other loans and other amounts receivable 60,887 71,895
Other interest and similar income 1,776 2,075
Commissions received relating to amortised cost 66,853 67,518
1,378,132 1,519,979
Interest and similar costs
Interest on deposits of
- Central and local government 228 1,494
- Other residents 182,846 274,747
- Emigrants 11,933 17,560
- Other non-residents 135,280 145,442
- Other 61 250
Interest on resources of foreign credit institutions 17,539 15,656
Interest on resources of domestic credit institutions 10,074 7,032
Interest on swaps 289,183 317,535
Interest on other trading liabilities 3,231 3,097
Interest on unsubordinated debt securities 85,655 127,734
Interest on hedging derivatives 918 1,196
Interest on subordinated liabilities 54,761 56,338
Other interest and similar costs 9,816 9,786
Commissions paid relating to amortised cost 7,911 3,248
809,435 981,115

CGD NOTES ON THE ACCOUNTS 153
NOTES TO THE CONSOLIDATED FINANCIAL STATEMENTS
The "Interest and similar costs - interest on subordinated liabilities" account at June 30,
2016 and 2015 included €40,411 thousand and €40,059 thousand, respectively, on
CGD's issuance of a total amount of €900 million in hybrid financial instruments, eligible
as core tier 1 own funds, on June 29, 2012. These securities were fully subscribed for by
the Portuguese state (note 22).

154 NOTES ON THE ACCOUNTS CGD
NOTES TO THE CONSOLIDATED FINANCIAL STATEMENTS
28. INCOME FROM EQUITY INSTRUMENTS
This account heading comprises the following:
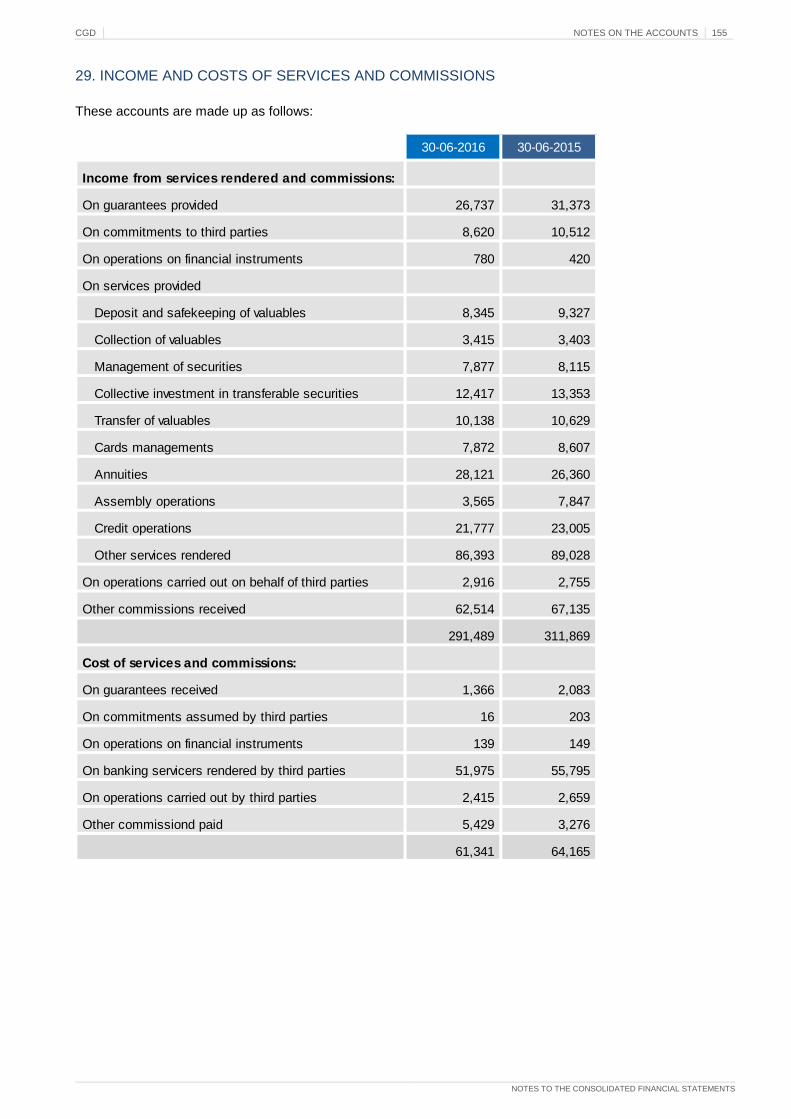
CGD NOTES ON THE ACCOUNTS 155
NOTES TO THE CONSOLIDATED FINANCIAL STATEMENTS
29. INCOME AND COSTS OF SERVICES AND COMMISSIONS
These accounts are made up as follows:
30-06-2016 30-06-2015
Income from services rendered and commissions:
On guarantees provided 26,737 31,373
On commitments to third parties 8,620 10,512
On operations on financial instruments 780 420
On services provided
Deposit and safekeeping of valuables 8,345 9,327
Collection of valuables 3,415 3,403
Management of securities 7,877 8,115
Collective investment in transferable securities 12,417 13,353
Transfer of valuables 10,138 10,629
Cards managements 7,872 8,607
Annuities 28,121 26,360
Assembly operations 3,565 7,847
Credit operations 21,777 23,005
Other services rendered 86,393 89,028
On operations carried out on behalf of third parties 2,916 2,755
Other commissions received 62,514 67,135
291,489 311,869
Cost of services and commissions:
On guarantees received 1,366 2,083
On commitments assumed by third parties 16 203
On operations on financial instruments 139 149
On banking servicers rendered by third parties 51,975 55,795
On operations carried out by third parties 2,415 2,659
Other commissiond paid 5,429 3,276
61,341 64,165

156 NOTES ON THE ACCOUNTS CGD
NOTES TO THE CONSOLIDATED FINANCIAL STATEMENTS
30. INCOME FROM FINANCIAL OPERATIONS
Information on the composition of these account headings is set out below:
30-06-2016 30-06-2015
Result from foreign exchange operations:
Revaluation of foreign exchange position 47,293 27,863
Results from currency derivatives (50,255) 4,781
(2,962) 32,644
Result from financial assets and liabilities held for trading:
Securities:
Debt instruments 151 (2,434)
Equity instruments (2,976) 1,502
Other instruments 1,110 (6)
(1,715) (938)
Derivatives:
Interest rate (223,558) 101,611
Shares and indexes 9,910 (2,172)
Credit default 339 297
Other 50,888 25,240
(162,421) 124,975
(164,136) 124,037

CGD NOTES ON THE ACCOUNTS 157
NOTES TO THE CONSOLIDATED FINANCIAL STATEMENTS
The "Other” account heading at June 30, 2016 and 2015, includes €3,945 thousand and
€23,463 thousand, respectively, in respect of the results of minority investors in the unit
trust investment funds included in CGD group’s consolidation perimeter.
During the course of the half year ended June 30, 2016, the group disposed of a total
amount of approximately €59,865 thousand in loans and advances to companies, in its
“Corporates” portfolio, excluding asset lending operations. These transactions resulted in
losses of €46 thousand in the referred to period.
(cont) 30-06-2016 30-06-2015
Result from other financial assets at fair value through profit or loss:
Debt instruments 818 35
Equity instruments 4,499 4,062
Other securities 6,844 28,099
Loans and other amounts receivable - 239
12,161 32,436
Result from the sale of loans and advances to customers - (46)
Result from available-for-sale financial assets:
Debt instruments 13,712 130,780
Equity instruments
VISA Europe Limited (Note 8) 38,941 -
Finangeste, S.A. (Note 8) - (931)
Other (2,329) (33)
36,613 (964)
50,325 129,816
Other securities 19,136 1,856
69,461 131,671
Result of hedging operations:
Hedging derivatives (20,785) (20,149)
Value adjustments of hedged assets and liabilities 20,328 21,431
(457) 1,282
Other
Results in the repurchase of liabilities issued 43,778 3,913
Other (5,264) (23,948)
38,515 (20,035)
(47,418) 301,989

158 NOTES ON THE ACCOUNTS CGD
NOTES TO THE CONSOLIDATED FINANCIAL STATEMENTS
31. OTHER OPERATING INCOME
Information on the composition of these account headings is set out below:
The resolution fund, created by decree law 31-A/2012 of February 10, introduced a
resolution regime in the general credit institutions and financial companies regime
approved by decree law 298/92 of December 31.
The measures provided for in the new regime have been designed, as the case may be,
to recover or prepare the orderly liquidation of credit institutions and certain investment
companies in financial distress. They comprise three intervention stages by the Bank of
Portugal, in the form of corrective intervention, provisional administration and resolution.
30-06-2016 30-06-2015
Other operating income:
Rendering of services 21,961 20,458
Expense reimbursement 4,715 3,982
Lease income under operating lease agreements 26,191 27,776
Gains on non-financial assets:
- Non-current assets held for sale 12,871 12,167
- Other tangible assets 296 178
- Investment property 13,978 3,600
- Other 311 196
Secondment of employees to Caixa Geral de Aposentações 1,266 1,630
Sale of cheques 5,012 5,747
Other 23,272 27,024
109,871 102,758
Other operating costs:
Donations and subscriptions 1,780 3,972
Losses on non-financial assets:
- Non-current assets held for sale 28,468 20,874
- Other tangible assets 232 16
- Investment property 37,417 13,322
- Other 31 68
Other taxes 15,391 15,082
Contribution to the Deposit Guarantee Fund 2,425 4,945
Contribution to the Resolution Fund 34,934 5,581
Administrative expenditure of the Unified Council Resolution 270 103
Fines and penalties 146 291
Other 15,185 16,087
136,279 80,340
(26,407) 22,418

CGD NOTES ON THE ACCOUNTS 159
NOTES TO THE CONSOLIDATED FINANCIAL STATEMENTS
The resolution fund's main mission, herein, is to provide financial support to the
application of the resolution mechanisms adopted by the Bank of Portugal.
As a result of the transposition of the bank recovery and resolution directive (2014/59/EU)
into domestic legislation, a common resolution regime in the European Union was
introduced. It provides for the losses deriving from the bankruptcy processes of banking
institutions to be internalised by their shareholders and creditors. It will be financed by
mandatory contributions to be paid over to the single resolution fund.
The group’s contributions to the single European resolution fund, in first half 2016,
amounted to €31,965 thousand, of which €27,391 thousand in cash and €4,574 thousand
in the form of an irrevocable commitment, comprising a surety for the said purpose (note
17), which component part of the contribution was not recognised as a cost for the period.
The group made a periodic contribution of €7,543 thousand and €5,581 thousand to the
domestic resolution fund, at June 30, 2016 and 2015.

160 NOTES ON THE ACCOUNTS CGD
NOTES TO THE CONSOLIDATED FINANCIAL STATEMENTS
32. EMPLOYEE COSTS
This account heading comprises the following:
With the aim of reducing operating costs and adjusting CGD’s structure and resources to
its present and future business dimension, the executive committee approved the
corporate Horizonte plan in 2015, designed to create new opportunities for its employees’
voluntary redundancies.
The Horizonte plan aims to reduce the workforce on the basis of voluntary early
retirements. The process is already available to all workers who have reached the age of
55 by December 31, 2016.
During the course of first half 2016, CGD posted a €20,000 thousand increase in
employee costs as “Provisions for agreements to suspend labour agreements” under this
plan. The increase was the result of an analysis of eligible workers based on the
advantages of the exit of each employee.
30-06-2016 30-06-2015
Remuneration of management and supervisory bodies 6,774 7,670
Remuneration of staff 276,883 273,824
283,658 281,494
Other charges relating to remuneration 18,296 20,424
Healthcare - CGD
- Normal cost 10,587 11,843
- Contributions relating to current staff 9,602 9,689
Pension liability - CGD
- Normal cost 35,164 37,348
- Retirements before the normal retirement age 1,854 -
Other pension costs 1,456 1,434
Other mandatory social charges 5,950 6,823
82,909 87,562
Other staff costs 7,962 7,967
374,528 377,023

CGD NOTES ON THE ACCOUNTS 161
NOTES TO THE CONSOLIDATED FINANCIAL STATEMENTS
The average number of employees in Caixa and its subsidiaries, for the half years ended
June 30, 2016 and 2015, by type of function, was as follows:
At June 30, 2016, this list includes workers agreeing to the Horizonte plan, who will be
leaving Caixa by the end of 2016.
These numbers, at June 30, 2016 and 2015, did not include employees belonging to the
Caixa Geral de Aposentações support department (237 and 249 respectively),
employees assigned to CGD’s social services (45 and 65, respectively) and other
situations i.e. secondments or extended absences (136 and 135 respectively).
30-06-2016 30-06-2015
Senior management 551 559
Management 2,930 2,859
Technical staff 5,413 5,238
Administrative staff 6,784 6,826
Auxiliary 323 326
16,001 15,808
Number of employees at the end of the period 16,061 16,135

162 NOTES ON THE ACCOUNTS CGD
NOTES TO THE CONSOLIDATED FINANCIAL STATEMENTS
33. OTHER ADMINISTRATIVE EXPENSES
This account heading comprises the following:
30-06-2016 30-06-2015
Specialised services
- IT services 37,341 41,493
- Safety and security 5,670 6,596
- Information services 3,429 3,957
- Cleaning 3,921 3,895
- Contracts and service fees 1,855 2,549
- Studies and consultancy 1,651 1,716
- Other 49,284 39,725
Leases 34,765 36,517
Communications and postage 16,346 19,531
Maintenance and repairs 17,964 17,634
Advertising and publications 10,862 12,451
Water, energy and fuel 10,686 11,543
Transport of cash and other values 5,585 6,337
Travel, lodging and representation expenses 5,184 5,846
Standard forms and office supplies 3,595 4,432
Other 8,560 9,314
216,700 223,536

CGD NOTES ON THE ACCOUNTS 163
NOTES TO THE CONSOLIDATED FINANCIAL STATEMENTS
34. IMPAIRMENT OF ASSETS
Information on impairment movements for the half years ended June 30, 2016 and 2015
is set out below:
Balances at
31-12-2015
Addition and
reversalsWrite-offs
Exchange
differences
Transfers and
other
Balances at
30-06-2016
Credit recovery,
interest and
expenses
Impairment of loans and advances to customers (Note 12) 5,197,706 312,653 (100,972) (10,093) (9,448) 5,389,846 (10,131)
Impairment of loans and advances to credit institutions (Note 6) 11,394 (2,369) (3,643) - 1,743 7,125
Impairment of available-for-sale financial assets (Note 8)
Equity instruments 112,532 32 - (46) - 112,518
Debt instruments 1,029 489 - 105 (839) 784
Other instruments 247,138 32,466 (12,497) (1,357) 5,000 270,751
Impairment of financial assets with repurchase agreement (Note 9) - - - - 967 967
Impairment of other tangible assets 13,597 2,122 - - 7 15,726
Impairment of intangible assets 20,639 - - - - 20,639
Impairment of non-current assets held for sale (Note 13)
Properties 409,788 (13,172) (5,695) (32) (24,044) 366,846
Equipment 1,721 83 (495) - - 1,308
Impairment of other assets (Note 17) 245,760 23,673 (996) (1,065) 47,905 315,277
1,063,598 43,324 (23,326) (2,394) 30,739 1,111,941 -
6,261,304 355,977 (124,298) (12,486) 21,291 6,501,787 (10,131)
Balances at
31-12-2014
Addition and
reversalsWrite-offs
Exchange
differences
Transfers and
other
Balances at
30-06-2015
Credit recovery,
interest and
expenses
Impairment of loans and advances to customers 5,230,292 247,681 (267,949) 6,508 (572) 5,215,960 (11,919)
Impairment of loans and advances to credit institutions 11,817 (321) - - - 11,497
Impairment of available-for-sale financial assets
Equity instruments 108,408 4,652 (1,845) 175 - 111,390
Debt instruments 668 7 (22) - - 653
Other instruments 204,547 29,596 - 7,232 - 241,375
Impairment of other tangible assets 11,502 186 - - (186) 11,502
Impairment of intangible assets 20,401 - - - 238 20,639
Impairment of non-current assets held for sale
Properties 373,411 12,070 (1,666) (9) (147) 383,659
Equipment 2,687 (33) (915) - (43) 1,696
Impairment of other assets 235,456 19,411 (3,582) (216) 102 251,170
968,896 65,568 (8,030) 7,182 (36) 1,033,580 -
6,199,188 313,249 (275,979) 13,690 (608) 6,249,539 (11,919)

164 NOTES ON THE ACCOUNTS CGD
NOTES TO THE CONSOLIDATED FINANCIAL STATEMENTS
35. SEGMENT REPORTING
The group adopted the following business segments to comply with IFRS 8 requirements
and to assess own funds requirements on operational risk, using the standard method
under the Bank of Portugal’s official notice 9/2007 of 18/04/2007:
- Trading and sales: comprising banking activity related to the management of the
own securities portfolio, management of issuance of debt instruments, money
and foreign exchange markets operations, repo type operations, securities
lending operations and wholesale brokerage. Investments in and claims at other
credit institutions and derivatives are also included in this segment;
- Retail banking: comprising banking operations with individual customers, the self-
employed and micro-enterprises. This segment also includes consumer finance,
mortgage lending, credit cards and deposits taken from individual customers;
- Commercial banking: including lending operations and resource-taking from
major enterprises and SMEs. This segment includes loans, current accounts,
investment project finance, bills discounting operations, venture capital, factoring,
equipment and property leasing, syndicated loans underwriting and loans to the
public sector;
- Asset management: including activities associated with the management of
customer portfolios, the management of open-ended or closed end unit trust and
property funds and discretionary wealth management funds;
- Corporate finance: including activities related with acquisitions, mergers,
restructuring operations, privatisations, subscriptions for and placements of
securities (primary market), securitisations, preparation and organisation of
syndicated loans (merchant banking – loan placements), investment
management, market and corporate financial analyses and advisory services;
- Other: including all operating segments not described in the preceding business
segments.
Information on the appropriation of income and main balance sheet aggregates, by
business segments and geographies, at June 30, 2016 and in 2015, is given below:
Business segments
30-06-2016
Trading and
salesRetail banking
Commercial
banking
Asset
management
Corporate
FinanceOther Total
Net interest income 255,267 262,630 32,783 2,645 13,044 2,328 568,697
Income from equity instruments 11,599 123 1,634 14,362 282 1,640 29,640
Income from services rendered and commissions 11,385 91,668 42,751 16,701 22,515 106,469 291,489
Cost of services and commissions (5,465) (1,130) (2,909) (3,820) (271) (47,746) (61,341)
Results from financial operations (57,603) 417 1,707 1,697 2,852 3,512 (47,418)
Other net operating income (9,175) (11,998) (9,596) (460) 22,125 (17,303) (26,407)
Net operating income from banking and insurance operations 206,008 341,710 66,370 31,125 60,547 48,900 754,660
Other costs and income (959,903)
Net income attributable to the shareholder of CGD (205,243)
Cash balances and loans and advances to credit institutions (net) 4,942,487 152,291 34,200 9,080 - 6,578 5,144,636
Investments in securities and derivatives (net) 19,348,832 170,760 446,397 521,876 247,885 272,530 21,008,280
Loans and advances to customers (net) 1,040,688 32,593,074 30,440,111 225,075 615,742 16,399 64,931,089
Total net assets 26,477,049 33,173,573 31,396,631 1,891,848 906,348 5,509,488 99,354,937
Resources of central banks and credit institutions 4,920,550 191,549 531,066 111,786 - 13,651 5,768,602
Customer resources 966,096 54,770,470 16,049,388 194,064 444,114 17,681 72,441,813
Debt securities 6,081,160 - 35,712 - - - 6,116,872

CGD NOTES ON THE ACCOUNTS 165
NOTES TO THE CONSOLIDATED FINANCIAL STATEMENTS
Geographies
The "Other” column includes balances between group companies, cancelled out in the
consolidation process.
31-12-2015
Trading and
salesRetail banking
Commercial
banking
Asset
management
Corporate
FinanceOther Total
Net interest income 408,033 530,621 133,381 2,859 35,903 2,851 1,113,648
Income from equity instruments 10,369 2 18,671 41,465 415 3,345 74,267
Income from services rendered and commissions 33,772 184,116 119,239 39,658 44,501 220,665 641,952
Cost of services and commissions (6,210) (3,564) (4,819) (6,496) (331) (109,037) (130,456)
Results from financial operations 366,531 (4,662) 3,434 30,485 (54,531) 8,754 350,011
Other net operating income (9,493) 445 (1,137) 20,609 (6,064) (11,770) (7,410)
Net operating income from banking and insurance operations 803,003 706,958 268,769 128,579 19,894 114,809 2,042,012
Other costs and income (2,213,465)
Net income attributable to the shareholder of CGD (171,453)
Cash balances and loans and advances to credit institutions (net) 7,191,656 424,005 33,070 8,205 - 7,388 7,664,323
Investments in securities and derivatives (net) 18,598,963 143,077 384,110 573,441 140,186 274,176 20,113,953
Loans and advances to customers (net) 1,330,698 33,696,896 30,144,052 185,354 377,754 24,278 65,759,033
Total net assets 28,343,933 34,052,694 30,861,456 1,877,648 579,081 5,186,655 100,901,467
Resources of central banks and credit institutions 4,575,989 172,168 463,292 92,232 - 129,388 5,433,070
Customer resources 1,179,471 54,112,569 17,714,553 156,922 239,542 23,207 73,426,265
Debt securities 6,663,564 268 36,249 - - - 6,700,081
Portugal
Rest of
European
Union
North America Latin America Asia Africa Other Total
Net interest income 294,494 95,436 5,242 13,758 47,343 115,492 (3,067) 568,697
Income from equity instruments 80,640 3,158 - - 108 13,224 (67,490) 29,640
Income from services rendered and commissions 225,718 24,078 545 2,290 19,400 38,353 (18,895) 291,489
Cost of services and commissions (60,395) (5,435) (47) (107) (8,444) (8,076) 21,162 (61,341)
Results from financial operations (115,538) 48,324 (44) (3,636) 2,055 20,087 1,334 (47,418)
Other net operating income (11,343) (10,613) (38) (200) 348 3,588 (8,148) (26,407)
Net operating income from banking and insurance operations 413,576 154,948 5,657 12,104 60,810 182,669 (75,104) 754,660
Other costs and income (959,903)
Net income attributable to the shareholder of CGD (205,243)
Cash balances and loans and advances to credit institutions (net) 10,608,487 2,135,371 1,885,670 205,321 4,270,823 1,165,571 (15,126,607) 5,144,636
Investments in securities and derivatives (net) 22,948,569 1,677,660 137,356 197,090 428,323 1,218,576 (5,599,296) 21,008,280
Loans and advances to customers (net) 50,852,894 11,990,463 560,413 215,289 3,064,273 2,688,066 (4,440,309) 64,931,089
Total net assets 97,181,567 16,212,473 2,583,858 663,951 8,624,718 5,617,489 (31,529,118) 99,354,937
Resources of central banks and credit institutions 9,836,065 5,858,908 2,181,674 326,452 297,930 228,378 (12,960,804) 5,768,602
Customer resources 57,913,734 5,224,395 515,277 164,619 6,864,245 4,197,452 (2,437,909) 72,441,813
Debt securities 5,955,990 4,455,569 - - - 35,712 (4,330,399) 6,116,872
30-06-2016
Portugal
Rest of
European
Union
North America Latin America Asia Africa Other Total
Net interest income 567,469 205,872 9,131 31,239 87,131 216,093 (3,286) 1,113,648
Income from equity instruments 507,951 5,250 - - 147 21,162 (460,244) 74,267
Income from services rendered and commissions 496,276 47,767 764 5,499 41,155 100,622 (50,131) 641,952
Cost of services and commissions (130,609) (16,566) (82) (636) (17,390) (18,436) 53,262 (130,456)
Results from financial operations 284,433 20,646 8 (9,729) 9,420 91,401 (46,168) 350,011
Other net operating income 265,013 (3,261) 32 (1,322) 1,413 14,588 (283,873) (7,410)
Net operating income from banking and insurance operations 1,990,533 259,708 9,853 25,051 121,875 425,431 (790,440) 2,042,012
Other costs and income (2,213,465)
Net income attributable to the shareholder of CGD (171,453)
Cash balances and loans and advances to credit institutions (net) 13,344,605 3,321,639 1,945,634 133,100 4,348,713 1,490,911 (16,920,279) 7,664,323
Investments in securities and derivatives (net) 22,351,100 1,600,863 136,379 133,326 196,297 1,252,464 (5,556,477) 20,113,953
Loans and advances to customers (net) 49,873,513 12,126,239 582,097 175,372 3,078,773 2,875,970 (2,952,931) 65,759,033
Total net assets 97,856,791 17,389,971 2,664,568 500,674 8,432,383 6,172,878 (32,115,798) 100,901,467
Resources of central banks and credit institutions 10,624,810 6,696,936 2,211,298 182,815 230,653 310,954 (14,824,396) 5,433,070
Customer resources 58,365,352 5,344,561 572,656 172,162 6,789,070 4,576,583 (2,394,120) 73,426,265
Debt securities 6,417,077 4,670,423 - - - 54,352 (4,441,771) 6,700,081
31-12-2015

166 NOTES ON THE ACCOUNTS CGD
NOTES TO THE CONSOLIDATED FINANCIAL STATEMENTS
The following is a breakdown of the contribution to the group’s income by business area,
based on internal management criteria, for the half years ended June 30, 2016 and 2015:
The "Other” column includes balances between group companies eliminated in the
consolidation process. As regards business segments reference should also be made to
the effects of the group’s property activities.
Banking
business in
Portugal
International
business
Investment
bankingInsurance Other Total
Interest and similar income 999,611 498,034 81,927 - (201,440) 1,378,132
Interest and similar costs (736,146) (221,277) (70,436) - 218,425 (809,435)
Income from equity instruments 781 3,468 1,985 - 23,407 29,640
Net interest income 264,245 280,225 13,476 - 40,392 598,337
Income from services rendered and commissions 186,818 84,666 20,308 - (304) 291,489
Cost of services and commissions (37,956) (21,594) (3,546) - 1,756 (61,341)
Results from financial operations (87,039) 67,053 (30,568) - 3,136 (47,418)
Other net operating income (12,770) (6,916) (565) 36 (6,192) (26,407)
Net operating income 49,052 123,209 (14,371) 36 (1,604) 156,322
NET OPERATING INCOME FROM BANKING 313,298 403,434 (896) 36 38,788 754,660
Other costs and income (640,846) (286,230) (21,070) 10,639 (22,396) (959,903)
NET INCOME ATTRIBUTABLE TO THE SHAREHOLDER OF CGD (327,549) 117,203 (21,965) 10,675 16,392 (205,243)
30-06-2016
Banking
business in
Portugal
International
business
Investment
bankingInsurance Other Total
Interest and similar income 1,138,514 525,383 89,167 - (233,085) 1,519,979
Interest and similar costs (911,457) (247,099) (74,939) - 252,381 (981,115)
Income from equity instruments 10,664 4,838 3,345 - 24,341 43,188
Net interest income 237,722 283,121 17,573 - 43,637 582,052
Income from services rendered and commissions 196,463 92,817 23,178 - (590) 311,869
Cost of services and commissions (39,829) (22,807) (3,505) - 1,975 (64,165)
Results from financial operations 229,927 66,347 2,347 - 3,368 301,989
Other net operating income 17,503 3,435 941 12 526 22,418
Net operating income 404,064 139,793 22,962 12 5,279 572,111
NET OPERATING INCOME FROM BANKING 641,786 422,914 40,534 12 48,916 1,154,163
Other costs and income (708,496) (378,216) (33,210) 27,736 (14,916) (1,107,102)
NET INCOME ATTRIBUTABLE TO THE SHAREHOLDER OF CGD (66,710) 44,698 7,325 27,748 34,001 47,061
30-06-2015

CGD NOTES ON THE ACCOUNTS 167
NOTES TO THE CONSOLIDATED FINANCIAL STATEMENTS
36. DISCLOSURES RELATING TO FINANCIAL INSTRUMENTS
Credit risk
Maximum exposure to credit risk
The following is a breakdown of the group’s maximum exposure to credit risk at June 30,
2016 and December 31, 2015:
30-06-2016 31-12-2015
Trading securities
Public debt 4,058,765 908,167
Private debt 7,936 17,136
4,066,700 925,303
Financial assets at fair value through profit or loss
Private debt 3,322 6,681
3,322 6,681
Available-for-sale financial assets
Public debt 7,456,888 10,256,470
Private debt 4,334,116 3,922,330
11,791,004 14,178,801
Held-to-maturity investments
Public debt 233,619 -
Private debt 4,231 -
237,850 -
Financial assets with repurchase agreement
Public debt 368,732 294,968
Private debt 134,193 367,332
Credit and securities 352,666 418,866
855,591 1,081,166
16,954,468 16,191,950
Derivatives 1,930,135 1,625,723
Cash balances at other credit institutions 440,187 773,163
Loans and advances to credit institutions 3,204,237 4,013,842
Loans and advances to customers 65,020,010 65,850,180
Other debtors 3,138,615 2,658,818
Other operations pending settlement 573,362 176,278
74,306,547 75,098,004
Other commitments
Personal/Institutional guarantees given:
Guarantees and sureties 3,685,997 3,637,077
Stand-by letters of credit 74,368 57,816
Open documentary credits 361,550 502,154
Forward deposit agreements - 85,618
Irrevocable lines of credit 1,170,729 1,273,964
Securities subscription 1,703,304 1,654,834
Other irrevocable commitments 79,167 2,230
Credit default swaps 72,059 73,482
7,147,175 7,287,175
Maximum exposure to credit risk 98,408,190 98,577,129

168 NOTES ON THE ACCOUNTS CGD
NOTES TO THE CONSOLIDATED FINANCIAL STATEMENTS
Exposure to the sovereign debt of peripheral Eurozone countries
Information on the main characteristics of these issuances within Caixa group at June 30,
2016 and December 31, 2015, is set out below:
The evolution of these markets also reflects the consequences of the serious liquidity
crisis and, in general, high levels of insecurity regarding risk perception associated with
sovereign debt issuances in this economic space and particularly so in the case of
countries with European Central Bank, International Monetary Fund and European Union
bail-out programmes (Greece and Ireland in 2010 and Portugal in 2011).
Measurement criteria
The sovereign debt issuances of the peripheral Eurozone countries considered in the
above table were measured at observable market prices, when applicable or prices
supplied by external counterparties in the absence of an active market. At June 30, 2016
and December 31, 2015, these portfolios were segmented into levels 1 and 2 of the fair
2016 after 2016 no maturity Total
Financial assets at fair value trough profit or loss
Portugal - 1,687,923 - 1,687,923 1,687,923 - -
Greece - - - - - - -
Ireland - - - - - - -
Spain 359,313 726,744 - 1,086,057 1,086,057 - -
Italy 266,158 921,814 - 1,187,972 1,187,972 - -
625,470 3,336,481 - 3,961,951 3,961,951 - -
Financial assets at fair value through revaluation reserves
Portugal 1,997,214 4,182,077 665 6,179,957 6,179,957 - (79,929)
Greece - 4,078 - 4,078 4,078 - (2,266)
Ireland - - - - - - -
Spain 1,309 205,739 - 207,048 207,048 - 6,664
Italy - 302,393 - 302,393 302,393 - 4,806
1,998,523 4,694,287 665 6,693,475 6,693,475 - (70,725)
Total
Portugal 1,997,214 5,869,999 665 7,867,879 7,867,879 - (79,929) BB+
Greece - 4,078 - 4,078 4,078 - (2,266) CCC
Ireland - - - - - - -
Spain 360,622 932,483 - 1,293,104 1,293,104 - 6,664 BB+
Italy 266,158 1,224,207 - 1,490,365 1,490,365 - 4,806 BBB+
2,623,993 8,030,768 665 10,655,426 10,655,426 - (70,725)
Fair valueAccumulated
impairmentFair value reserve Rating
Book value net of impairment at 30-06-2016
Residual maturities
Book value net of impairment at 31-12-2015
Residual maturities
2016 after 2016 no maturity Total
Financial assets at fair value trough profit or loss
Portugal - 11,127 - 11,127 11,127 - -
Greece - - - - - - -
Ireland - - - - - - -
Spain 459,189 304 - 459,493 459,493 - -
Italy 250,054 329 - 250,383 250,383 - -
709,242 11,760 - 721,003 721,003 - -
Financial assets at fair value through revaluation reserves
Portugal 4,969,137 3,957,676 689 8,927,501 8,927,501 - 15,751
Greece - 4,013 - 4,013 4,013 - (2,395)
Ireland - - - - - - -
Spain 1,309 183,901 - 185,210 185,210 - 3,524
Italy - 66,007 - 66,007 66,007 - 3,079
4,970,446 4,211,596 689 9,182,730 9,182,730 - 19,959
Total
Portugal 4,969,137 3,968,803 689 8,938,628 8,938,628 - 15,751 BB
Greece - 4,013 - 4,013 4,013 - (2,395) CCC
Ireland - - - - - - -
Spain 460,498 184,205 - 644,703 644,703 - 3,524 BBB
Italy 250,054 66,336 - 316,389 316,389 - 3,079 BBB
5,679,688 4,223,356 689 9,903,733 9,903,733 - 19,959
Accumulated
impairmentFair value reserve RatingFair value

CGD NOTES ON THE ACCOUNTS 169
NOTES TO THE CONSOLIDATED FINANCIAL STATEMENTS
value ranking. Greater detail on the distinguishing elements of these categories along
with the main presuppositions used are given in “Fair value”.
Exposures affected by the period of turbulence
Information on the composition of the group’s available-for-sale assets portfolio, at June
30, 2016 and December 31, 2015, which included securities particularly affected by the
period of financial turbulence, is set out below:
Information on movements on such securities for the half years ended June 30, 2016 and
2015 is set out below:
“Capital gains/ (losses) recognised as a charge to profit and loss” include accrued interest
and proceeds from foreign exchange revaluations.
Quality of loans and advances to customers
The disclosures on asset quality and credit risk management required by Bank of
Portugal circular 2/2014 are set out below.
1. Credit risk management policy
1.1 Credit risk management
To provide for diverse legal and regulatory requirements and with the objective of using
best credit risk management practice, Caixa Geral de Depósitos (CGD) has implemented
a credit risk management process encompassing the different funding stages:
TYPE Rating (a)Seniority level of
the tranche held
Geographical area
of the issuer
Book value (net
of impairment)
Fair value
reserve
Book value (net
of impairment)
Fair value
reserve
Available-for-sale financial assets
Residential mortgage-backed securities A- to A+ Senior European Union 1,408 (359) 1,533 (384)
Senior European Union 26,203 (2,485) 28,694 (2,618)
Mezzanine European Union 660 (1,707) 908 (1,457)
28,271 (4,551) 31,135 (4,459)
(a) Presentation of securities conducted in accordance w ith information about the ratings available on 30-06-2016, w ith the exception of alienated species w hose information provided should be
referenced 31-12-2015.
Lower than A-
30-06-2016 31-12-2015
Available-for-sale financial assets
Residential mortgage-backed securities
A- to A+ Senior European Union 1,533 (147) (2) 25 1,408
Senior European Union 28,694 (2,689) 65 133 26,203
Mezzanine European Union 908 - 2 (250) 660
31,135 (2,837) 65 (92) 28,271
(a) Presentation of securities conducted in accordance w ith information about the ratings available on 30-06-2016, w ith the exception of alienated species w hose information provided should be referenced 31-12-2015.
Rating (a)Seniority level of
the tranche held
Geographical area
of the issuer
Lower than A-
Book value
(net) at
31-12-2015
Sales and
amortisations
Impact on results
for the period
Change in the
fair value
reserve
Book value
(net) at
30-06-2016
Available-for-sale financial assets
Residential mortgage-backed securities
A- to A+ Senior European Union 4,146 (2,487) 409 (385) 1,683
Senior European Union 33,098 (1,278) 45 111 31,976
Mezzanine European Union 5,436 - 10 (445) 5,001
CCC Mezzanine European Union 688 - 6 274 968
43,369 (3,765) 470 (446) 39,627
(a) Presentation of securities conducted in accordance w ith information about the ratings available on 30-06-2015, w ith the exception of alienated species w hose information provided should be referenced 31-12-2014.
Change in the
fair value
reserve
Book value
(net) at
30-06-2015
Sales and
amortisations
Impact on results
for the period
Lower than A-
Book value
(net) at
31-12-2014
Rating (a)Seniority level of
the tranche held
Geographical area
of the issuer

170 NOTES ON THE ACCOUNTS CGD
NOTES TO THE CONSOLIDATED FINANCIAL STATEMENTS
1.1.1 Issuance of loans
Lending activity is performed in such a way as to comply with the credit risk management
strategy and policy defined by CGD’s competent bodies.
Credit risk assessment in the retail segment is based on the use of statistical risk
assessment tools (scoring and rating models), a collection of internal regulations which
establishes objective criteria to be complied with on lending operations and the
delegation of competencies in accordance with the ratings allocated to customers.
Credit risk appraisals in the corporate segment, in addition to the use of internal rating
models, may also be subject to individual analysis by a team of analysts as defined in an
internal regulation.
1.1.2 Credit portfolio oversight
Credit portfolio oversight enables potential default situations to be identified.
A new credit oversight and recovery policy was approved in 2015, in articulation with the
implementation of a totally computerised workflow across commercial and credit recovery
and oversight activities, with the following objectives:
i) To classify the credit portfolio based on events’ levels of severity:
a. Customers with performing credit
b. Customers with warning signs
c. Customers in financial distress
d. Customers in default, and
e. Quarantined customers;
ii) Transfers of customers between commercial and credit recovery and oversight
areas;
iii) Definition of measures to be taken based on a customer’s classification;
iv) Monitoring by the Risk Management division for the purpose of diagnosis and
introduction of procedural improvements.
1.1.3 Credit recovery
As soon as any arrears have been noted, adequate steps are taken to recover the
overdue credit to enable a settlement of the situation, in due compliance with the
dispositions of decree law 227/2012 – PARI (“Action Plan for the Risk of Default”) and
PERSI (“Extrajudicial Procedure for the Settlement of Situations of Default”) as regards
loans and advances to individual customers.
The credit recovery process was revised in line with the new credit monitoring and
recovery process, based on the greater harmonisation of operating procedures using the
workflow tool implemented in 2015.
1.2 Concentration risk management
Credit concentration risk management within CGD group is the responsibility of the Risk
Management division (DGR) which identifies, measures and controls significant
exposures.
Decisions to enter into agreements for operations entailing materially relevant exposures
(as defined in an internal regulation) require the opinion of DGR. The limit naturally
includes the amount of CGD group’s total exposure to a relevant customer and/or group
of customers.

CGD NOTES ON THE ACCOUNTS 171
NOTES TO THE CONSOLIDATED FINANCIAL STATEMENTS
2. Loan write-off policy
The decision to write-off a loan from assets is taken at a senior level when any amount
remains unpaid, following all of the legal proceedings with the parties involved in a loan
agreement.
3. Impairment reversal policy
The quantification of impairment losses is conditioned by the identification of events
which indicate a deterioration of the counterparty’s creditworthiness when having an
impact on the credit’s future cash flows.
In situations showing significant improvements in the creditworthiness of debtors and/or
an adequate strengthening of real guarantees, a previously recognised loss is reduced to
the level of the new calculated loss, resulting in a direct reversal of impairment.
A reversal of impairment is also recognised in situations in which the loans are sold for a
higher amount than net impairment exposure.
4. Description of the restructuring measures applied and respective associated risks, in
addition to their respective control and monitoring mechanisms
A credit restructuring operation is defined as any change to the conditions in force on
operations involving loans and advances to customers in financial distress when resulting
in a modification to the parties’ rights or duties.
Specialised oversight and recovery areas endeavour to apply the best solutions to protect
CGD group’s interests pursuant to the terms of the delegated decision and the limits
defined in an internal regulation for each specific situation.
The application of the recovery solutions always bears in mind a customer’s individual
circumstances and the best interests of the customer and CGD.
Most loans are subject to specific treatment for impairment calculation purposes, across
the whole of the period of surveillance defined in the referred to instruction.
5. Description of assessment and collateral management process
Property
The main components of the valuation methodology on property within CGD group are:
i. Examination of property: the property is inspected when all new mortgage lending
operations are entered into, with the objective of assessing the presumable
transaction price in a free market;
The value of a property asset is documented and includes, inter alia, copies of the
plans, property registration booklet and its description in the land registry, when
supplied. These valuations are complemented by direct observation in situ;
ii. Revision of the valuation of the property by an expert appraiser: mortgage lending
operations whose contractual terms have been changed usually require a new
valuation which is performed as if they were new operations, this procedure is also
used for operations in default, deriving from a request made by the credit recovery
areas.
Property valuation procedures:
iii. CGD’s property valuation area has engineers and architects with significant
experience in the valuations area. Those with technical approval functions have
complementary training in the form of CMVM certified property valuation courses;

172 NOTES ON THE ACCOUNTS CGD
NOTES TO THE CONSOLIDATED FINANCIAL STATEMENTS
iv. CGD has a network of external service providers in its property valuation area
comprising around 100 external corporate and individual appraisers, spread out over
the whole of the country based on the area in which they perform their professional
activity. There are several appraisers for each municipal district to ensure adequate
diversification and rotation;
v. Valuation requests are sent to CGD in digital format together with the essential
documentation for property valuation purposes. An internal technical operative is
responsible for the approval process by type of valuation and the municipal district in
which the property is located;
vi. The appraisers are set out on a list defining the priority municipal districts for
operational purposes, based on criteria of efficiency in terms of travel and in-depth
knowledge of the local market. Requests for appraisals are delivered to appraisers
via CGD’s property portal. The appraiser records the date of the visit and appraisal
report in the portal in a standardised format which includes the relevant documents
for the valuation and photographs of the property.
Other collateral
In addition to property the following collateral is eligible for the purpose of mitigating the
calculation of credit impairment:
Pledges over term deposits – assessed on the amount of the pledge;
Pledges over bonds issued by CGD – assessed on the nominal value of the
bonds;
Pledges over listed shares – assessed at market value at the calculation’s
reference date.
6. Type of principal judgments, estimates and hypotheses used to assess impairment
The credit impairment model used in CGD encompasses loans and advances to
companies and to individual customers and includes the provision of bank guarantees
and irrevocable lines of credit.
The following concepts are used to calculate credit impairment:
i) Individual impairment based on an assessment of customers with individually
significant exposures by filling in an impairment form and discounting the
estimated future cash flows at the agreement’s original interest rate;
ii) Collective or parametric impairment is automatically assessed by the credit
impairment model. The parametric calculation is performed by dividing the
portfolio into risk sub-segments which include assets with similar risk
characteristics.
7. Description of impairment calculation methodologies, including the way in which
portfolios are segmented to reflect the different characteristics of the loans
The credit impairment model assesses each operation’s risk profile which it classifies in
the credit portfolio sub-segments defined on the basis of the historical valuation of
portfolios and the operation’s current and past performance.
The purpose of the loan, type of collateral and sector of economic activity are also
considered for the purposes of this segmentation.

CGD NOTES ON THE ACCOUNTS 173
NOTES TO THE CONSOLIDATED FINANCIAL STATEMENTS
8. Indication of signs of impairment by credit segments
Performing credit
No signs of loss at the time of the analysis.
Performing credit with signs of impairment – with at least one of the following signs of
loss:
Amounts overdue to CGD for less than 90 days;
Bank of Portugal indicators (amounts overdue for more than 30 days to other
credit institutions, barring from the use of cheques);
Cheques returned to CGD;
Individual assessments made by customer accounts – only for credit to other
than non-individual customers;
Identification of debts to the tax authorities and social security services based on
a quarterly analysis by customer account managers only for credit to other than
non-individual customers;
A 20% decrease in the amount of a real guarantee when this results in an LTV of
more than 80% (applicable to property projects);
Interim grace periods;
Insolvency procedures (e.g. PER - special recovery programme) other than a
declaration of insolvency;
Credit contamination, based on signs of losses on other operations involving the
same customer.
Restructured credit for customers in financial distress
Lifetime default probability curves specifically estimated for the sub segments
defined in the credit impairment model for the respective operations applied to
loans which have been restructured owing to financial difficulties as described in
item 4.
Credit in default – the following loss events are considered:
Contractual defaults to CGD group, particularly credit more than 90 days overdue,
provided that the materiality limits in force have been complied with;
Existence of an impairment provision resulting from an individual analysis of
customers with individually significant exposures;
Declarations of insolvency;
Operations at a pre-legal/legal stage in CGD;
Contamination of credit, only for credit other than to individual customers based
on the identification of loss events on other operations involving the same
customer;
Restructured operations owing to a customer’s financial difficulties when in
arrears for more than 30 days or with significant value losses or with second
restructuring processes during the quarantine period defined in Bank of Portugal
instruction 32/2013 (this criterion was considered for reporting purposes).

174 NOTES ON THE ACCOUNTS CGD
NOTES TO THE CONSOLIDATED FINANCIAL STATEMENTS
9. Indication of thresholds defined for an individual analysis
The definition of limits for individual impairment assessments within CGD group, set out
in an internal regulation, takes the specifications of the diverse credit portfolios into
account.
10. Policy relating to internal risk levels, specifying the treatment afforded to a borrower
classified as being in default
Pursuant to internal regulation, customers entering into a default situation are allocated to
specialised credit oversight and recovery areas. The allocation decision may be made by
the Credit Oversight Delegate board (CDAC).
Based on an analysis, the recovery solution considered to be the most adequate to the
customer’s and CGD’s interests is applied.
11. General description of the form of calculating the present value of future cash flows
for individual and collective impairment loss assessments
Individual assessment
The assessment of future cash flows expected on loans considers to what extent the
customer will generate the cash flow for debt payment purposes. A loan’s recoverable
amount is the sum of the expected future cash flows, estimated in accordance with the
contractual terms in force (maturity, interest rate, repayment method, etc.), discounted at
the agreement’s original effective interest rate.
In situations of customers with signs of loss an assessment is made to evaluate whether
the expected cash flows are less than the contractual cash flows. The amount of the
impairment in such cases is consequently adjusted.
Collective impairment
The assessment of cash flow on the collective impairment model is based on the
contractual cash flow and the risk factors applicable to the operation.
Expected future cash flows are latterly revised at the operation’s original effective interest
rate to assess its respective present value.
12. Description of the emergent period used for the different segments and justification
of its adequacy
For credit without any observable signs of impairment, is provided for provisions to be set
up on IBNR losses.
Based on this definition, the calculation of impairment is contingent upon the definition of
an emergence period, which is the period of time between the occurrence and
observation of the event loss, which may be broken down into a period of the appearance
of the information and a later time when the signs are identified. The emergence period
has currently been set at 12 months.
The use of the emergence period in CGD is based on the use of diverse early warning
signs designed to identify, as soon as possible, any potential deterioration of a
customer’s creditworthiness which could lead to losses.
The following tables provide information on the loans and advances to customers
portfolio and property received in kind or repossessed, based on the contents applicable
to the group’s activity:

CGD NOTES ON THE ACCOUNTS 175
NOTES TO THE CONSOLIDATED FINANCIAL STATEMENTS
a) Details of exposures and impairment by segment
b) Details of credit portfolio by segment and year of production
Exposure in 30-06-2016 Impairment in 30-06-2016
Non-performing loans
Which of:
cured
Which of:
restrutured
Which of:
restrutured
Segment
Government 5,381,419 240,692 495,759 117,474 45,081 5,498,893 3,431 19,791 23,223
Corporate 15,622,690 157,191 1,045,112 2,448,170 1,075,003 18,070,860 215,699 1,459,189 1,674,888
Construction and real estate (CRE) 6,638,243 196,604 639,294 4,048,548 2,309,757 10,686,791 177,617 2,141,681 2,319,298
Households - Housing 30,388,608 171,732 573,932 2,116,067 506,857 32,504,675 90,147 726,524 816,671
Households - Consumption and other purposes 2,232,838 21,136 78,931 660,304 409,598 2,893,142 40,346 385,484 425,831
Other 643,837 42,443 35,009 375,405 60,684 1,019,242 6,224 123,712 129,936
60,907,634 829,799 2,868,036 9,765,968 4,406,981 70,673,602 533,464 4,856,382 5,389,846
Performing loans
TotalPerforming
loans
Non-performing
loansTotal
Exposure in 31-12-2015 Impairment in 31-12-2015
Non-performing loans
Which of:
cured
Which of:
restrutured
Which of:
restrutured
Segment
Government 5,368,097 10,496 491,022 93,825 36,061 5,461,922 2,051 3,154 5,205
Corporate 15,042,118 137,698 1,198,706 2,281,186 1,041,370 17,323,303 248,936 1,282,407 1,531,343
Construction and real estate (CRE) 7,251,569 234,397 581,728 4,159,634 2,329,005 11,411,204 238,801 2,064,196 2,302,997
Households - Housing 30,854,250 193,158 632,912 2,141,132 477,887 32,995,381 96,622 716,507 813,128
Households - Consumption and other purposes 2,412,370 36,017 63,237 645,654 389,354 3,058,024 53,195 363,853 417,048
Other 772,172 40,814 39,236 353,599 40,933 1,125,771 14,520 113,465 127,985
61,700,576 652,580 3,006,841 9,675,029 4,314,611 71,375,604 654,125 4,543,582 5,197,706
Performing loans
TotalPerforming
loans
Non-performing
loansTotal
Exposure in 30-06-2016 Impairment in 30-06-2016
Performing loans Non-performing loans
Days past due < 30 days Days late due Days late due Days late due
Without
evidence With evidence <=90 (*) >90 (*) <30
between 30 -
90<=90 (*) >90 (*)
Segment
Government 4,114,851 1,266,261 5,381,419 20,350 97,124 117,474 5,498,893 3,425 6 - 19,791 23,223
Corporate 14,447,755 904,379 15,622,690 1,024,058 1,424,112 2,448,170 18,070,860 196,898 18,801 642,932 816,257 1,674,888
Construction and real estate (CRE) 5,996,419 579,026 6,638,243 1,049,774 2,998,774 4,048,548 10,686,791 151,698 25,919 530,460 1,611,222 2,319,298
Households - Housing 28,870,405 1,262,610 30,388,608 159,658 1,956,408 2,116,067 32,504,675 69,366 20,781 31,313 695,211 816,671
Households - Consumption and other purposes 2,079,545 108,858 2,232,838 348,642 311,662 660,304 2,893,142 33,876 6,470 177,300 208,184 425,831
Other 634,354 3,008 643,837 51,136 324,269 375,405 1,019,242 5,409 815 20,494 103,218 129,936
56,143,328 4,124,141 60,907,634 2,653,618 7,112,350 9,765,968 70,673,602 460,673 72,791 1,402,499 3,453,883 5,389,846
Total
impairment
Non-performing loansPerforming loans
Sub-total Total exposure
Exposure in 31-12-2015 Impairment in 31-12-2015
Performing loans Non-performing loans Performing loans Non-performing loans
Days past due < 30 days Days late due Days late due Days late due
Without
evidence With evidence <=90 (*) >90 (*) <30
between 30 -
90<=90 (*) >90 (*)
Segment
Government 4,350,299 1,017,791 5,368,097 38,100 55,725 93,825 5,461,922 1,854 197 - 3,154 5,205
Corporate 14,076,362 925,123 15,042,118 983,121 1,298,064 2,281,186 17,323,303 235,709 13,227 473,779 808,628 1,531,343
Construction and real estate (CRE) 6,312,958 911,298 7,251,569 1,171,072 2,988,562 4,159,634 11,411,204 221,017 17,785 515,340 1,548,855 2,302,997
Households - Housing 29,207,558 1,419,565 30,854,250 147,415 1,993,716 2,141,132 32,995,381 80,012 16,610 27,732 688,774 813,128
Households - Consumption and other purposes 2,242,137 152,255 2,412,370 372,065 273,589 645,654 3,058,024 44,880 8,315 179,743 184,109 417,048
Other 758,287 13,329 772,172 30,697 322,901 353,599 1,125,771 14,343 177 11,753 101,712 127,985
56,947,600 4,439,361 61,700,576 2,742,471 6,932,557 9,675,029 71,375,604 597,814 56,310 1,208,348 3,335,234 5,197,706
Total
impairment
(*)Credit installments of principal and accrued interest less than 90 days, but about w hich there is evidence to justify its classif ication as non-performing loans, particularly bankruptcy, the debtor's liquidation or individual impairment allocation, among others.
Sub-total Total exposure
Government Corporate Construction and real estate (CRE) Households - HousingHouseholds - Consumption and other
purposesOther financial institutions Total
Number of
operationsAmount Impairment
Number of
operationsAmount Impairment
Number of
operationsAmount Impairment
Number of
operationsAmount Impairment
Number of
operationsAmount Impairment
Number of
operationsAmount Impairment
Number of
operationsAmount Impairment
Year of production
2004 and before 1,420 626,885 276 12,100 672,331 117,778 3,365 724,166 180,315 343,619 9,151,590 315,909 14,576 78,226 24,948 26 28,145 328 375,106 11,281,343 639,555
2005 223 88,029 2,506 1,231 143,975 15,256 580 172,040 38,239 48,713 2,567,397 77,080 34,277 86,373 12,205 11 32,889 28 85,035 3,090,703 145,313
2006 176 87,319 735 3,539 280,381 52,624 1,238 665,246 190,121 45,835 2,780,809 80,684 117,315 155,984 21,216 15 38,311 1,902 168,118 4,008,050 347,283
2007 139 222,489 1,799 5,300 510,004 124,558 2,142 973,595 421,017 55,086 3,311,532 121,832 35,618 127,775 33,382 64 365,875 94,063 98,349 5,511,270 796,650
2008 109 324,540 12,943 4,999 1,152,126 139,582 1,974 1,181,547 258,384 47,042 2,907,988 83,220 36,679 115,788 30,520 59 10,202 1,509 90,862 5,692,192 526,158
2009 105 348,605 557 5,285 636,963 99,645 1,787 1,166,482 130,230 42,160 3,023,572 51,313 44,232 131,984 27,289 58 6,863 1,328 93,627 5,314,469 310,362
2010 104 411,214 825 6,751 575,919 100,426 2,064 642,836 91,104 33,342 2,719,425 39,229 52,587 191,823 28,290 62 2,973 846 94,910 4,544,189 260,720
2011 52 176,470 4 6,161 774,521 99,170 1,740 447,229 98,354 16,860 1,357,382 13,511 49,301 223,605 23,650 74 7,107 181 74,188 2,986,313 234,869
2012 85 268,547 124 7,163 792,132 77,955 1,698 641,274 187,132 8,296 696,957 7,025 56,073 516,275 161,511 74 46,035 1,056 73,389 2,961,220 434,803
2013 117 175,141 700 11,186 1,286,461 120,769 2,342 977,557 252,023 9,198 789,102 5,055 135,165 240,935 14,073 84 65,355 16,107 158,092 3,534,551 408,727
2014 109 1,213,934 184 14,414 1,756,777 109,145 2,859 1,185,603 248,847 11,249 1,069,756 5,287 84,056 314,505 15,077 122 308,291 5,280 112,809 5,848,865 383,819
2015 146 394,082 2,532 20,278 4,625,497 498,258 3,827 845,331 69,643 17,381 1,395,929 9,964 109,052 456,266 21,415 139 80,397 6,775 150,823 7,797,502 608,588
2016 186 1,161,637 39 34,998 4,863,775 119,723 8,092 1,063,886 153,888 9,601 733,235 6,562 212,048 253,602 12,255 324 26,800 532 265,249 8,102,934 293,000
2,971 5,498,893 23,223 133,405 18,070,860 1,674,888 33,708 10,686,791 2,319,298 688,382 32,504,675 816,671 980,979 2,893,142 425,831 1,112 1,019,242 129,936 1,840,557 70,673,602 5,389,846

176 NOTES ON THE ACCOUNTS CGD
NOTES TO THE CONSOLIDATED FINANCIAL STATEMENTS
c) Details of gross credit exposure and individually and collectively recognised
impairment by segment, sector (Code of Economic Activities) and geography
30-06-2016
Government CorporateConstruction and real estate
(CRE)Households - Housing Consumer and other purposes Other financial institutions
Exposure Impairment Exposure Impairment Exposure Impairment Exposure Impairment Exposure Impairment Exposure Impairment Exposure Impairment
Avaliation
Individual 132,644 20,566 3,287,602 1,096,137 4,319,595 1,928,881 106,813 4,125 431,315 199,002 408,418 122,704 8,686,387 3,371,415
Collective 5,366,249 2,656 14,783,258 578,751 6,367,196 390,418 32,397,861 812,546 2,461,826 226,829 610,824 7,232 61,987,215 2,018,432
5,498,893 23,223 18,070,860 1,674,888 10,686,791 2,319,298 32,504,675 816,671 2,893,142 425,831 1,019,242 129,936 70,673,602 5,389,846
Total
31-12-2015
Government CorporateConstruction and real estate
(CRE)Households - Housing Consumer and other purposes Other financial institutions
Exposure Impairment Exposure Impairment Exposure Impairment Exposure Impairment Exposure Impairment Exposure Impairment Exposure Impairment
Avaliation
Individual 41,955 2,966 3,093,889 915,039 4,359,610 1,818,215 198,507 4,292 448,788 189,709 452,615 120,757 8,595,363 3,050,978
Collective 5,419,967 2,239 14,229,414 616,303 7,051,594 484,783 32,796,874 808,836 2,609,235 227,339 673,156 7,228 62,780,241 2,146,728
5,461,922 5,205 17,323,303 1,531,343 11,411,204 2,302,997 32,995,381 813,128 3,058,024 417,048 1,125,771 127,985 71,375,604 5,197,706
Total
30-06-2016
Government Households and Corporate Total
Individual Collective Individual Collective Individual Collective
Exposure Impairment Exposure Impairment Exposure Impairment Exposure Impairment Exposure Impairment Exposure Impairment
Activity sector
Construction and real estate (CRE) 77,862 18,260 33,139 1,669 4,319,595 1,928,881 6,367,196 390,418 4,397,457 1,947,141 6,400,335 392,086
Agriculture, forestry and fishing - - 19 - 127,613 26,699 450,583 15,974 127,613 26,699 450,603 15,974
Mining and quarrying - - - - 7,429 1,919 88,537 4,748 7,429 1,919 88,537 4,748
Manufacturing - - 1,374 5 898,729 492,452 3,113,481 145,745 898,729 492,452 3,114,855 145,750
Electricity, gas, steam and air conditioning supply - - 25,244 2 178,971 7,124 740,006 4,227 178,971 7,124 765,250 4,230
Water supply - - - - 59,688 18,492 372,619 4,491 59,688 18,492 372,619 4,491
Wholesale and retail trade - - 1,593 11 467,468 130,545 2,772,487 214,647 467,468 130,545 2,774,081 214,658
Transport and storage - - 10,769 20 350,932 90,087 789,667 22,018 350,932 90,087 800,436 22,038
Accommodation and food service activities - - - - 96,370 13,616 956,850 31,063 96,370 13,616 956,850 31,063
Information and communication - - 13,674 93 100,971 10,812 284,304 14,196 100,971 10,812 297,979 14,289
Professional, scientific and technical activities 13,499 675 2,327,500 196 594,015 242,670 2,941,700 66,150 607,514 243,345 5,269,199 66,345
Administrative and support service activities - - 13,532 120 103,139 21,270 312,713 18,077 103,139 21,270 326,245 18,197
Public administration and defence, compulsory social security 26,671 - 2,866,829 141 982 67 9,516 120 27,654 67 2,876,345 261
Education - - 14,654 38 23,895 2,017 129,440 6,779 23,895 2,017 144,094 6,817
Human health services and social work activities - - 6,673 138 65,156 3,632 275,019 12,218 65,156 3,632 281,692 12,356
Arts, entertainment and recreation 371 74 767 6 62,864 8,541 109,701 6,977 63,235 8,615 110,467 6,983
Other services 14,241 1,557 50,482 219 148,908 26,358 930,792 10,921 163,149 27,914 981,274 11,140
Other financial activities - - - - 408,890 122,542 1,116,667 7,630 408,890 122,542 1,116,667 7,630
Households - housing - - - - 106,813 4,125 32,397,861 812,546 106,813 4,125 32,397,861 812,546
Households - other - - - - 431,315 199,002 2,461,826 226,829 431,315 199,002 2,461,826 226,829
132,644 20,566 5,366,249 2,656 8,553,743 3,350,848 56,620,966 2,015,775 8,686,387 3,371,415 61,987,215 2,018,432
31-12-2015
Government Households and Corporate Total
Individual Collective Individual Collective Individual Collective
Exposure Impairment Exposure Impairment Exposure Impairment Exposure Impairment Exposure Impairment Exposure Impairment
Activity sector
Construction and real estate (CRE) - - 39,546 781 4,359,610 1,818,215 7,051,594 484,783 4,359,610 1,818,215 7,091,140 485,564
Agriculture, forestry and fishing - - 348 - 121,576 26,337 383,413 13,041 121,576 26,337 383,761 13,041
Mining and quarrying - - - - 15,079 1,919 95,173 4,502 15,079 1,919 95,173 4,502
Manufacturing - - 1,447 5 854,497 329,712 2,840,740 167,018 854,497 329,712 2,842,187 167,022
Electricity, gas, steam and air conditioning supply - - - - 161,405 5,383 838,688 4,988 161,405 5,383 838,688 4,988
Water supply - - 25,606 8 58,339 18,336 392,737 3,626 58,339 18,336 418,342 3,634
Wholesale and retail trade - - 2,065 11 499,120 142,375 2,635,042 222,371 499,120 142,375 2,637,107 222,382
Transport and storage - - 17,843 190 383,814 78,174 785,264 21,765 383,814 78,174 803,107 21,955
Accommodation and food service activities - - - - 104,282 17,750 909,010 34,046 104,282 17,750 909,010 34,046
Information and communication - - 9,281 76 90,624 13,814 208,570 12,603 90,624 13,814 217,851 12,679
Professional, scientific and technical activities - - 1,033,943 319 111,014 24,641 485,109 24,661 111,014 24,641 1,519,052 24,981
Administrative and support service activities - - 35,484 145 90,375 20,321 307,166 18,066 90,375 20,321 342,650 18,211
Public administration and defence, compulsory social security 27,713 - 2,884,205 95 1,364 49 8,083 46 29,076 49 2,892,288 141
Education - - 13,441 44 20,648 2,124 131,757 5,387 20,648 2,124 145,199 5,431
Human health services and social work activities - - 7,604 298 68,880 4,679 293,536 10,899 68,880 4,679 301,139 11,197
Arts, entertainment and recreation - - 1,406 10 63,480 6,530 116,785 6,216 63,480 6,530 118,191 6,226
Other services 14,242 2,966 52,887 257 114,960 26,439 571,938 16,673 129,202 29,406 624,824 16,930
Other financial activities - - 1,294,863 - 787,046 317,213 3,899,559 57,625 787,046 317,213 5,194,422 57,625
Households - housing - - - - 198,507 4,292 32,796,874 808,836 198,507 4,292 32,796,874 808,836
Households - other - - - - 448,788 189,709 2,609,235 227,339 448,788 189,709 2,609,235 227,339
41,955 2,966 5,419,967 2,239 8,553,409 3,048,012 57,360,274 2,144,489 8,595,363 3,050,978 62,780,241 2,146,728
30-06-2016
Portugal Spain France Africa Asia Rest of the world Total
Exposure Impairment Exposure Impairment Exposure Impairment Exposure Impairment Exposure Impairment Exposure Impairment Exposure Impairment
Measure
Individual 6,829,819 2,916,107 819,828 354,129 65,708 31,762 509,865 37,674 885 660 460,281 31,083 8,686,387 3,371,415
Collective 48,703,792 1,754,073 3,507,046 67,560 3,931,796 71,349 2,269,201 54,699 3,127,753 64,031 447,627 6,719 61,987,215 2,018,432
55,533,612 4,670,180 4,326,874 421,690 3,997,503 103,111 2,779,066 92,374 3,128,638 64,691 907,908 37,801 70,673,602 5,389,846

CGD NOTES ON THE ACCOUNTS 177
NOTES TO THE CONSOLIDATED FINANCIAL STATEMENTS
d) Details of restructured credit portfolio by restructuring method applied
e) Restructured credit portfolio - entries and exits
f) Details of the fair value of the credit portfolio’s underlying collateral namely corporate,
construction, "commercial real estate" (CRE) and housing
31-12-2015
Portugal Spain France Africa Asia Rest of the world Total
Exposure Impairment Exposure Impairment Exposure Impairment Exposure Impairment Exposure Impairment Exposure Impairment Exposure Impairment
Measure
Individual 6,477,159 2,603,019 807,062 317,596 87,742 32,217 654,310 40,760 619 619 568,470 56,766 8,595,363 3,050,978
Collective 49,592,044 1,870,667 3,455,312 72,712 3,941,196 69,586 2,285,859 51,185 3,154,296 75,854 351,534 6,724 62,780,241 2,146,728
56,069,203 4,473,687 4,262,374 390,307 4,028,939 101,804 2,940,169 91,945 3,154,915 76,473 920,004 63,491 71,375,604 5,197,706
30-06-2016
Performing loans Non-performing loans Total
Number of
operationsExposure
Impairment
individual
Impairment
collective
Number of
operationsExposure
Impairment
individual
Impairment
collective
Number of
operationsExposure
Impairment
individual
Impairment
collective
Measure
Credit term extension 4,931 375,166 4,148 23,118 3,832 1,087,251 500,950 63,597 8,763 1,462,417 505,098 86,715
Grace period 2,082 755,252 881 7,162 1,481 150,843 9,449 30 3,563 906,095 10,330 7,192
Interest rate changes 1,406 512,646 13,730 5,416 1,535 1,346,964 673,830 37,998 2,941 1,859,610 687,560 43,414
Other 11,796 1,224,971 27,877 38,859 8,129 1,821,923 656,773 155,830 19,925 3,046,894 684,650 194,689
20,215 2,868,036 46,636 74,555 14,977 4,406,981 1,841,002 257,455 35,192 7,275,016 1,887,638 332,010
31-12-2015
Performing loans Non-performing loans Total
Number of
operationsExposure
Impairment
individual
Impairment
collective
Number of
operationsExposure
Impairment
individual
Impairment
collective
Number of
operationsExposure
Impairment
individual
Impairment
collective
Measure
Credit term extension 5,134 421,845 7,320 22,865 3,395 1,061,260 404,572 53,345 8,529 1,483,105 411,891 76,211
Grace period 2,643 727,936 287 6,071 1,459 272,964 42,847 28,846 4,102 1,000,899 43,134 34,917
Interest rate changes 2,069 539,310 6,727 15,545 1,586 1,356,386 636,715 33,717 3,655 1,895,696 643,442 49,262
Other 11,179 1,317,750 27,095 35,160 7,077 1,624,001 476,306 134,705 18,256 2,941,752 503,400 169,865
21,025 3,006,841 41,428 79,641 13,517 4,314,611 1,560,440 250,613 34,542 7,321,452 1,601,868 330,255
Balance of restructured loans at 31-12-2015 7,321,452
New restructured loans 840,049
Accrued interest of the restructured loans 38,625
Restructured loans liquidation (partial or total) (380,493)
Reclassifyed loans from "restructured" to "normal" (521,116)
Other (23,501)
Balance of restructured loans at 30-06-2016 7,275,016
30-06-2016
Corporate Construction and real estate (CRE) Households - Housing
Real Estate Other real collaterals Real Estate Other real collaterals Real Estate Other real collaterals
Number Amount Number Amount Number Amount Number Amount Number Amount Number Amount
Fair value
<0.5 M€ 8,931 1,051,345 15,118 914,217 4,416 561,069 3,261 219,103 502,358 59,942,812 1,263 1,716,875
≥ 0.5 M€ and < 1 M€ 1,007 556,361 652 530,004 570 312,734 264 149,177 2,875 2,185,171 17 181,365
≥ 1 M€ and < 5 M€ 945 1,522,773 378 1,340,098 1,024 1,655,977 304 501,443 407 625,643 6 79,636
≥ 5 M€ and < 10 M€ 131 638,573 32 562,031 166 804,615 61 352,714 33 242,642 - -
≥ 10 M€ and < 20 M€ 28 274,802 15 625,182 85 848,082 23 316,930 22 300,718 - -
≥ 20 M€ and < 50 M€ 5 128,412 18 881,641 57 980,239 9 244,495 7 181,092 - -
≥ 50 M€ 4 444,751 4 4,513,035 25 2,689,854 13 905,194 3 708 - -
11,051 4,617,017 16,218 9,366,208 6,343 7,852,570 3,935 2,689,055 505,705 63,478,785 1,286 1,977,875

178 NOTES ON THE ACCOUNTS CGD
NOTES TO THE CONSOLIDATED FINANCIAL STATEMENTS
31-12-2015
Corporate Construction and real estate (CRE) Households - Housing
Real Estate Other real collaterals Real Estate Other real collaterals Real Estate Other real collaterals
Number Amount Number Amount Number Amount Number Amount Number Amount Number Amount
Fair value
<0.5 M€ 8,779 1,025,018 15,078 622,108 3,983 548,324 3,295 194,985 511,904 60,481,587 1,273 1,711,837
≥ 0.5 M€ and < 1 M€ 971 528,305 485 395,657 632 355,188 240 132,618 2,874 2,165,568 21 189,857
≥ 1 M€ and < 5 M€ 928 1,427,823 268 1,008,958 1,074 1,761,615 314 530,888 396 617,932 6 66,468
≥ 5 M€ and < 10 M€ 122 563,620 30 460,100 185 900,496 56 298,444 36 266,372 - -
≥ 10 M€ and < 20 M€ 32 236,230 13 582,615 84 880,515 26 355,756 22 300,718 - -
≥ 20 M€ and < 50 M€ 9 147,856 21 961,093 59 1,035,622 12 418,322 7 181,076 - -
≥ 50 M€ 5 467,791 6 3,752,753 27 2,758,354 13 1,034,582 3 634 - -
10,846 4,396,644 15,901 7,783,284 6,044 8,240,113 3,956 2,965,595 515,242 64,013,886 1,300 1,968,162

CGD NOTES ON THE ACCOUNTS 179
NOTES TO THE CONSOLIDATED FINANCIAL STATEMENTS
g) LTV ratio of corporate, construction, and CRE and housing segments
30-06-2016
Segment / Ratio
Number of
properties
Performing
loans
Non-performing
loansImpairment
Corporate
With no associated collateral 12,112,238 1,266,869 974,331
< 60% 4,264 1,336,543 84,819 34,700
>= 60% and < 80% 2,100 456,254 57,439 19,342
>= 80% and < 100% 1,869 449,862 487,121 376,190
>= 100% 3,105 1,267,792 551,923 270,325
11,338 15,622,690 2,448,170 1,674,888
Construction and real estate (CRE)
With no associated collateral 4,372,341 1,946,395 1,423,092
< 60% 2,300 438,673 169,975 58,013
>= 60% and < 80% 928 459,621 309,145 124,190
>= 80% and < 100% 1,150 692,015 377,835 141,403
>= 100% 1,847 675,593 1,245,197 572,601
6,225 6,638,243 4,048,548 2,319,298
Households - Housing
With no associated collateral 1,435,451 204,638 182,900
< 60% 392,201 12,227,424 350,339 51,464
>= 60% and < 80% 146,162 9,915,135 389,148 86,814
>= 80% and < 100% 77,155 5,690,847 489,725 160,190
>= 100% 19,742 1,119,751 682,216 335,303
635,260 30,388,608 2,116,067 816,671
Households - Consumption and other purposes
With no associated collateral 1,510,760 546,176 371,609
< 60% 2,884 328,970 13,562 14,696
>= 60% and < 80% 645 196,356 10,057 4,952
>= 80% and < 100% 597 90,287 32,942 10,738
>= 100% 775 106,465 57,566 23,836
4,901 2,232,838 660,304 425,831
Other financial institutions
With no associated collateral 539,899 190,972 73,933
< 60% 69 10,928 105,123 5,360
>= 60% and < 80% 24 50,591 905 2,174
>= 80% and < 100% 26 35,299 7,632 4,508
>= 100% 29 7,119 70,772 43,961
148 643,837 375,405 129,936
657,872 55,526,215 9,648,494 5,366,624
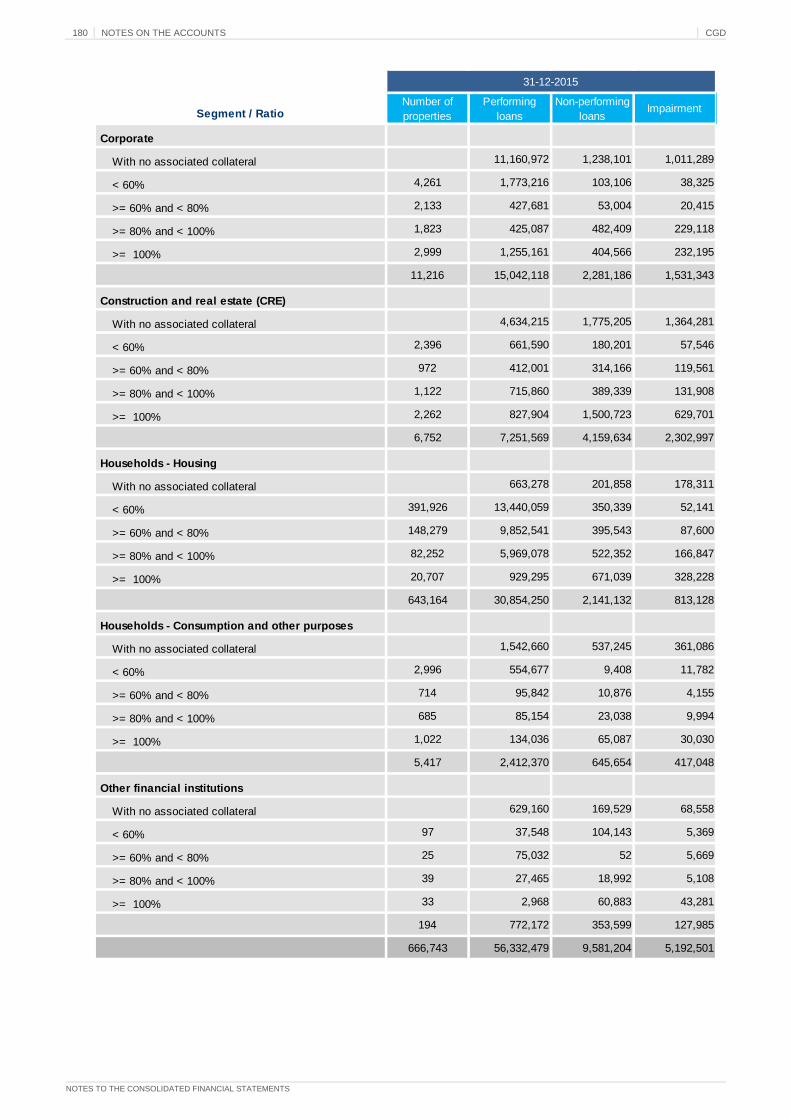
180 NOTES ON THE ACCOUNTS CGD
NOTES TO THE CONSOLIDATED FINANCIAL STATEMENTS
31-12-2015
Segment / RatioNumber of
properties
Performing
loans
Non-performing
loansImpairment
Corporate
With no associated collateral 11,160,972 1,238,101 1,011,289
< 60% 4,261 1,773,216 103,106 38,325
>= 60% and < 80% 2,133 427,681 53,004 20,415
>= 80% and < 100% 1,823 425,087 482,409 229,118
>= 100% 2,999 1,255,161 404,566 232,195
11,216 15,042,118 2,281,186 1,531,343
Construction and real estate (CRE)
With no associated collateral 4,634,215 1,775,205 1,364,281
< 60% 2,396 661,590 180,201 57,546
>= 60% and < 80% 972 412,001 314,166 119,561
>= 80% and < 100% 1,122 715,860 389,339 131,908
>= 100% 2,262 827,904 1,500,723 629,701
6,752 7,251,569 4,159,634 2,302,997
Households - Housing
With no associated collateral 663,278 201,858 178,311
< 60% 391,926 13,440,059 350,339 52,141
>= 60% and < 80% 148,279 9,852,541 395,543 87,600
>= 80% and < 100% 82,252 5,969,078 522,352 166,847
>= 100% 20,707 929,295 671,039 328,228
643,164 30,854,250 2,141,132 813,128
Households - Consumption and other purposes
With no associated collateral 1,542,660 537,245 361,086
< 60% 2,996 554,677 9,408 11,782
>= 60% and < 80% 714 95,842 10,876 4,155
>= 80% and < 100% 685 85,154 23,038 9,994
>= 100% 1,022 134,036 65,087 30,030
5,417 2,412,370 645,654 417,048
Other financial institutions
With no associated collateral 629,160 169,529 68,558
< 60% 97 37,548 104,143 5,369
>= 60% and < 80% 25 75,032 52 5,669
>= 80% and < 100% 39 27,465 18,992 5,108
>= 100% 33 2,968 60,883 43,281
194 772,172 353,599 127,985
666,743 56,332,479 9,581,204 5,192,501

CGD NOTES ON THE ACCOUNTS 181
NOTES TO THE CONSOLIDATED FINANCIAL STATEMENTS
h) Details of fair value and net accounting value of property received in kind or
repossessed by type of assets and seniority.
Explanatory notes on filling in the quantitative disclosures:
. Common definitions
Segmentation – the segments used are based on the definitions provided in the Bank of
Portugal’s Monetary and Financial Statistics publication:
i. “Government” – the local and central government sector which includes
institutional units whose main activity consists of the production of non-
mercantile goods and services for individual or collective consumption and/or
the redistribution of income and national wealth;
ii. “Corporate” – non-financial corporations sector, comprising institutional units
with their own legal personality whose main activity consists of producing
non-financial goods and services;
iii. “Construction CRE” – non-financial corporations with an economic activity
related to the “construction” or “property activities” sectors, according to the
respective “CAE” (Classification of Economic Activity) Release 3.
Household sector – includes individuals or groups thereof, in their capacity as
consumers, producers of goods and services for their own end use or producers of
financial or non-financial goods and services, provided that such activities are not
allocated to quasi-companies.
Also included are the self-employed who are part of individual companies and companies
of persons not having a legal personality which are mercantile producers.
Asset
Number of
real estate
Fair value of
assetsBook value Time elapsed since the initial
recognition / repossesssion< 1 year
≥ 1 year and
< 2,5 years
≥ 2,5 years
and
< 5 years
≥ 5 years Total
Land Land
Urban 803 254,024 107,229 Urban 15,179 32,691 27,321 32,038 107,229
Rural 110 9,612 4,604 Rural 259 506 909 2,931 4,604
Under construction buildings Under construction buildings
Commercial 5 4,182 3,275 Commercial - 2,618 657 - 3,275
Housing 575 84,287 55,576 Housing 4,962 29,638 12,156 8,820 55,576
Other 183 10,783 6,024 Other 821 2,525 1,697 981 6,024
Concluded buildings Concluded buildings
Commercial 622 204,777 153,385 Commercial 51,859 28,419 54,478 18,629 153,385
Housing 4,182 403,965 251,391 Housing 55,286 120,993 39,515 35,596 251,391
Other 2,265 252,246 166,210 Other 48,081 48,380 51,418 18,330 166,210
8,745 1,223,878 747,693 176,447 265,771 188,150 117,326 747,693
30-06-2016 30-06-2016
31-12-2015 31-12-2015
Asset
Number of
real estate
Fair value of
assetsBook value Time elapsed since the initial
recognition / repossesssion< 1 year
>= 1 year e
< 2.5 years
>= 2.5 years
e < 5 years>= 5 years Total
Land Land
Urban 636 170,398 104,327 Urban 19,857 23,751 27,822 32,898 104,327
Rural 61 5,238 4,071 Rural 3,178 139 259 496 4,071
Buildings in development Buildings in development
Commercial 8 6,097 4,632 Commercial 923 2,982 726 - 4,632
Housing 617 88,970 56,345 Housing 8,206 28,090 11,160 8,888 56,345
Other 199 10,690 5,893 Other 1,770 1,577 1,644 903 5,893
Built buildings Built buildings
Commercial 700 232,528 183,177 Commercial 56,243 59,411 50,586 16,936 183,177
Housing 4,220 378,912 256,255 Housing 51,777 139,918 31,205 33,356 256,255
Other 2,525 306,668 213,949 Other 66,022 77,764 53,661 16,502 213,949
8,966 1,199,500 828,650 207,975 333,632 177,063 109,979 828,650

182 NOTES ON THE ACCOUNTS CGD
NOTES TO THE CONSOLIDATED FINANCIAL STATEMENTS
iv. “Individuals - housing” – household sector comprising loans for housing
purposes;
v. “Individuals - consumption and other purposes” – household sector not
comprising loans for housing (usually consumer credit);
vi. “Other” – Other financial corporations (financial institutions sector which
includes institutional units having their own legal personality which are
mercantile producers and whose main activity consists of producing financial
services, excluding financial brokerage) and other institutions or individuals.
Performing/non-performing loans follow the default criteria defined in item 8. of the
qualitative information.
Restructured credit follows the criteria defined in item 4. of the qualitative information.
Individual and collective analyses – difference between credit with individual and
collective impairment in accordance with the impairment model.
. Table a)
Cured credit refers to performing credit that, according to the credit impairment model has
already been in default.
Note: in the case of cured credit which has been restructured, the classification as
restructured credit prevails.
Performing credit with signs of default follow the criteria defined in item 8 of the qualitative
information.
Non-performing credit in arrears for less than 90 days refers to the other event losses
defined in item 8 of the qualitative information.
. Table b)
Year of production refers to the agreement date of portfolio operations in June 2016.
. Table c)
Activity sectors refer to the Classification of Economic Activity – Release 3 of customers
in the “corporate” and “government” sectors.
i. Customers in the “Other financial institutions” segment were included in the
Other financial activities sector;
ii. Customers classified as being “Individual customers – Housing” and –
“Individual customers - other” were allocated.
Several balances were transferred owing to the revision of the NACE (statistics
nomenclature for economic activities) code in CGD headquarters in respect of several
customers in June 2016.
The impact of this change is more significant in other financial activities and consultancy,
scientific, technical and similar activities, as noted in the December 2015 and June 2016
tables.
Reference is made, in each geography, to the portfolio credit of the entities with an
activity in the said region/geography.

CGD NOTES ON THE ACCOUNTS 183
NOTES TO THE CONSOLIDATED FINANCIAL STATEMENTS
. Table d)
In the case of restructuring measures, the first event on a level of contractual changes
after having been marked as restructured owing to financial difficulties. The “Other”
restructuring measure includes the following events:
a. Capitalisation of interest;
b. Refinancing operations;
c. Moratoria on payments/maturity;
d. Capital deferments;
e. Other non-systemised automatic or manual markings.
. Table f)
Real collateral considered in the impairment model:
- Property refers to mortgage guarantees on such properties;
- Other real collateral includes mortgage guarantees on material/moveable assets and
financial collateral such as deposits, bonds, shares, etc.
The fair value of collateral is understood to be the valuation price in the case of mortgage
collateral and market value for financial collateral. In cases in which the same
guarantee/collateral covers more than one credit operation, fair value is duly weighted by
the operations based on the amount of the credit.
. Table g)
LTV is the ratio between outstanding credit on a loan and the fair value of the collateral
held.
Liquidity risk
Liquidity risk derives from the possibility of difficulties (i) in obtaining resources to finance
assets, normally leading to higher borrowing costs but also possibly implying a restriction
on asset growth, and (ii) the prompt settlement of obligations to third parties deriving from
significant mismatches between the periods to maturity of an institution’s financial assets
and liabilities. Liquidity risk may, for example, translate the impossibility of selling a
financial asset quickly at a price close to its fair value.
Under IFRS 7 requirements, the contractual periods to maturity of financial instruments,
at June 30, 2016 and December 31, 2015 were as follows:
Up to 1 month 1 to 3 months 3 to 6 months 6 months to 1
year 1 to 3 years 3 to 5 years 5 to 10 years
More than 10
years Unspecified
Total
Assets
Cash and cash equivalents at central banks 1,503,605 - - - - - - - - 1,503,605
Cash balances at other credit institutions 435,976 - - - - - - - 3,831 439,807
Loans and advances to credit institutions 2,297,430 434,797 177,748 225,764 8,657 2,754 5,052 35,297 35,353 3,222,853
Securities
Trading 78,129 204,346 355,157 3,345,024 36,024 30,111 46,677 3,698 1,919,887 6,019,053
Other (net of impairment) 88,613 1,377,491 1,714,129 632,667 2,680,902 3,127,112 2,657,961 863,151 2,399,085 15,541,111
Loans and advances to customers (gross) 2,819,342 3,276,070 4,199,313 3,588,155 10,941,359 9,663,915 14,787,821 27,763,446 49,835 77,089,257
Assets with repurchase agreement 43,209 1,466 23,026 18,270 402,946 140,407 297,866 - 41,359 968,549
Hedging derivatives - - - - - - - - 16,040 16,040
7,266,304 5,294,170 6,469,373 7,809,880 14,069,888 12,964,298 17,795,378 28,665,593 4,465,391 104,800,275
Liabilities
Resources of central banks and credit institutions (755,126) (210,795) (367,304) (259,313) (1,340,842) (2,520,511) (456,883) - 19,381 (5,891,393)
Customer resources (30,379,100) (8,357,261) (12,076,115) (7,278,028) (11,366,641) (2,770,415) (596,018) (49,309) (108,993) (72,981,881)
Debt securities (42,338) (321,014) (1,538,620) (153,757) (1,789,313) (1,263,604) (1,337,869) (34,164) 3,378 (6,477,300)
Financial liabilities at fair value through profit or loss (19,501) (936) (2,135) (2,778) (3,122) (580) (9,137) - (2,223,842) (2,262,030)
Hedging derivatives - - - - - - - - (3,611) (3,611)
Subordinated liabilities (6,209) (1,373) (73,351) (963,588) (1,401,394) (12,143) (30,332) (112,143) (229) (2,600,762)
Consigned resources (1,827) (39,130) (14,058) (20,685) (147,552) (137,670) (485,552) (32,658) (104) (879,236)
(31,204,102) (8,930,507) (14,071,584) (8,678,149) (16,048,864) (6,704,923) (2,915,791) (228,274) (2,314,019) (91,096,214)
Derivatives 2,868 7,217 11,245 1,005 17,235 16,920 84,151 319,992 - 460,633
Difference (23,934,930) (3,629,120) (7,590,966) (867,264) (1,961,740) 6,276,294 14,963,737 28,757,310 2,151,372 14,164,694
30-06-2016
Residual term to contractual maturity

184 NOTES ON THE ACCOUNTS CGD
NOTES TO THE CONSOLIDATED FINANCIAL STATEMENTS
The above tables also include cash flow projections on principal and interest and are not
therefore directly comparable to the accounting balances at June 30, 2016 and
December 31, 2015. Interest projections on variable-rate operations incorporate the
forward rates implicit in the current yield curve in force on the respective references
dates.
In the specific case of mortgage loans, the distribution of principal and interest flows also
took into account: i) expectations on early repayment rates based on an analysis of the
track record of operations and: ii) the present macroeconomic situation.
The following tables, which contain information on CGD group’s “structural” (as opposed
to contractual) periods to maturity, at June 30, 2016 and 2013, differ from the former
tables in their use of the following presuppositions:
Debt and equity securities: reallocation of amounts with adequate liquidity to the
“up to 1 month” bucket, except for collateralised debt securities which are
allocated to buckets corresponding to the maturity of operations they are
collateralising;
Customers’ sight deposits: reallocation of the balance of core deposits (i.e.
deposits comprising a stable funding source for lending operations) from the “up
to 1 month” bucket to the more than 4 years buckets in conformity with internally
developed studies and models;
Term deposits and savings accounts (CGD headquarters): reallocation of the
balances by buckets based on their expected average useful lives (as opposed to
their contractual periods to maturity).
The amounts presented also correspond to outstanding capital balances and do not
include interest or accrued interest projections.
Up to 1 month 1 to 3 months 3 to 6 months 6 months to 1
year 1 to 3 years 3 to 5 years 5 to 10 years
More than 10
years Unspecified
Total
Assets
Cash and cash equivalents at central banks 2,881,731 - - - - - - - - 2,881,731
Cash balances at other credit institutions 770,636 - - - - - - - - 770,636
Loans and advances to credit institutions 3,322,779 252,240 94,691 273,204 9,424 3,270 9,813 36,731 38,249 4,040,401
Securities
Trading 150 12,632 250,160 465,180 22,897 147,950 35,447 3,397 1,639,552 2,577,364
Other (net of impairment) 468,196 1,045,823 1,230,077 3,991,191 2,455,484 2,093,440 3,369,695 895,000 2,611,100 18,160,006
Loans and advances to customers (gross) 3,566,676 2,802,165 4,096,862 3,579,653 10,681,101 10,854,742 15,905,664 30,558,101 (45,782) 81,999,183
Assets with repurchase agreement 2,187 20 76,687 40,344 728,684 159,166 144,692 - 37,390 1,189,170
Hedging derivatives - - - - - - - - 46,468 46,468
11,012,356 4,112,880 5,748,478 8,349,573 13,897,589 13,258,567 19,465,311 31,493,228 4,326,978 111,664,960
Liabilities
Resources of central banks and credit institutions (958,523) (288,660) (408,231) (306,561) (2,929,496) (161,505) (497,925) - (37,239) (5,588,141)
Customer resources (29,124,073) (6,936,404) (10,936,301) (10,131,560) (12,268,621) (3,918,427) (637,862) (183,526) (62,749) (74,199,523)
Debt securities (180,514) (280,077) (166,324) (1,893,908) (1,113,611) (2,077,231) (1,392,644) (48,417) 4,159 (7,148,567)
Financial liabilities at fair value through profit or loss (8,513) (1,037) (891) (2,125) (10,074) (6,813) (8,243) (975) (1,699,926) (1,738,597)
Hedging derivatives - - - - - - - - (10,812) (10,812)
Subordinated liabilities (7,305) (7,600) (77,219) (75,493) (1,814,236) (559,637) (30,332) (118,206) (22) (2,690,049)
Consigned resources - (936) (19,724) (53,370) (148,249) (145,221) (502,412) (34,417) (653) (904,983)
(30,278,928) (7,514,715) (11,608,691) (12,463,017) (18,284,287) (6,868,834) (3,069,418) (385,541) (1,807,241) (92,280,672)
Derivatives (1,743) (7,702) 7,716 15,239 12,743 33,400 114,379 361,865 - 535,897
Difference (19,268,315) (3,409,537) (5,852,497) (4,098,206) (4,373,955) 6,423,134 16,510,273 31,469,552 2,519,737 19,920,185
31-12-2015
Residual term to contractual maturity

CGD NOTES ON THE ACCOUNTS 185
NOTES TO THE CONSOLIDATED FINANCIAL STATEMENTS
Up to 1 month 1 to 3 months 3 to 6 months 6 months to 1 year 1 to 3 years 3 to 5 years 5 to 10 yearsMore than 10
yearsUnspecified
Total
Assets
Cash and cash equivalents at central banks 1,502,659 - - - - - - - - 1,502,659
Cash balances at other credit institutions 435,976 - - - - - - - 3,831 439,807
Loans and advances to credit institutions 2,296,352 434,570 177,584 224,456 6,567 749 - 31,259 35,353 3,206,890
Securities
Trading 2,197,896 32,421 54,090 511,495 303,972 623,130 6,939 816,590 1,462,477 6,009,010
Other (net of impairment) 6,176,233 209,641 236,993 79,348 1,176,392 2,162,648 344,949 2,389,853 1,113,731 13,889,787
Loans and advances to customers (gross) 2,707,733 3,095,630 3,910,177 3,089,112 9,268,347 8,402,616 11,743,185 22,251,985 49,835 64,518,621
Assets with repurchase agreement 182,079 - 183,000 274,790 153,538 - - - 59,217 852,625
15,498,928 3,772,262 4,561,845 4,179,200 10,908,816 11,189,142 12,095,073 25,489,687 2,724,444 90,419,398
Liabilities
Resources of central banks and credit institutions (753,881) (201,490) (364,319) (248,042) (1,298,579) (2,483,902) (431,586) - 19,381 (5,762,419)
Customer resources (9,448,417) (10,077,482) (11,986,084) (8,759,740) (11,120,628) (3,532,520) (1,242,154) (15,960,841) (99,980) (72,227,846)
Debt securities (36,000) (309,050) (1,471,450) (50,000) (1,590,500) (1,187,320) (1,322,652) (34,016) 3,378 (5,997,609)
Financial liabilities at fair value through profit or loss (19,378) (936) (2,135) (2,778) (3,122) (580) (9,137) - (2,223,842) (2,261,906)
Subordinated liabilities (6,209) - (20,669) (900,449) (1,356,690) - - (100,000) (229) (2,384,246)
Consigned resources (1,827) (36,639) (13,218) (19,705) (139,761) (131,362) (477,761) (31,266) (104) (851,642)
(10,265,712) (10,625,597) (13,857,875) (9,980,713) (15,509,279) (7,335,684) (3,483,290) (16,126,123) (2,301,395) (89,485,668)
Difference 5,233,216 (6,853,335) (9,296,030) (5,801,513) (4,600,463) 3,853,459 8,611,783 9,363,564 423,049 933,731
30-06-2016
Remaining maturity
Up to 1 month 1 to 3 months 3 to 6 months 6 months to 1 year 1 to 3 years 3 to 5 years 5 to 10 yearsMore than 10
yearsUnspecified
Total
Assets
Cash and cash equivalents at central banks 2,879,591 - - - - - - - - 2,879,591
Cash balances at other credit institutions 770,636 - - - - - - - - 770,636
Loans and advances to credit institutions 3,324,150 247,776 94,617 271,266 7,207 1,043 4,274 31,630 38,249 4,020,211
Securities
Trading 541,189 4,877 37,500 68,904 161,049 21,109 5,008 179,027 1,530,493 2,549,155
Other (net of impairment) 8,300,790 203,537 183,090 593,972 2,759,755 273,625 467,776 2,841,751 812,866 16,437,163
Loans and advances to customers (gross) 3,439,852 2,618,948 3,782,294 3,074,469 8,827,650 9,126,984 11,812,614 22,764,012 (45,872) 65,400,951
Assets with repurchase agreement 112,200 - 290,490 40,000 582,233 - - - 52,877 1,077,800
19,368,407 3,075,138 4,387,991 4,048,610 12,337,894 9,422,761 12,289,671 25,816,420 2,388,613 93,135,506
Liabilities
Resources of central banks and credit institutions (957,778) (279,100) (405,437) (294,809) (2,878,065) (117,001) (455,759) - (37,239) (5,425,187)
Customer resources (8,862,193) (7,904,078) (11,324,542) (11,504,506) (11,951,990) (4,594,436) (1,270,763) (15,690,170) (54,783) (73,157,461)
Debt securities (75,000) (273,820) (159,315) (1,806,500) (882,700) (1,926,901) (1,361,259) (48,390) 4,159 (6,529,726)
Financial liabilities at fair value through profit or loss (8,513) (1,037) (891) (2,125) (10,074) (6,813) (8,243) (975) (1,699,926) (1,738,597)
Subordinated liabilities (7,305) - (21,662) (21,073) (1,720,400) (536,729) - (100,000) (22) (2,407,191)
Consigned resources - (864) (18,841) (49,856) (139,761) (136,004) (491,094) (32,995) (653) (870,069)
(9,910,789) (8,458,899) (11,930,687) (13,678,869) (17,582,989) (7,317,885) (3,587,117) (15,872,531) (1,788,464) (90,128,231)
Difference 9,457,618 (5,383,761) (7,542,696) (9,630,259) (5,245,096) 2,104,876 8,702,554 9,943,890 600,149 3,007,275
31-12-2015
Remaining maturity

186 NOTES ON THE ACCOUNTS CGD
NOTES TO THE CONSOLIDATED FINANCIAL STATEMENTS
Interest rate risk
Short term or accounting perspective – fair value
The following tables set out information on the balance sheet and fair values of the main
financial assets and liabilities, at amortised cost, at June 30, 2016 and December 31,
2015.
Fair value was assessed on the following presuppositions:
The book value of balances payable on demand corresponds to their fair value;
The fair value of Caixa’s listed debt issuances (net), corresponds to the
respective market price;
Balances not
analysed
Level 1 Level 3
Assets
Cash and cash equivalents at central banks 1,502,664 - 1,502,664 - - 1,502,664
Cash balances at other credit institutions 440,187 - 440,187 - - 440,187
Loans and advances to credit institutions 2,684,930 - 2,694,815 9,885 516,855 3,201,785
Assets with repurchase agreement 352,666 - 360,357 7,691 - 352,666
Held-to-maturity investments 237,850 - 220,627 (17,223) - 237,850
Loans and advances to customers 61,764,393 - 59,234,394 (2,529,999) 3,166,696 64,931,089
66,982,690 - 64,453,044 (2,529,646) 3,683,552 70,666,241
Liabilities
Resources of central banks and other credit institutions 5,461,628 - 5,476,570 14,942 306,974 5,768,602
Customer resources 70,137,049 - 70,362,799 225,750 2,304,764 72,441,813
Debt securities 6,070,995 5,261,044 1,034,272 224,321 45,877 6,116,872
Subordinated liabilities 2,379,723 526,579 1,842,998 (10,145) 19,802 2,399,525
Consigned resources 849,711 - 843,018 (6,693) 1,931 851,642
84,899,106 5,787,623 79,559,657 448,174 2,679,348 87,578,454
30-06-2016
Balances analysed
Total book value
Book valueFair value
Difference Book value
Balances not
analysed
Level 1 Level 3
Assets
Cash and cash equivalents at central banks 2,879,645 - 2,879,645 - - 2,879,645
Cash balances at other credit institutions 773,163 - 773,163 - - 773,163
Loans and advances to credit institutions 3,545,300 - 3,554,028 8,728 466,215 4,011,515
Assets with repurchase agreement 418,866 - 436,511 17,645 - 418,866
Loans and advances to customers 62,583,352 - 60,200,975 (2,382,377) 3,175,681 65,759,033
70,200,325 - 67,844,322 (2,356,004) 3,641,896 73,842,221
Liabilities
Resources of central banks and other credit institutions 5,051,338 - 5,115,621 64,283 381,732 5,433,070
Customer resources 68,679,522 - 68,991,342 311,820 4,746,743 73,426,265
Debt securities 6,620,491 5,179,588 1,586,134 145,231 79,589 6,700,081
Subordinated liabilities 2,415,300 516,239 1,953,311 54,249 13,625 2,428,925
Consigned resources 869,416 - 866,025 (3,391) 653 870,069
83,636,067 5,695,827 78,512,433 572,192 5,222,343 88,858,410
31-12-2015
Balances analysed
Total book value
Book valueFair value
Difference Book value

CGD NOTES ON THE ACCOUNTS 187
NOTES TO THE CONSOLIDATED FINANCIAL STATEMENTS
The fair value of the remaining financial instruments is assessed on the basis of
discounted cash flows up to the maturity of the operations for both fixed and
variable interest rate instruments. The contractual conditions of the operations as
well as, for the estimated variable-rate instruments, the future cash flows,
incorporating the forward rates implicit in the yield curve in force on the
respective reference dates were considered for the purpose in question together
with the use of discount curves appropriate to the type of instrument, including:
- Market interest rates, incorporating average spreads on new investment
operations and credit institutions’ resources;
- Market interest rates incorporating average spreads charged on new
lending operations and customer deposits on comparable loans and
deposits.
The “Balances not analysed” column essentially includes:
- Overdue credit, net of provisions;
- The balances of several entities not included in Caixa’s centralised
calculation.
The form of measuring the fair value of financial instruments recognised in the financial
statements, at fair value, at June 30, 2016 and December 31, 2015, may be summarised
as follows:
Level 1
Market prices
Level 2
Market inputs
Level 3
Other
measurement
techniques
Securities held for trading 4,091,136 3,605 173 4,094,915
Securities at fair value through profit or loss 240,444 - 484,742 725,186
Available-for-sale financial assets 7,479,778 3,803,333 1,708,672 12,991,782
Assets with repurchase agreement 368,732 17,858 116,335 502,925
Trading derivatives 257 (935,489) 588,540 (346,692)
Other financial liabilities at fair value through profit or loss (1,120) - - (1,120)
Hedging derivatives - 12,429 - 12,429
12,179,228 2,901,736 2,898,462 17,979,425
30-06-2016
Measurement techniques
Total
Level 1
Market prices
Level 2
Market inputs
Level 3
Other
measurement
techniques
Securities held for trading 964,393 5,085 422 969,900
Securities at fair value through profit or loss (*) 316,060 - 500,662 816,722
Available-for-sale financial assets 9,722,252 3,812,181 1,911,300 15,445,733
Assets with repurchase agreement 326,218 215,396 120,686 662,300
Trading derivatives 1,164 (695,295) 534,788 (159,343)
Hedging derivatives - 35,657 - 35,657
11,330,087 3,373,024 3,067,859 17,770,970
(*) The amounts presented exclude loans and other receivables
31-12-2015
Measurement techniques
Total

188 NOTES ON THE ACCOUNTS CGD
NOTES TO THE CONSOLIDATED FINANCIAL STATEMENTS
The preparation of the above table was based on the following criteria:
. Level 1 – Market prices – this column includes financial instruments measured on
the basis of prices in active markets;
. Level 2 – Measurement techniques – observable market input – this column
includes financial instruments measured on the basis of internal models using
observable market input (interest rates, foreign exchange rates, ratings of
external entities, other). This column also includes financial instruments
measured on the bid prices supplied by external counterparties;
. Level 3 – Other measurement techniques – this column includes financial
instruments measured on the basis of internal models, prices supplied by external
entities including non-observable market parameters or NAV (net asset value)
supplied by restructuring or closed-end fund management companies.
Movements in financial instruments, classified in the “Other measurement techniques”
column, across first half 2016, were as follows:
At June 30, 2016 and December 31, 2015, a positive shift of 100 bps on the interest rate
curve used to discount estimated future flows on debt instruments measured by internal
models, would result in a balance sheet decrease of around €256 thousand and €280
thousand in fair value and revaluation reserves and income, respectively.
Equity instruments measured by other measurement techniques (Level 3), at June 30,
2016 and December 31, 2015, essentially include investment structures measured on the
basis of data relative to the net asset values of the underlying assets provided by
management entities or other information service providers.
At December 31, 2015 the assets classified at level 3 also included the €22,341 thousand
equity stake in Visa Europe Limited, owing to its measurement in the sphere of the
transaction then in progress with Visa Inc. Capital gains of €38,941 thousand were made
on the sale of this equity stake which was completed in first half 2016
Debt
instruments
Corporate
bonds
Asset-backed
securities Corporate
bonds
Book value (net) at 31-12-2015 494,403 6,681 501,084 1,158,991 368,530 504,466 2,031,987 534,788 3,067,859
Acquisitions 16,199 - 16,199 17,471 - 176,655 194,126 2,393 212,718
Amortisations - (5,000) (5,000) (22,127) (227,135) (249,262) 34,030 (220,232)
Sales (28,027) - (28,027) (51,736) - (2,573) (54,309) - (82,336)
Gains / (losses) recognised as a charge to results - alienated
instruments 6,458 (14) 6,444 26,472 - (39) 26,433 - 32,878
Gains / (losses) recognised as a charge to results - portfolio
instruments [*] (7,299) 1,320 (5,980) 8,715 2,791 1,272 12,778 17,329 24,127
Impairment for the period - - - (39,323) - - (39,323) - (39,323)
Gains / (losses) recognised as a charge to fair value reserves - - - (36,332) (18,799) (1,922) (57,053) - (57,053)
Transfers from / (to) other levels (Levels 1 and 2) - - - 711 - - 711 - 711
Exchange differences (141) 335 194 (1,666) - - (1,666) - (1,472)
Other - - - - - (39,417) (39,416) - (39,416)
Book value (net) at 30-06-2016 481,593 3,322 484,915 1,083,304 330,396 411,307 1,825,007 588,540 2,898,462
[*] It includes values of equity units redemptions portfolio
Financial assets at fair value through profit or
loss Available-for-sale financial assets
Derivates
financial
instruments
Total Equity
instruments Subtotal
Equity
instruments
Debt instruments
Subtotal

CGD NOTES ON THE ACCOUNTS 189
NOTES TO THE CONSOLIDATED FINANCIAL STATEMENTS
In first half 2016 transfers between levels 1 and 2 of the fair value ranking were as
follows:
The transfers between classification levels in the fair value ranking are essentially on
account of the changes in the sources available for the measurement of these assets
(market or external counterparties).
Derivatives
Derivatives are traded in organised and OTC markets.
The value of listed derivatives operations is measured on prices taken from financial
information systems (Reuters/Bloomberg).
OTC derivatives are measured by commonly accepted theoretical, reasonably complex
models, depending on the characteristics of the product in question:
Discounted cash flow projections based on an adequate yield curve;
Measurements based on statistical models, accepted in the market, such as
Black & Scholes.
The type of input necessary for the measurement also depends upon the characteristics
of the operations, which generally include yield curves, volatility curves, equity
prices/indices, exchange rates and dividend yields.
Yield curves are produced on deposit rates and swap prices taken from
Reuters/Bloomberg. An adjustment based on interest rate futures or FRAs is applied to
currencies with the largest exposures. Different yield curves are available on future cash
flows, depending on the period of the operation's indexer.
Volatility curves are produced on the basis of the implicit volatilities in the prices of listed
options on underlying assets. If there are no listed options for an underlying asset,
historic volatility is calculated on the basis of the historical price series of its component
parts.
Prices of shares/indices, exchange rates and dividend yields are supplied by
Reuters/Bloomberg.
According to IFRS 13 requirements, Caixa incorporated add-ons to its measurement of
the said financial instruments to reflect its own credit risk based on a market discount
curve considered to reflect the associated risk profile. Simultaneously, based on its
current exposure, the group adopted a similar methodology to reflect counterparty credit
risk in derivatives with positive fair value. The fair value thus obtained comprises the risk-
free valuation affected by this addition.
The value of CVA (credit value adjustments) at June 30, 2016 and December 31, 2015,
recognised In "Financial assets held for trading" and DVA (debit value adjustments)
headings recognised in "Financial liabilities held for trading" totalled €192,907 thousand
and €3,762 thousand respectively and €156,428 thousand and €3,197 thousand,
respectively.
Transfers from
level 1 to level 2
Transfers from
level 2 to level 1
Debt instruments 22,807 32,449
30-06-2016
Available-for-sale financial assets

190 NOTES ON THE ACCOUNTS CGD
NOTES TO THE CONSOLIDATED FINANCIAL STATEMENTS
Debt instruments of financial and non-financial entities
Whenever possible, securities are valued at market prices, based on an internally
developed algorithm. This algorithm endeavours to obtain the most appropriate price for
each security in accordance with a hierarchy of contributors defined internally by CGD.
Price changes are analysed daily with the aim of ensuring the quality of the prices used.
In general the input used for internal valuations is obtained from Bloomberg and Reuters.
There are several securities for which market prices cannot be obtained: assets classified
at levels 2 and 3. These securities are priced by the use of internal/external valuation
techniques. The valuations are generally based on expected future discounted cash
flows. The forecast may be the result of a reasonably complex model ranging from simple
discounted cash flows resulting from forward rates (obtained from the most adequate
yield curve, which, in turn, is produced on the basis of money market rates and swap
prices, whose money market component is adjusted by interest rate futures or FRAs) to a
CLO (collateralised loan obligations) cascade payment (projected on the basis of
information disclosed in investor reports).
For discount purposes, internal valuations use a listed credit curve complying with the
issuance’s currency/sector/rating trinomial to consider the risk attached to each issuance.
Segmentation between levels 2 and 3 is essentially associated with the viability of the
direct observation of the information input sources for measurement purposes. In general,
the valuations provided by structurers, issuing entities or counterparties (external
measurements) are also allocated to level 3. Securitisations with reduced liquidity are
also allocated to level 3.
Yield curves are calculated on money market rates and swap prices. In the case of euro,
GBP and USD yield curves, the adjustment uses the market price of interest rate futures
and/or FRAs.
The values of the curves of the currencies with greater exposure, at June 30, 2016 and
December 31, 2015, were as follows:
EUR USD GBP EUR USD GBP
O/N -0.3950 0.7500 0.5250 -0.3000 0.4500 0.4500
1 month -0.4100 0.8000 0.5500 -0.2300 0.6300 0.5400
2 months -0.3759 0.8500 0.5800 -0.2055 0.6700 0.6300
3 months -0.3461 0.8769 0.6078 -0.1813 0.6976 0.6492
6 months -0.2529 0.7545 0.4739 -0.1043 0.7379 0.6537
9 months -0.2489 0.7319 0.4220 -0.1056 0.8090 0.6936
1 year -0.2315 0.7275 0.3905 -0.0890 0.8864 0.7472
2 years -0.2316 0.7750 0.3444 -0.0489 1.1982 0.9973
3 years -0.1948 0.8120 0.4875 0.0634 1.4205 1.3094
5 years -0.0570 0.9870 0.5821 0.3310 1.7545 1.6017
7 years 0.1390 1.1650 0.7401 0.6197 1.9970 1.8146
10 years 0.4332 1.3765 0.9613 1.0013 2.2190 2.0245
15 years 0.7423 1.6050 1.1590 1.4033 2.4520 2.1925
20 years 0.8512 1.7300 1.2117 1.5713 2.5830 2.2232
25 years 0.8732 1.7950 1.2020 1.6093 2.6390 2.2027
30 years 0.8662 1.8330 1.1822 1.6143 2.6470 2.1796
30-06-2016 31-12-2015

CGD NOTES ON THE ACCOUNTS 191
NOTES TO THE CONSOLIDATED FINANCIAL STATEMENTS
Credit curve values are obtained from the Bloomberg/Thomson Reuters system and
assessed on the prices of a series of securities complying with the currency/sector/rating
trinomial. The values of the credit curve of the Portuguese and German governments, at
June 30, 2016 and December 31, 2015, were as follows:
Foreign exchange rates are assessed on the prices set by the central bank. The following
table provides information on the foreign exchange rate pairings of several of the relevant
currencies, at June 30, 2016 and December 31, 2015:
Equity instruments held as part of a venture capital activity
The value of unlisted own equity instruments held as part of a venture capital activity is
measured by the following criteria:
i) Prices of materially relevant transactions made by independent entities over the last
six months;
ii) Multiples of comparable companies in terms of activity, size and profitability;
iii) Discounted cash flows;
iv) Settlement price corresponding to the net amount of an associated company’s
assets;
v) Acquisition cost.
Portuguese Government German Government Portuguese Government German Government
3 months 0.0460 -0.6790 0.0000 -0.6342
6 months 0.0603 -0.6570 -0.0033 -0.3915
9 months 0.0984 -0.6505 0.0072 -0.4205
1 year 0.1573 -0.6430 0.0201 -0.3763
2 years 0.5943 -0.6140 0.1218 -0.3495
3 years 1.1683 -0.5833 0.4672 -0.2763
5 years 1.8953 -0.5090 1.2839 -0.0437
7 years 2.5222 -0.3716 1.9467 0.2359
10 years 2.9771 -0.1084 2.5534 0.6275
15 years 3.4964 0.1155 3.1914 1.0553
20 years 3.7183 0.3220 3.4541 1.3408
25 years 3.8406 0.4139 3.6125 1.4148
30 years 3.9154 0.5058 3.7117 1.4888
30-06-2016 31-12-2015
30-06-2016 31-12-2015
EUR/USD 1.1102 1.0887
EUR/GBP 0.8265 0.7340
EUR/CHF 1.0867 1.0835
EUR/AUD 1.4929 1.4897
EUR/JPY 114.0500 131.0700
EUR/BRL 3.5898 4.3117

192 NOTES ON THE ACCOUNTS CGD
NOTES TO THE CONSOLIDATED FINANCIAL STATEMENTS
Market risk
Market risk is the risk of a change in the fair value or cash flows of financial instruments
based on changes in market prices including foreign exchange, interest rate and price
risks.
Market risk assessment is based on the following methodologies:
. Value at Risk (VaR) on the following portfolios:
. Held-for-trading portfolio – perimeter of “held-for-trading” positions and
transactions originating in CGD group;
. Own portfolio – securities acquired for investment purposes but presently
used for deleveraging purposes;
. Trading portfolio - includes other securities and derivatives traded with the
objective of detecting business opportunities over the short term;
. Own portfolio – securities acquired for investment purposes but presently
used for deleveraging purposes;
. Investment portfolio – with the aim of setting up a value and liquidity
reserve to include the remaining securities in Caixa’s own portfolio and
associated hedges, except for equity stakes and securitised credit;
. Treasury management – funding in the money market, derivatives
associated with this activity and debt issuances exposed to market risk;
. Branches – CGD London, CGD New York and CGD Cayman;
Subsidiaries – Caixa Banco de Investimento, BCG Spain, BCG Brasil and
BNU Macau.
. Sensitivity analysis on all financial instruments sensitive to interest rate risk
recognised in Caixa’s separate financial statements and the following group
businesses;
. Caixa - Banco de Investimento;
. BCG Spain;
. BNU Macau.
. Sensitivity analysis on all financial instruments with optionality;
. Stress tests.
VaR analysis – market risk
VaR is an estimate of the maximum unrealised loss on a specific assets portfolio over a
given timeframe, considering a given confidence level based on normal market patterns.
The calculation methodology is one of historical simulation, i.e. future events are totally
explained by past events, based on the following presuppositions:
- holding period: 10 days (investment and own portfolios, branches and
subsidiaries) and 1 day (trading portfolio and treasury management);
- confidence level: 99% (investment and own portfolios, branches and
subsidiaries) and 95% (trading portfolio and treasury management);
- price sampling period: 730 calendar days;

CGD NOTES ON THE ACCOUNTS 193
NOTES TO THE CONSOLIDATED FINANCIAL STATEMENTS
- decay factor =1, i.e. all past observations carry the same weight.
The theoretical price for options is calculated by the use of adequate models and implied
volatility. Given the methodology used, correlations are not calculated but empirical.
The following is a breakdown of VaR, at June 30, 2016 and December 31, 2015:
Activity of Caixa Geral de Depósitos (headquarters and branches)
Held for Trading portfolio Group CGD (VaR 99%, 10 days)
30-06-2016 Maximum Minimum 31-12-2015
VaR by type of risk 21,739 23,889 18,504 22,804
Trading portfolio (VaR 95%, 1 day)
30-06-2016 Maximum Minimum 31-12-2015
VaR by type of risk
Interest rate 738 1,122 728 787
Foreign exchange rate 127 1,744 10 72
Price 59 208 25 118
Volatility - 3 - 2
Diversification effect (160) - - (163)
764 1,884 746 816
Treasury management (VaR 95%, 1 day)
30-06-2016 Maximum Minimum 31-12-2015
VaR by type of risk
Interest rate 2,024 2,077 359 449
Foreign exchange rate 6,244 8,538 2,694 4,973
Price - - - -
Volatility - - - -
Diversification effect (1,854) - - (144)
6,415 8,677 2,950 5,278

194 NOTES ON THE ACCOUNTS CGD
NOTES TO THE CONSOLIDATED FINANCIAL STATEMENTS
Own portfolio (VaR 99%, 10 days)
30-06-2016 Maximum Minimum 31-12-2015
VaR by type of risk
Interest rate 636 683 4 11
Foreign exchange rate 1,025 5,278 10 146
Price 3,221 3,221 2,654 2,879
Volatility - - - -
Diversification effect (1,570) - - (194)
3,311 4,787 2,177 2,841
Investment portfolio (VaR 99%, 10 days)
30-06-2016 Maximum Minimum 31-12-2015
VaR by type of risk
Interest rate 115,128 115,128 72,017 85,760
Foreign exchange rate 11 374 11 14
Price - - - -
Volatility - - - -
Diversification effect (5) - - (12)
115,135 115,135 72,026 85,762
London branch activity (VaR 99%, 10 days)
30-06-2016 Maximum Minimum 31-12-2015
VaR by type of risk
Interest rate 1,380 2,614 605 1,077
Foreign exchange rate 142 312 17 66
Price 1,045 1,772 995 1,179
Volatility 527 527 305 367
Diversification effect (1,450) - - (1,211)
1,645 2,852 1,106 1,478

CGD NOTES ON THE ACCOUNTS 195
NOTES TO THE CONSOLIDATED FINANCIAL STATEMENTS
Investment banking activity
The diversification effect is calculated implicitly. Total VaR refers to the combined effect
of interest rate, price, foreign exchange and volatility risks.
Caixa - Banco de Investimento (VaR 99%, 10 days)
30-06-2016 Maximum Minimum 31-12-2015
VaR by type of risk
Interest rate 12,489 16,543 11,319 12,701
Foreign exchange rate 705 2,659 53 2,514
Price 108 305 58 90
Volatility 576 888 489 850
Diversification effect (346) - - (1,378)
13,532 17,268 13,129 14,777

196 NOTES ON THE ACCOUNTS CGD
NOTES TO THE CONSOLIDATED FINANCIAL STATEMENTS
37. NOTE ADDED FOR TRANSLATION
The accompanying financial statements are a translation of financial statements originally
issued in Portuguese in accordance with generally accepted accounting principles in
Portugal. In the event of discrepancies, the Portuguese version language version
prevails.

CGD NOTES ON THE ACCOUNTS 197
EBA REPORTS
2.3. EBA Reports
ADOPTION OF FINANCIAL STABILITY FORUM (FSF) AND COMMITTEE OF
EUROPEAN BANKING AUTHORITY (EBA) RECOMMENDATIONS ON
TRANSPARENCY OF INFORMATION AND ASSETS MEASUREMENT
Bank of Portugal Circular Letter 97/2008/DSB of 03 December
I. Business Model
1.
Description of business model (i.e. reasons for
the development of activities/businesses and
their respective contribution to the value
creation process) and, if applicable, the
changes made (e.g. as a result of the period of
turmoil);
See Board of Directors’ Report 2015 - Chapters:
Message from the Chairman and CEO of
Board of Directors
Business Strategy and Operating
Segments
See Corporate Governance Report.
2.
Description of strategies and objectives
(including strategies and objectives specifically
related with securitisation operations and
structured products);
See I.1 above.
See Board of Directors’ Report 1st half 2016 –
Chapter:
Commercial banking
See Annex to the Consolidated Financial
Statements: Notes 12, 20 and 22, related to
securitisation operations and structured products.
3.
Description of the importance of the activities
performed and their respective contribution to
the business (including a quantitative
approach);
See Board of Director’s Report 2015 – Chapter:
Business Strategy and Operating
Segments
See Board of Director’s Report – 1st half 2016 –
Chapters:
Operating segments
Results, balance sheet, liquidity and
solvency
See Notes 25 and 35 of Annex to the
Consolidated Financial Statements.
4.
Description of the type of activities performed,
including a description of the instruments used,
their operation and qualification criteria with
which the products/investments must comply;
See items I.1 to I.3 above.
See Board of Directors’ Report 2015 – Chapter:
Risk management
See Board of Director’s Report – 1st half 2016:
Note 2 of Annex to the Consolidated Financial
Statements.
5.
Description of the objective and amplitude of
the institution's involvement (i.e. commitments
and obligations assumed) for each activity
performed;
See items I.1 to I.3 above.

198 NOTES ON THE ACCOUNTS CGD
EBA REPORTS
II. Risks and Risk Management
6.
Description of the nature and amplitude of the
risks incurred on activities performed and
instruments used;
See Board of Directors’ Report 2015 – Chapter:
Risk management
See Annex to the Consolidated Financial
Statements:
Note 40: containing a detailed description of the
financial risk management policies inherent to
the group’s activity, the monitoring thereof,
maximum exposure to credit risk, credit quality,
liquidity risk, interest rate risk, foreign exchange
risk, market risk and VaR analyses and
sensitivity to interest rate.
See Board of Director’s Report – 1st half 2016:
Note 36 of Annex to the Consolidated Financial
Statements.
7.
Description of risk management practices
relevant to the activities (particularly including
liquidity risk in the present context), description
of any fragilities/weaknesses identified and the
corrective measures taken;
See II.6 above.
III. Impact of period of financial turmoil on results
8.
A qualitative and quantitative description of the
results, particularly losses (when applicable)
and impact of write-downs on results;
See Board of Director’s Report – 1st half 2016 –
Chapter:
Results, balance sheet, liquidity and
solvency
See Notes 6, 8, 17 and 34 of Annex to the
Consolidated Financial Statements.
9.
Breakdown of write-downs/losses by types of
products and instruments affected by the period
of turmoil, namely: commercial mortgage-
backed securities (CMBS), residential
mortgage-backed securities (RMBS),
collateralised debt obligations (CDO), asset-
backed securities (ABS);
See Board of Director’s Report – 1st half 2016:
Note 36 of Annex to the Consolidated Financial
Statements, describing types of products and
instruments affected by the period of turmoil.

CGD NOTES ON THE ACCOUNTS 199
EBA REPORTS
III. Impact of period of financial turmoil on results
10.
Description of the reasons and factors
responsible for the impact;
See Board of Director’s Report – 1st half 2016,
namely in the following chapters:
Economic-financial Framework
Results, balance sheet, liquidity and
solvency
See items III. 8 and III.9 above.
11.
Comparison of:
i) Impacts between (relevant) periods;
ii) Financial statements before and after the
impact of the period of turmoil;
See items III.8 to III.10 above.
12. Breakdown of “write-downs” between realised
and unrealised amounts;
See Board of Director’s Report – 1st half 2016:
Items III.8 to III.10 above, particularly Note 36 of
Annex to the Consolidated Financial Statements.
13. Description of the influence of the financial
turmoil on the entity’s share prices;
N.A.
14.
Disclosure of maximum loss risk and
description of how the institution’s situation
could be affected by the prolongation or
worsening of the period of turmoil or market
recovery;
See Board of Director’s Report – 1st half 2016,
namely the following chapter:
Main risks and uncertainties in second
half 2016
See item III.10 above.
15.
Disclosure of impact of the evolution of the
spreads associated with the institution’s own
liabilities on results in addition to the methods
used to determine this impact;
See Board of Director’s Report – 1st half 2016 –
Chapter:
Results, balance sheet, liquidity and
solvency
Liabilities issued by CGD Group are recognised at
amortised cost.
IV. Levels and types of exposures affected by the period of turmoil
16.
Nominal (or amortised cost) and fair value of
"live” exposures;
See Board of Directors’ Report 2015:
Risk management
See Board of Director’s Report – 1st half 2016 -
Annex to the Consolidated Financial Statements:
Note 2
Note 36, setting out a comparison
between the fair and book value of assets
and liabilities recognised at amortised
cost.

200 NOTES ON THE ACCOUNTS CGD
EBA REPORTS
IV. Levels and types of exposures affected by the period of turmoil
17.
Information on credit risk mitigating factors (e.g.
credit default swaps) and respective effect on
present exposures;
See Board of Director’s Report – 1st half 2016 - Annex to the Consolidated Financial Statements:
Note 2, describes the accounting policies
for derivatives and hedge accounting
Note 10
Note 36
18.
Detailed disclosure of exposures, broken down
by:
- Level of seniority of exposures/tranches held;
- Level of credit quality (e.g. ratings, vintages);
- Geographic areas of origin; -Sector of activity;
- Origin of exposures (issued, retained or
acquired);
- Product characteristics: e.g. ratings,
weight/proportion of associated sub-prime
assets, discount rates, spreads, finance;
- Characteristics of underlying assets: e.g.
vintages, loan-to-value ratio, credit rights;
weighted average life of underlying asset,
presuppositions on the evolution of prepayment
situations, expected losses.
See Board of Director’s Report – 1st half 2016:
Note 36 of Annex to the Consolidated Financial
Statements.
19.
Movements occurring in exposures between
relevant reporting periods and reasons
underlying such changes (sales, write-downs,
purchases, etc.);
See items III.8 to III.15 above.
20.
Explanations of exposures (including “vehicles”
and, in this case, respective activities) which
have not been consolidated (or which have
been recognised during the crisis) and
associated reasons;
N.A.

CGD NOTES ON THE ACCOUNTS 201
EBA REPORTS
IV. Levels and types of exposures affected by the period of turmoil
21.
Exposure to monoline type insurance
companies and quality of insured assets:
- Nominal amount (or amortised cost ) of
insured exposures in addition to the amount of
credit protection acquired;
- Fair value of "live” exposures and respective
credit protection;
- Value of write-downs and losses, split up
between realised and unrealised amounts;
- Breakdown of exposures by rating or
counterparty.
CGD does not have any exposure to monoline
type insurance companies.
V. Accounting policies and valuation methods
22.
Classification of transactions and structured
products for accounting and respective
processing purposes;
See Board of Director’s Report – 1st half 2016:
Note 2 of Annex to the Consolidated Financial
Statements, setting out a description of the
financial instruments and how they are processed
in the accounts.
23.
Consolidation of Special Purpose Entities
(SPEs) and other "vehicles" and their
reconciliation with the structured products
affected by the period of turmoil;
N.A.
24.
Detailed disclosure of the fair value of financial
instruments :
- Financial instruments at fair value;
- Fair value ranking (breakdown of all
exposures measured at fair value in the fair
value ranking and breakdown between liquid
assets and derivative instruments in addition to
disclosure of information on migration between
ranking levels);
- Processing of “day 1 profits” (including
quantitative information);
- Use of fair value option (including conditions
of use) and respective amounts (with an
adequate breakdown);
See Board of Director’s Report – 1st half 2016:
- Notes 7, 8 and 36 of Annex to the Consolidated
Financial Statements.
See item IV.16 above, particularly the
presentation of the determination of the fair value
of the financial instruments.

202 NOTES ON THE ACCOUNTS CGD
EBA REPORTS
V. Accounting policies and valuation methods
25.
Description of modelling techniques used to
value financial instruments, including information
on:
- Modelling techniques and instruments on which
they are applied;
- Valuation processes (particularly including the
assumptions and inputs upon which the models
are based);
- Types of adjustment applied to reflect the
modelling risk and other valuation uncertainties;
- Sensitivity of fair value (namely changes to
assumptions and key inputs);
- Stress Scenarios.
See Board of Directors’ Report 2015:
Note 40 of Annex to the Consolidated Financial
Statements;
See Board of Director’s Report – 1st half 2016:
Note 2 and 36 of Annex to the Consolidated
Financial Statements, setting out information and
processes applied by CGD in the valuation of
financial instruments.
VI. Other relevant disclosure aspects
26.
Description of disclosure policies and principles
used for reporting disclosures and financial
reporting.
See Board of Director’s Report – 1st half 2016:
Note 2 of Annex to the Consolidated Financial
Statements.

Caixa Geral de Depósitos, S.A. • Head Office: Av. João XXI, 63 – 1000-300 Lisboa • Share Capital EUR 5,900,000,000 • Registered with the Lisbon Companies Registry and Tax Payer no. 500 960 046