24th jan 2011 saxo bank soho presentation
40
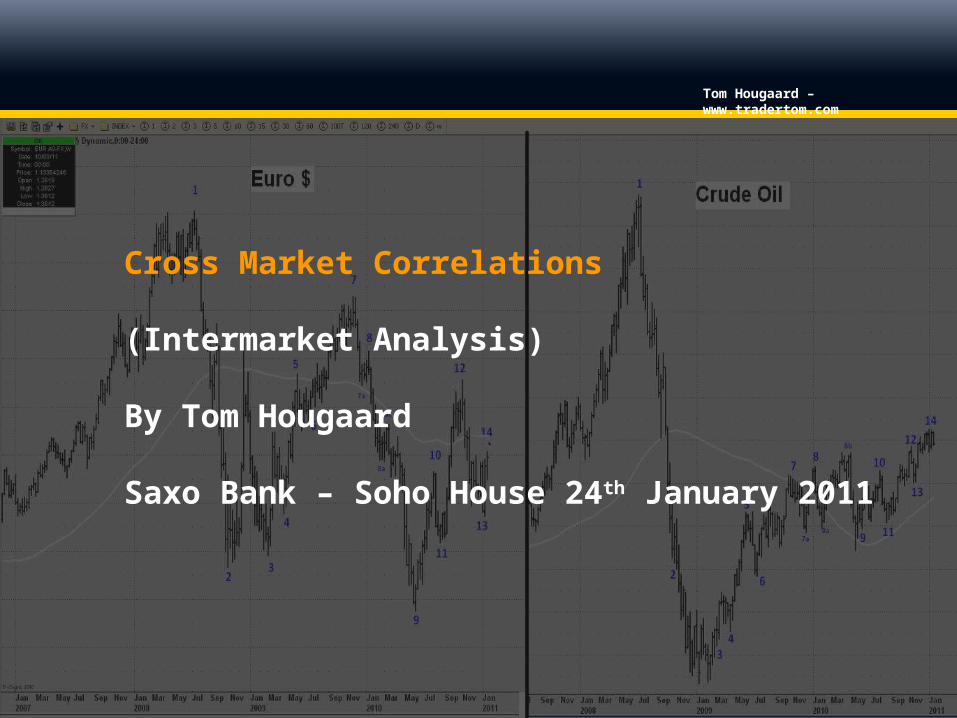
Tom Hougaard – www.tradertom.com Cross Market Correlations (Intermarket Analysis) By Tom Hougaard Saxo Bank – Soho House 24 th January 2011
-
Upload
saxobanklondon -
Category
Education
-
view
643 -
download
2
Transcript of 24th jan 2011 saxo bank soho presentation
Tom Hougaard – www.tradertom.com
Cross Market Correlations
(Intermarket Analysis)
By Tom Hougaard
Saxo Bank – Soho House 24th January 2011
Tom Hougaard – www.tradertom.com
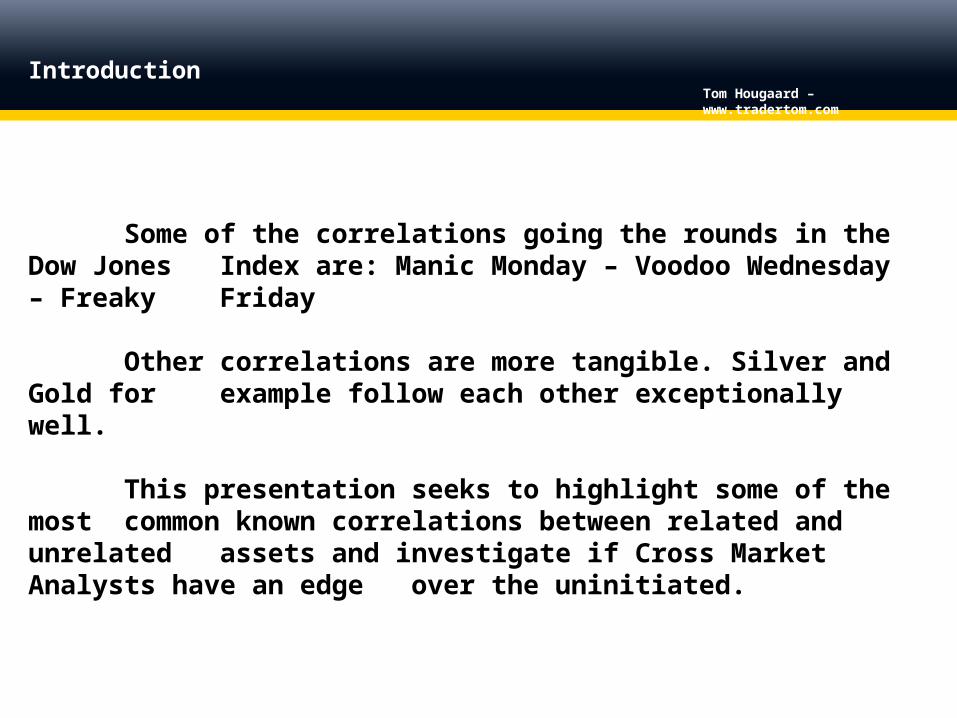
Some of the correlations going the rounds in the Dow Jones Index are: Manic Monday – Voodoo Wednesday – Freaky
Friday
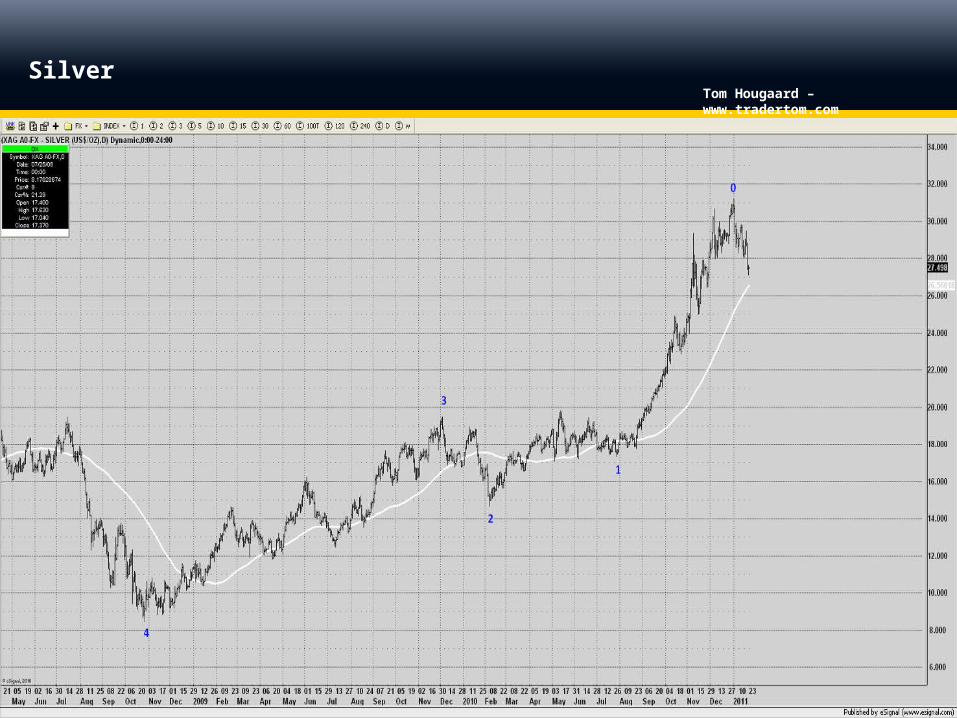
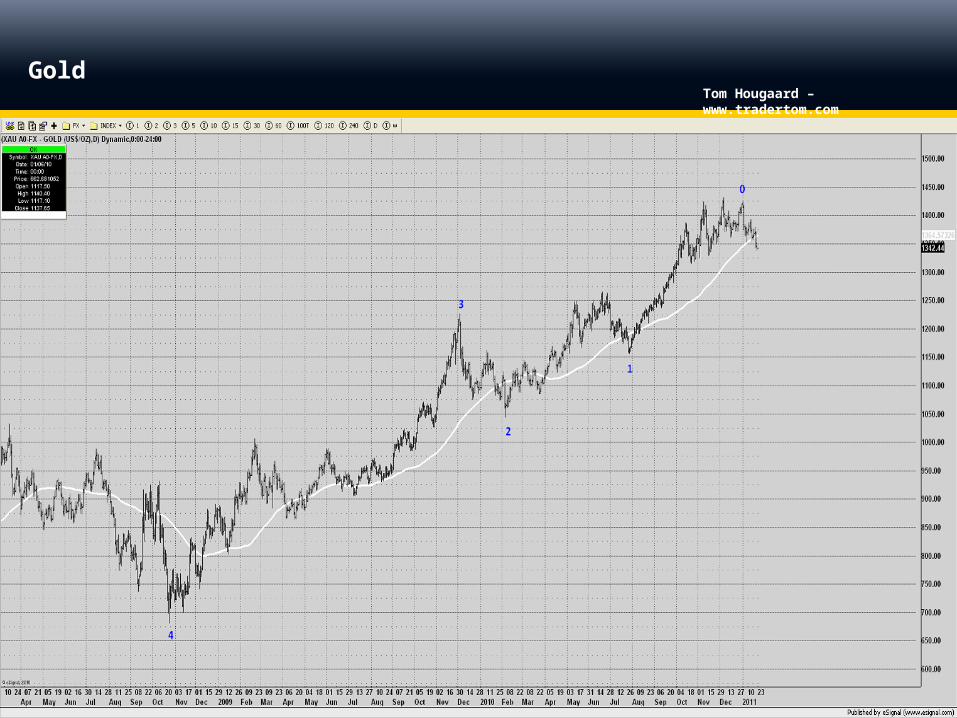
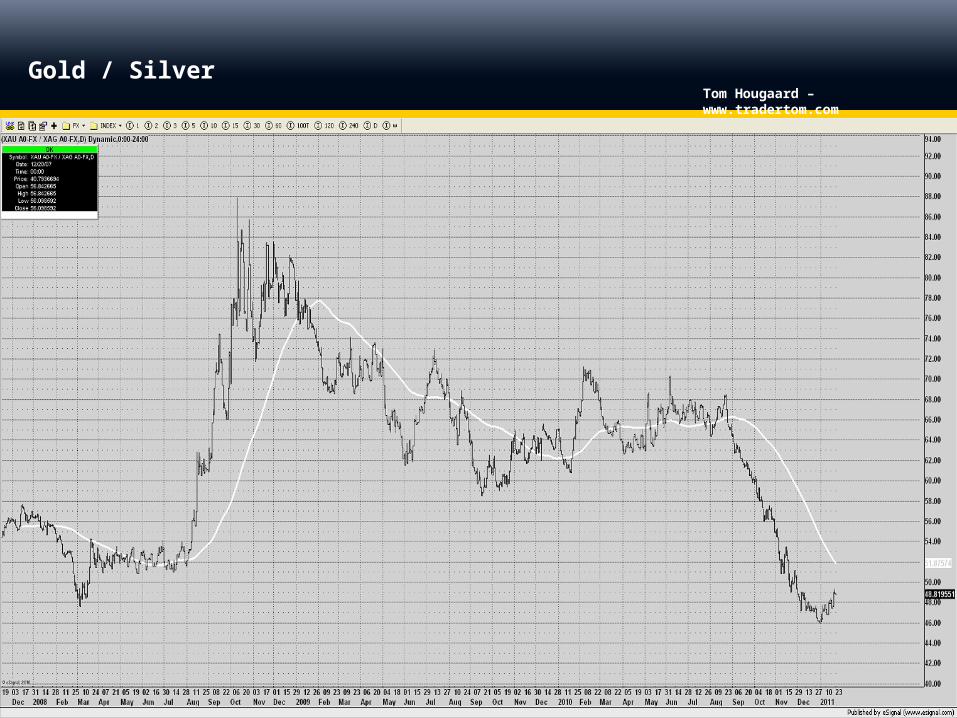
Other correlations are more tangible. Silver and Gold for example follow each other exceptionally well.
This presentation seeks to highlight some of the most common known correlations between related and unrelated assets and investigate if Cross Market Analysts have an edge over the uninitiated.
Introduction
Tom Hougaard – www.tradertom.com
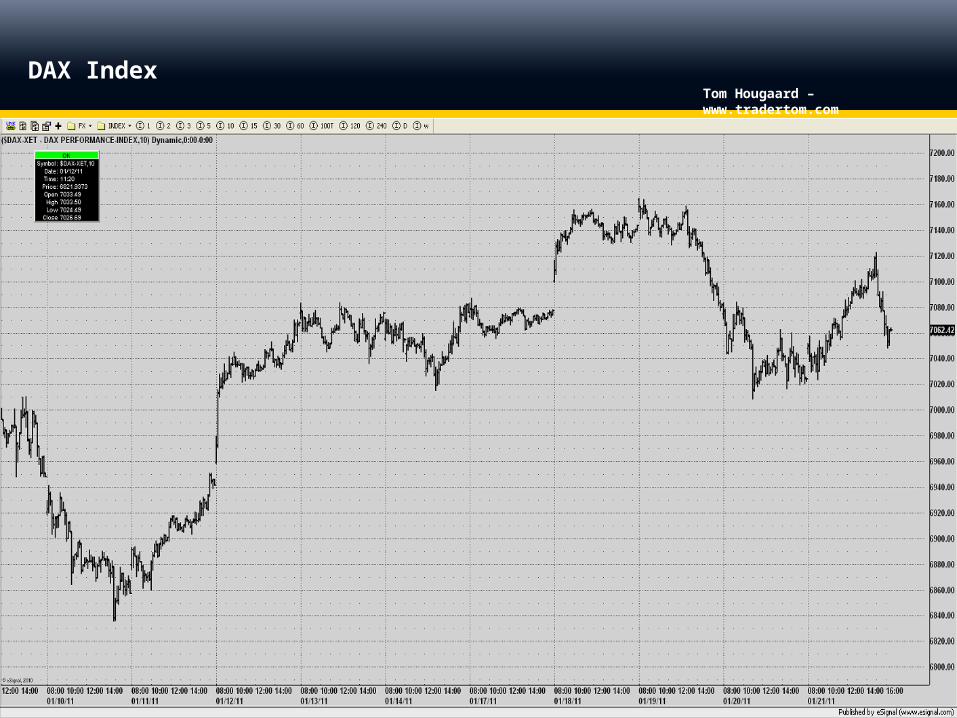
DAX Index
Tom Hougaard – www.tradertom.com
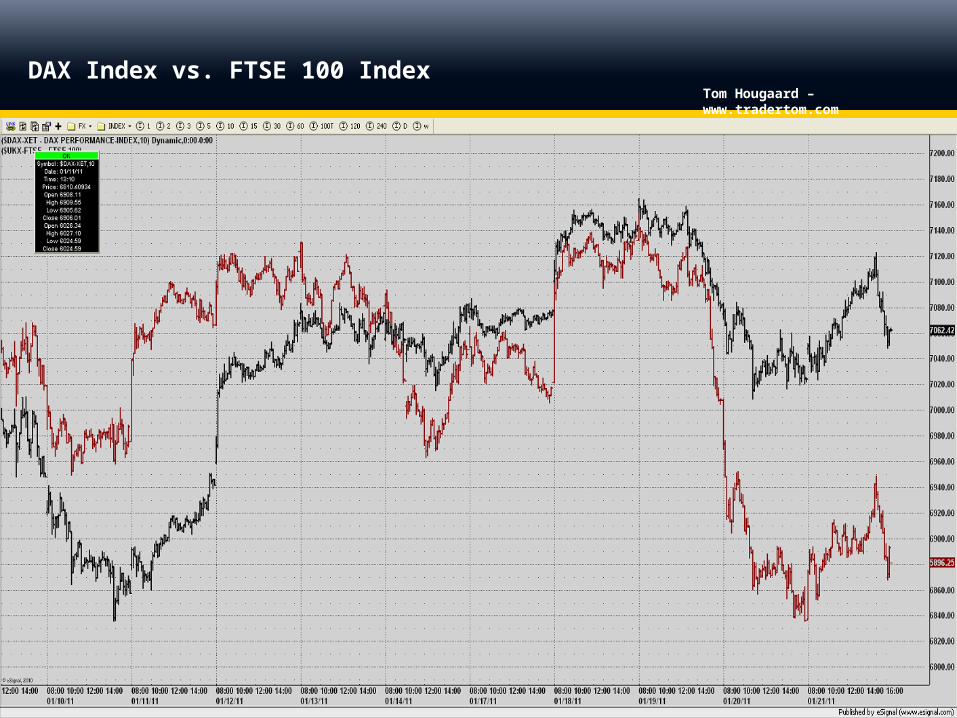
DAX Index vs. FTSE 100 Index
Tom Hougaard – www.tradertom.com
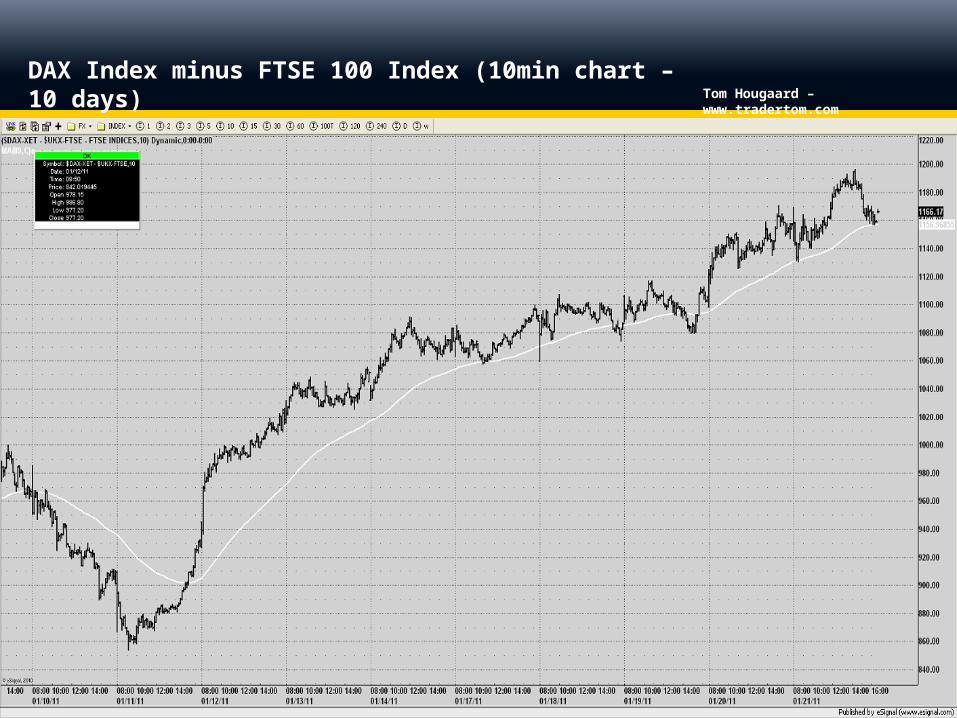
DAX Index minus FTSE 100 Index (10min chart – 10 days)

Tom Hougaard – www.tradertom.com
DAX Index minus FTSE 100 Index (2H chart – 5 months)
Tom Hougaard – www.tradertom.com
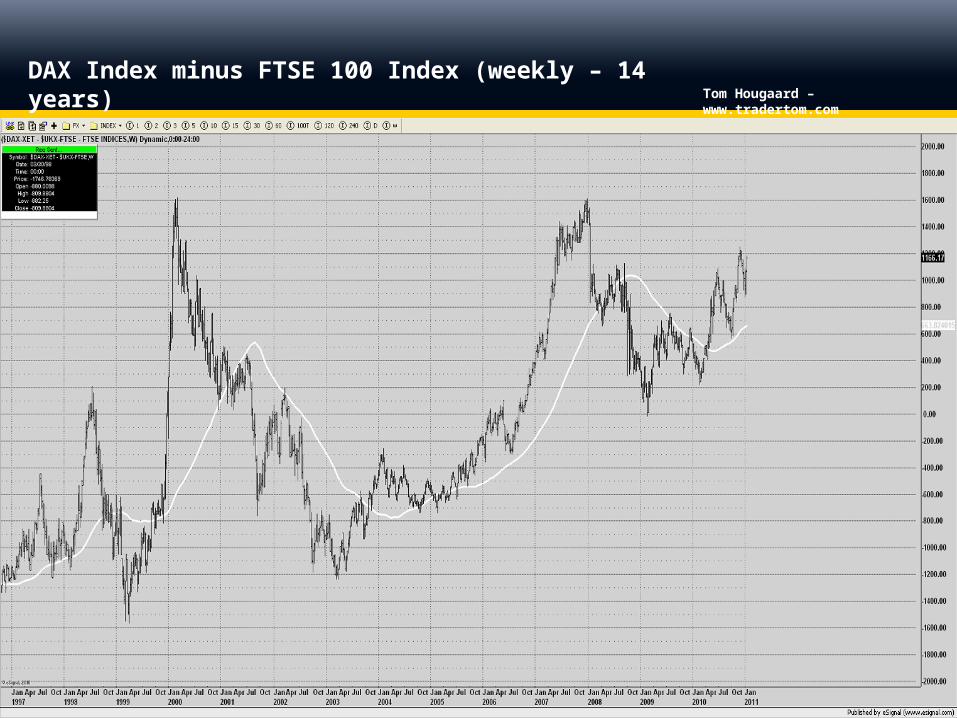
DAX Index minus FTSE 100 Index (weekly – 14 years)

Tom Hougaard – www.tradertom.com
Euro $ vs. Crude Oil – weekly Chart
Tom Hougaard – www.tradertom.com
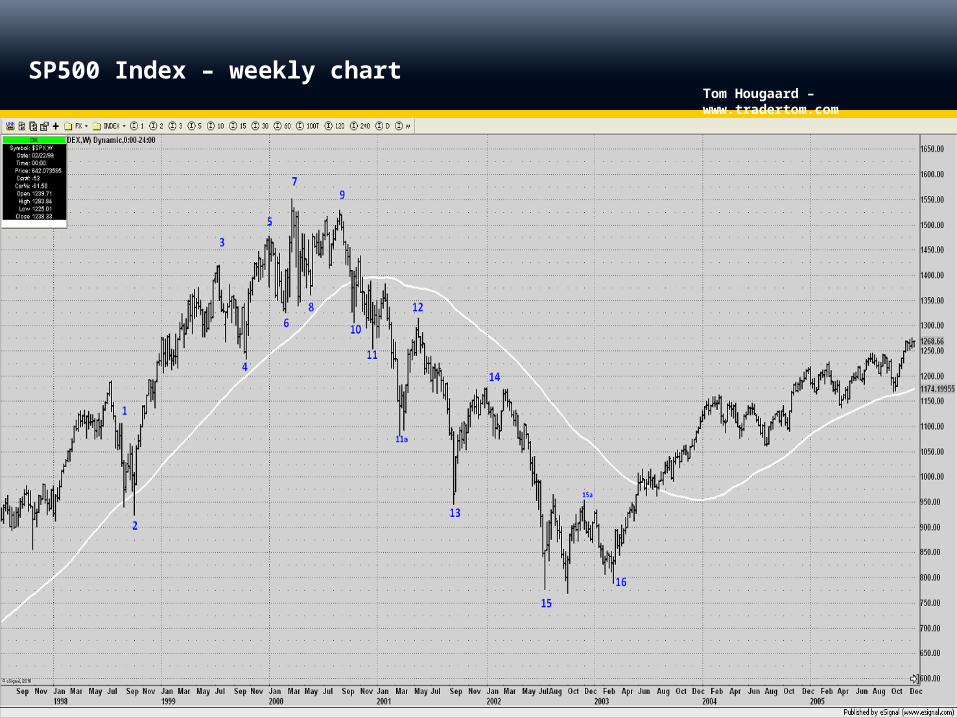
SP500 Index – weekly chart
Tom Hougaard – www.tradertom.com
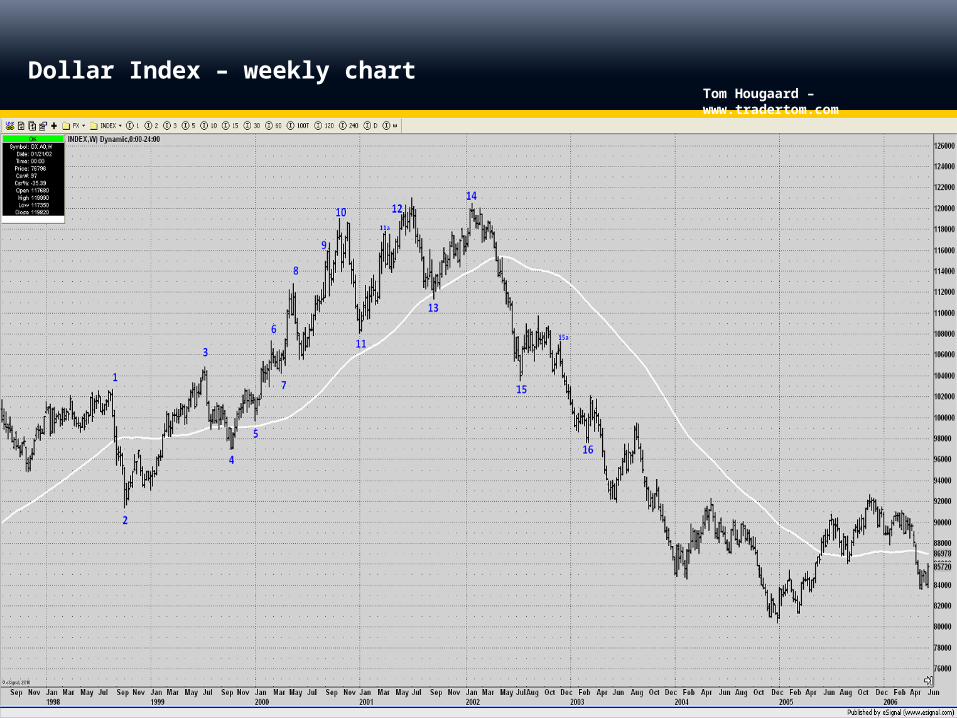
Dollar Index – weekly chart
Tom Hougaard – www.tradertom.com
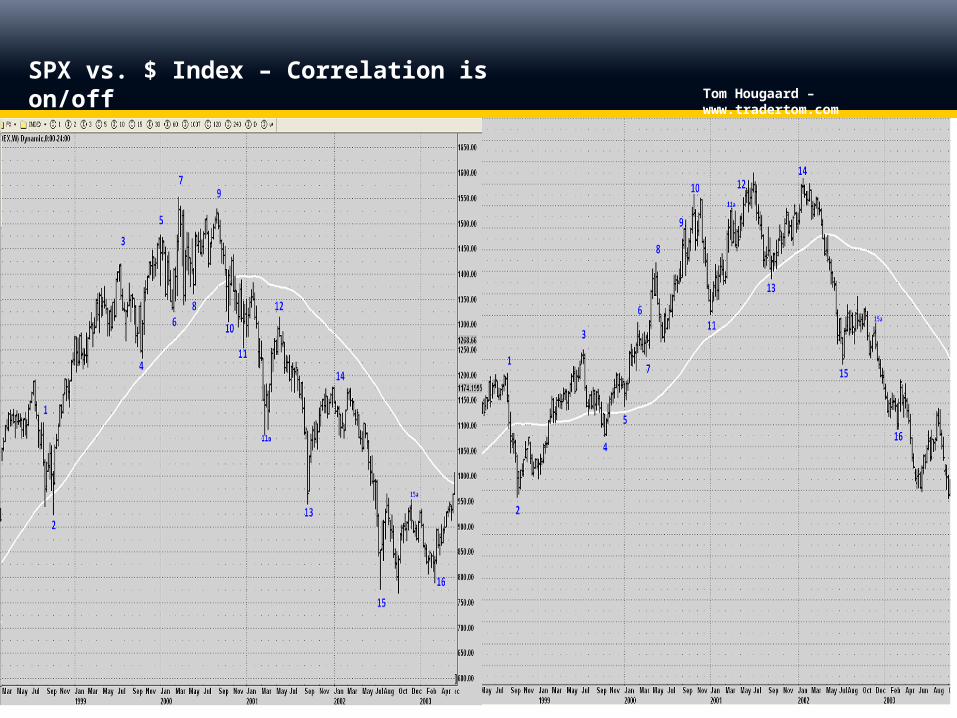
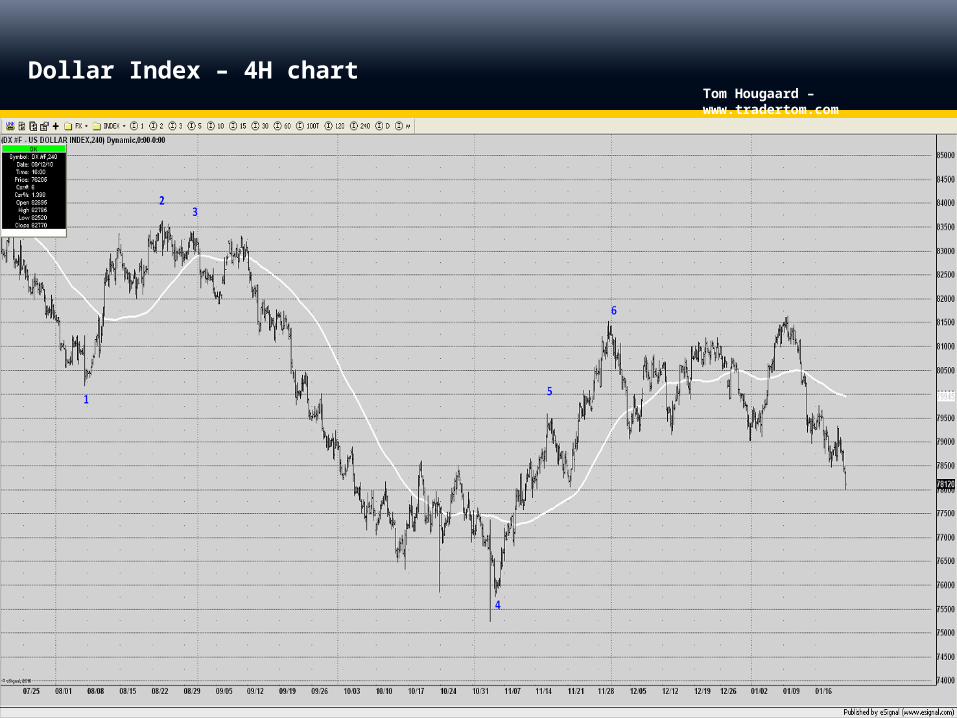
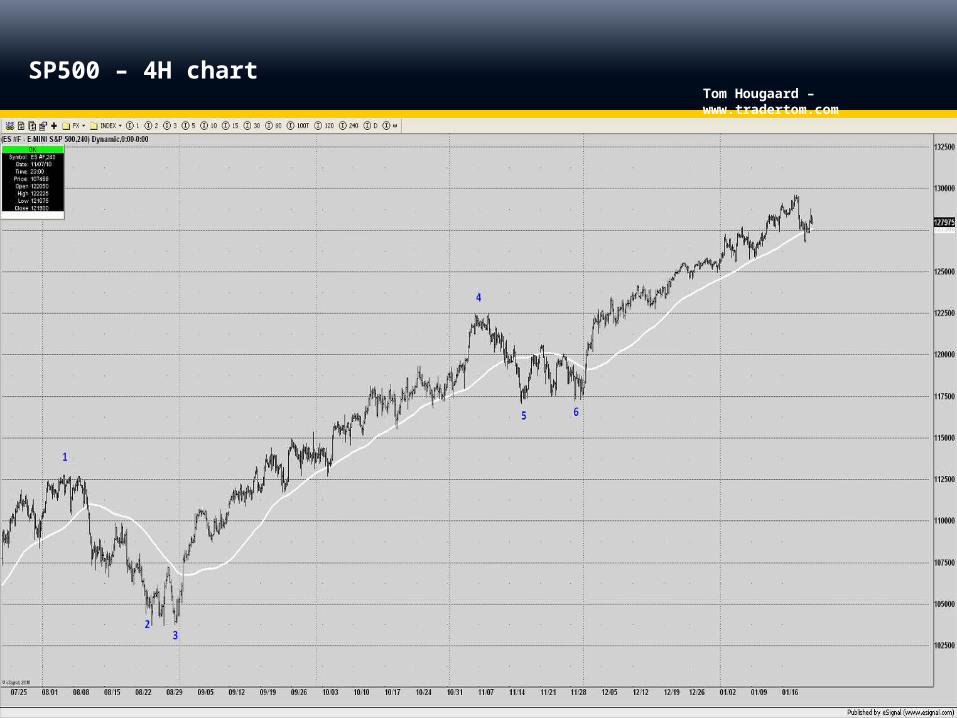
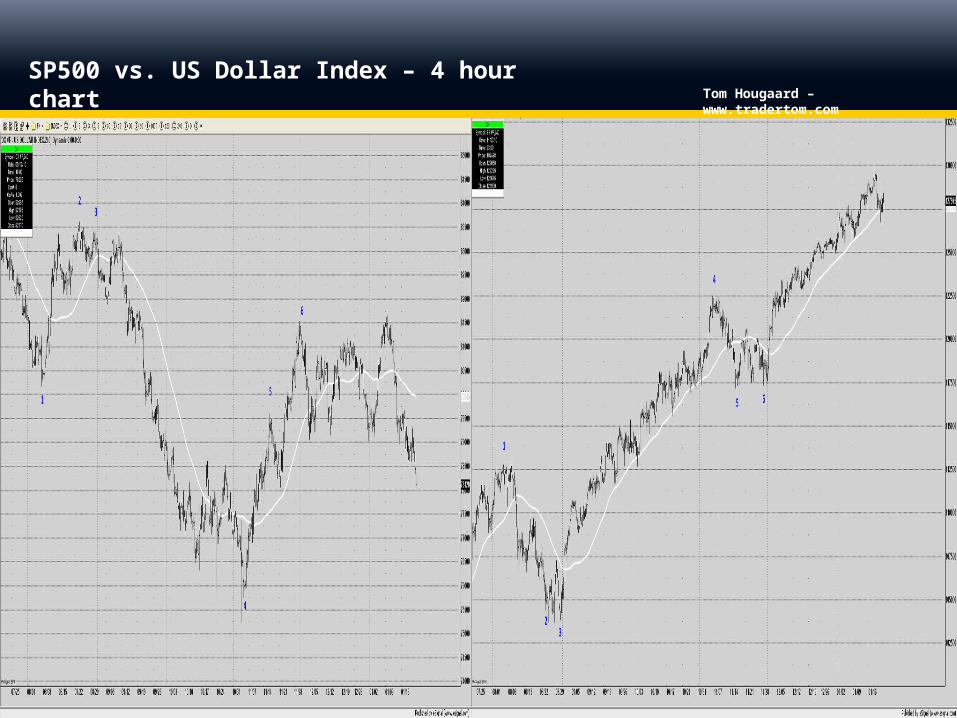
SPX vs. $ Index – Correlation is on/off
Tom Hougaard – www.tradertom.com
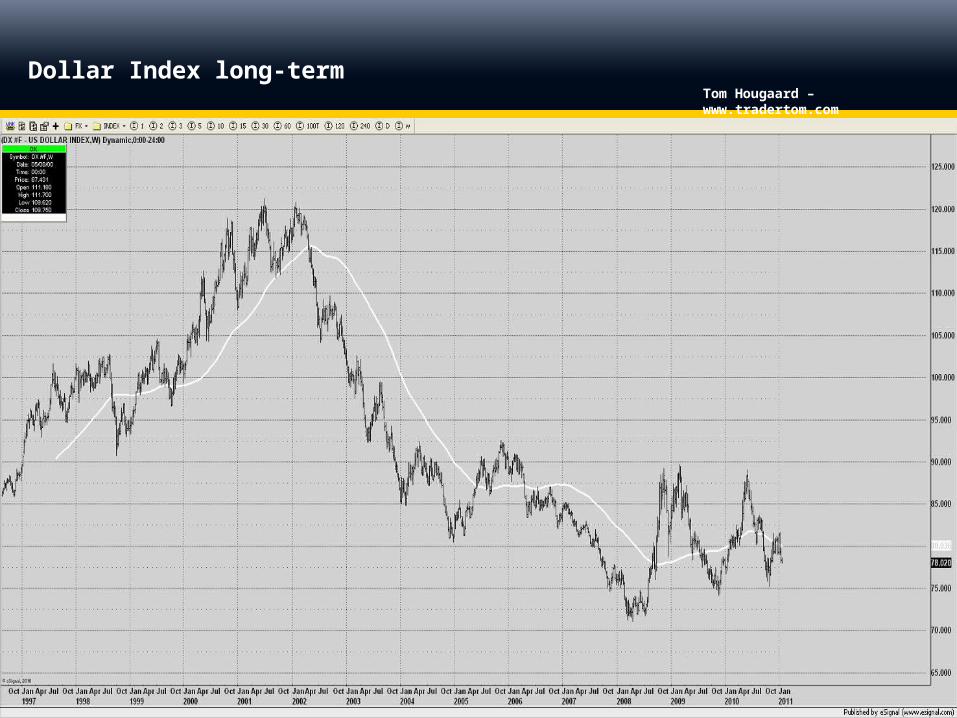
Dollar Index long-term
Tom Hougaard – www.tradertom.com
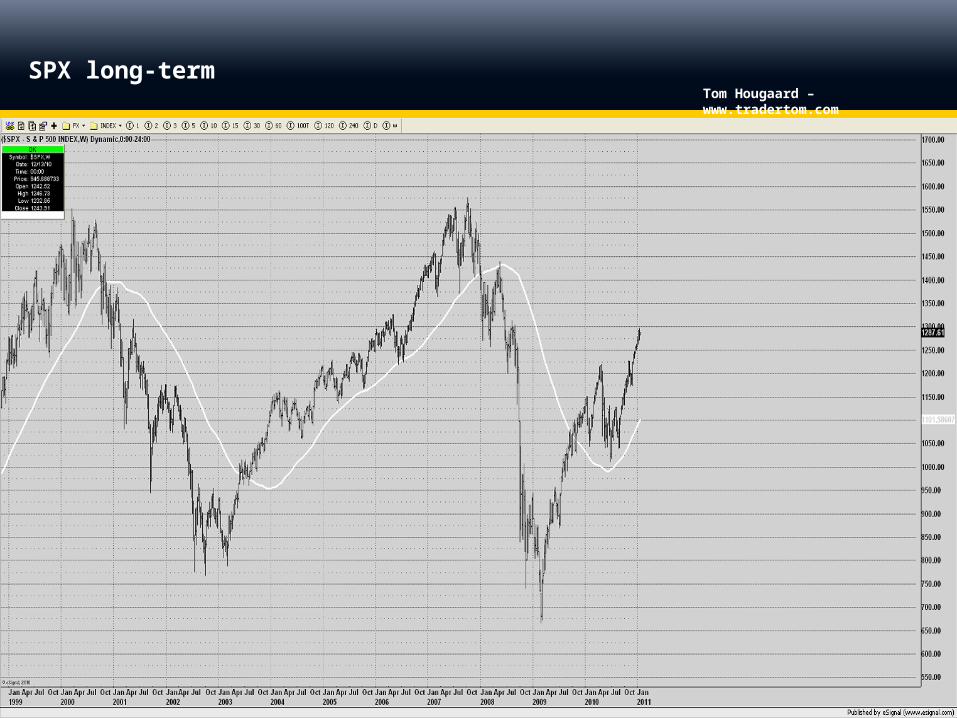
SPX long-term
Tom Hougaard – www.tradertom.com
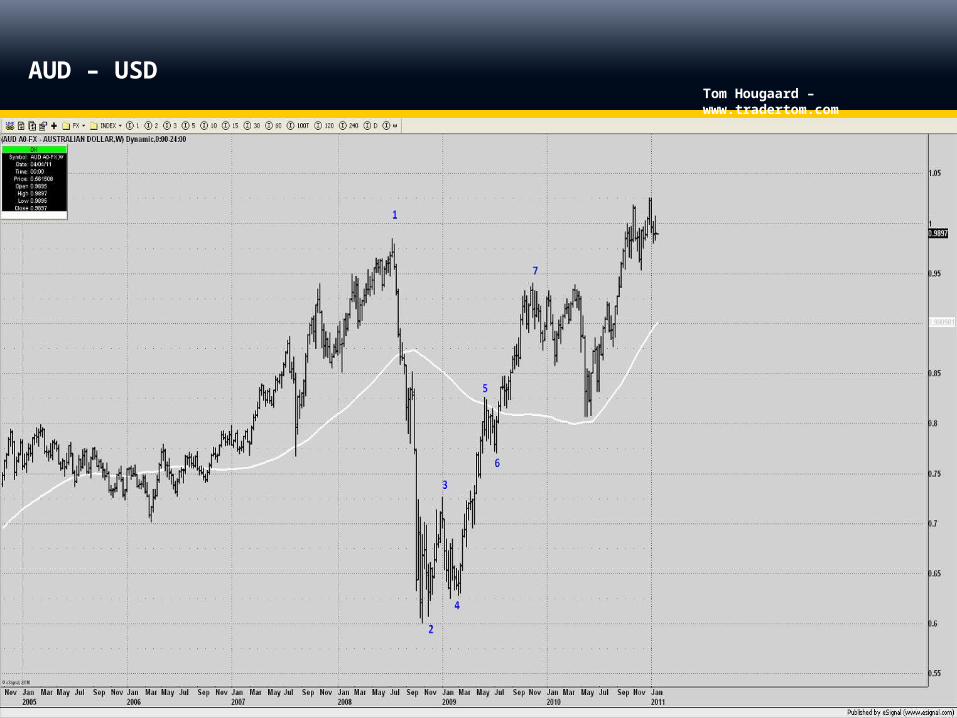
Commodities vs. Australian Dollar
The AUD USD has a significant correlation to agricultural commodities.
Grains are priced in US Dollars. An expensive $ reduces overseas demand for dollar denominated grain supplies. This tends to apply to all commodities, except if there is weather related price fluctuations.
The Australian dollar is known as a commodity currency.
Tom Hougaard – www.tradertom.com
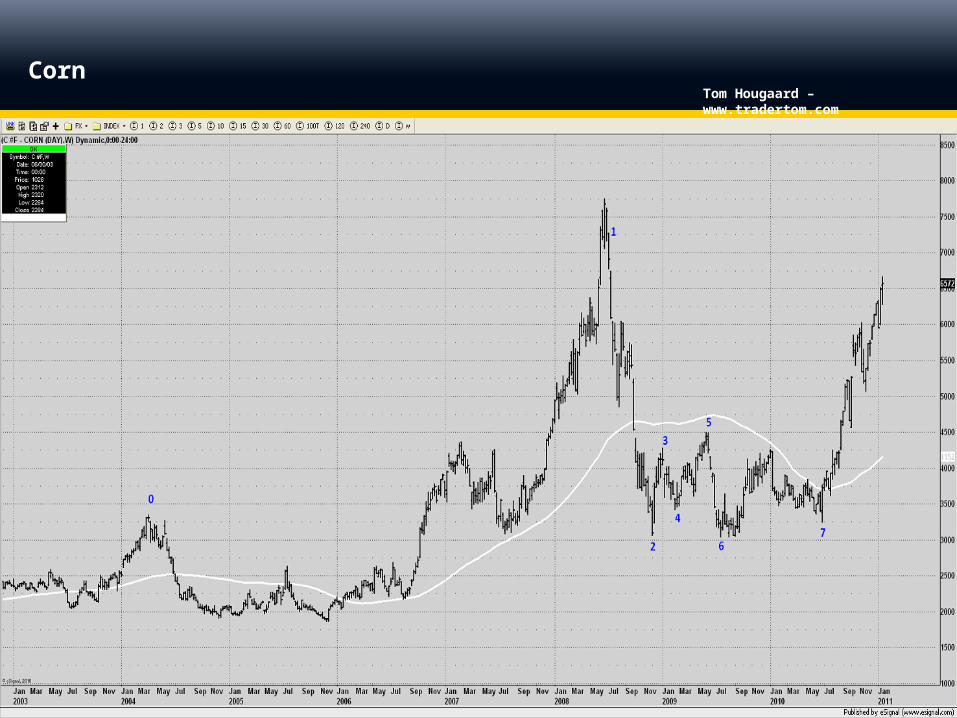
Corn
Tom Hougaard – www.tradertom.com
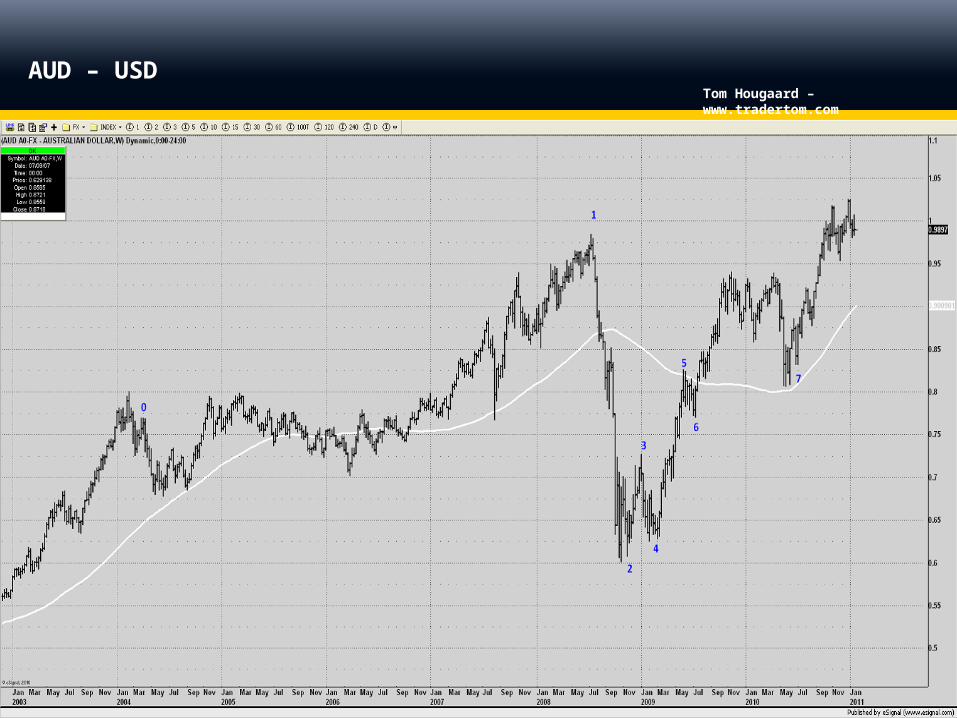
AUD – USD
Tom Hougaard – www.tradertom.com
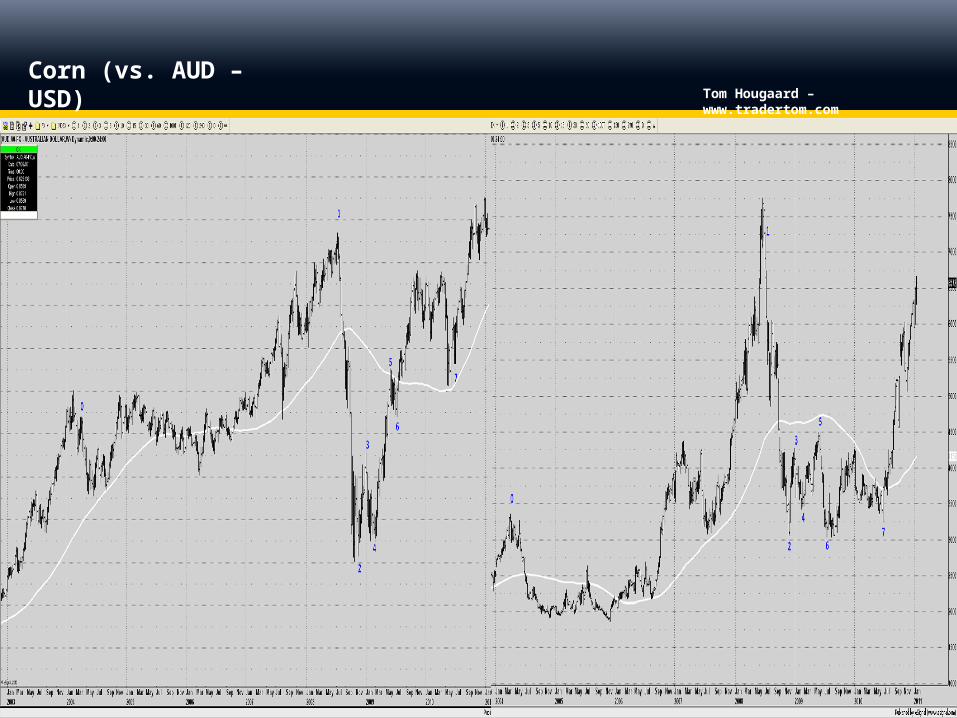
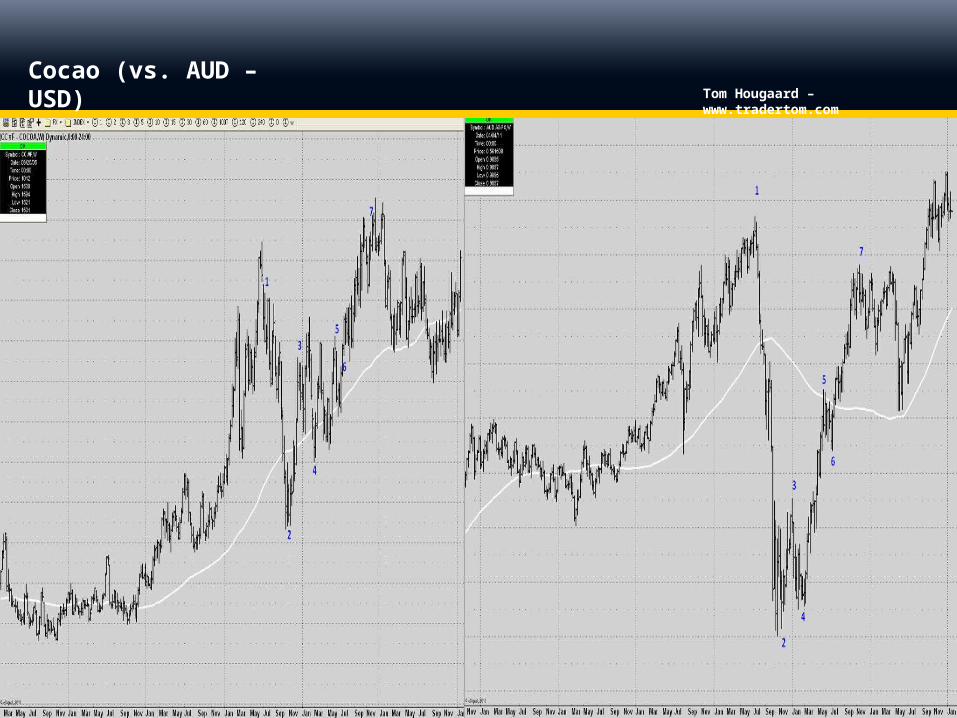
Corn (vs. AUD – USD)
Tom Hougaard – www.tradertom.com
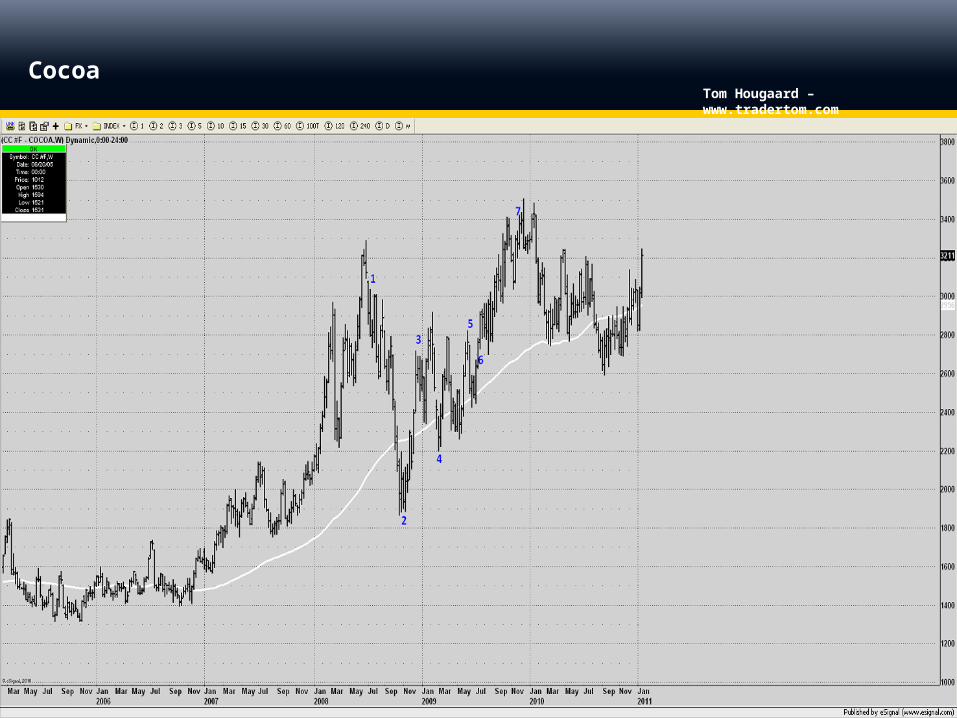
Cocoa
Tom Hougaard – www.tradertom.com
AUD – USD
Tom Hougaard – www.tradertom.com
Cocao (vs. AUD – USD)
Tom Hougaard – www.tradertom.com
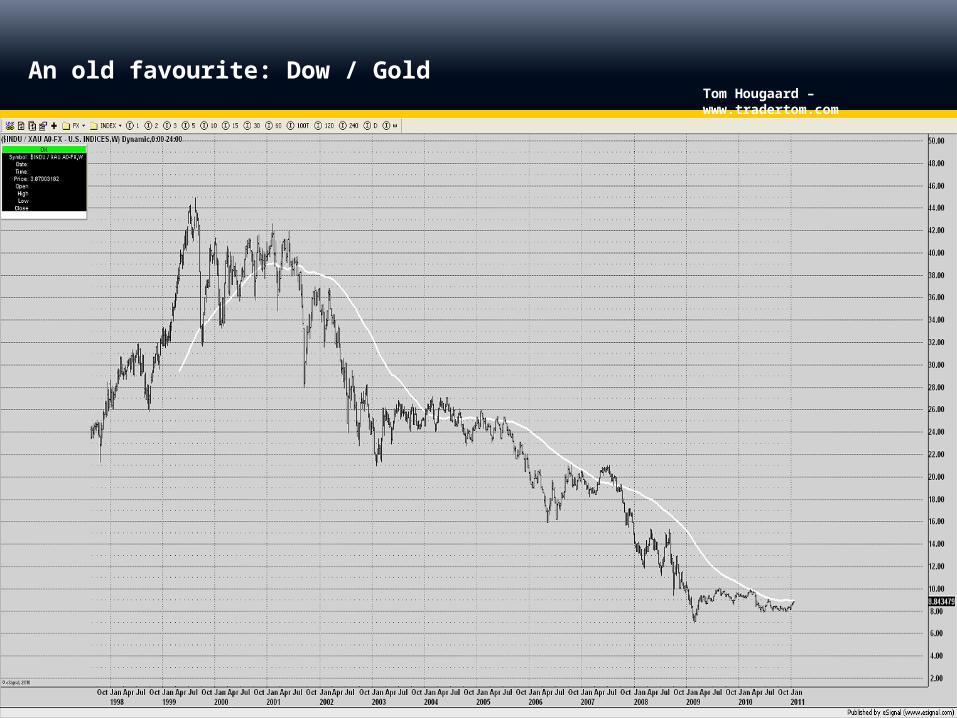
An old favourite: Dow / Gold
Tom Hougaard – www.tradertom.com
Dollar Index – 4H chart
Tom Hougaard – www.tradertom.com
SP500 – 4H chart
Tom Hougaard – www.tradertom.com
SP500 vs. US Dollar Index – 4 hour chart
Tom Hougaard – www.tradertom.com
Silver
Tom Hougaard – www.tradertom.com
Gold
Tom Hougaard – www.tradertom.com
Gold / Silver
Tom Hougaard – www.tradertom.com
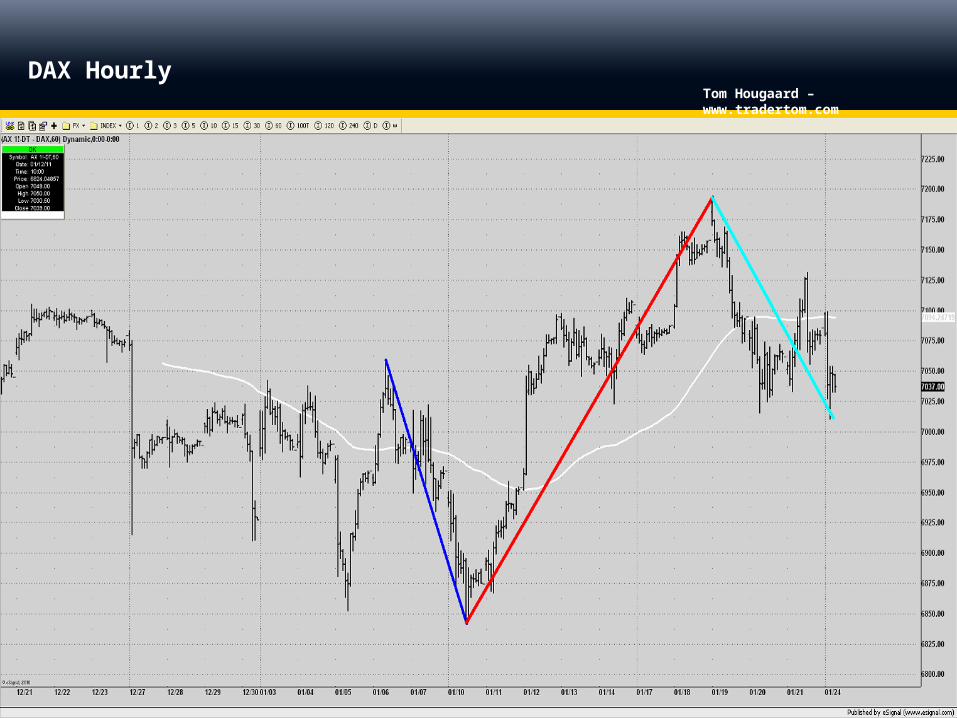
DAX Hourly

Tom Hougaard – www.tradertom.com
EURJPY 60-min
Tom Hougaard – www.tradertom.com
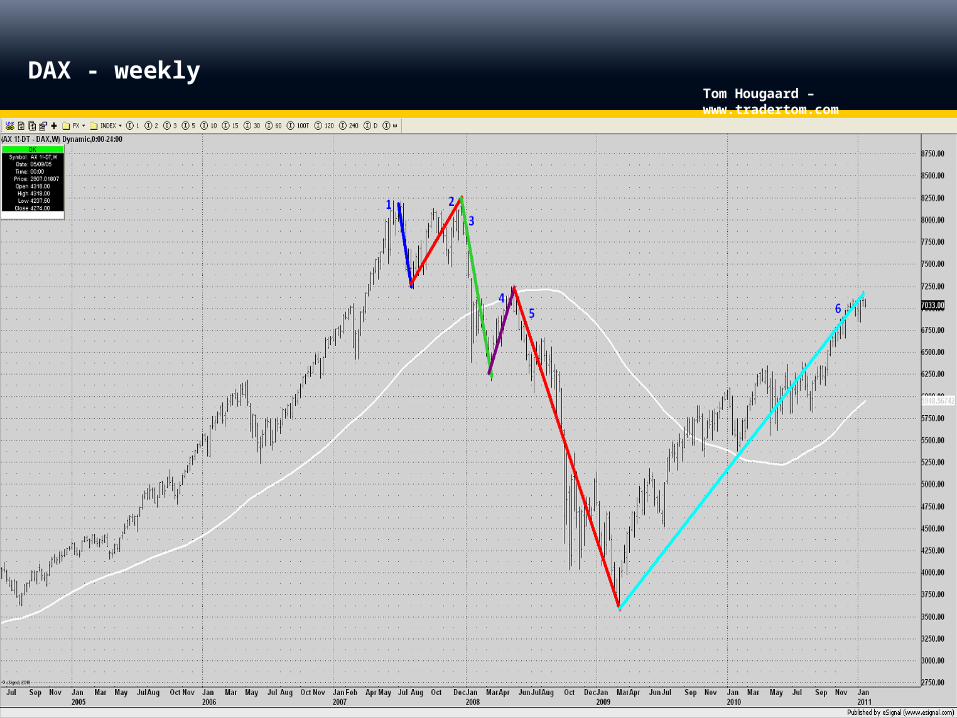
DAX - weekly
Tom Hougaard – www.tradertom.com
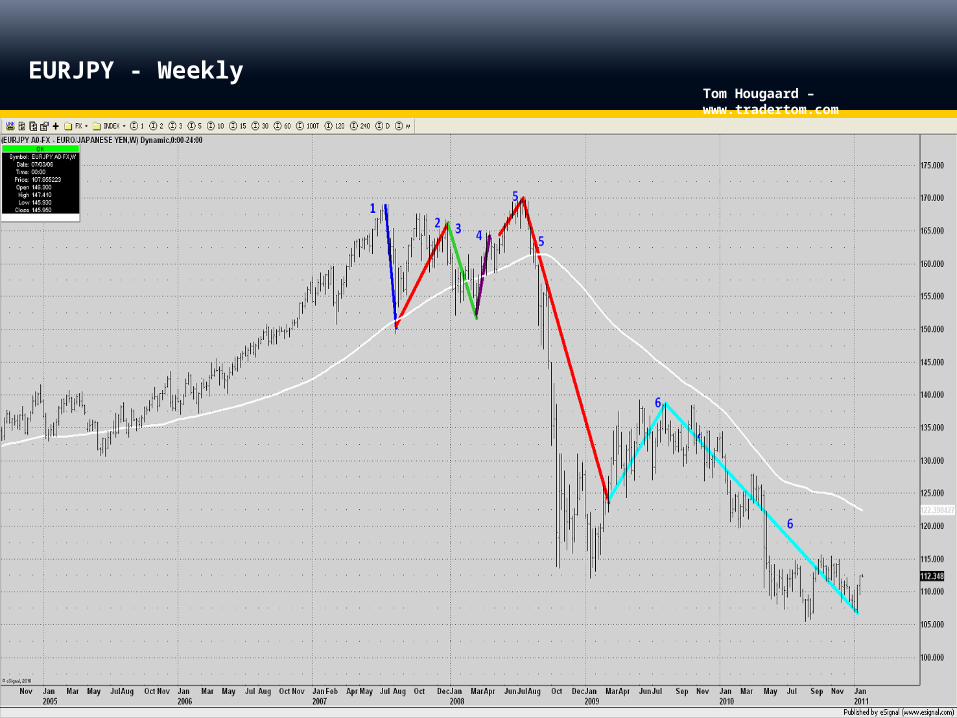
EURJPY - Weekly
Tom Hougaard – www.tradertom.com
Correlations are soothing, yet fickle
What’s happened to one of the best established correlations: Dow vs. 10-year Treasury notes
Bonds UP – Dow Down”
Conclusion – so far
Tom Hougaard – www.tradertom.com
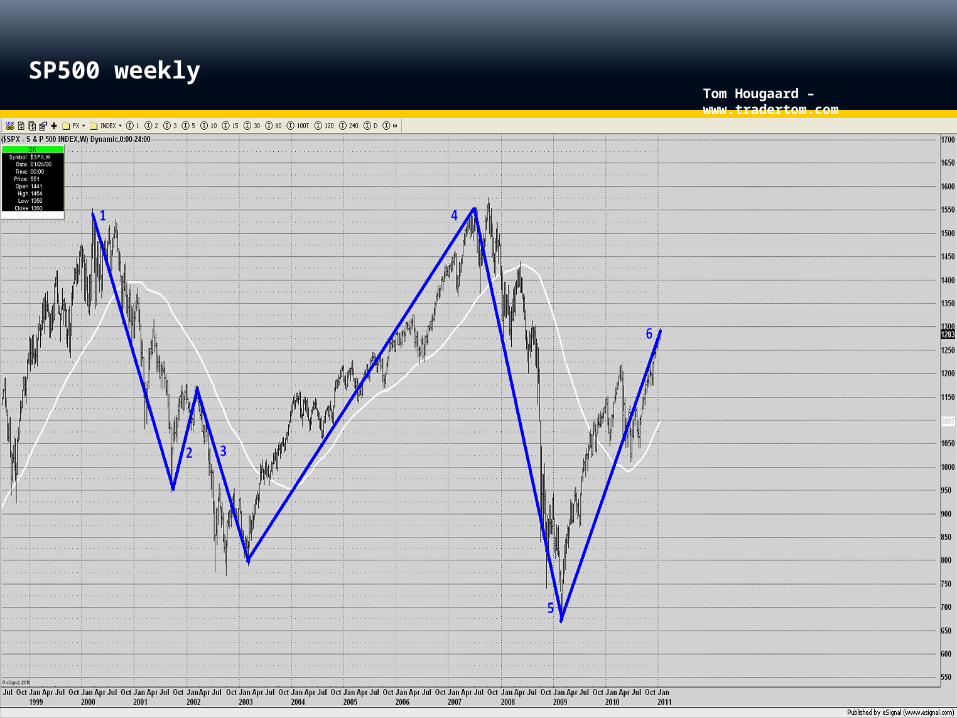
SP500 weekly
Tom Hougaard – www.tradertom.com
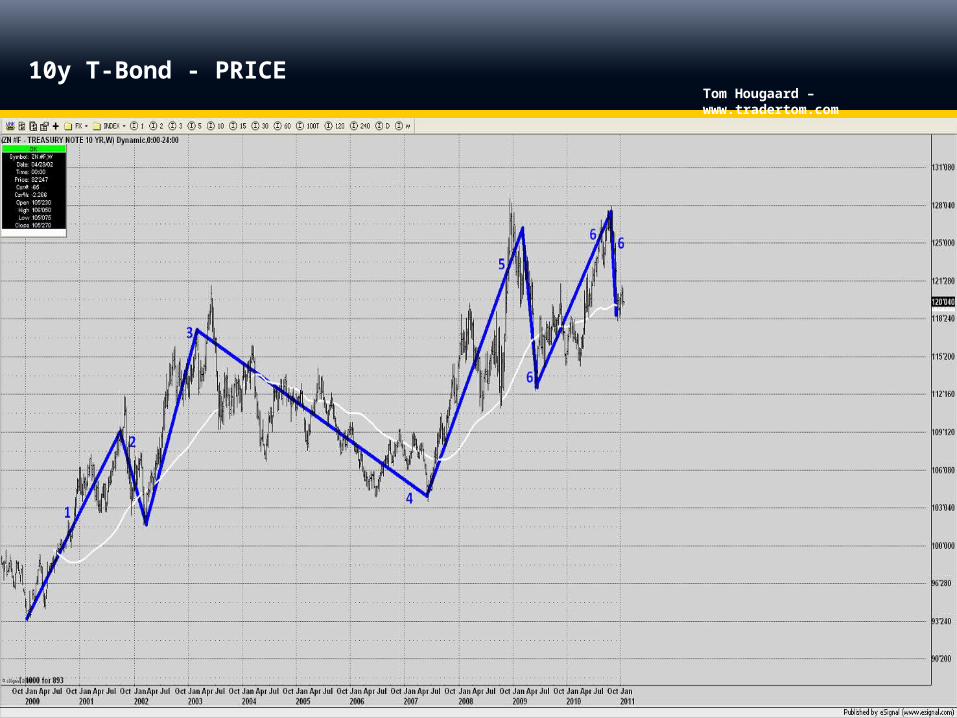
10y T-Bond - PRICE
Tom Hougaard – www.tradertom.com
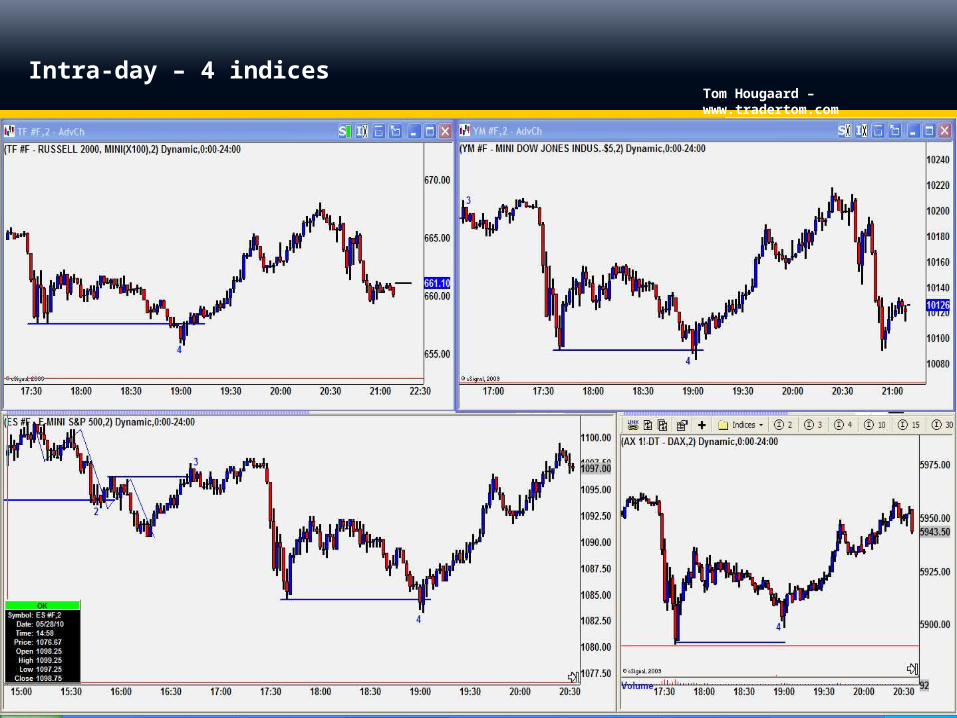
Intra-day – 4 indices
Tom Hougaard – www.tradertom.com
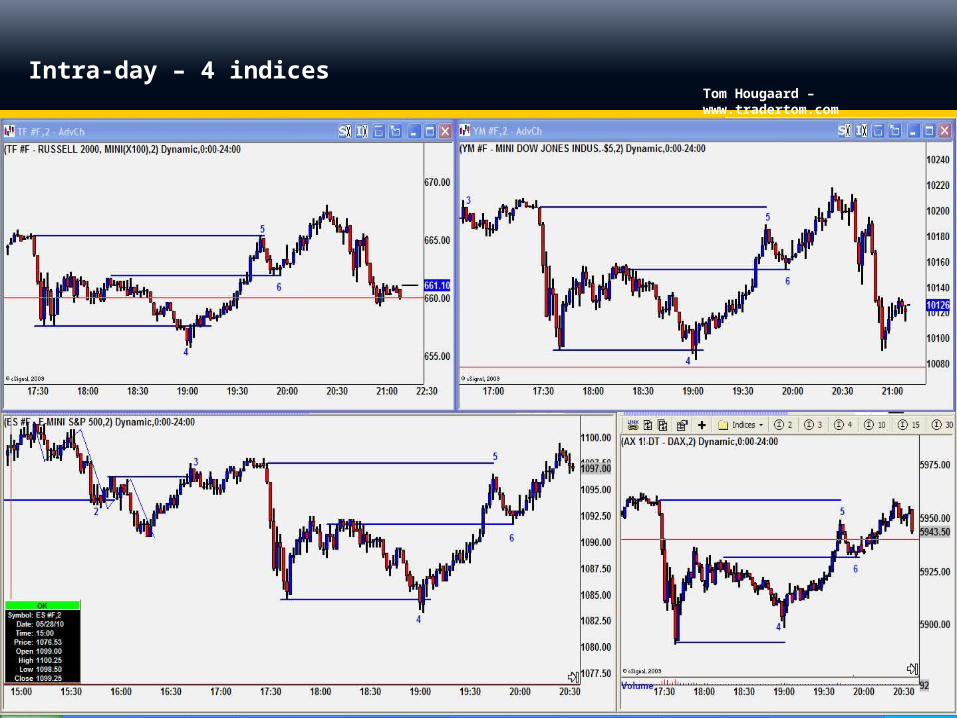
Intra-day – 4 indices
Tom Hougaard – www.tradertom.com
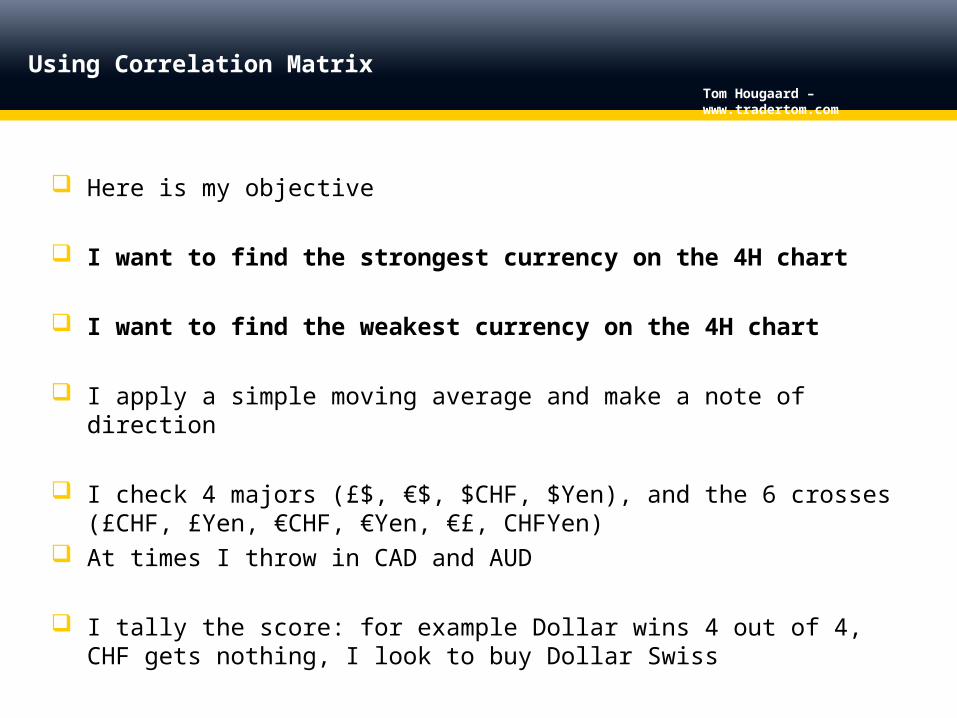
Here is my objective
I want to find the strongest currency on the 4H chart
I want to find the weakest currency on the 4H chart
I apply a simple moving average and make a note of direction
I check 4 majors (£$, €$, $CHF, $Yen), and the 6 crosses (£CHF, £Yen, €CHF, €Yen, €£, CHFYen)
At times I throw in CAD and AUD
I tally the score: for example Dollar wins 4 out of 4, CHF gets nothing, I look to buy Dollar Swiss
Using Correlation Matrix
Tom Hougaard – www.tradertom.com
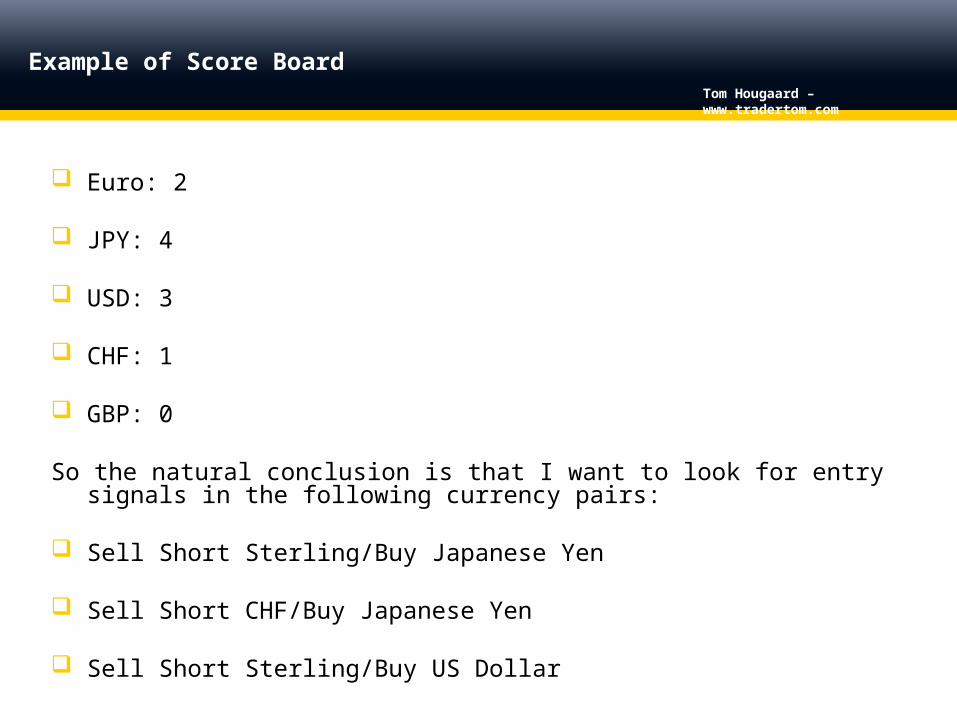
Example of Score Board
Euro: 2
JPY: 4
USD: 3
CHF: 1
GBP: 0
So the natural conclusion is that I want to look for entry signals in the following currency pairs:
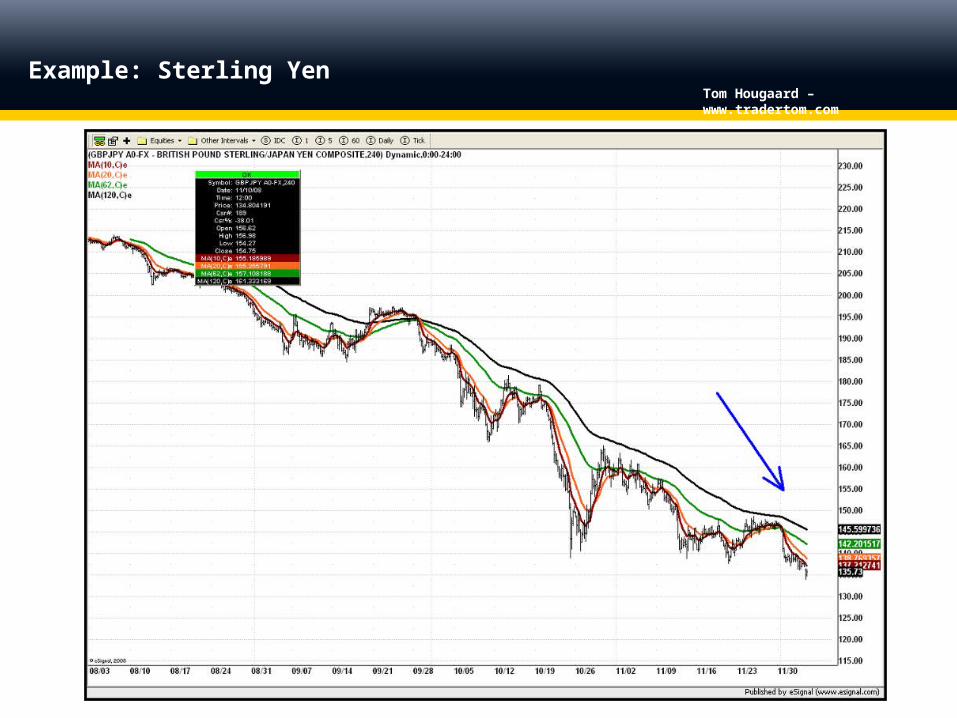
Sell Short Sterling/Buy Japanese Yen
Sell Short CHF/Buy Japanese Yen
Sell Short Sterling/Buy US Dollar
Tom Hougaard – www.tradertom.com
Example: Sterling Yen
Tom Hougaard – www.tradertom.com
“There has to be a reason” why the correlations come and go. For bonds vs. stocks it is most likely QE.
However, as a trader my job is not to explain WHY something has happened or is happening, but to swiftly acknowledge it and react accordingly.
My conclusion is that correlations, be it in the stock market, currency market or fixed income should be used with GREAT care.
Correlations look great after the fact. Don’t forget though that it was LTCM fund that nearly broke down the entire US economy in 1997-1998 by trading correlations!!
Conclusion