24.910 Laboratory Phonology - MIT OpenCourseWare · PDF file• E.g. Question/answer pairs:...
51
MIT OpenCourseWare http://ocw.mit.edu 24.910 Topics in Linguistic Theory: Laboratory Phonology Spring 2007 For information about citing these materials or our Terms of Use, visit: http://ocw.mit.edu/terms.
Transcript of 24.910 Laboratory Phonology - MIT OpenCourseWare · PDF file• E.g. Question/answer pairs:...

MIT OpenCourseWare http://ocw.mit.edu
24.910 Topics in Linguistic Theory: Laboratory PhonologySpring 2007
For information about citing these materials or our Terms of Use, visit: http://ocw.mit.edu/terms.
24.910Laboratory Phonology
Readings: Johnson (textbook)• chapter 1, • chapter 2, pp.19-33, • chapter 3

• Common vowel inventories:
I. Vowel inventories
i u i u i u
e
o e
o
a a a Arabic, Nyangumata, Aleut, etc.
Spanish, Swahili, Cherokee, etc.
Italian, Yoruba, Tunica, etc.
• Unattested vowel inventories:
i i i u e e
a a
Why?
ɔ

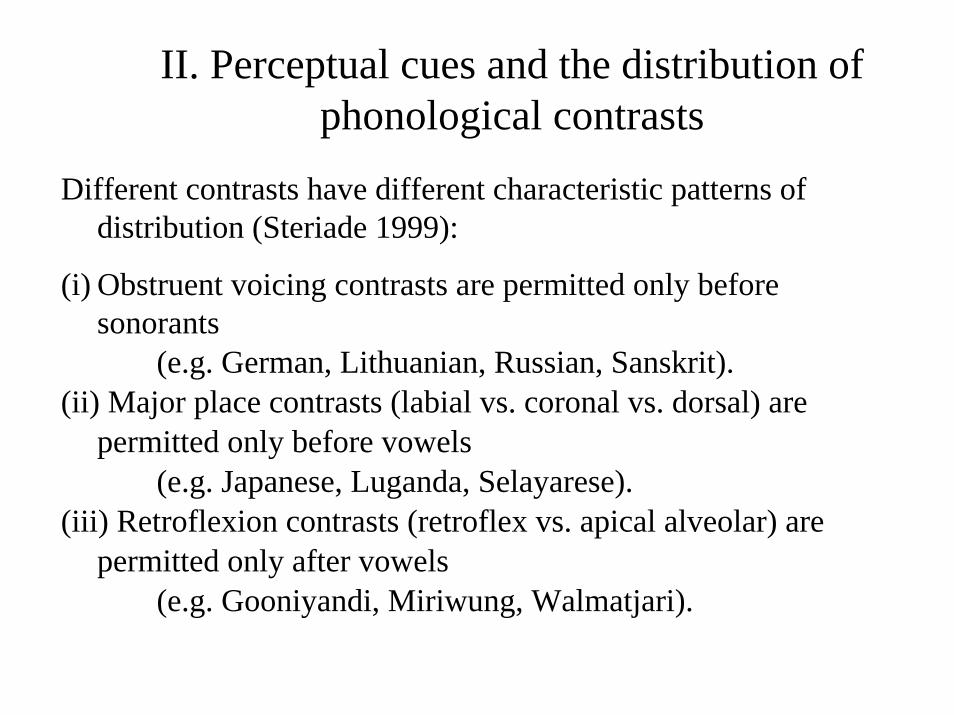
II. Perceptual cues and the distribution of phonological contrasts
• Phonological contrasts generally have restricted distributions.
• E.g. Lithuanian voicing contrastsa. obstruent voicing is distinctive before vocoids and consonantal sonorants:
áukle nukniaũti auglingas dregnasilpnas rytmetỹs skobnis bãdmetys
b. obstruent voicing is neutralized (to voiceless) word-finally:[dauk] [kat]
c.obstruent voicing is neutralized before any obstruent (assimilating in voicing to following obstruent):
a[d-g]al mè[z-d]avau dìr[p-t]i dè[k-t]i
II. Perceptual cues and the distribution of phonological contrasts
Different contrasts have different characteristic patterns of distribution (Steriade 1999):
(i) Obstruent voicing contrasts are permitted only before sonorants
(e.g. German, Lithuanian, Russian, Sanskrit).(ii) Major place contrasts (labial vs. coronal vs. dorsal) are
permitted only before vowels (e.g. Japanese, Luganda, Selayarese).
(iii) Retroflexion contrasts (retroflex vs. apical alveolar) are permitted only after vowels
(e.g. Gooniyandi, Miriwung, Walmatjari).

II. Perceptual cues and the distribution of phonological contrasts
Hypothesized explanation: ‘The likelihood that distinctive values of the feature F will occur in a given context is a function of the relative perceptibility of the F-contrast in that context’ (Steriade 1999).
• Contrasts differ in their distribution of cues so they are subject to different patterns of neutralization.
• Obstruent voicing is best cued by Voice Onset Time - only realized with a following sonorant.
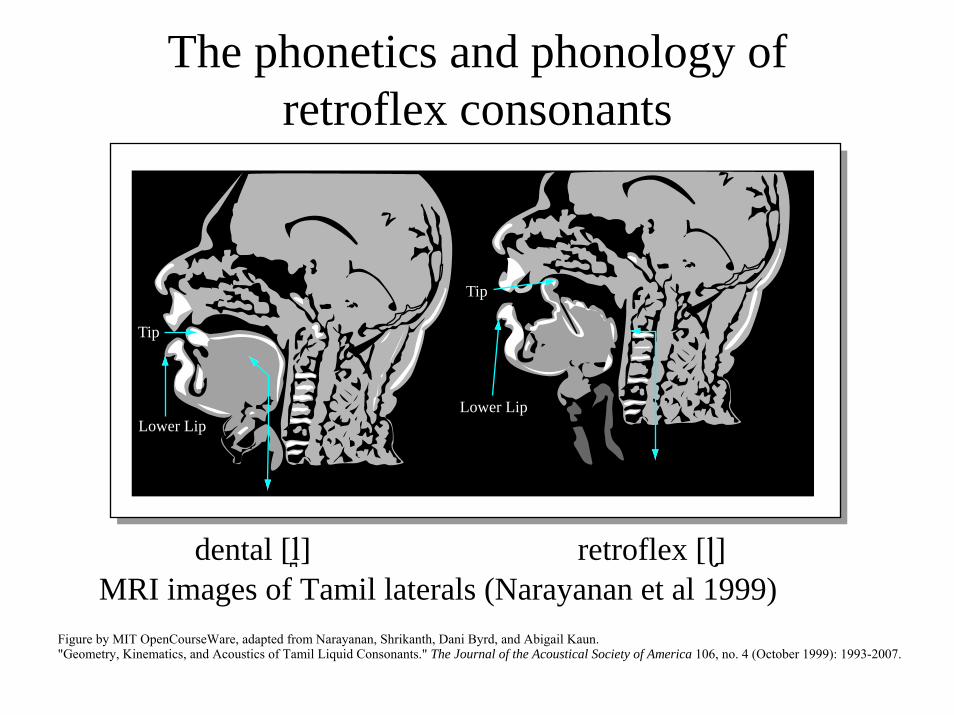
The phonetics and phonology of retroflex consonants
dental [l] retroflex []MRI images of Tamil laterals (Narayanan et al 1999)
Figure by MIT OpenCourseWare, adapted from Narayanan, Shrikanth, Dani Byrd, and Abigail Kaun. "Geometry, Kinematics, and Acoustics of Tamil Liquid Consonants." The Journal of the Acoustical Society of America 106, no. 4 (October 1999): 1993-2007.
Lower Lip
Tip
Lower Lip
Tip
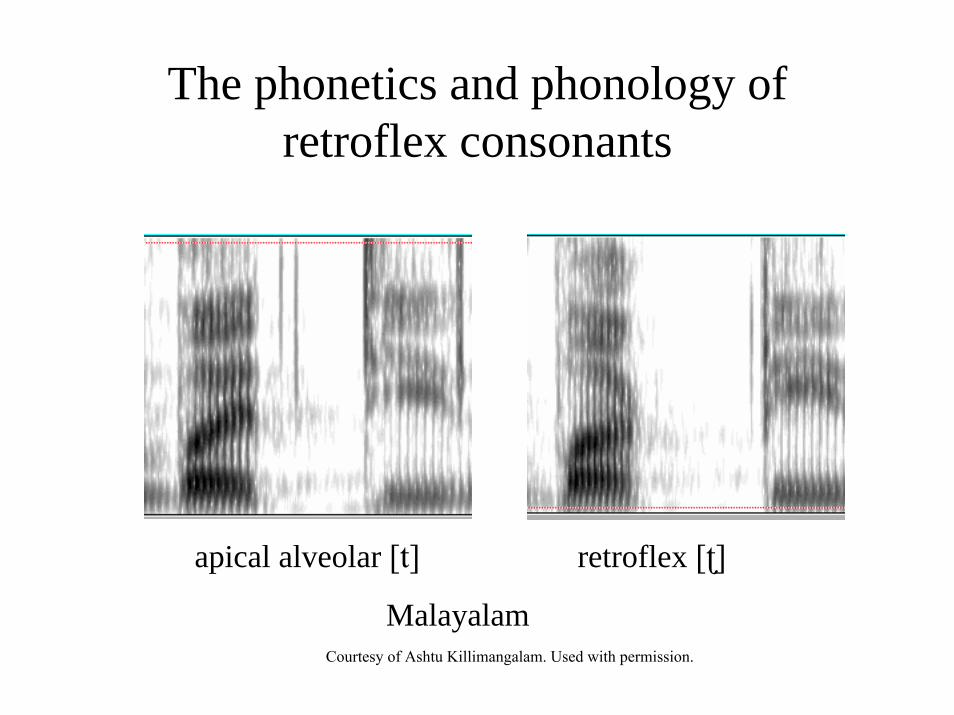
The phonetics and phonology of retroflex consonants
apical alveolar [t] retroflex []
MalayalamCourtesy of Ashtu Killimangalam. Used with permission.

Distribution of retroflexion contrasts in Gooniyandi (Steriade 1995)

Distribution of retroflexion contrasts in Gooniyandi

Distribution of retroflexion contrasts in Gooniyandi
Summary:
• Contrast between retroflex and apical alveolar after vowels V_#, V_V
• No contrast elsewhere #_, V_C
• This pattern of distribution is common in Australian and Dravidian languages.
• An unusual pattern of distribution - major place contrasts, voicing contrasts occur preferentially before vowels.

Distribution of retroflexion contrasts
Explanation (Steriade 1995, etc):
• The primary cues to the contrast between retroflex and apical alveolar are located in the VC transitions (unlike major place contrasts.
• Most retroflex consonants are retroflexed at closure, but the tongue tip moves forward during closure.
• At release tongue tip position is similar to an apical alveolar, consequently the release and CV transitions of the two consonant types are similar.
• Contrasts preferentially appear in environments where they are better cued.
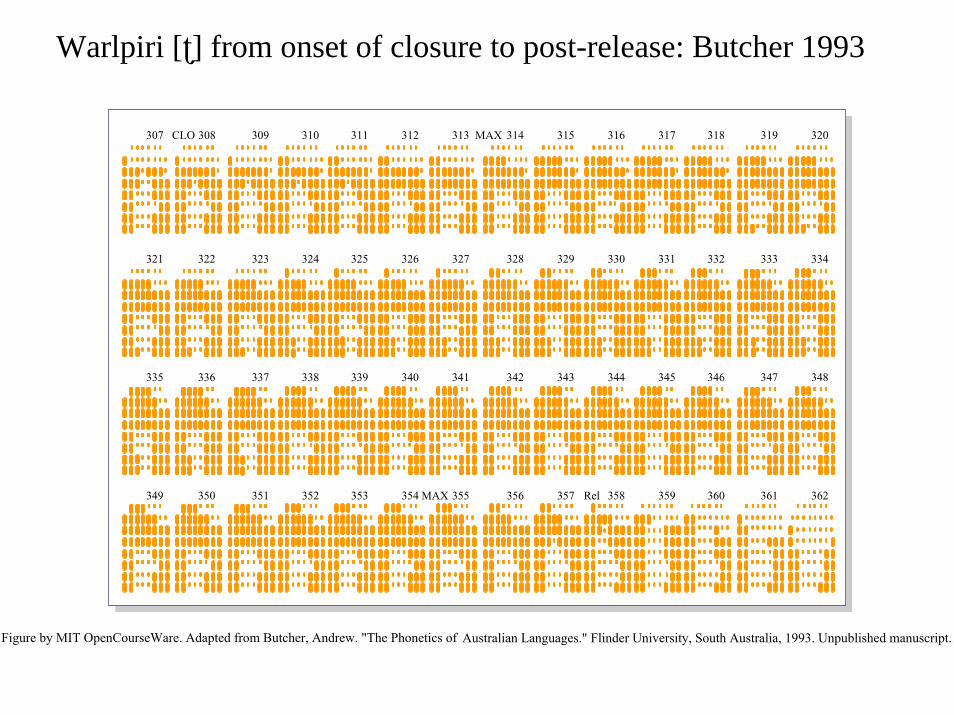
Warlpiri [] from onset of closure to post-release: Butcher 1993
307
321 322 323 324 325 326 327 328 329 330 331 332 333 334
335 336 337 338 339 340 341 342 343 344 345 346 347 348
349 350 351 352 353 354 355 356 357 358 359 360 361 362
308 310 311 312 313 314 315 316 317 318 319 320309CLO MAX
MAX Rel
Figure by MIT OpenCourseWare. Adapted from Butcher, Andrew. "The Phonetics of Australian Languages." Flinder University, South Australia, 1993. Unpublished manuscript.
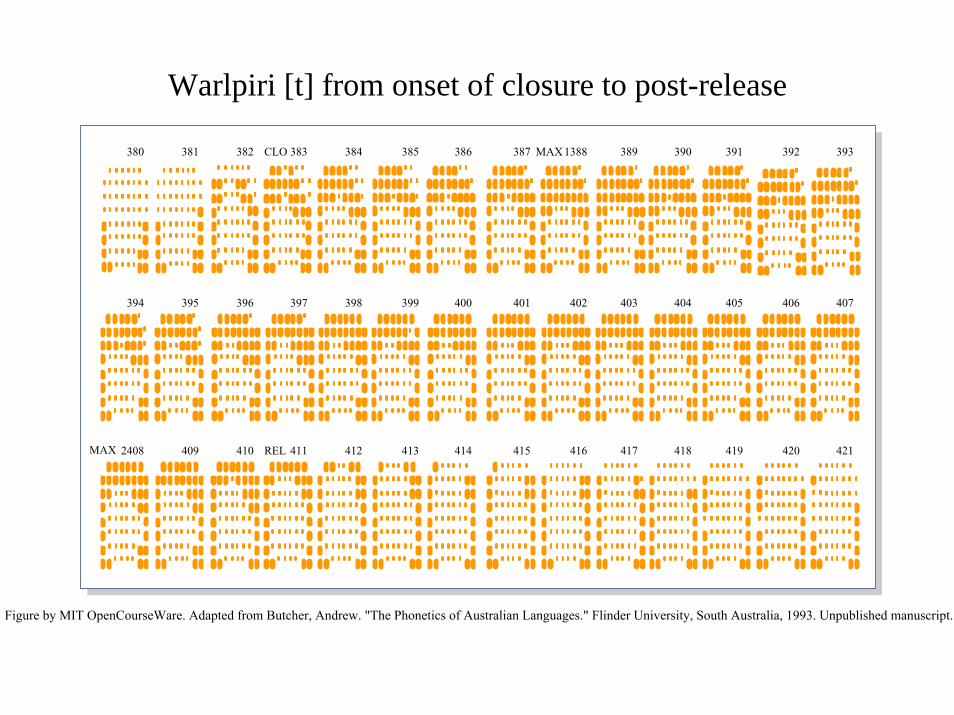
Warlpiri [t] from onset of closure to post-release
380 381 383 384 385 386 387 1388 389 390 391 392 393MAX
MAX
382 CLO
394 395 397 398 399 400 401 402 403 404 405 406 407396
2408 409 410 REL 411 412 413 414 415 416 417 418 419 420 421
Figure by MIT OpenCourseWare. Adapted from Butcher, Andrew. "The Phonetics of Australian Languages." Flinder University, South Australia, 1993. Unpublished manuscript.

Distribution of retroflexion contrasts
• Acoustic studies provide evidence concerning the differences between apical alveolar and retroflex consonants.
• Articulatory studies help to explain the observed acoustic patterns.
• Perceptual studies confirm that retroflexioncontrasts are more difficult to discriminate in the absence of a preceding vowel (Anderson 1997).
• Phonological theory to relate these properties to the observed distribution of retroflexion contrasts.
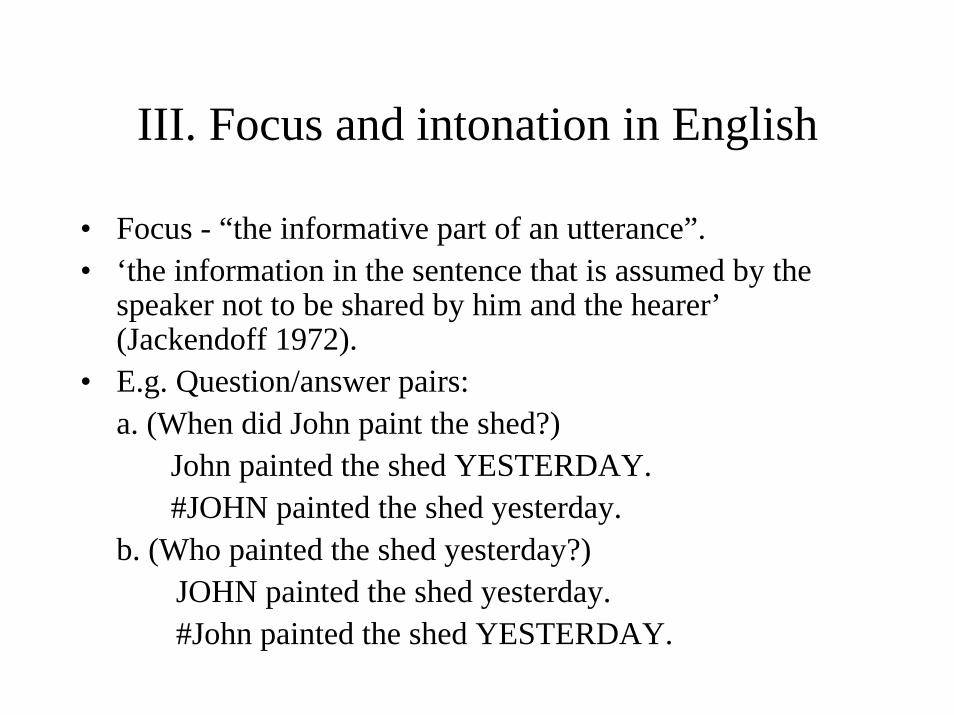
III. Focus and intonation in English
• Focus - “the informative part of an utterance”.• ‘the information in the sentence that is assumed by the
speaker not to be shared by him and the hearer’(Jackendoff 1972).
• E.g. Question/answer pairs: a. (When did John paint the shed?)
John painted the shed YESTERDAY.#JOHN painted the shed yesterday.
b. (Who painted the shed yesterday?)JOHN painted the shed yesterday.#John painted the shed YESTERDAY.

III. Focus and intonation in English
‘Focus sensitive particles’ make the truth conditions of a sentence dependent on the location of focus:
1. Jan only gave BILL money.2. Jan only gave Bill MONEY.
• Focus is marked by some kind of prominence. What is this exactly?

Broad focus: ‘what happened’
Time (s)2.00885 3.47811
0
5000
Time (s)2.61383 4.08096
0
5000
Time (s)2.79811 4.23252
0
5000
verb focusTime (s)
2.55219 3.946690
5000
Annabel married Maloney Annabel married Maloney
Object focus: ‘Who did Annabel marry?’
Audio: 1_broad.wav
Audio:1_subj.wav
Audio: 1_obj.wav
Subject focus:‘who married Maloney?’
Verb focus:‘what did Annabel do to Maloney?’
Audio: 1_verb.wav

LinguisticLevel
PhysiologicalLevel
AcousticLevel
PhysiologicalLevel
LinguisticLevel
Sound WavesEar
Ear
SensoryNerves
Sensory Nerves
Brain
BrainFeedback
Link
Motor Nerves
VocalMuscles
ListenerSpeaker
The Speech Chain
Figure by MIT OpenCourseWare. Adapted from Denes, Peter B., and Elliot N. Pinson.The Speech Chain: The Physics and Biology of Spoken Speech. 2nd ed. New York, NY: W. H. Freeman, 1993. ISBN: 9780716723448.

Articulation-The speech production system
Figure by MIT OpenCourseWare.
Hard Palate
Nasal Cavity
Nostril
LipTongue
TeethOral (or Buccal) CavityJaw
Trachea
Lung
Diaphragm
Soft Palate(Velum)
Pharyngeal Cavity
Larynx
Esophagus

The vocal tractAlveolar ridgeUpper gums(alveolus)
Teeth
Lips
Lower jaw
Hyoid
Thyroid cartilage
Nasal cavity
Palate
Soft palateVelum
Uvula
Tonsils
Tongue
Pharynx
Epiglottis
Vocal cords(glottis)
Larynx
Esophagus
Vocal tract configuration with raised soft palate for articulating non-nasal sounds.
Figure by MIT OpenCourseWare.

Articulatory description of speech sounds
Consonants:• Voicing• Place of articulation• Manner• Lateral/Central• Nasal/Oral
• [s] voiceless alveolar central oral fricative

Articulatory description of speech sounds
Vowels:• High-low• Front-back• Rounded-unrounded
• [e] mid front unrounded vowel

Movie removed due to copyright restrictions.
Please see “Tongue Video” in Peter Ladefoged’s Vowels and Consonants.

Introduction to acoustics
• Sound consists of pressure fluctuations in a medium…
…which displace the ear drum in such a way as to result in stimulation of the auditory nerve.
animation

Speech acoustics
• Movements at a source produce a sound wave in the medium which carries energy to the perceiver.
• Pressure fluctuations move through space, but each air particle moves only a small distance.
Animated image of longitudinal pressure wave removed due to copyright restrictions.

Representing sound waves
Time
Pres
sure
0
C = CompressionR = Rarefaction
C C C C CR R R R R
Sound is a Pressure Wave
Image by MIT OpenCourseWare. Adapted from The Physics Classroom Tutorial.

Periodic sounds• A waveform is periodic if it repeats at regular intervals.• Frequency of a wave is the number of cycles occurring per
unit of time.– Units: 1 Hertz (Hz) is 1 cycle/second

• Voiced sounds have complex (quasi-)periodic wave forms.• The perceived pitch of a sound depends on its frequency.
Periodic sounds
0 .01 .02 .03 s
- Air
pre
ssur
e +
Time in seconds
Figure by MIT OpenCourseWare.

• Aperiodic sounds have waveforms that do not repeat.• Fricative noise is aperiodic.
Aperiodic sounds
Segment of [s]Time (s)
0 0.0115323–0.09549
0.1253
0

Waveform of a sentence
Please pass me my book
16151413121110987654321
Figure by MIT OpenCourseWare.

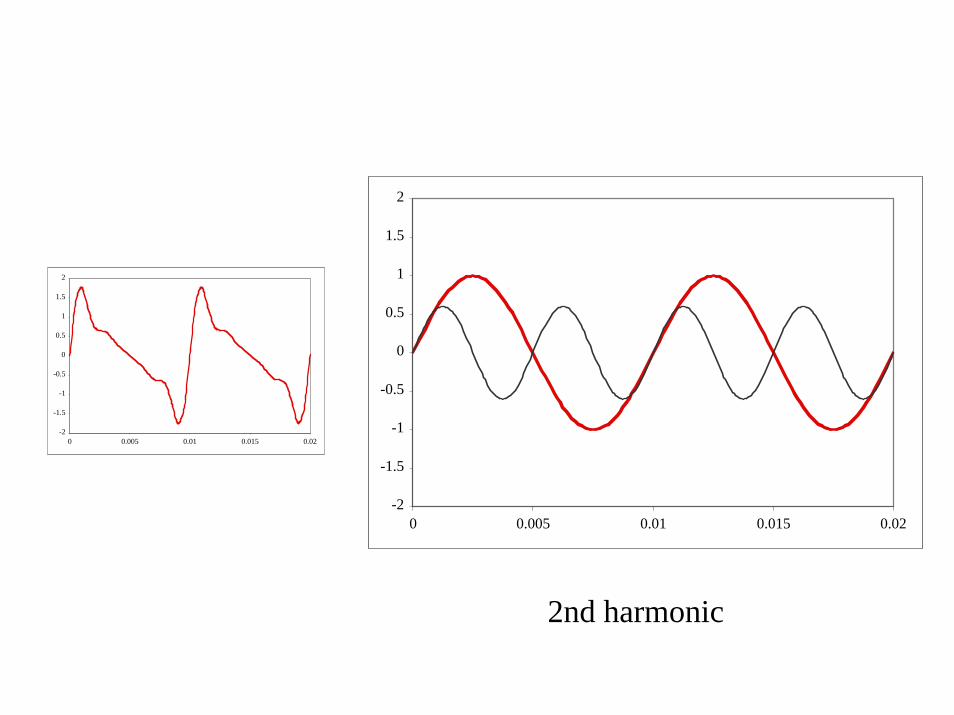
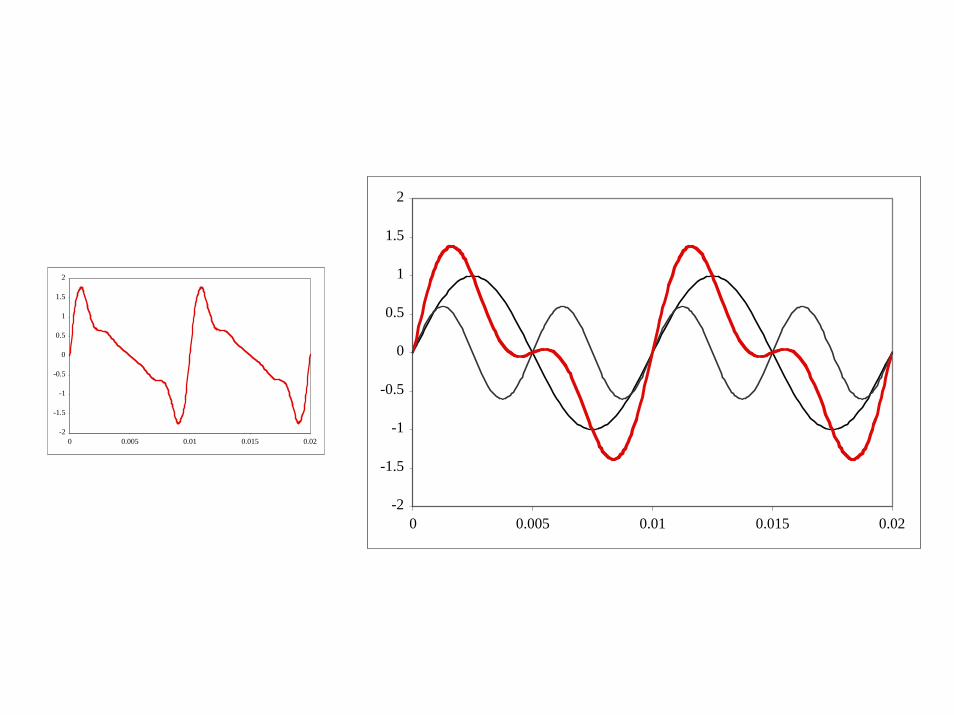
Spectrums and spectrograms
• The spectrum of a sound plays a central role in determining its quality or timbre.

Spectral representation• Any complex wave can be analyzed as the combination of
a number of sinusoidal waves of different frequencies and intensities (Fourier’s theorem).
• In the case of a periodic sound like a vowel these will be– the fundamental frequency– multiples of the fundamental frequency (harmonics)
• The quality of a periodic sound depends on the relative amplitude of its harmonics.

Spectral representation
-2
-1.5
-1
-0.5
0
0.5
1
1.5
2
0 0.005 0.01 0.015 0.02

-2
-1.5
-1
-0.5
0
0.5
1
1.5
2
0 0.005 0.01 0.015 0.02
-2
-1.5
-1
-0.5
0
0.5
1
1.5
2
0 0.005 0.01 0.015 0.02
Fundamental frequency
-2
-1.5
-1
-0.5
0
0.5
1
1.5
2
0 0.005 0.01 0.015 0.02
-2
-1.5
-1
-0.5
0
0.5
1
1.5
2
0 0.005 0.01 0.015 0.02
2nd harmonic
-2
-1.5
-1
-0.5
0
0.5
1
1.5
2
0 0.005 0.01 0.015 0.02
-2
-1.5
-1
-0.5
0
0.5
1
1.5
2
0 0.005 0.01 0.015 0.02

-2
-1.5
-1
-0.5
0
0.5
1
1.5
2
0 0.005 0.01 0.015 0.02
-2
-1.5
-1
-0.5
0
0.5
1
1.5
2
0 0.005 0.01 0.015 0.02

-2
-1.5
-1
-0.5
0
0.5
1
1.5
2
0 0.005 0.01 0.015 0.02
-2
-1.5
-1
-0.5
0
0.5
1
1.5
2
0 0.005 0.01 0.015 0.02

Frequency (Hz) Amplitude
100 1200 0.6
300 0.45400 0.3500 0.1
0
0.2
0.4
0.6
0.8
1
1.2
0 100 200 300 400 500 600
frequency (Hz)
Spectral representation
Power spectrum
• Phase differences are relatively unimportant to sound quality, so key properties of a complex wave can be specified in terms of the frequencies and amplitudes of its sinusoidal components.

Idealized vowel spectrum
400030002000100000
20
40
60In
tens
ity le
vel (
deci
bels
)
Frequency (Hertz)
Figure by MIT OpenCourseWare.

Frequency (Hz)0 3500
0
20
40
[æ]
vowel spectrum

Vowel quality
• The quality of a vowel depends on the shape of its spectrum.
• The shape of the spectrum depends on the shape of the vocal tract.
Frequency (Hz)0 3500
0
20
40
Frequency (Hz)0 3500
0
20
40
[æ] [ɪ]

• The peaks in the spectrum of a vowel are called formants.
• Perceived vowel quality depends primarily on the frequencies of the first three formants.
Vowel quality
Frequency (Hz)0 3500
0
20
40
Frequency (Hz)0 3500
0
20
40
[æ] [ɪ]
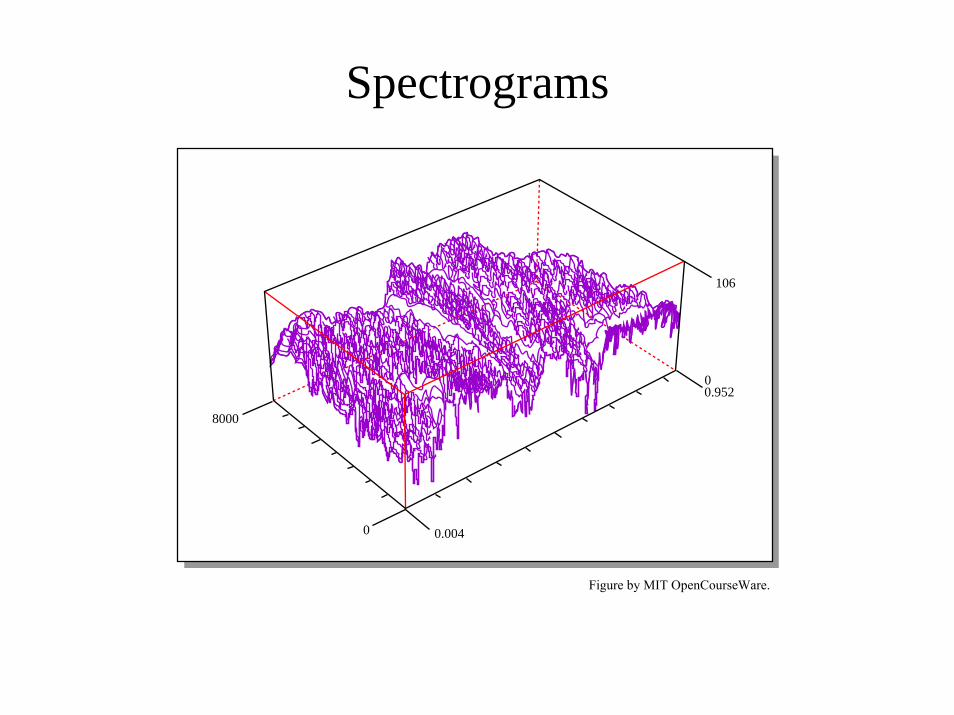
Spectrograms
8000
0 0.004
0.952
106
0
Figure by MIT OpenCourseWare.

0
1000
2000
3000
4000
5000
0
1000
2000
3000
4000
5000
m æ s ə t ʃ u s əʔ s m ɪ ɹ ə k ɫ
1 second
Hz
Hz

Frequency (Hz)0 4000
0
20
40
0 1000 2000 3000 4000
Frequency (Hz)0 4000
–20
0
20
Frequency (Hz)0 4000
0
20
40
narrow band (long window)
broad band(short window)

Frequency (Hz)0 4000
–20
0
20
Frequency (Hz)0 4000
0
20
40
Frequency (Hz)0 4000
–20
0
20
Time (s)3.46955 3.7731
0
5000
3.55 3.59 3.69

Spectrogram image removed due to copyright restrictions.See: http://hctv.humnet.ucla.edu/departments/linguistics/VowelsandConsonants/course/chapter8/8.3.htm

F2 (Hz)
F1 (Hz)
200
300
400
500
600
700
8002500 2000 1500 1000
iu
I
ε
Ω
c
Figure by MIT OpenCourseWare. Adapted from Peter Ladefoged. A Course in Phonetics. 5th ed. Berlin, Germany: Heinle, 2005. ISBN: 9781413006889.Available at: http://www.phonetics.ucla.edu/course/contents.html
æ A