
240 7 Population Dynamics
46
1
description
es 240
Transcript of 240 7 Population Dynamics

1
2

3
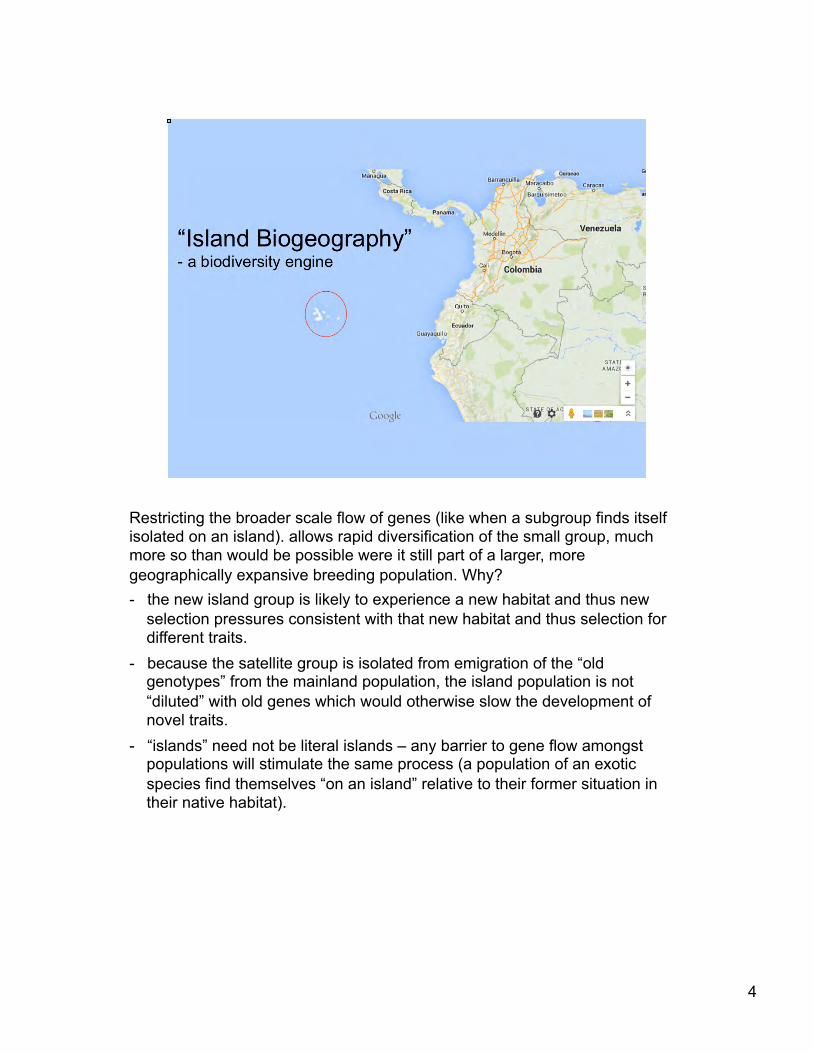
Restricting the broader scale flow of genes (like when a subgroup finds itself isolated on an island). allows rapid diversification of the small group, much more so than would be possible were it still part of a larger, more geographically expansive breeding population. Why? - the new island group is likely to experience a new habitat and thus new
selection pressures consistent with that new habitat and thus selection for different traits.
- because the satellite group is isolated from emigration of the “old genotypes” from the mainland population, the island population is not “diluted” with old genes which would otherwise slow the development of novel traits.
- “islands” need not be literal islands – any barrier to gene flow amongst populations will stimulate the same process (a population of an exotic species find themselves “on an island” relative to their former situation in their native habitat).
4
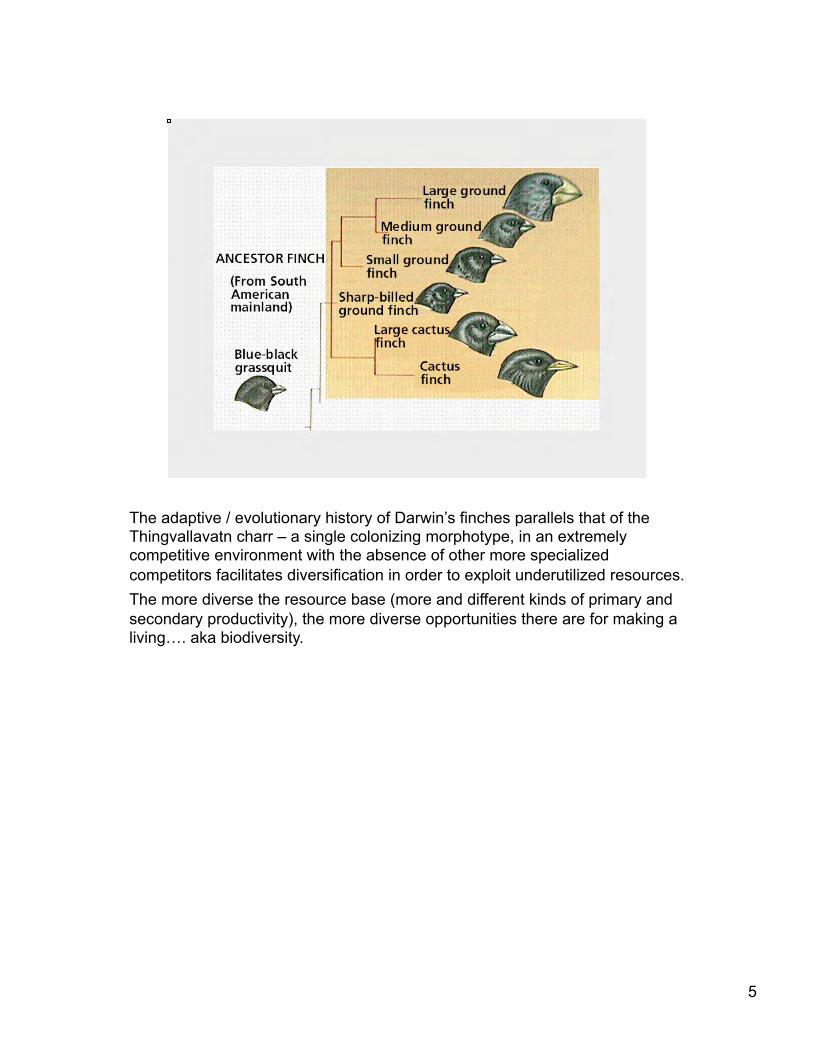
The adaptive / evolutionary history of Darwin’s finches parallels that of the Thingvallavatn charr – a single colonizing morphotype, in an extremely competitive environment with the absence of other more specialized competitors facilitates diversification in order to exploit underutilized resources. The more diverse the resource base (more and different kinds of primary and secondary productivity), the more diverse opportunities there are for making a living…. aka biodiversity.
5
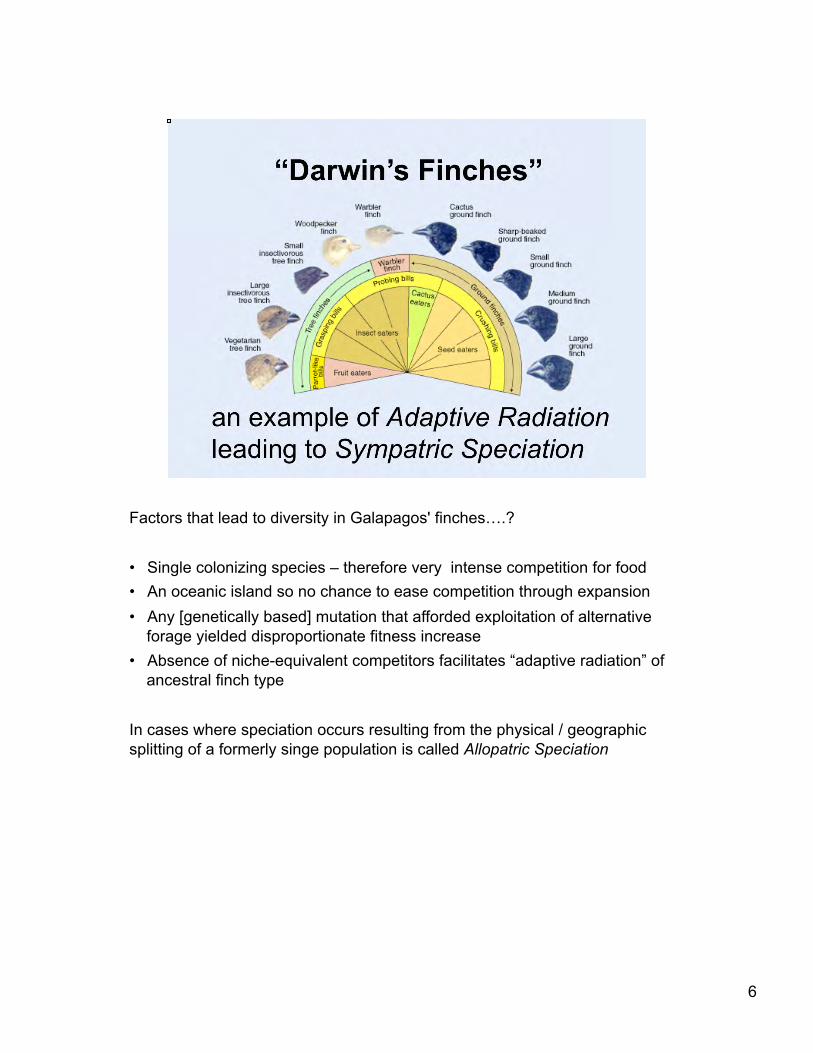
Factors that lead to diversity in Galapagos' finches….? • Single colonizing species – therefore very intense competition for food • An oceanic island so no chance to ease competition through expansion • Any [genetically based] mutation that afforded exploitation of alternative
forage yielded disproportionate fitness increase • Absence of niche-equivalent competitors facilitates “adaptive radiation” of
ancestral finch type In cases where speciation occurs resulting from the physical / geographic splitting of a formerly singe population is called Allopatric Speciation
6

Lakes are ecological islands and therefore often show similar patterns of adaptive radiation.
7

8
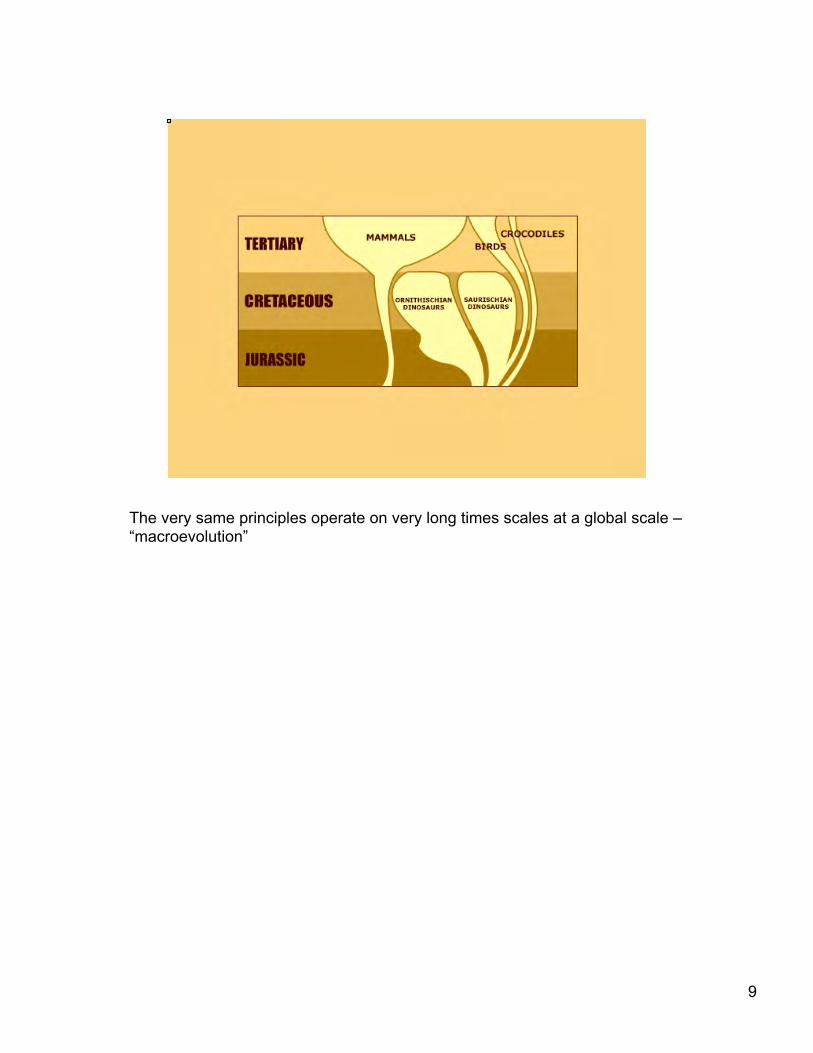
The very same principles operate on very long times scales at a global scale – “macroevolution”
9
10
Branding is an attempt to partition niche space of your product from the competition. Successful branding defines the “niche” of products as opposed to species
11
12

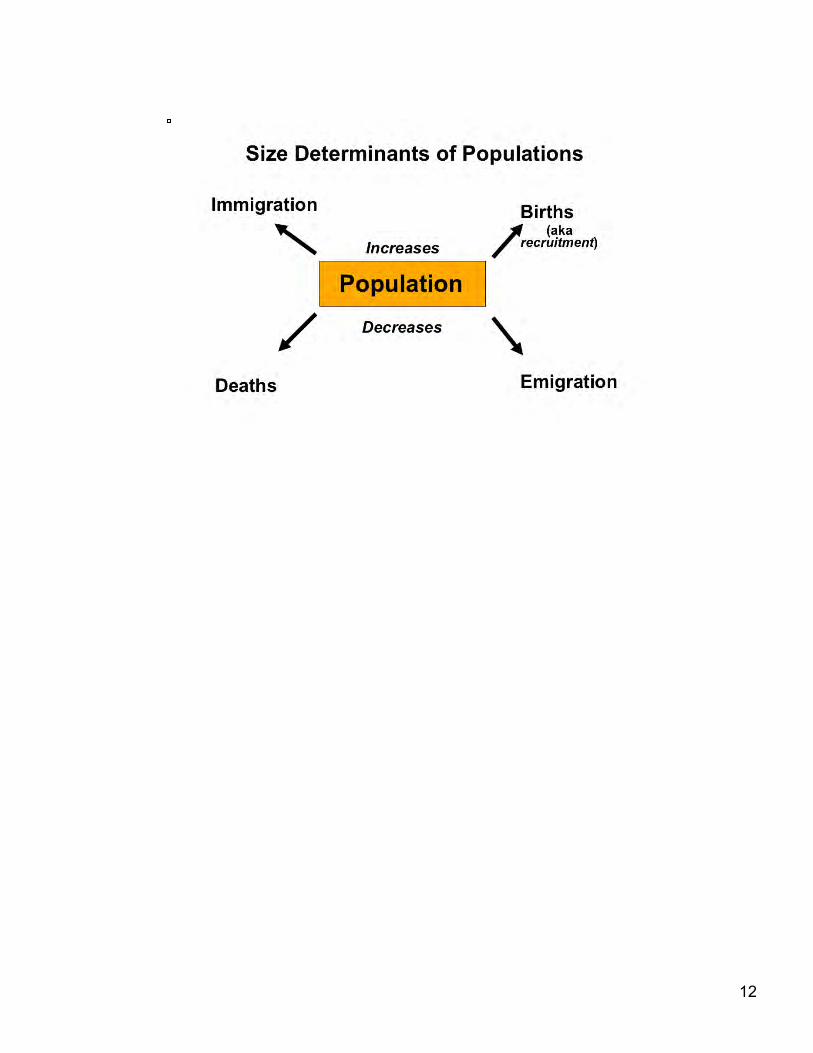
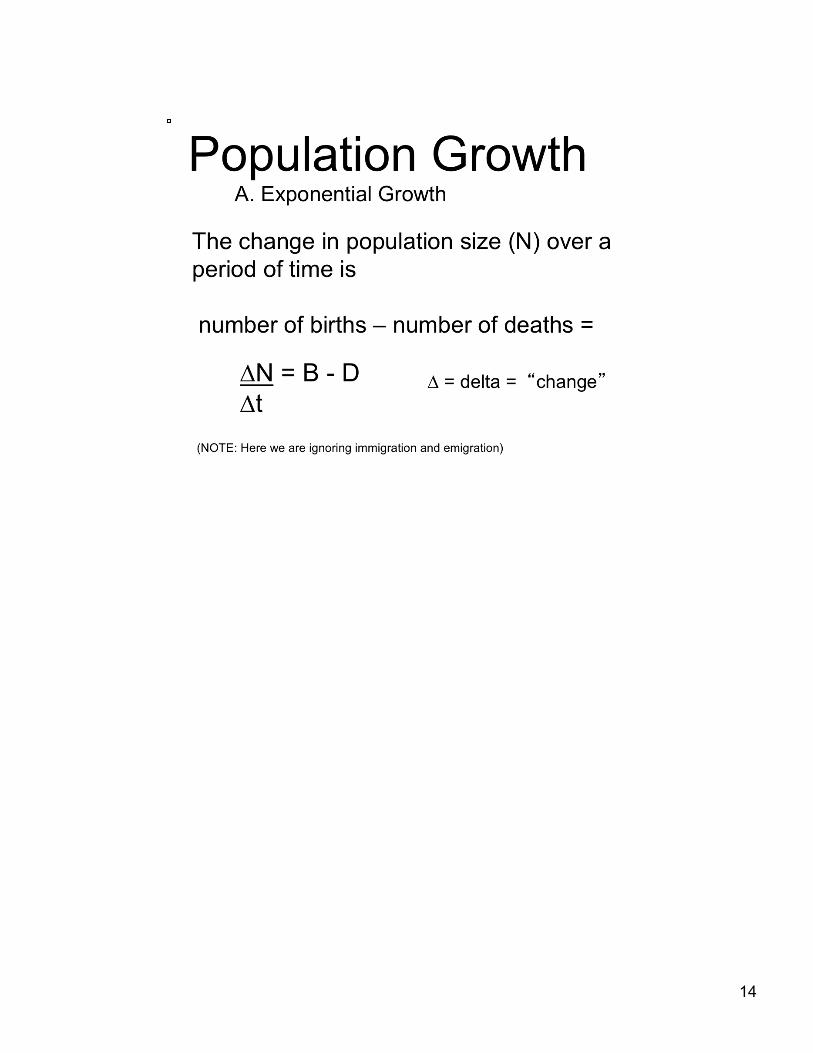
Inclusion of time makes the B and D rates instead of static numbers. Delta is a Greek letter and is used to denote “change” in ecology and math in general.
13
14

population shrank because B < D
15
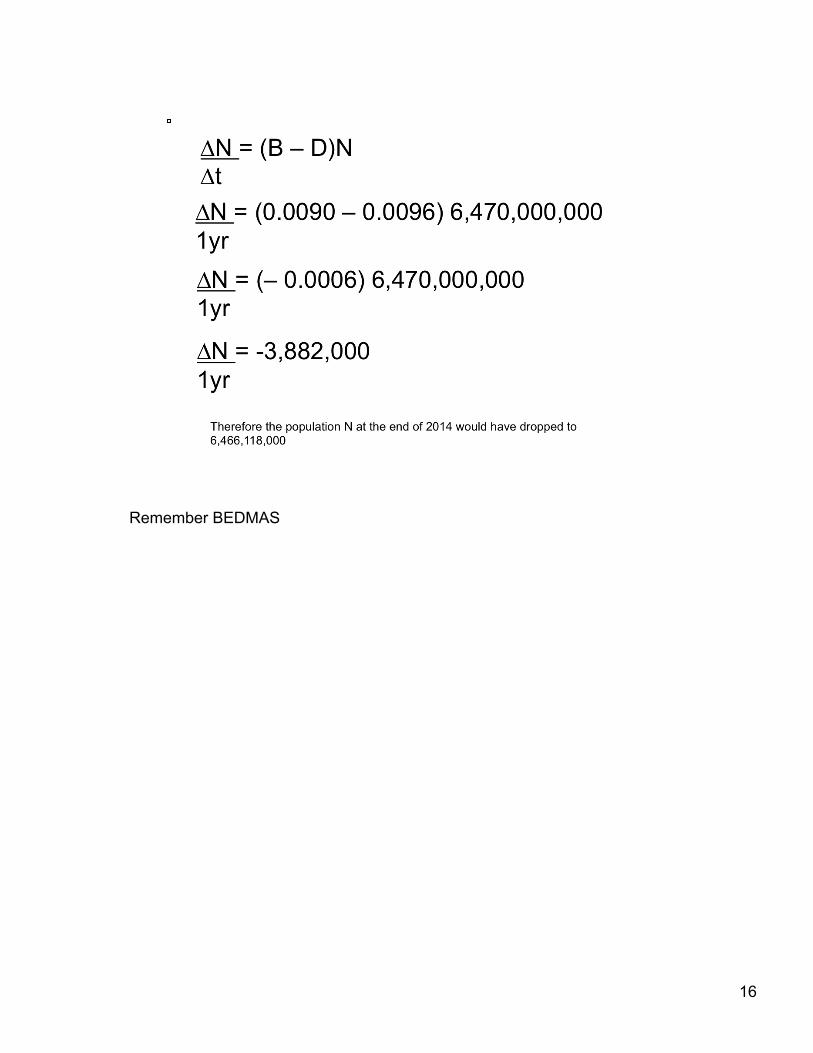
Remember BEDMAS
16

Social economist – studied London England population
17
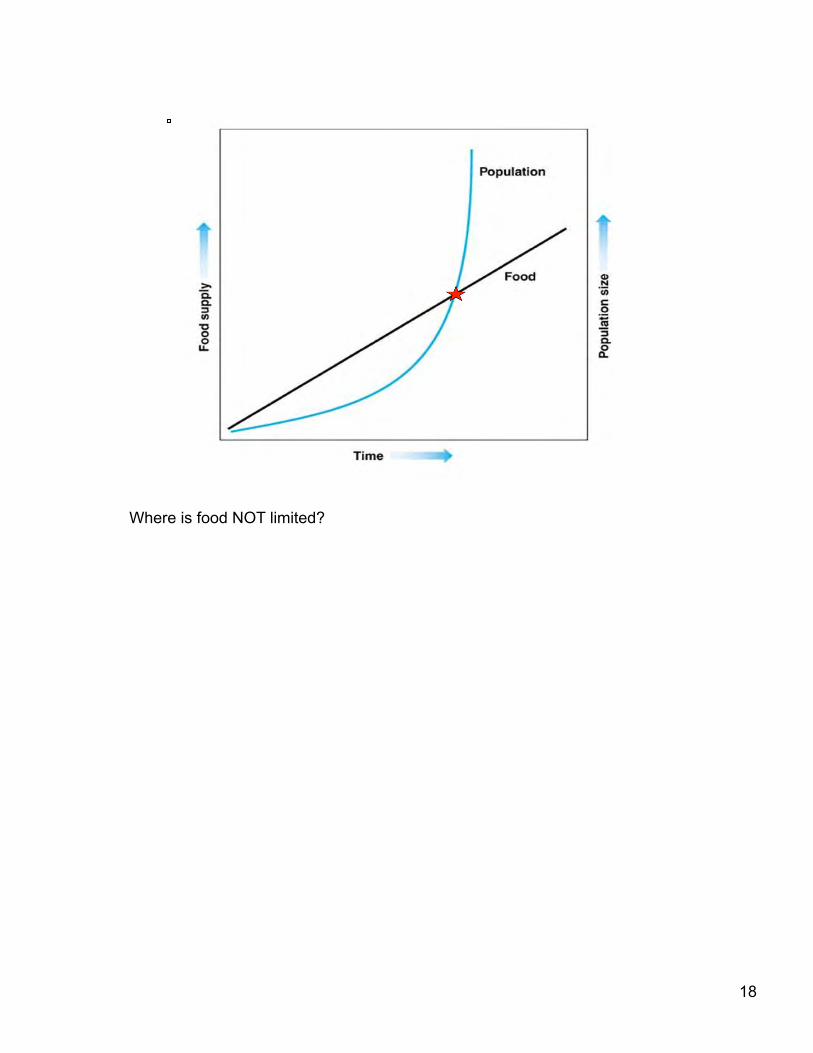
Where is food NOT limited?
18
19
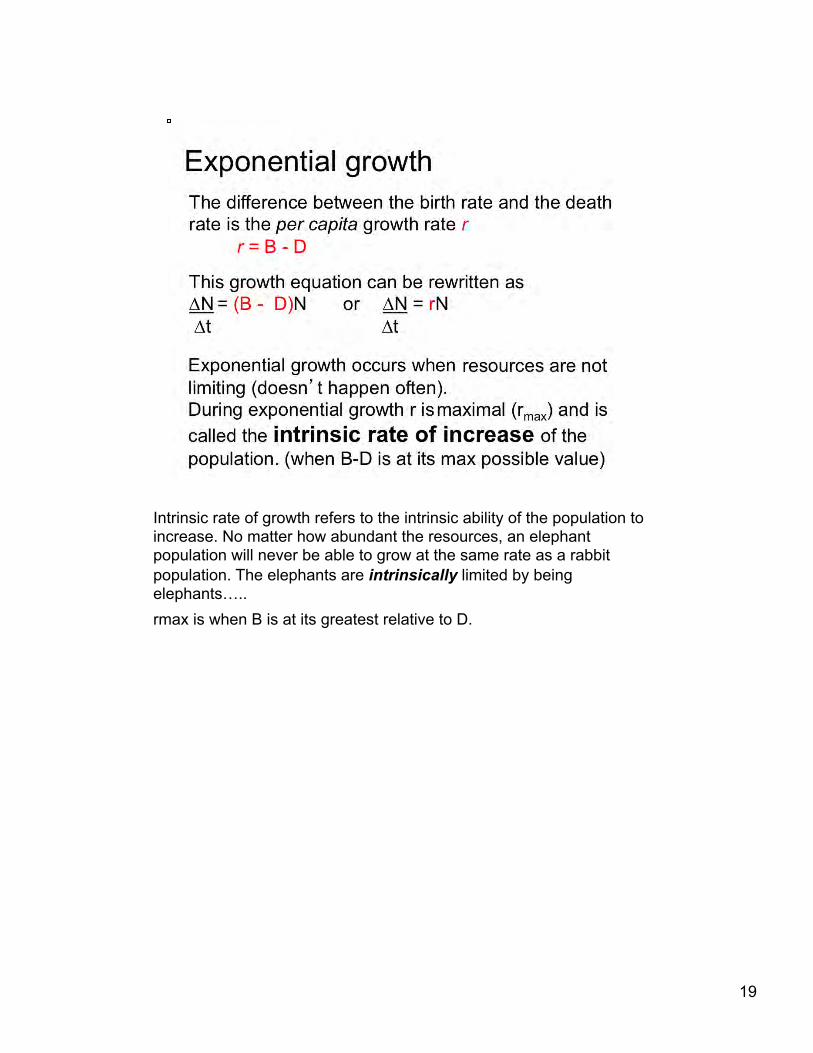
Intrinsic rate of growth refers to the intrinsic ability of the population to increase. No matter how abundant the resources, an elephant population will never be able to grow at the same rate as a rabbit population. The elephants are intrinsically limited by being elephants….. rmax is when B is at its greatest relative to D.
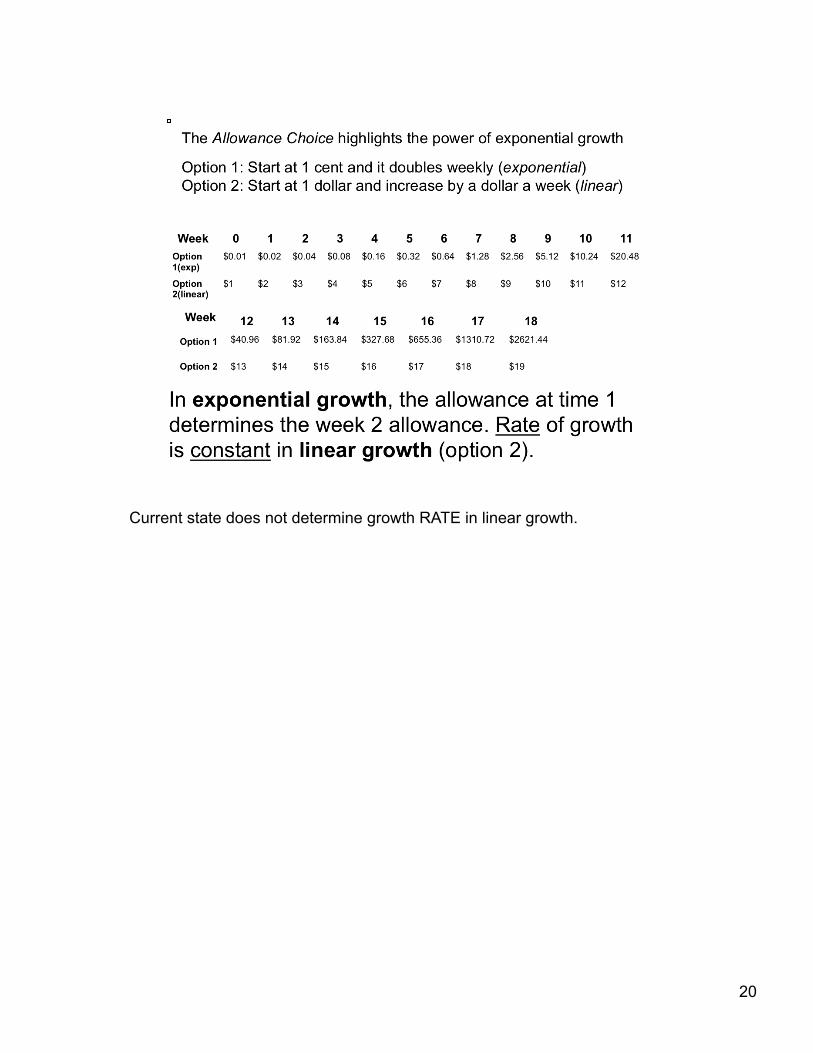
20
Current state does not determine growth RATE in linear growth.
21
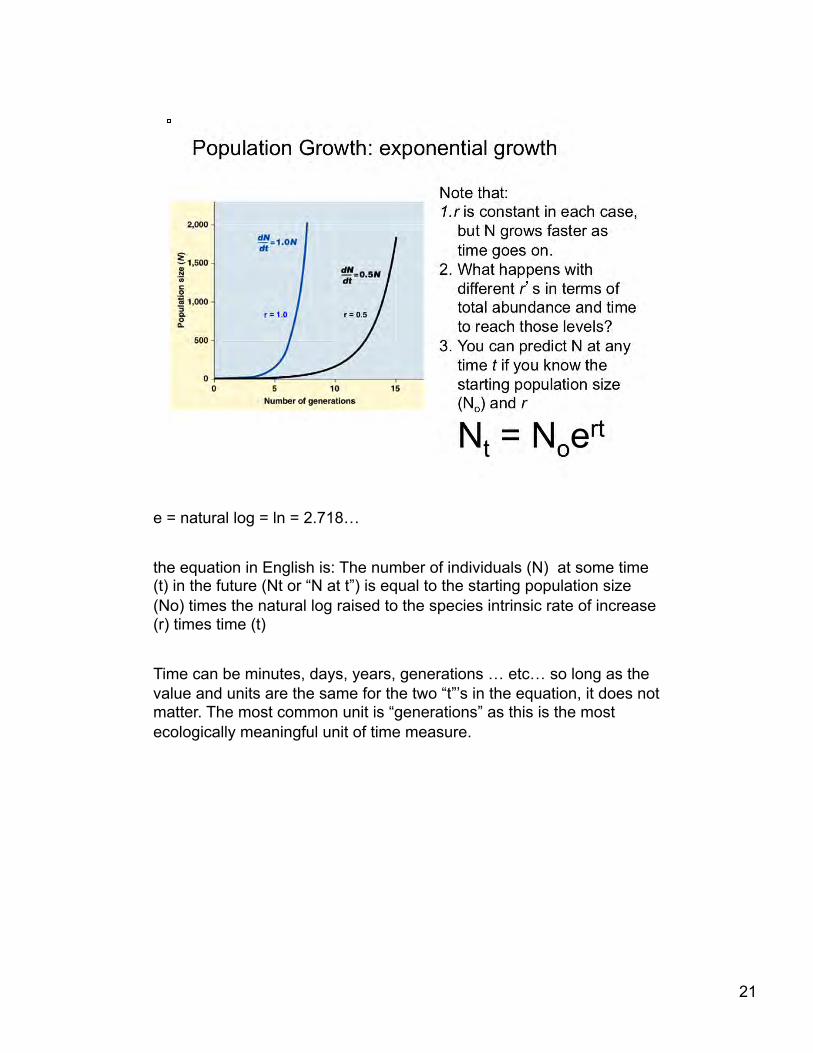
e = natural log = ln = 2.718… the equation in English is: The number of individuals (N) at some time (t) in the future (Nt or “N at t”) is equal to the starting population size (No) times the natural log raised to the species intrinsic rate of increase (r) times time (t) Time can be minutes, days, years, generations … etc… so long as the value and units are the same for the two “t”’s in the equation, it does not matter. The most common unit is “generations” as this is the most ecologically meaningful unit of time measure.

Appropriate time interval is generations. Here the species of interest breeds annually. For those not used to working with natural logs, make sure you know how to use your calculator to calculate Nt.
22
23

24

25
Rabbit range expanded 70 miles a year Released from all “normal” ecological restraints in Australia – prolonged exponential growth ensued.

26
Realized growth rate (r ) is “density dependent” – just as in the allowance experiment, in exponential growth the current allowance dictated the next week’s allowance. If a population expands into a resource-rich environment, population growth rate is limited only by r (intrinsic rate of growth), later though as demand outstrips supply of resources, population growth is limited by the carrying capacity (resources) of the habitat. Re-emphasize density dependence in the context of early and late growth phases (early - # females increases driving growth; later – number of individuals limits resource availability)

27
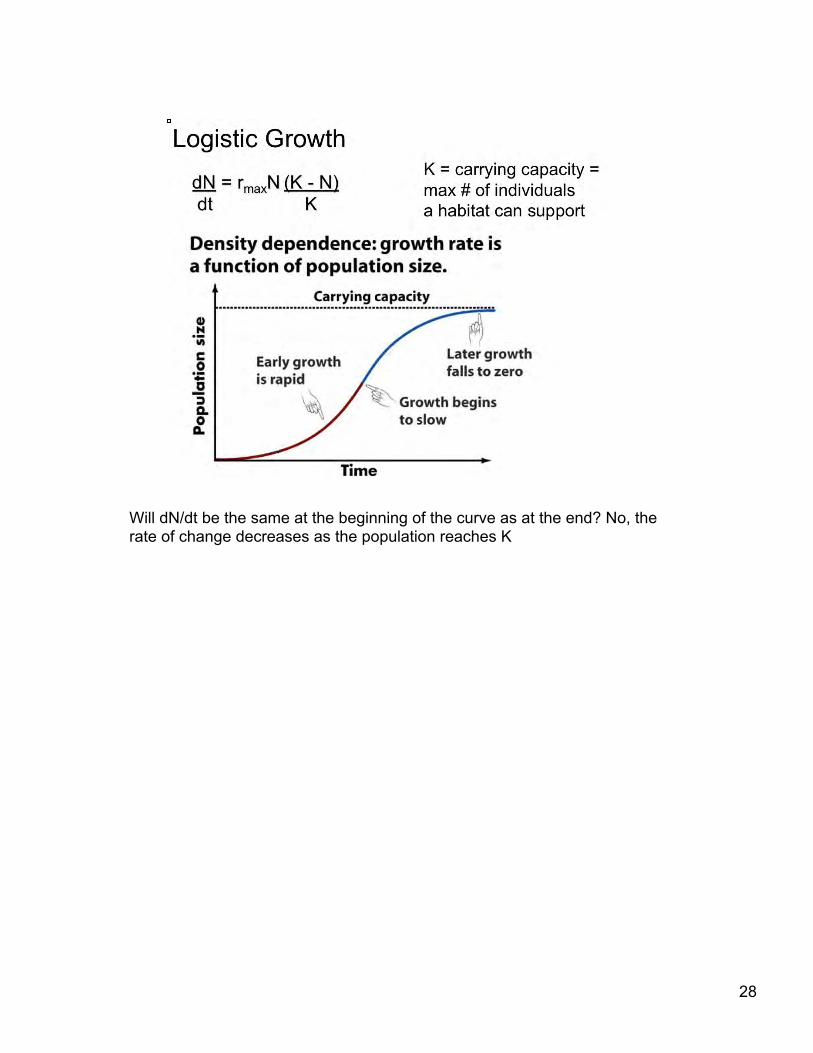
Will dN/dt be the same at the beginning of the curve as at the end? No, the rate of change decreases as the population reaches K
28

29
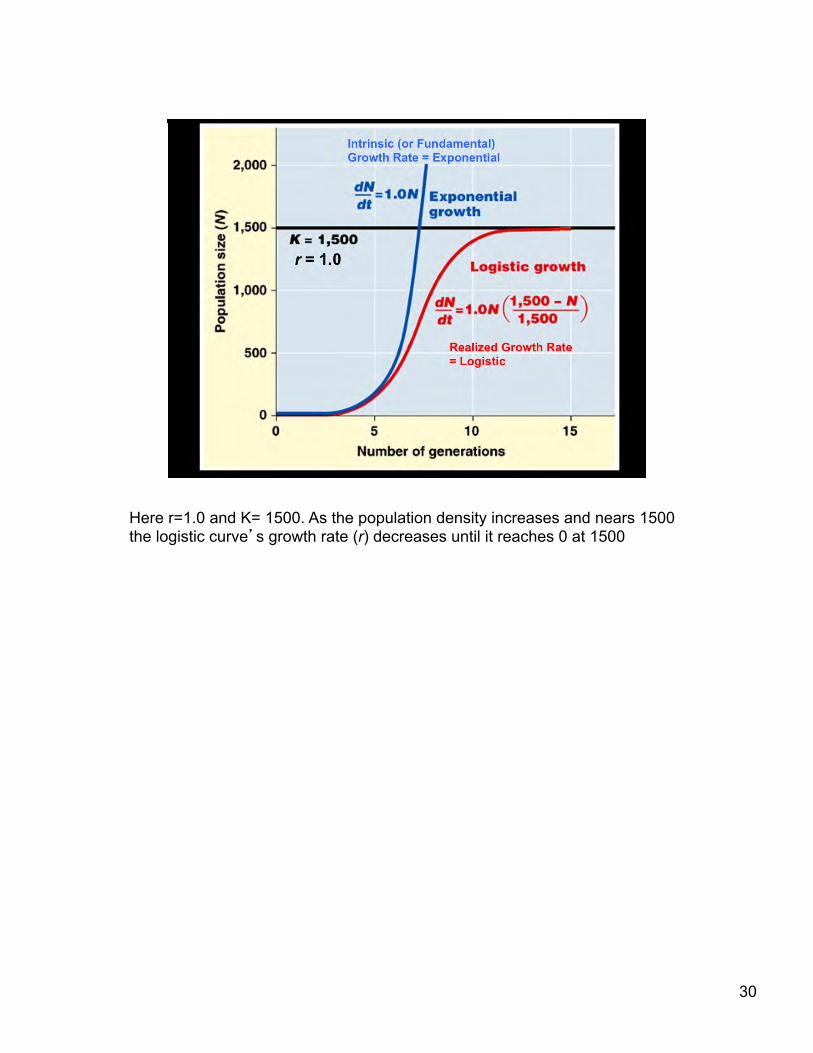
Here r=1.0 and K= 1500. As the population density increases and nears 1500 the logistic curve’s growth rate (r) decreases until it reaches 0 at 1500
30

Side note: Why is this male salmon red? Salmon return as adults to their natal streams…1000s of times larger than when they left. The difference - secondary production while in the ocean – represents a marine subsidy to the stream and surrounding terrestrial community. After spawning the salmon dies and....
31
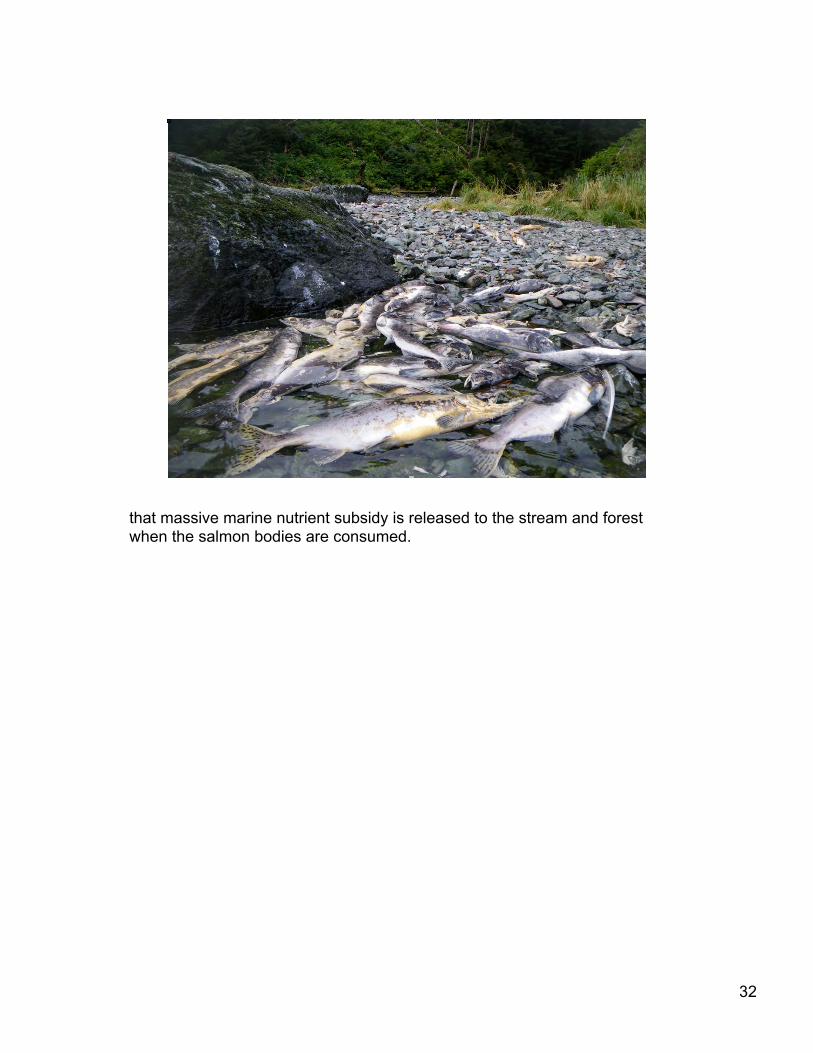
that massive marine nutrient subsidy is released to the stream and forest when the salmon bodies are consumed.
32
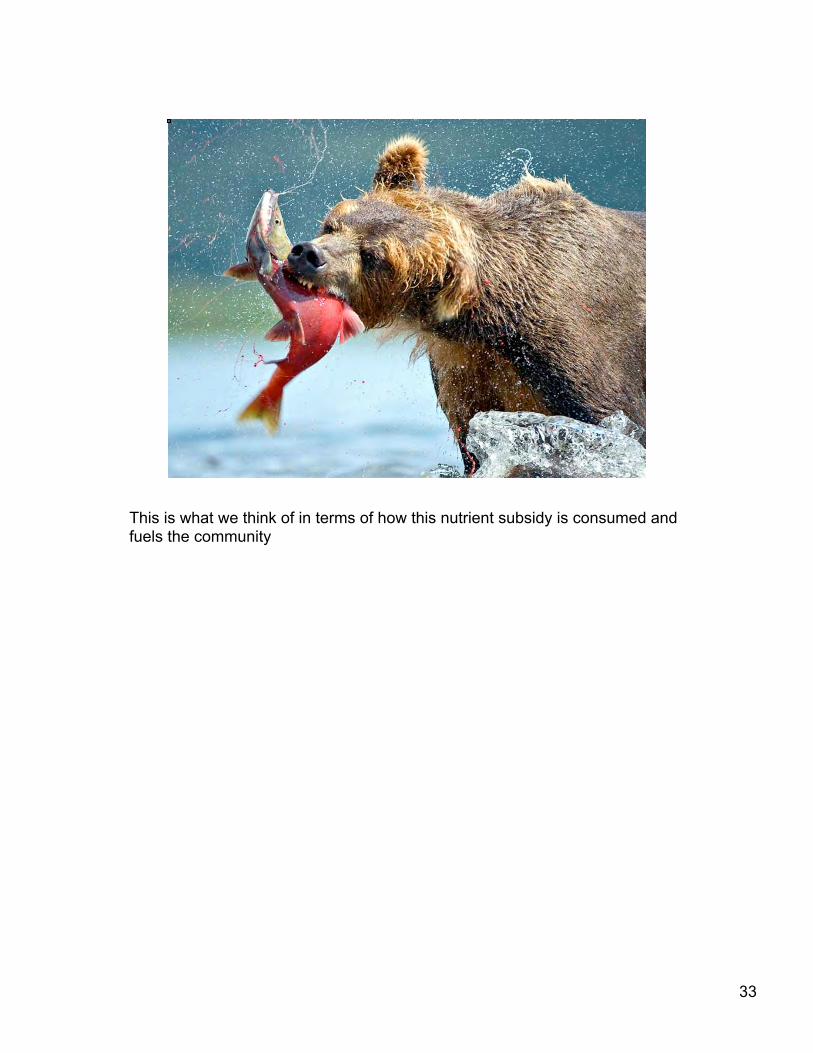
This is what we think of in terms of how this nutrient subsidy is consumed and fuels the community
33

…or this...
34

…but the vast majoiry of salmon biomass is “broken down” by these (and animals like them)...maggots (larval form) of numerous fly species.
35

Would either species’ abundance be greatly affected by the annual pulse of salmon? Yes – fly. The breeding cycle of a bear is far to long to respond to brief episodic events like a salmon spawning whereas the fly population will explode with the influx of salmon but just as quickly die off once the subsidy is consumed. So, the bears respond in terms of individual health / performance whereas flies respond demographically (dramatic change in population abundance)
36
37
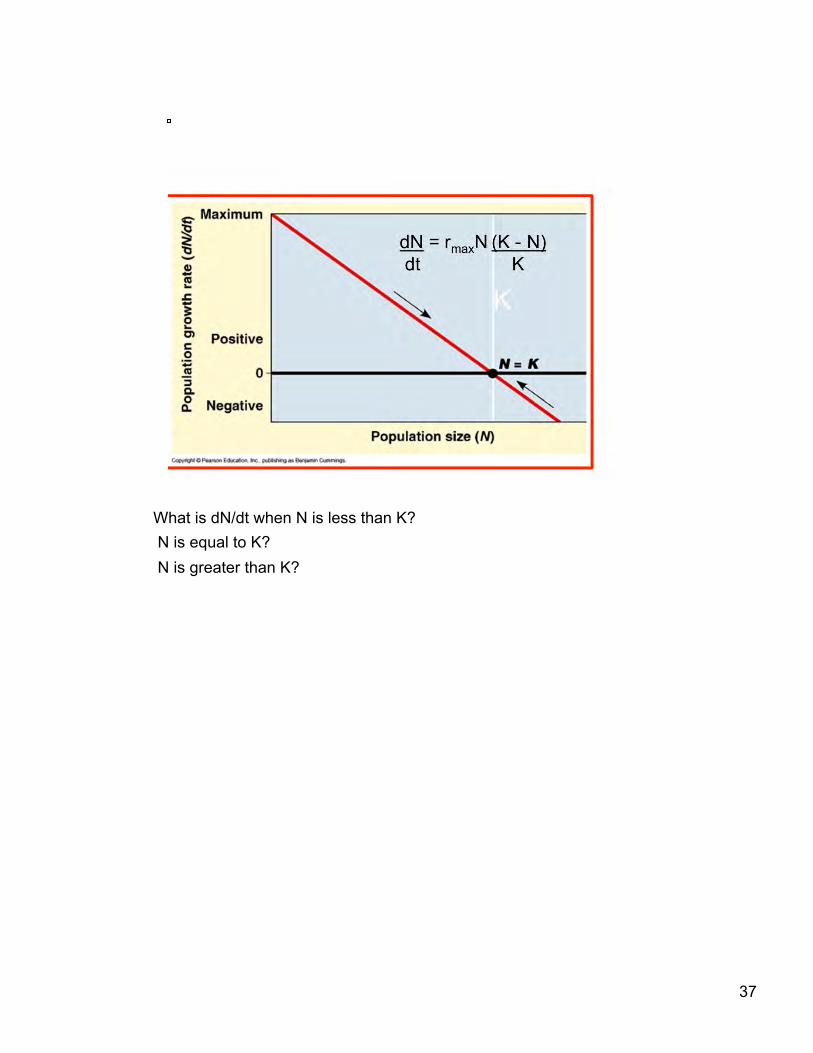
What is dN/dt when N is less than K? N is equal to K? N is greater than K?
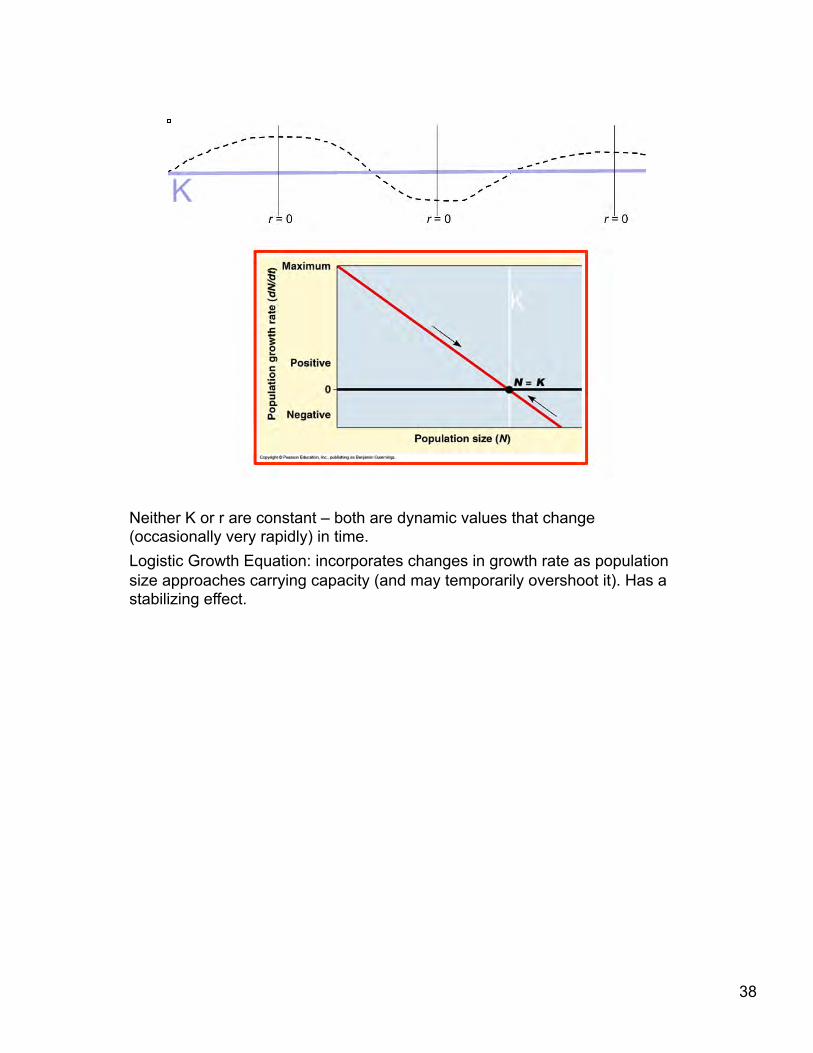
Neither K or r are constant – both are dynamic values that change (occasionally very rapidly) in time. Logistic Growth Equation: incorporates changes in growth rate as population size approaches carrying capacity (and may temporarily overshoot it). Has a stabilizing effect.
38
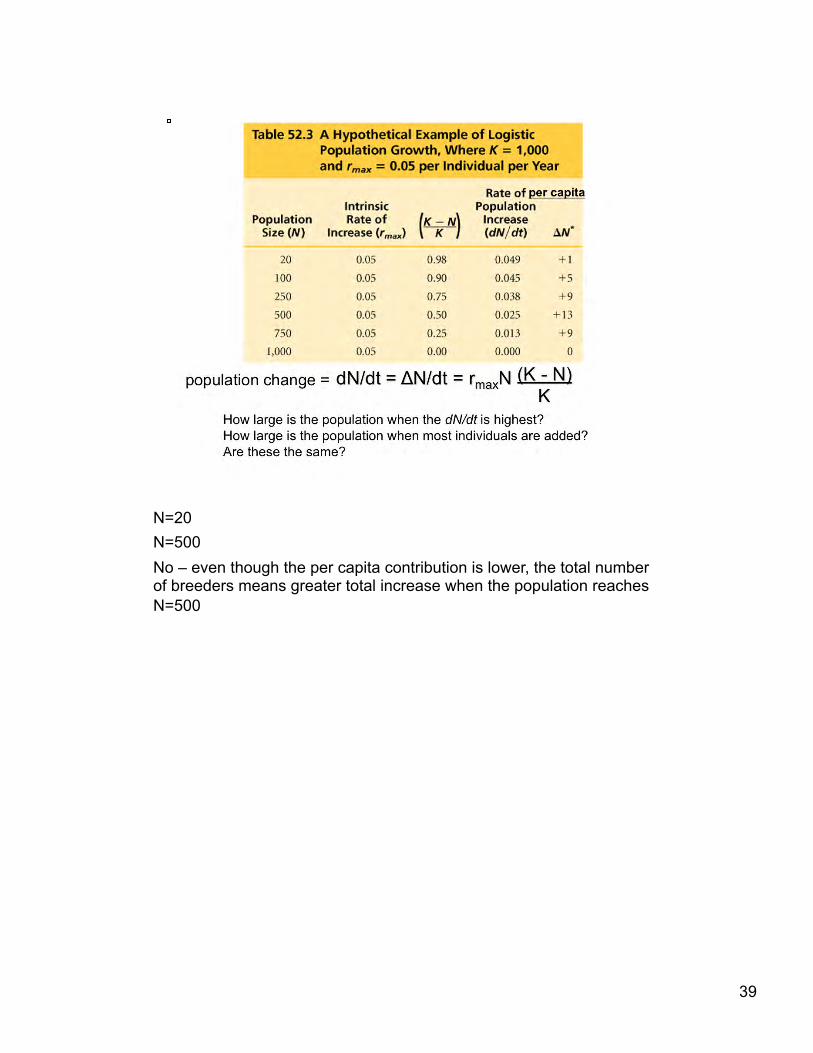
39
N=20 N=500 No – even though the per capita contribution is lower, the total number of breeders means greater total increase when the population reaches N=500
40
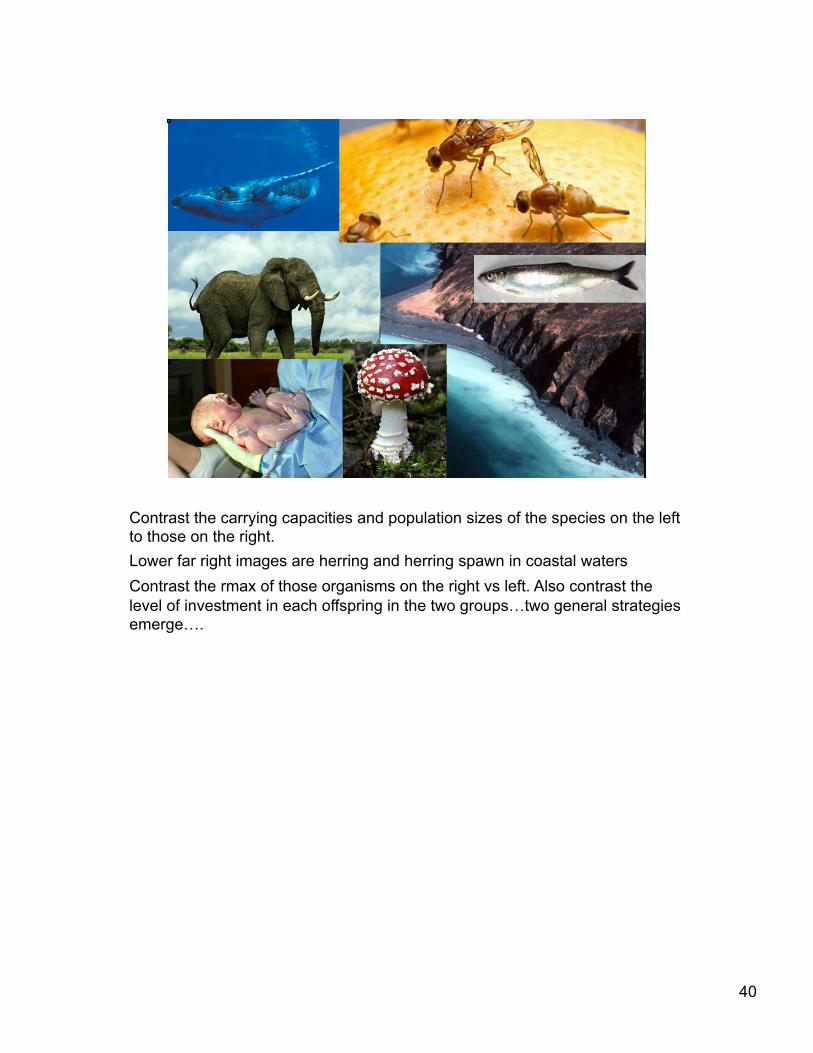
Contrast the carrying capacities and population sizes of the species on the left to those on the right. Lower far right images are herring and herring spawn in coastal waters Contrast the rmax of those organisms on the right vs left. Also contrast the level of investment in each offspring in the two groups…two general strategies emerge….

41
r and K are not absolute categories – best used for general comparisons. For example, rats are more r selected than humans but are definitely K selected relative to herring. One strategy is built around high reproduction to overcome high mortality. The other thrives in intensely competitive environments by producing few, high quality young. Which has greater capacity to respond to environmental change (adaptability)? r-strategists

42

43
Which of the three have the greatest r(max)? What advantage is there to a type II strategy? Typical type II species are both bottom-up and top-down limited. Therefore a type ii strategy permits maximum flexibility

The business world has long recognized the trade-offs between speed, quality and expense. r-strategists are fast because they are eco-cheap, but of low “quality” and cannot compete K-strategists are slow and expensive but high quality.
44
45
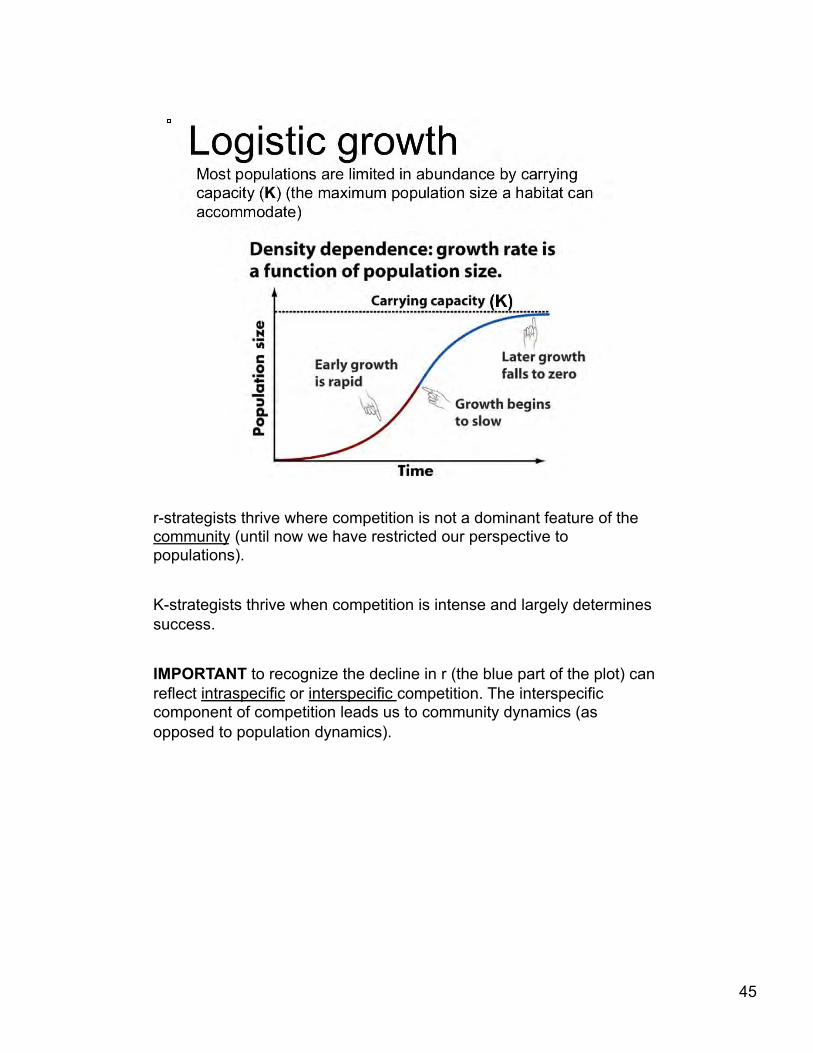
r-strategists thrive where competition is not a dominant feature of the community (until now we have restricted our perspective to populations). K-strategists thrive when competition is intense and largely determines success. IMPORTANT to recognize the decline in r (the blue part of the plot) can reflect intraspecific or interspecific competition. The interspecific component of competition leads us to community dynamics (as opposed to population dynamics).

46
Regardless of the physical particulars most systems change over time through succession of stages. - Highest species diversity in mid stage - early colonizers are generalists (r-strategists) - late dominants are highly competitive specialists (K-specialists) - - larger organisms (both plant and animal) not until later stages…why? These are “expensive” species and early stages do not have the ecological capital (primary and secondary production) necessary to support them.


