24 the Myth of FDI Impact on Growth
29
The Myth of FDI Impact on Growth in the SADC Region: The Case of Zimbabwe BY DR ALBERT MAFUSIRE Trade & Development Studies Centre [TRADES CENTRE] Harare, Zimbabwe TRADES CENTRE No. 3 Downie Avenue Belgravia Box CY 2549 Causeway Harare Tel 263 4 790423/8/41. Fax 263 4 790431 E mail [email protected] Trade & Development Studies Issue No. 24
-
Upload
matloobilahi -
Category
Documents
-
view
21 -
download
0
description
economic growth
Transcript of 24 the Myth of FDI Impact on Growth

The Myth of FDI Impact on Growth in the SADC Region: The Case of Zimbabwe
BY
DR ALBERT MAFUSIRE
Trade & Development Studies Centre [TRADES CENTRE] Harare, Zimbabwe
�
�
�
����������
TRADES CENTRE No. 3 Downie Avenue Belgravia Box CY 2549 Causeway Harare Tel 263 4 790423/8/41. Fax 263 4 790431 E mail [email protected]
Trade & Development Studies Issue No. 24
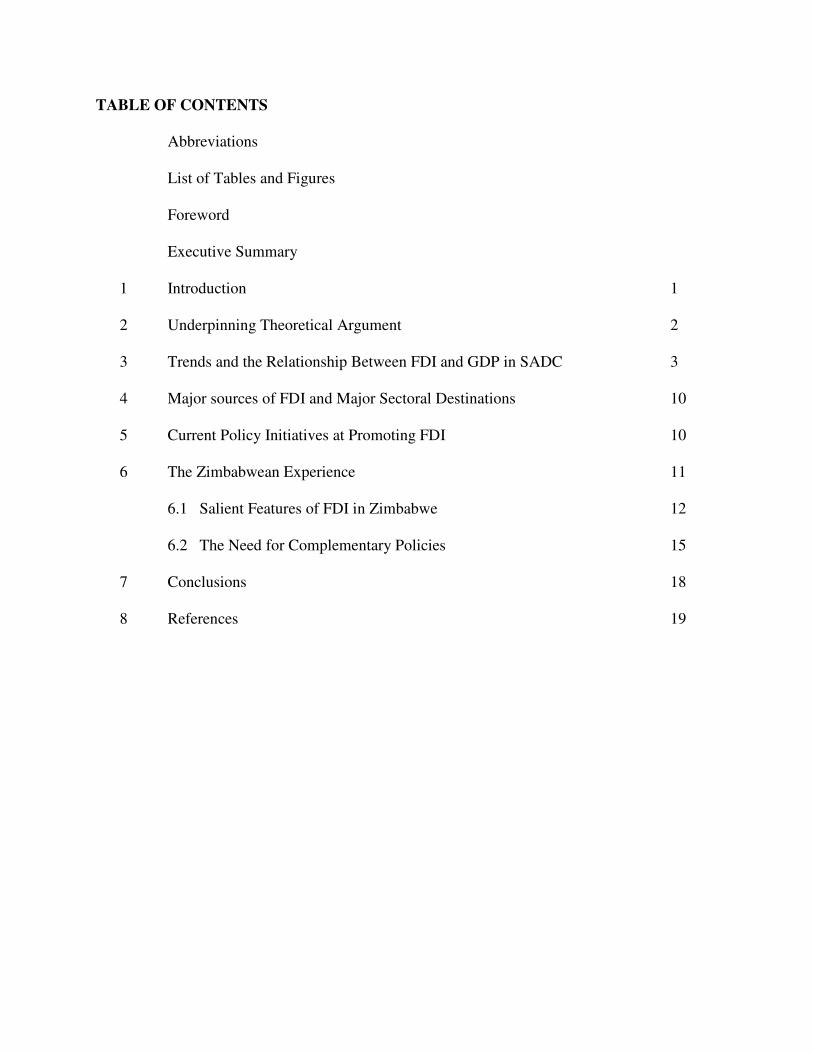
TABLE OF CONTENTS
Abbreviations
List of Tables and Figures
Foreword
Executive Summary 1 Introduction 1
2 Underpinning Theoretical Argument 2
3 Trends and the Relationship Between FDI and GDP in SADC 3 4 Major sources of FDI and Major Sectoral Destinations 10
5 Current Policy Initiatives at Promoting FDI 10 6 The Zimbabwean Experience 11
6.1 Salient Features of FDI in Zimbabwe 12 6.2 The Need for Complementary Policies 15
7 Conclusions 18 8 References 19

ABBREVIATIONS
AAG - Affirmative Action Group
BSAC - British South Africa Company
DRC - Democratic Republic of Congo
ESAP - Economic Structural Adjustment Programme
EPZ - Export Processing Zones
FDI - Foreign Direct Investment
GDP - Gross Domestic Product
GFCF - Gross Fixed Capital Formation
G OZ - Government of Zimbabwe
MF - International Monetary Fund
IBDC - Indigenous Business Development Centre
OECD - Organisation for Economic Co-operation and Development
SACU - Southern African Customs Union
SADC - Southern Africa Development Community
UNCTAD - United Nations Conference on Trade and Development
ZIC - Zimbabwe Investment Centre
ZIMCORD - Zimbabwe Conference on Reconstruction and Development
ZSE - Zimbabwe Stock Exchange

LIST OF TABLES AND FIGURES Figure 1: Schematic Illustration of Possible interactions between Exports, 2
FDI and Output Figure 2: Trends between GDP and Net FDI for selected countries 6 Table 1: Global, Regional Selected Country FDI Inflows 4 Table 2: FDI Net Inflows as a Percentage of GFCF in the SADC countries 5 Table 3: Country Grouping According to the Correlation Coefficient 8 Table 4: Business Form and Sectoral Distribution of Foreign Capital in Approved 15
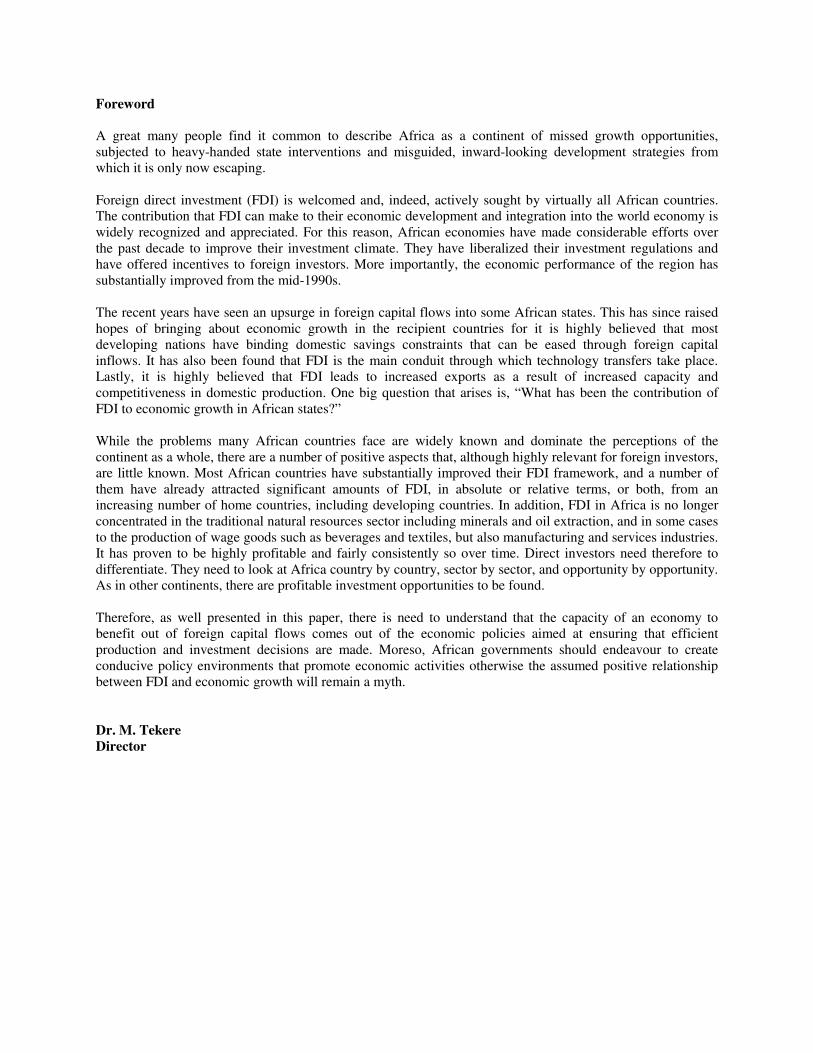
Foreword A great many people find it common to describe Africa as a continent of missed growth opportunities, subjected to heavy-handed state interventions and misguided, inward-looking development strategies from which it is only now escaping. Foreign direct investment (FDI) is welcomed and, indeed, actively sought by virtually all African countries. The contribution that FDI can make to their economic development and integration into the world economy is widely recognized and appreciated. For this reason, African economies have made considerable efforts over the past decade to improve their investment climate. They have liberalized their investment regulations and have offered incentives to foreign investors. More importantly, the economic performance of the region has substantially improved from the mid-1990s. The recent years have seen an upsurge in foreign capital flows into some African states. This has since raised hopes of bringing about economic growth in the recipient countries for it is highly believed that most developing nations have binding domestic savings constraints that can be eased through foreign capital inflows. It has also been found that FDI is the main conduit through which technology transfers take place. Lastly, it is highly believed that FDI leads to increased exports as a result of increased capacity and competitiveness in domestic production. One big question that arises is, “What has been the contribution of FDI to economic growth in African states?” While the problems many African countries face are widely known and dominate the perceptions of the continent as a whole, there are a number of positive aspects that, although highly relevant for foreign investors, are little known. Most African countries have substantially improved their FDI framework, and a number of them have already attracted significant amounts of FDI, in absolute or relative terms, or both, from an increasing number of home countries, including developing countries. In addition, FDI in Africa is no longer concentrated in the traditional natural resources sector including minerals and oil extraction, and in some cases to the production of wage goods such as beverages and textiles, but also manufacturing and services industries. It has proven to be highly profitable and fairly consistently so over time. Direct investors need therefore to differentiate. They need to look at Africa country by country, sector by sector, and opportunity by opportunity. As in other continents, there are profitable investment opportunities to be found. Therefore, as well presented in this paper, there is need to understand that the capacity of an economy to benefit out of foreign capital flows comes out of the economic policies aimed at ensuring that efficient production and investment decisions are made. Moreso, African governments should endeavour to create conducive policy environments that promote economic activities otherwise the assumed positive relationship between FDI and economic growth will remain a myth. Dr. M. Tekere Director
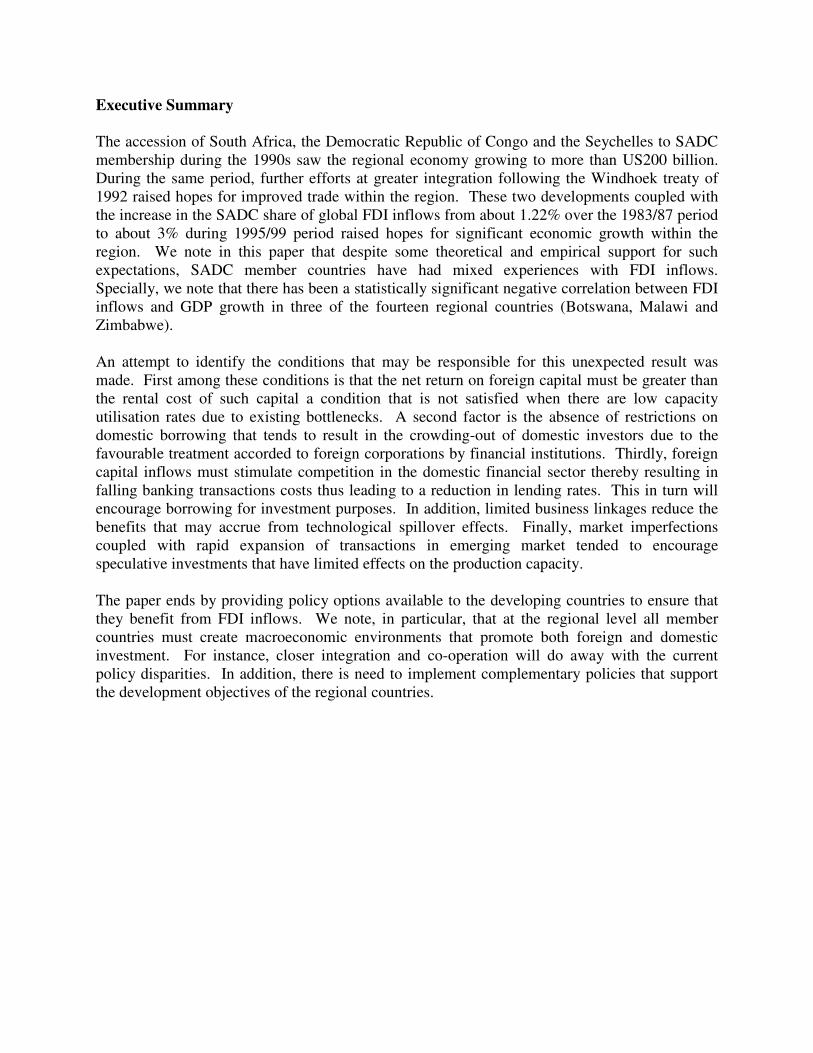
Executive Summary The accession of South Africa, the Democratic Republic of Congo and the Seychelles to SADC membership during the 1990s saw the regional economy growing to more than US200 billion. During the same period, further efforts at greater integration following the Windhoek treaty of 1992 raised hopes for improved trade within the region. These two developments coupled with the increase in the SADC share of global FDI inflows from about 1.22% over the 1983/87 period to about 3% during 1995/99 period raised hopes for significant economic growth within the region. We note in this paper that despite some theoretical and empirical support for such expectations, SADC member countries have had mixed experiences with FDI inflows. Specially, we note that there has been a statistically significant negative correlation between FDI inflows and GDP growth in three of the fourteen regional countries (Botswana, Malawi and Zimbabwe). An attempt to identify the conditions that may be responsible for this unexpected result was made. First among these conditions is that the net return on foreign capital must be greater than the rental cost of such capital a condition that is not satisfied when there are low capacity utilisation rates due to existing bottlenecks. A second factor is the absence of restrictions on domestic borrowing that tends to result in the crowding-out of domestic investors due to the favourable treatment accorded to foreign corporations by financial institutions. Thirdly, foreign capital inflows must stimulate competition in the domestic financial sector thereby resulting in falling banking transactions costs thus leading to a reduction in lending rates. This in turn will encourage borrowing for investment purposes. In addition, limited business linkages reduce the benefits that may accrue from technological spillover effects. Finally, market imperfections coupled with rapid expansion of transactions in emerging market tended to encourage speculative investments that have limited effects on the production capacity. The paper ends by providing policy options available to the developing countries to ensure that they benefit from FDI inflows. We note, in particular, that at the regional level all member countries must create macroeconomic environments that promote both foreign and domestic investment. For instance, closer integration and co-operation will do away with the current policy disparities. In addition, there is need to implement complementary policies that support the development objectives of the regional countries.


1
The Myth of FDI Impact on Growth in the SADC Region: The Case of Zimbabwe
1. Introduction The recent surge in foreign capital inflows into developing countries has generated a lot of interest among researchers wanting to analyse the economic implications of this phenomenon. While foreign capital inflows to Africa as a whole remain relatively small when compared to other regions like South–East Asia, the ratio of foreign capital inflows to GDP in some African countries is larger than that in some developed countries (Bhinda et al, 1999). Thus, FDI is expected to play a significant role in promoting economic growth within the region. Foreign investment inflows can be viewed as one of two forms. First, foreign investment inflows may take the form of greenfield investments, take-overs or equity injections in existing enterprises. Second, foreign capital may be in the form of arms-length relationships that include, inter alia, subcontracting, management contracts, turnkey arrangements, franchising, licensing and product sharing. Despite the fact that such non-equity forms of foreign investment accord greater flexibility on the investor in terms of entry and exit they still require significant commitment to ensure the success of the venture as a way of maintaining a good business reputation. These two forms of foreign capital inflows, however, have completely different effects on the economy though they are generally expected to result in output growth. It is therefore important to define foreign direct investment.
Foreign Direct Investment is defined as the flow of long-term investment resources from foreign residents/firms into another (host) country with the purpose of having management control. The OECD goes on to describe foreign direct investment as involving a long-term relationship and reflecting a lasting interest and control of a resident entity in one economy (foreign direct investor or parent enterprise) in an enterprise resident in an economy other than that of the direct investor. The investor exerts a significant degree of influence on the management of the enterprise resident in the other economy. Such investment involves both the initial transaction between the two entities and all subsequent transactions between them and among foreign affiliates, both incorporated and unincorporated. There are three components in FDI: equity capital, reinvested earnings and intra-company loans. FDI is attractive to the host countries because they are not obliged to assume any risk in the event that the venture fails to generate a return to the investor.
Following the accession to membership of South Africa in 1994 as well as the Windhoek Treaty of 1992, the SADC region is poised to attract an increasing share of the global inflows of foreign capital for two reasons. First, South Africa’s economy is fairly advanced and foreign investors who were not particularly interested in investing in any one of the smaller SADC countries but were exporting to the region may find it feasible to invest. Secondly, those foreign firms that were already doing business in the region might find it necessary to expand their operation to cater for the South African market. The GDP of the SADC economy now amounts to more than US$200 billion since the Democratic Republic of Congo (DRC) and the Seychelles became members in 1998.

2
However, economic disparities where three of the largest economies out of a total of fourteen countries in the region, South Africa, the DRC and Zimbabwe account for more than 80% of the total output smacks of extreme polarisation. Polarisation tends to limit the benefits of integration and may result in foreign investors preferring to locate in South Africa than in any of the other regional countries. It is further noted that considerable divergence of macroeconomic policy frameworks are likely to widen the disparities as the region moves towards more open trade. Given the existing economic differences between member states in the region we are motivated to investigate the impact of foreign capital inflows on individual countries’ output growth. Studies on this topic provide the theoretical arguments on the relationship between FDI and growth and these have been empirically tested. The following section is devoted to the theoretical issues that are relevant to this paper. 2. Underpinning Theoretical Arguments Existing economics literature identifies three separate channels through which FDI can bring about economic growth. Firstly, most developing countries have binding domestic savings constraints that can be eased through foreign capital inflows. As such, FDI augments domestic savings in the process of capital accumulation. Secondly, FDI is the main conduit through which technology transfers take place. Finally, FDI is believed to lead to increased exports as a result of increased capacity and competitiveness in domestic production. These channels have largely been treated as independent of each other (Mundell, 1957; Markusen, 1983; Pfaffermayr, 1994; Borensztein et al, 1998). However, it is possible to develop unified theoretical relationships between exports, FDI and growth. For example, FDI has a direct effect on growth through the multiplier effect and an indirect effect through the accelerator effect. In addition, the competitiveness effects of FDI on exports as well as the fact the FDI is one of the main conduits through which technology is transferred will impact on GDP through different channels. The nature of FDI effects on growth in an economy will thus depend on, among other things, viz: its effects on the relative proportions between tradable and non-tradable commodities, exchange rate movements and domestic policy environment. Figure 1 shows the primary and secondary roles of FDI in an economy. Figure 1: Schematic Illustration of Possible Interactions between Exports, FDI and Output Key Multiplier effect Accelerator effect Source: Mafusire, 2001
FDI
Increases total investment
Improved competitiveness - exports increase
Combined with labour and land
OUTPUT
Generates forex for capital goods imports
3
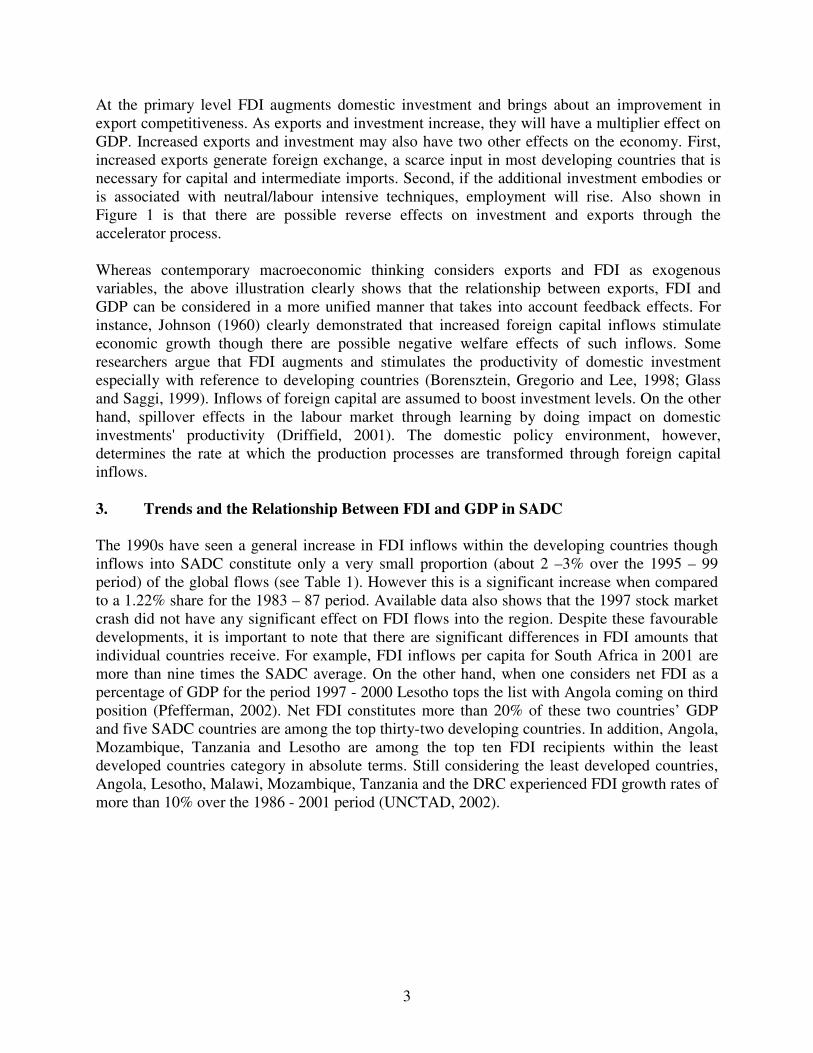
At the primary level FDI augments domestic investment and brings about an improvement in export competitiveness. As exports and investment increase, they will have a multiplier effect on GDP. Increased exports and investment may also have two other effects on the economy. First, increased exports generate foreign exchange, a scarce input in most developing countries that is necessary for capital and intermediate imports. Second, if the additional investment embodies or is associated with neutral/labour intensive techniques, employment will rise. Also shown in Figure 1 is that there are possible reverse effects on investment and exports through the accelerator process. Whereas contemporary macroeconomic thinking considers exports and FDI as exogenous variables, the above illustration clearly shows that the relationship between exports, FDI and GDP can be considered in a more unified manner that takes into account feedback effects. For instance, Johnson (1960) clearly demonstrated that increased foreign capital inflows stimulate economic growth though there are possible negative welfare effects of such inflows. Some researchers argue that FDI augments and stimulates the productivity of domestic investment especially with reference to developing countries (Borensztein, Gregorio and Lee, 1998; Glass and Saggi, 1999). Inflows of foreign capital are assumed to boost investment levels. On the other hand, spillover effects in the labour market through learning by doing impact on domestic investments' productivity (Driffield, 2001). The domestic policy environment, however, determines the rate at which the production processes are transformed through foreign capital inflows. 3. Trends and the Relationship Between FDI and GDP in SADC The 1990s have seen a general increase in FDI inflows within the developing countries though inflows into SADC constitute only a very small proportion (about 2 –3% over the 1995 – 99 period) of the global flows (see Table 1). However this is a significant increase when compared to a 1.22% share for the 1983 – 87 period. Available data also shows that the 1997 stock market crash did not have any significant effect on FDI flows into the region. Despite these favourable developments, it is important to note that there are significant differences in FDI amounts that individual countries receive. For example, FDI inflows per capita for South Africa in 2001 are more than nine times the SADC average. On the other hand, when one considers net FDI as a percentage of GDP for the period 1997 - 2000 Lesotho tops the list with Angola coming on third position (Pfefferman, 2002). Net FDI constitutes more than 20% of these two countries’ GDP and five SADC countries are among the top thirty-two developing countries. In addition, Angola, Mozambique, Tanzania and Lesotho are among the top ten FDI recipients within the least developed countries category in absolute terms. Still considering the least developed countries, Angola, Lesotho, Malawi, Mozambique, Tanzania and the DRC experienced FDI growth rates of more than 10% over the 1986 - 2001 period (UNCTAD, 2002).
4
Table 1: Global, Regional and Selected Countries FDI Inflows (US$ million) YE.AR 1980 1985 1990 1991 1992 1993 1994 1995 1996 1997 1998 1999 2000 2001
World 54945 57596202782160199171199 227532 259696 330516 386140 478082694457 1088263 1491934 735146
Developed
countries 46530 42693164575113099107288 137153 144686 203311 219908 267947484239 837761 1227476 503144
Western
Europe 21427 16762 96803 80112 72201 74432 82481 118265 115863 137890274739 507222 832067 336210
Developing
countries 8380 14873 37567 44396 59238 83294 108699 112537 152685 191022187611 225140 237894 204801
Africa 380 2407 2483 3307 3840 4420 6127 5743 5835 10744 9021 12821 8694 17165
North Africa 140 1422 1156 915 1674 1798 2396 1318 1479 2607 2788 4896 2904 5323
Angola 37 278 -335 665 288 302 170 472 181 412 1114 2471 879 1119
Botswana 112 54 96 -8 -2 -287 -14 70 70 100 96 37 57 57
DRC 110 69 -14 12 -1 7 -2 -22 25 -44 61 11 23 32
Lesotho 4 4 87 174 211 254 273 275 286 269 262 163 119 118
Malawi 9 1 23 18 2 11 9 25 44 22 70 60 45 58
Mauritius 1 8 41 19 15 15 20 19 37 55 12 49 277 12
Mozambique 4 0 9 23 25 32 35 45 73 64 235 382 139 255
Namibia - 16 30 120 118 55 98 153 129 84 77 111 15`3 99
Seychelles 10 12 20 20 9 19 30 40 30 54 55 60 56 34
South Africa -19 -453 -78 248 4 10 380 1241 818 3817 561 1502 888 6653
Swaziland 26 12 30 82 87 72 63 44 22 -15 152 100 -19 69
Tanzania 5 15 0 0 12 20 50 150 149 158 172 183 193 224
Zambia 62 52 203 34 45 314 40 97 117 207 198 163 122 72
Zimbabwe 2 3 -12 3 19 38 41 118 81 135 444 59 23 5
SADC 363 70 99 1410 833 862 1193 2727 2059 5319 3511 5352 2956 8807
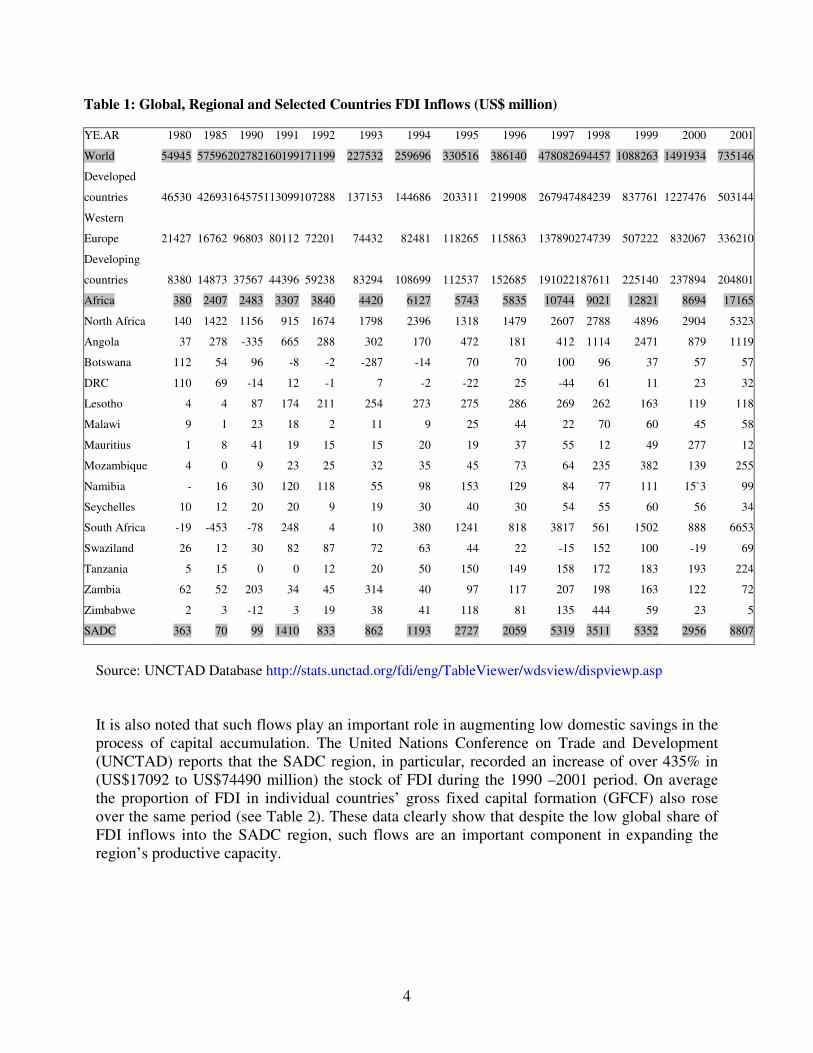
Source: UNCTAD Database http://stats.unctad.org/fdi/eng/TableViewer/wdsview/dispviewp.asp It is also noted that such flows play an important role in augmenting low domestic savings in the process of capital accumulation. The United Nations Conference on Trade and Development (UNCTAD) reports that the SADC region, in particular, recorded an increase of over 435% in (US$17092 to US$74490 million) the stock of FDI during the 1990 –2001 period. On average the proportion of FDI in individual countries’ gross fixed capital formation (GFCF) also rose over the same period (see Table 2). These data clearly show that despite the low global share of FDI inflows into the SADC region, such flows are an important component in expanding the region’s productive capacity.

5
Table 2: FDI Net Inflows as a Percentage of GFCF in the SADC Countries Country 1990 1991 1992 1993 1994 1995 1996 1997 1998 1999 2000 Angola -29 42 138 22 14 50 9 21 72 104 35 Botswana 8 -1 -0 -27 -1 6 6 9 8 3 4 D R Congo -1 2 -0 2 -0 -4 6 -11 13 3 5 Lesotho 26 39 39 56 57 48 52 48 60 38 31 Malawi 8 5 1 4 3 12 20 9 36 27 20 Mauritius 5 2 2 2 2 2 3 5 1 4 26 Mozambique 1 5 7 8 8 8 13 10 27 30 11 Namibia 6 30 20 9 15 20 16 12 10 14 25 Seychelles 24 25 10 15 23 26 18 32 26 26 31 South Africa -0 1 0 0 2 5 4 16 3 8 5 Swaziland 19 48 36 28 19 10 6 -3 35 21 -5 Tanzania 0 0 1 2 5 15 14 14 13 14 12 Zambia 40 9 13 84 5 10 8 14 37 29 23 Zimbabwe -1 0 1 2 3 7 4 8 44 7 3
Source: UNCTAD Database http://stats.unctad.org/fdi/eng/TableViewer/wdsview/dispviewp.asp
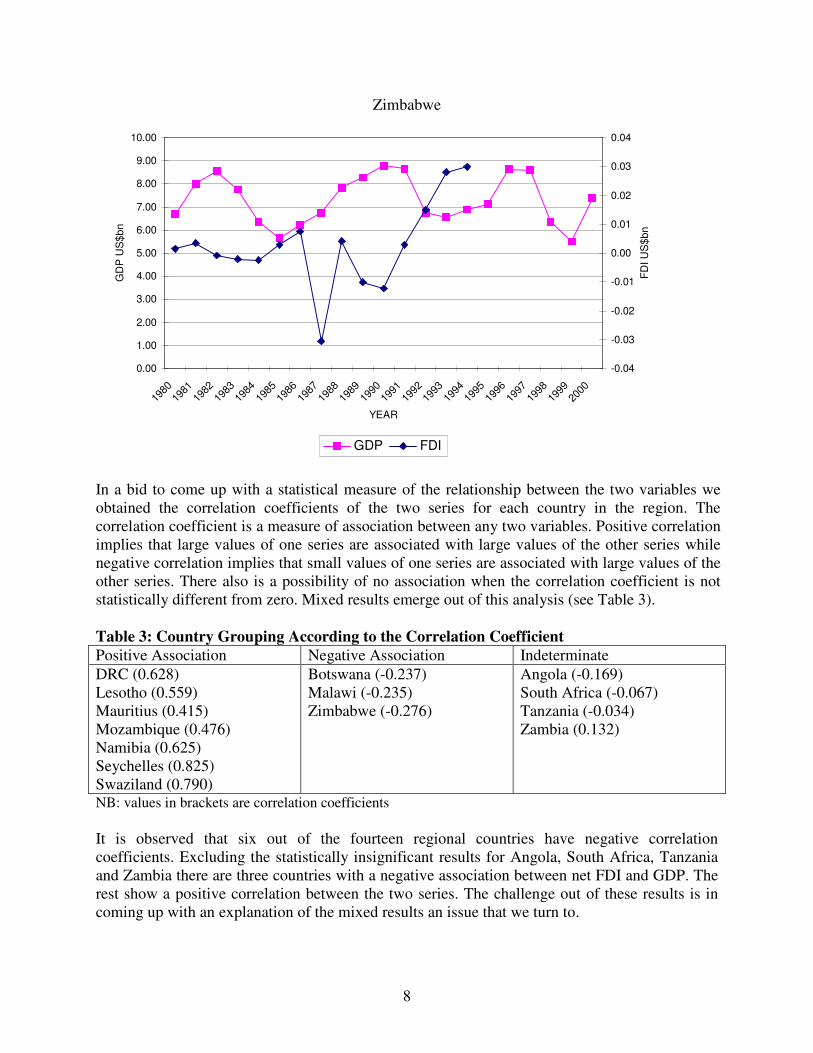
Yet another recent observation is that South African corporations have increased investments in countries other than the Southern African Customs Union1 (SACU) and Zimbabwe since joining the regional grouping in 1994. In addition, there has been a broadening in the sources of FDI. For instance in 2000 and 2001 the largest volume of investment approvals in Zimbabwe were from China and Mauritius and these amounted to Z$698 million and Z$2049.2 million respectively. With reference to the brief theoretical exposition in Section 2 above, it is important that we turn to the relationship between net FDI and GDP. Figure 2 above illustrates the trend between the two variables over the 1980 – 2000 period for a selected group of countries in the region. From Figure 2 there appears to be no clear relationship between net FDI and GDP trend.
1 Includes Botswana, Lesotho, Namibia, South Africa and Swaziland.

6
Figure 2: Trends between GDP and Net FDI for selected countries
Botswana
0.00
1.00
2.00
3.00
4.00
5.00
6.0019
80
1981
1982
1983
1984
1985
1986
1987
1988
1989
1990
1991
1992
1993
1994
1995
1996
1997
1998
1999
2000
YEAR
GD
P U
S$b
n
-0.35
-0.30
-0.25
-0.20
-0.15
-0.10
-0.05
0.00
0.05
0.10
0.15
FDI U
S$b
n
GDP FDI
Mauritius
0.00
0.50
1.00
1.50
2.00
2.50
3.00
3.50
4.00
4.50
5.00
1980
1981
1982
1983
1984
1985
1986
1987
1988
1989
1990
1991
1992
1993
1994
1995
1996
1997
1998
1999
2000
YEAR
GD
P U
S$b
n
-0.05
0.00
0.05
0.10
0.15
0.20
0.25
0.30
FDI U
S$b
n
GDP FDI

7
Seychelles
0.00
0.10
0.20
0.30
0.40
0.50
0.60
0.70
198019811982198319841985198619871988198919901991199219931994199519961997199819992000
YEAR
GD
P U
S$b
n
0.00
0.01
0.02
0.03
0.04
0.05
0.06
FDI U
S$b
n
GDP FDI
South Africa
0.00
20.00
40.00
60.00
80.00
100.00
120.00
140.00
160.00
1980
1981
1982
1983
1984
1985
1986
1987
1988
1989
1990
1991
1992
1993
1994
1995
1996
1997
1998
1999
2000
YEAR
GD
P U
S$b
n
-2.50
-2.00
-1.50
-1.00
-0.50
0.00
0.50
1.00
1.50
2.00
FDI U
S$b
n
GDP FDI
8
Zimbabwe
0.00
1.00
2.00
3.00
4.00
5.00
6.00
7.00
8.00
9.00
10.00
1980
1981
1982
1983
1984
1985
1986
1987
1988
1989
1990
1991
1992
1993
1994
1995
1996
1997
1998
1999
2000
YEAR
GD
P U
S$b
n
-0.04
-0.03
-0.02
-0.01
0.00
0.01
0.02
0.03
0.04
FDI U
S$b
n
GDP FDI
In a bid to come up with a statistical measure of the relationship between the two variables we obtained the correlation coefficients of the two series for each country in the region. The correlation coefficient is a measure of association between any two variables. Positive correlation implies that large values of one series are associated with large values of the other series while negative correlation implies that small values of one series are associated with large values of the other series. There also is a possibility of no association when the correlation coefficient is not statistically different from zero. Mixed results emerge out of this analysis (see Table 3). Table 3: Country Grouping According to the Correlation Coefficient Positive Association Negative Association Indeterminate DRC (0.628) Lesotho (0.559) Mauritius (0.415) Mozambique (0.476) Namibia (0.625) Seychelles (0.825) Swaziland (0.790)
Botswana (-0.237) Malawi (-0.235) Zimbabwe (-0.276)
Angola (-0.169) South Africa (-0.067) Tanzania (-0.034) Zambia (0.132)
NB: values in brackets are correlation coefficients It is observed that six out of the fourteen regional countries have negative correlation coefficients. Excluding the statistically insignificant results for Angola, South Africa, Tanzania and Zambia there are three countries with a negative association between net FDI and GDP. The rest show a positive correlation between the two series. The challenge out of these results is in coming up with an explanation of the mixed results an issue that we turn to.
9
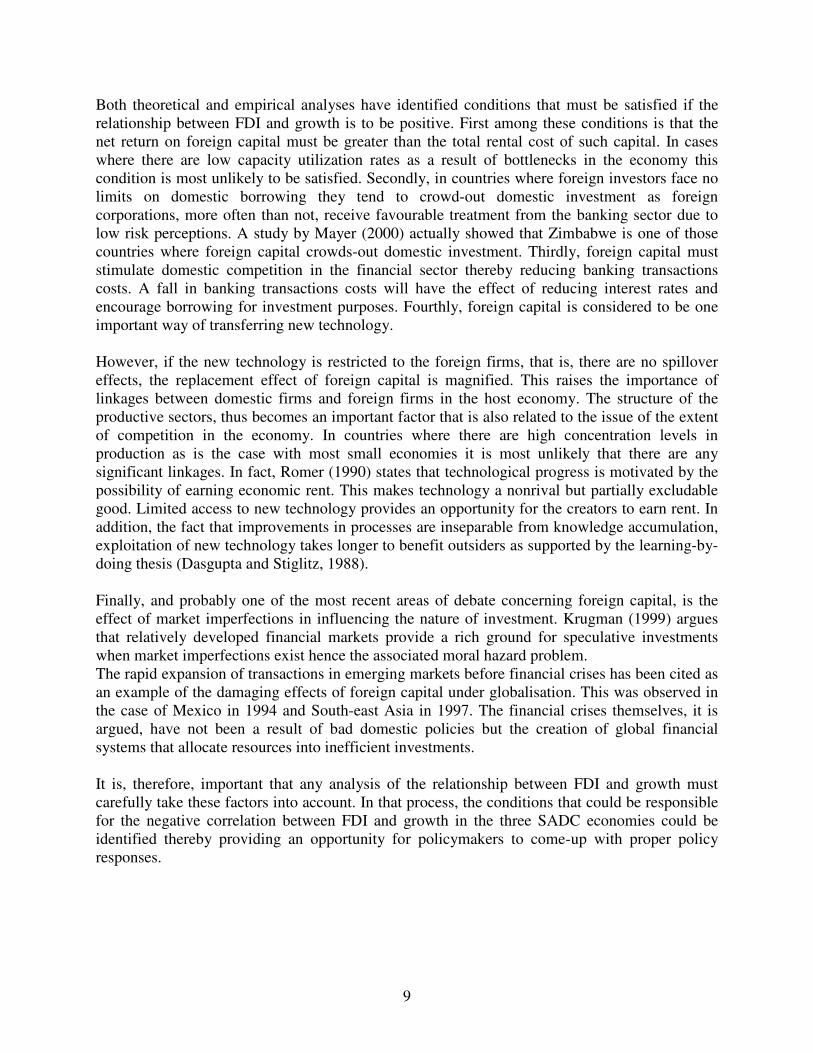
Both theoretical and empirical analyses have identified conditions that must be satisfied if the relationship between FDI and growth is to be positive. First among these conditions is that the net return on foreign capital must be greater than the total rental cost of such capital. In cases where there are low capacity utilization rates as a result of bottlenecks in the economy this condition is most unlikely to be satisfied. Secondly, in countries where foreign investors face no limits on domestic borrowing they tend to crowd-out domestic investment as foreign corporations, more often than not, receive favourable treatment from the banking sector due to low risk perceptions. A study by Mayer (2000) actually showed that Zimbabwe is one of those countries where foreign capital crowds-out domestic investment. Thirdly, foreign capital must stimulate domestic competition in the financial sector thereby reducing banking transactions costs. A fall in banking transactions costs will have the effect of reducing interest rates and encourage borrowing for investment purposes. Fourthly, foreign capital is considered to be one important way of transferring new technology. However, if the new technology is restricted to the foreign firms, that is, there are no spillover effects, the replacement effect of foreign capital is magnified. This raises the importance of linkages between domestic firms and foreign firms in the host economy. The structure of the productive sectors, thus becomes an important factor that is also related to the issue of the extent of competition in the economy. In countries where there are high concentration levels in production as is the case with most small economies it is most unlikely that there are any significant linkages. In fact, Romer (1990) states that technological progress is motivated by the possibility of earning economic rent. This makes technology a nonrival but partially excludable good. Limited access to new technology provides an opportunity for the creators to earn rent. In addition, the fact that improvements in processes are inseparable from knowledge accumulation, exploitation of new technology takes longer to benefit outsiders as supported by the learning-by-doing thesis (Dasgupta and Stiglitz, 1988). Finally, and probably one of the most recent areas of debate concerning foreign capital, is the effect of market imperfections in influencing the nature of investment. Krugman (1999) argues that relatively developed financial markets provide a rich ground for speculative investments when market imperfections exist hence the associated moral hazard problem. The rapid expansion of transactions in emerging markets before financial crises has been cited as an example of the damaging effects of foreign capital under globalisation. This was observed in the case of Mexico in 1994 and South-east Asia in 1997. The financial crises themselves, it is argued, have not been a result of bad domestic policies but the creation of global financial systems that allocate resources into inefficient investments. It is, therefore, important that any analysis of the relationship between FDI and growth must carefully take these factors into account. In that process, the conditions that could be responsible for the negative correlation between FDI and growth in the three SADC economies could be identified thereby providing an opportunity for policymakers to come-up with proper policy responses.

10
4. Major Sources of FDI and Major Sectoral Destinations Traditionally, the former colonial powers used to be the largest sources of FDI. In recent years, however, this trend has been changing reflecting the increased degree of globalisation. In Zimbabwe, for example, there has been an apparent shift in the sources of foreign capital from the traditional investors like the United Kingdom. Relatively less developed countries that include China, India, Malaysia and Pakistan have emerged as major investors (ZIC, 2001). As such, foreign capital inflows could be associated with an inflow of intermediate technology levels. European and Nordic countries, Japan and the United States are among the developed economies that are major sources of FDI into the SADC region. From the developing world China, Afghanistan and Malaysia have invested in the region. Generally, foreign capital has been invested in extractive, motor vehicle sales, food manufacturing, construction, finance and related activities. 5. Current Policy Initiatives at Promoting FDI Just as the FDI sources have increased, investors now have a wider choice on where to invest. To that extent, there is increasing competition for the important resource on a global scale. Within the SADC context the differences in FDI inflows into the individual regional economies reflect the choices that are available to the foreign investor with respect to their assessment of the investment climate. For instance, whereas Botswana and Zimbabwe were bigger hosts for South African FDI in 1993, Namibia and Swaziland had overtaken the former by 1995 to become more popular destinations of FDI from South Africa. This took place despite the fact that Zimbabwe is the largest single South African trading partner in the region. Due to the increased competition individual countries have gone on to put in place policies and incentives meant to attract FDI. At a regional scale a move towards closer integration and co-operation has the effect of enlarging the regional economy thereby placing the region at a better position of attracting foreign capital. The economic reforms that most of the regional countries have embarked on are also a positive development. The SADC countries are moving toward market-oriented economies with greater trade liberalisation. The attraction of FDI into individual countries in the region, therefore, is most likely going to be influenced by location and specific pull factors other than market size. Major constraints on FDI inflows have been detailed in Jenkins, Leape and Thomas (2000). In their study of FDI they raise concerns on bureaucratic tendencies, poor infrastructural development and high taxation levels as some of the major reasons that discourage foreign capital inflows into the region. Some of these issues are being addressed or are still to be addressed. In particular, almost all the countries in the region have established investment administration institutions that are meant to act as one-stop investment centres. In addition, all the countries have put in place investment and export incentives to encourage FDI and export activities. Among some of the incentives are tax breaks, reduced tax levels for export activities, reduction or elimination of restrictions on foreign capital participation, relaxation of foreign exchange controls, duty-free importation of capital and intermediate inputs and the establishment of export processing zones.

11
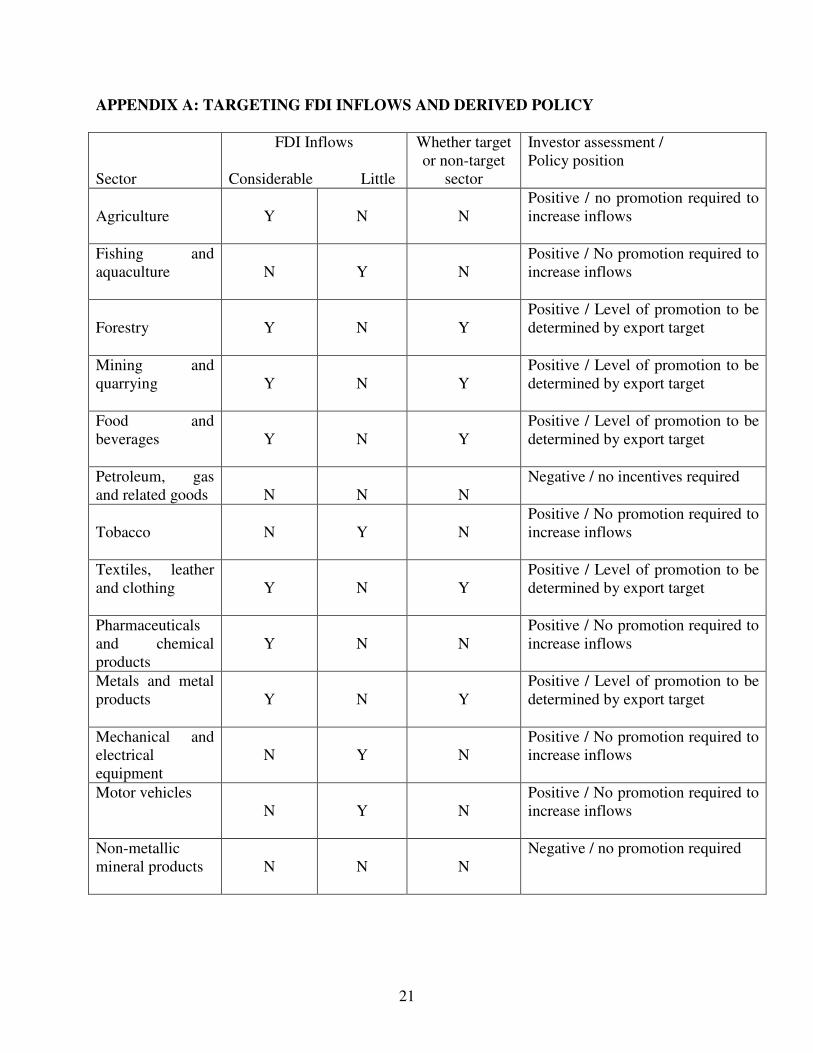
6. The Zimbabwean Experience Policies that the government of Zimbabwe (GOZ) inherited at independence in 1980 and those that it embraced thereafter with a view to addressing inequalities and the high unemployment levels that existed in the country did not provide the expected result. In particular, its thrust as spelt out in a policy document Growth with Equity (GOZ, 1981) did not provide a balance between the elimination of inequalities and the stimulation of sufficient industrial growth necessary to sustain its ambitious programmes. It is true that the funds pledged at the Zimbabwe Conference on Reconstruction and Development (ZIMCORD) held in 1981 were not fully honoured. The frequent drought spells also limited the government's ability to deliver. However, the government's ineptitude in re-focusing policy or even revising its targets landed the country in serious macro-economic problems. As a result, the industrial infrastructure deteriorated with serious implications on the performance of the industrial sector that faced a host of other controls that had been inherited from the previous regime. As the government came to grips with the deteriorating economic conditions, debate on structurally adjusting the economy was initiated as early as 1987 culminating in the Policy Reform Document (GOZ, 1991) that received support from the IMF and the World Bank. Of particular interest in the reform framework was the move by the government to openly encourage foreign capital inflows by streamlining investment procedures and the setting-up of a one-stop investment centre to expedite investment approvals. Restrictions on dividend remittance that had been criticised as discriminatory were relaxed. Furthermore, provisions were made within the reform framework to establish export-processing zones (EPZs) that are now operational. The Bretton Woods institutions gave support to the Economic Structural Adjustment Programme (ESAP). Within this programme a gradual dismantling of the import substitution policies inherited from the previous regime was to be undertaken. Interventions on the market place in the form of price controls, subsidies, labour and wage policies were considered inefficient. The foreign exchange allocation system was abandoned leading to a single exchange rate by 1994. Financial support of the programme from the international community eased the foreign exchange shortage. Increased import competition in the final goods market as the economy was opened up put pressure on domestic producers leading to a decline in manufacturing production despite concerted efforts targeting investment into the sector. An increase in the demand for capital imports in all sectors of the economy and a sluggish response in the export sector saw the current account balance worsening. Investment targeting into the manufacturing sector2 in the absence of a well-defined industrial policy is one of the factors that contributed to a huge increase in import demand given that the manufacturing sector is import dependent. Government's reluctance to move faster on the public enterprise reform programme, a general lack of political commitment to the reforms and the 1997 stock market crash resulted in wide disparities between the reform targets and what actually held. The IMF withdrew its support of the programme and the rest of donor community that takes its cue from the IMF followed suit. Worse still, the current international isolation associated with, among other factors, the ‘fast-track’ land redistribution programme and the declaration that SS ESAP was dead has put to rest any expectations of a return to the economic reforms. 2 See Appendix A for the criteria on targeting as compared to investors’ assessments

12
Nonetheless, foreign capital inflows are considered as the drivers of export diversification and growth (UNCTAD 1999). The surge in FDI inflows during the reform period (1991 – 95) until 1998 took place on the backdrop of increasing uneasiness by local investors whose campaign for indigenisation, spearheaded by the Indigenous Business Development Centre (IBDC) and the Affirmative Action Group (AAG) was gathering momentum. Local entrepreneurs argued that foreign firms engage in unfair market practices given their size relative to the market and the preferential treatment they receive from financial institutions. There were demands for joint ventures, licensing or franchise arrangements despite the attendant principal-agent problems associated with incomplete contracts, an aspect that is central in the eclectic theory of foreign investment (Williamson, 1999). According to Williamson, joint ownership agreements, more often than not, constitute incomplete contracts in that whereas the ownership is clearly specified those who own the largest share of the company are left to shoulder the burden of monitoring the activities of the company. Data on approved investment proposals in Zimbabwe indicates that the share of joint venture capital increased from 55.7 percent in 1995 to 79.6 percent in 2000. Despite the increasing domestic pressures for indigenisation, the government's position was to encourage foreign capital as it was seen as necessary in the process of capital accumulation and technology transfer. However, the outcome of the analysis in Section 3 above does not provide any evidence of a positive relationship between FDI and economic growth in the case of Zimbabwe. In the following section we consider both the historical and current aspects of FDI in Zimbabwe’s economy. 6.1. Salient Features of FDI in Zimbabwe The year 1890 marks the beginning of engagement by foreign interests in both the political and economic matters of the country. After having received the blessing of the British government and an undertaking to extend the empire north of the Limpopo River, Cecil J. Rhodes, accompanied by several hundreds of men constituting the Pioneer Column crossed, into Zimbabwe3 from South Africa. Prior to the column's northward adventure, the controversial Rudd concession had been secured but its prospecting rights could only be recognised through the granting of a royal charter. The British South Africa Company (BSA Company) came into being after a charter to establish the company got support from the Duke of Fife and the Duke of Abercon (Pakenham, 1991). Central to the formation of the company were prospects of a second Rand in Mashonaland. Given the fact that the company ventured into some virgin land, the capital outlay required was high. In particular there was need for a large sum of money to meet the salaries of security personnel, the British South Africa Police (BSAP), as confrontation with the Ndebele warriors could not be ruled out. Fortunately, the expected confrontation was skillfully avoided through a combination of cheating and bribing of King Lobengula and the Column eventually established itself at Fort Salisbury (Harare) later to become the capital. 3 Formerly Southern Rhodesia and subsequently Rhodesia during the Smith’s (1965 – 78) government

13
However, hopes of recovering the huge costs (estimated at £187,000) incurred by the company were dashed as the gold deposits discovered were far below expectations. The extensive rich soils coupled with the favourable climate on the highveld provided an alternative economic activity and later further expansion of economic activities. It is important to note that being the pioneer in extending British interests, the BSA Company assumed administrative powers over land despite the existence of the Colonial Office personnel in the country. As a result, the BSA Company’s activities where implicitly guaranteed by the administrative power of that time. Clarke (1980) rightly acknowledges that the company's powers in securing interests of the investors made it a 'blue chip' even though it was unable to pay dividends for many years. In that process, a business empire with interests in land, mining, finance, industry and infrastructure was created. South African investors provided financial requirements of the company and other independent ventures and these amounted to about £35.9 million of capital inflows between 1890 and 1935 (Frankel, 1938). Despite these huge sums of money invested in the country, the economy was largely based on extractive industries whose produce was destined for the export market while most of the consumer goods came from Britain or South Africa. As the settler population (a population whose presence and skills were central to the growth of the company) increased in numbers, their welfare became a direct responsibility of the British South Africa Company. The welfare needs of the settler population had to be met from the company funds, a development the South African investors resented. Demands for a separation of state and company responsibilities became a big issue culminating in the setting up of a British Colony with self-governing status in 1923. At this point it became clear that though the company had initially assumed some administrative role the main objective was to avoid conflicts that would put investor interests at risk rather than gaining political control. Surprisingly enough, though it was by then clear that the country did not have large gold deposits, it did not precipitate withdrawal of capital. The magnitude of costs already incurred could have meant huge losses, especially when there were no ready buyers to take over the company. In the meantime, specific events that later proved important to the survival of the company unfolded. One of these factors was the increase in the white immigrant population. The diversification of the economy resulting from increased white immigrants attracted by access to land and financial protection provided a base for further expansion and growth of the money economy. Significant in this development is the link between new capital to international banks (Standard Chartered and Barclays Banks) and the export market as most industrial activities were of an extractive nature. Thus the early settlers and the new immigrants formed a nucleus of the domestic capitalist class complementing efforts of foreign capital. This observation could have prompted Stoneman (1976) to say;
'Domestic capital has always been subordinate to foreign capital, and it might be more useful conceptually to focus attention on it, as a perturbation modifying the integration of Rhodesia into the world capitalist system, rather than positing a ''Rhodesian Development'' which is then influenced by foreign capital' (P. 26).
The modern sector in Zimbabwe was from the beginning linked to foreign capital originating mainly from Britain, links that have continued to the present time.
14
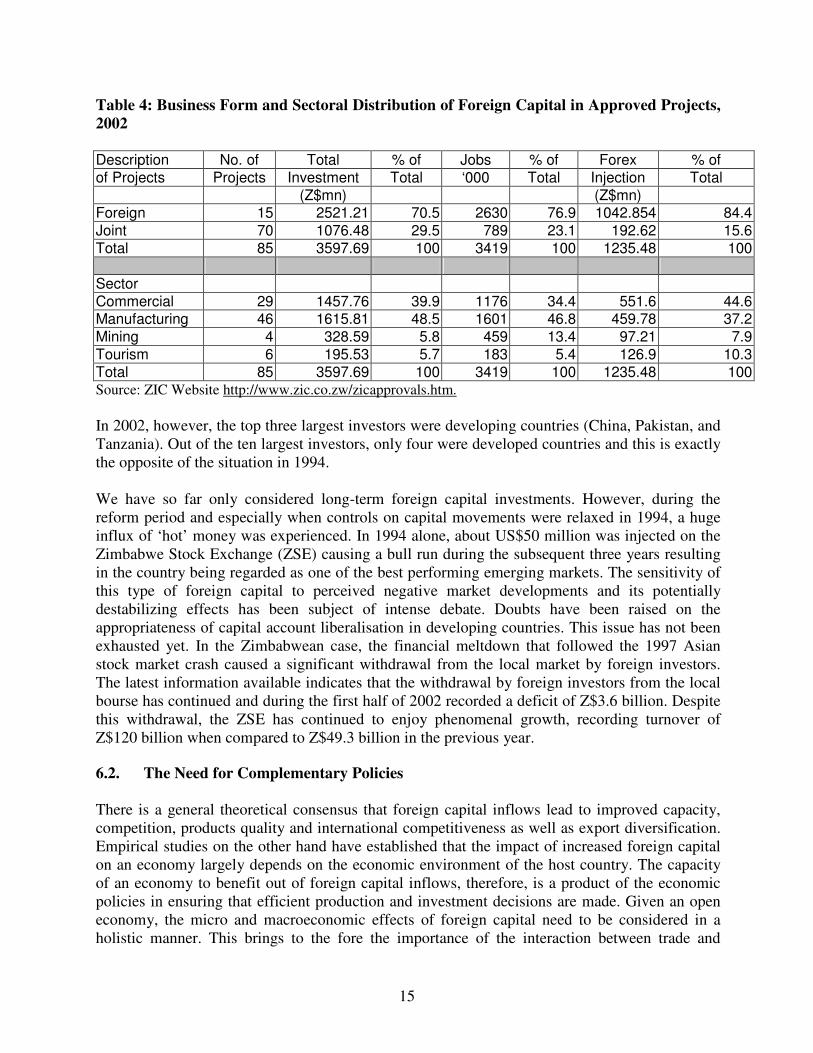
An interesting point to note at this juncture, is that, the only involvement by the native population was in the form of providing cheap unskilled labour with no indication whatsoever of incorporating them into the modern sector. Laws enacted during that time were meant to avoid any possible competition in the production and marketing of goods from the native population. Thus a dual economy characterised by the separate, though not mutually exclusive, existence of the modern and primitive native (and presumably undisturbed, were it not for the forced labour system –“chibaro”- at a later stage) sectors emerged. While such issues relating to the development of the country may be pertinent, they are not within the scope of the current study. Detailed studies covering such issues and their effect on the development of Zimbabwe do exist [Arrighi (1967 & 1970); Barber (1961) and Hazelwood (1967)]. The composition of capital ownership reflected the country's position within an international set-up. A striking feature is that major foreign investments were mainly of British and South African origin, showing the close partnership between the two countries and the importance of the country as a source of minerals. The diversification of the mining companies into other minerals attracted American (chrome) and Canadian capital during the later years. Despite the fall in its relative share of ownership the BSA Company diversified its investments. Its control over the railways, the life-line to South African and Mozambican ports was of strategic importance. Increased state participation in the 1920s and the 1980s, the entry of new investors from other countries (especially Nordic countries) and more recently other developing countries has further diluted capital ownership. However, foreign capital remains a significant factor in the Zimbabwean economy. The above account reveals that at the very early stages of the modern sector in Zimbabwe, the BSA Company owned almost 100% of all capital investments. During the early 1980s a figure of 50% foreign ownership was quoted (Riddell, 1988). Thus, over the years the proportion of foreign capital in total investment significantly declined. The 1990s, however, have seen a reverse of the downward trend (Arrighi, 1967; Stoneman, 1976; Riddell, 1990; UNCTAD, 2000). Recent data indicate that the US share of inward FDI in gross fixed capital formation increased from 5 percent in 1994 to 44 percent in 1998 (UNCTAD, 2002). The decline of FDI as a proportion of total fixed investment has once again set in since 1999 and joint venture projects are increasing in numbers. It has been noted that the number of joint venture projects have been increasing as a percentage of total approved projects. However, it must be pointed out that the value of joint ventures in 2002 were only about 30% of total approved projects. When this point and what has already been said in Section 6 above are considered together, it can be argued that joint venture capital remains a less preferred form of business by foreign investors. In addition, manufacturing investment remains the largest in terms of total value and commercial projects now receive the largest proportion of foreign currency injections of 44% compared to 37% for the latter. Table 4 gives the full details of all approved projects for the year 2002. We also note that in 1994 the top ten largest foreign investors in Zimbabwe were Australia, USA, UK, Holland, Germany, South Africa, Switzerland, China, Lichenstein and Channel Islands respectively.
15
Table 4: Business Form and Sectoral Distribution of Foreign Capital in Approved Projects, 2002
Description No. of Total % of Jobs % of Forex % of of Projects Projects Investment Total ‘000 Total Injection Total (Z$mn) (Z$mn) Foreign 15 2521.21 70.5 2630 76.9 1042.854 84.4 Joint 70 1076.48 29.5 789 23.1 192.62 15.6 Total 85 3597.69 100 3419 100 1235.48 100
Sector Commercial 29 1457.76 39.9 1176 34.4 551.6 44.6 Manufacturing 46 1615.81 48.5 1601 46.8 459.78 37.2 Mining 4 328.59 5.8 459 13.4 97.21 7.9 Tourism 6 195.53 5.7 183 5.4 126.9 10.3 Total 85 3597.69 100 3419 100 1235.48 100 Source: ZIC Website http://www.zic.co.zw/zicapprovals.htm. In 2002, however, the top three largest investors were developing countries (China, Pakistan, and Tanzania). Out of the ten largest investors, only four were developed countries and this is exactly the opposite of the situation in 1994. We have so far only considered long-term foreign capital investments. However, during the reform period and especially when controls on capital movements were relaxed in 1994, a huge influx of ‘hot’ money was experienced. In 1994 alone, about US$50 million was injected on the Zimbabwe Stock Exchange (ZSE) causing a bull run during the subsequent three years resulting in the country being regarded as one of the best performing emerging markets. The sensitivity of this type of foreign capital to perceived negative market developments and its potentially destabilizing effects has been subject of intense debate. Doubts have been raised on the appropriateness of capital account liberalisation in developing countries. This issue has not been exhausted yet. In the Zimbabwean case, the financial meltdown that followed the 1997 Asian stock market crash caused a significant withdrawal from the local market by foreign investors. The latest information available indicates that the withdrawal by foreign investors from the local bourse has continued and during the first half of 2002 recorded a deficit of Z$3.6 billion. Despite this withdrawal, the ZSE has continued to enjoy phenomenal growth, recording turnover of Z$120 billion when compared to Z$49.3 billion in the previous year. 6.2. The Need for Complementary Policies There is a general theoretical consensus that foreign capital inflows lead to improved capacity, competition, products quality and international competitiveness as well as export diversification. Empirical studies on the other hand have established that the impact of increased foreign capital on an economy largely depends on the economic environment of the host country. The capacity of an economy to benefit out of foreign capital inflows, therefore, is a product of the economic policies in ensuring that efficient production and investment decisions are made. Given an open economy, the micro and macroeconomic effects of foreign capital need to be considered in a holistic manner. This brings to the fore the importance of the interaction between trade and

16
industrial policies and their effects on the factor input and product markets in light of the reactions of economic agents to macroeconomic policies. For example countries that are richly endowed with natural resources may attract huge foreign capital inflows of an extractive nature yet such inflows do not address the need to deal with the instability of export earnings or industrialisation efforts. Similarly, tariff-jumping investments tend to entrench monopolistic production and have limited effects on the need for improved competition and product quality hence they contribute minimally to export production. At the macro scale, increased foreign capital inflows tend to cause an appreciation of the domestic currency against other foreign currencies. This will, in turn, affect the competitiveness of exports. To maintain export competitiveness export prices would have to be adjusted thereby worsening the terms of trade of the country. At the policy level, our recommendations take into account the role of policy complementarities. This is to be considered within the context of the export-led growth strategy that the Zimbabwe government adopted at the beginning of the 1990s. In this paper, we consider four policy initiatives that include devaluation of the domestic currency and trade liberalisation, in general, investment targeting and the promotion of foreign capital inflows. Trade liberalisation has fiscal and distribution effects. Unless other sources of revenue expand or the import volume effect outweighs the import price effect, a tariff reduction leaves a hole on the budget balance as revenue from imports is reduced. Liberalisation also allows private sector expenditure to increase. Hence domestic private savings fall. Government is, therefore, forced to rely on foreign transfers to balance its budget. However, the undesirable money supply and balance of payments consequences are neutralised by the changes in the exchange rate (Collier and Gunning, 1992). On the other hand, the change in relative prices between domestic and imported output results in a reallocation of resources. Consequently, those households that own factors whose demand rises/falls thereby increasing/decreasing their return would experience a boost/contraction in income. Earlier studies on trade liberalisation in Zimbabwe exist (Chitiga, 1996; Bautista et al, 1998; Rattso and Torvik, 1998). The first two studies focused on income distribution under different exchange rate systems. Chitiga found that trade liberalisation alone is contractionary and worsens the budget deficit. When combined with a devaluation of the local currency, trade liberalisation was found to be expansionary. The growth in the economy is export induced. On the other hand, results from Bautista et al (1998) found that while the economy grows, the budget deficit worsens. Both exports and imports increase with the latter increasing by a lower magnitude than the former. The likely short-run decrease in domestic savings arising from trade liberalisation, however, did not lead to a decrease in investment. Foreign capital inflows plugged the gap. In particular, the increase in foreign capital channelled into the enterprise sector led to an increase in the capacity of the economy. Finally, investment targeting interferes with the normal functioning of the market in allocating investment resources. In the Zimbabwean case, the manufacturing sector was treated as the target sector. This was meant to bring about some diversification of the export base and thus dealing with the problem of export earnings instability. A more than proportional

17
increase in the demand of factors of production in the manufacturing sector was bound to lead to an increase in the price of such factors employed in manufacturing. In particular, the fixed factor prices would rise thereby increasing the fixed costs of production. On the basis of the law of supply and demand, capital would tend to move away from primary activities thereby causing a contraction of the traditional export activities. Falling returns in manufacturing coupled with declining primary activities would generate contractionary forces in the economy. The de-industrialization that Zimbabwe experienced during the ESAP period could have been avoided by letting government implement policies that reduced the initial costs of investment like improved infrastructure or instituting an outright industrial support scheme. This, however, was not possible in light of the emphasis on blanket reductions in government expenditure. The smaller average rate of economic growth during the ESAP period compared to the pre-ESAP period despite the resurgence in foreign capital inflows provides sufficient evidence that increased inflows of foreign capital alone are not sufficient to generate growth. The overall economic policy environment has to be considered.

18
7. Conclusions This paper provided an analysis of the relationship between foreign capital inflows and growth in the SADC region in general and specifically within the context of Zimbabwe. Greater efforts at economic liberalisation and the moves toward regional integration during the past decade generated significant increases in FDI inflows into the region. However, different countries in the region have had different experiences with FDI. The role of FDI in promoting economic growth has long been an issue of extensive theoretical and empirical debate. In this paper, we have just observed that the nature of the relationship between FDI and economic growth can be different across countries. An attempt has been made in explaining what factors are responsible for the differential effects of FDI inflows on economic growth. The important point that we make is that the extent to which the economic environment promotes efficient economic decisions in the allocation of economic resources determines the nature Sof the benefits of FDI inflows. In that process, the importance of the role of complementary economic policies in ensuring that FDI contributes positively to economic growth has also been discussed. A clear message that comes out of this analysis is that the promotion of FDI inflows must not be viewed in isolation. Rather governments must endeavour to create conducive policy environments that promote productive economic activities otherwise the assumed positive relationship between FDI and growth will remain a myth.
19
References Arrighi, G. (1967) The Political Economy of Rhodesia Mouton, The Hague. Arrighi, G. (1970) ‘International Corporations, Labour Aristocracies and Economic Development in
Tropical Africa’, Rhodes, R.I (ed) Imperialism and Underdevelopment, Monthly Review Press, New York.
Barber, W.J. (1961) The Economy of British Central Africa Oxford University Press, UK. Bautista, R..M., Lofgren, H. and Marcelle, T. (1998) 'Does trade liberalisation enhance income growth
and equity in Zimbabwe? The role of complementary policies', Conference paper, Zimbabwe: Macroeconomic Policy, Management and Performance since Independence (1980 - 1998); Lessons for the 21st Century, Harare.
Bhinda, N., Griffith-Jones, S., Leape, J. and Martin, M. (1999) Private capital flows to Africa: Perception
and reality FONDAD, The Hague, Netherlands. Borensztein, E., De Gregorio, J. and Lee, J-W. (1998) 'How does foreign direct investment affect
economic growth? Journal of International Economics, 45, 115-135. Chitiga, M. (1996) Computable general equilibrium analysis of income distribution policies in Zimbabwe,
unpublished PhD Thesis, Goteborg University, Sweden. Clarke, D.G. (1980) Foreign Companies International Investments in Zimbabwe, Mambo Press,
Rhodesia. Collier, P. and Gunning, J.W. (1992) ‘Aid and exchange rate adjustments in African trade
liberalisations’, The Economic Journal 102, 925 - 939. Dasgupta, P. and Stiglitz, J.E. (1988) 'Learning-by-doing, market structure and industrial and trade
policies,' Oxford Economic Papers 40, 246 - 268. Driffield, N. (2001) 'The impact on domestic productivity of inward investment in the UK,' The
Manchester School 69, 103 - 119. Frankel, S.H. (1938) Capital Investments in Africa Oxford University Press, UK. Glass, A.J. and Saggi, K. (1999) 'FDI policies under shared markets', Journal of International Economics,
49, 309-332. GOZ (1981) Growth with equity, Harare, Zimbabwe. GOZ (1991) Policy reform document, Harare, Zimbabwe. Hazelwood, A. (1967) ‘The Economies of Federation and Dissolution in Central Africa’, Hazelwood, A.
(ed) African Integration and Disintegration Oxford University Press, UK. Jenkins, C.,J. Leape and L. Thomas (2000) Gaining from trade in Southern Africa: Complementary
policies to underpin the SADC Free Trade Area Macmillan Pree Ltd, UK.

20
Johansen, L. (1960) A multisectoral study of economic growth, North-Holland, Amsterdam. Krugman, P. (1999) 'Analytical afterthought of the Asian crisis,'
http://web.mit.edu/krugman/www/MINICRISIS.htm Mafusire, A. (2001) ‘Foreign capital inflows and the export-led growth strategy in Zimbabwe’,
unpublished PhD Thesis, University of Queensland, Australia. Markusen, J.R. (1983) 'Factor movements and commodity trade as complements', Journal of International
Economics, 14, 34 -356. Mundell, R. (1957) 'International trade and factor mobility', American Economic Review,
47, 321-335. Pakenham, T. (1991) The Scramble for Africa, George Weidenfeld & Nicolson, London. Pfaffermayr, M. (1994) 'Foreign direct investment and exports: a time series approach', Applied
Economics, 26, 337-351. Pfefferman, G. ’Sizing up FDI,’ www.theglobalist.com/DBWeb/StoryId.aspx?StoryId=2800 - 101k Rattso, J. and Torvik, R. (1998) ‘Zimbabwean trade liberalization: ex post evaluation’, Cambridge
Journal of Economics 22 325 – 346. SRiddell, R. (1990) 'ACP Export Diversification: The Case of Zirnbabwe', Overseas Development
Institute, WP #38, London. Romer, P.M. (1990) 'Endogenous technological change', Journal of Political Economy, 98, S71-S103. Stoneman, C. (1976) 'Foreign capital and prospects for Zimbabwe', World Development, 4, 25-58. UNCTAD (1999) World Investment Report, The United Nations. UNCTAD (2002) World Investment Report, The United Nations. UNCTAD (2000) Capital flows and growth in Africa The United Nations, New York. Williamson, O. (1999) ‘Firms, markets and hierarchies: Some reflections,’ Carroll, G. and Teece, D.J.
(eds), Firms, markets and hierarchies: The transactions cost economics perspective, Oxford University Press, New York and Oxford 32 – 36.
ZIC (2000) ‘Zimbabwe in Figures’, http://www.zic.co.zw/zwfigures.htm. ZIC (2001) ‘Zimbabwe Investment Centre Project Approvals Jan – Dec 2000’,
http:www.zic.co.zw/zicapprovals.htm. ZIC (2003) ‘Zimbabwe Investment Centre Project Approvals Jan – Dec 2002’,
http:www.zic.co.zw/zicapprovals.htm.
21
APPENDIX A: TARGETING FDI INFLOWS AND DERIVED POLICY Sector
FDI Inflows Considerable Little
Whether target or non-target
sector
Investor assessment / Policy position
Agriculture
Y
N
N
Positive / no promotion required to increase inflows
Fishing and aquaculture
N
Y
N
Positive / No promotion required to increase inflows
Forestry
Y
N
Y
Positive / Level of promotion to be determined by export target
Mining and quarrying
Y
N
Y
Positive / Level of promotion to be determined by export target
Food and beverages
Y
N
Y
Positive / Level of promotion to be determined by export target
Petroleum, gas and related goods
N
N
N
Negative / no incentives required
Tobacco
N
Y
N
Positive / No promotion required to increase inflows
Textiles, leather and clothing
Y
N
Y
Positive / Level of promotion to be determined by export target
Pharmaceuticals and chemical products
Y
N
N
Positive / No promotion required to increase inflows
Metals and metal products
Y
N
Y
Positive / Level of promotion to be determined by export target
Mechanical and electrical equipment
N
Y
N
Positive / No promotion required to increase inflows
Motor vehicles N
Y
N
Positive / No promotion required to increase inflows
Non-metallic mineral products
N
N
N
Negative / no promotion required

22
APPENDIX 3.1: continued Sector
FDI Inflows Considerable Little
Whether target or non-target
sector
Investor assessments /
Policy position Telecomm-unications
Y
N
Y
Positive / Level of promotion to be determined by export target
Finance and insurance
N
Y
Y
Positive / Level of promotion to be determined by export target
Transport and storage
N
Y
N
Positive / Level of promotion to be determined by export target
Tourism
N
Y
N
Positive / No promotion required to increase inflows
Other N N N
n/a
NB. Y - yes, N – no Source: Mafusire (2001)