
23.5 Sub-60 mV/dec Ferroelectric HZO MoS2 Negative ...yep/Papers/IEDM_2017_2D NCFET... · Sub-60...
4
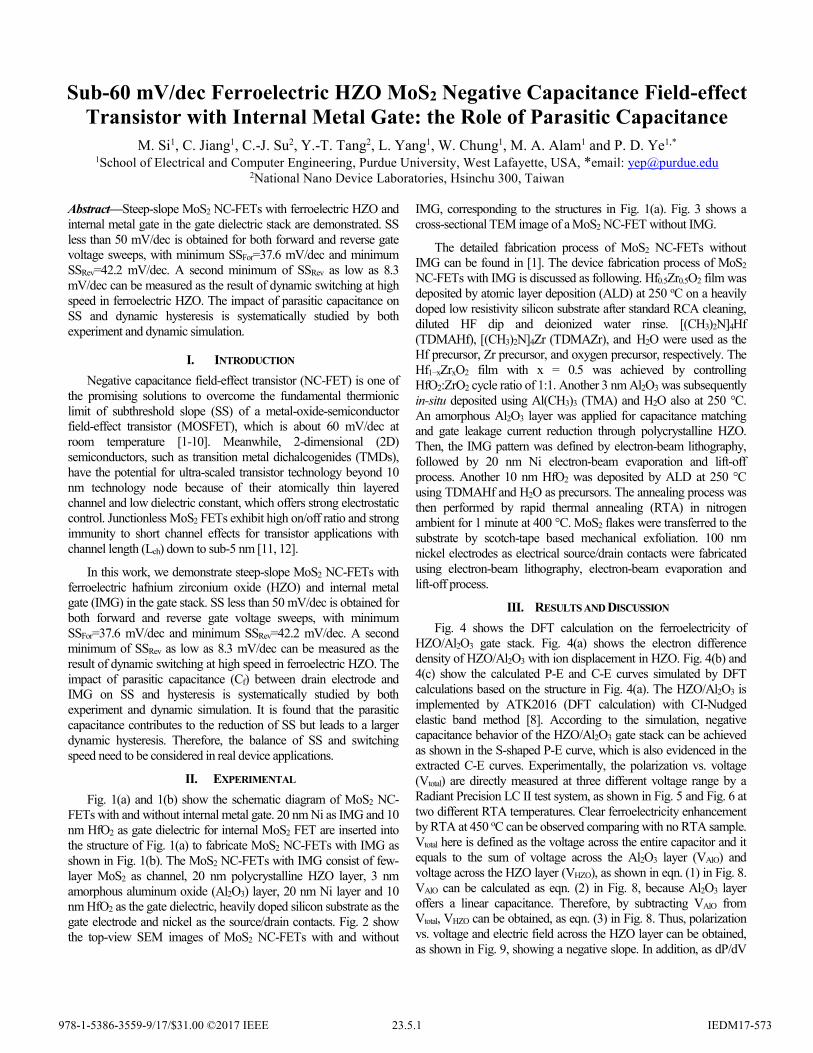
Sub-60 mV/dec Ferroelectric HZO MoS2 Negative Capacitance Field-effect Transistor with Internal Metal Gate: the Role of Parasitic Capacitance M. Si 1 , C. Jiang 1 , C.-J. Su 2 , Y.-T. Tang 2 , L. Yang 1 , W. Chung 1 , M. A. Alam 1 and P. D. Ye 1,* 1 School of Electrical and Computer Engineering, Purdue University, West Lafayette, USA, *email: [email protected] 2 National Nano Device Laboratories, Hsinchu 300, Taiwan Abstract —Steep-slope MoS2 NC-FETs with ferroelectric HZO and internal metal gate in the gate dielectric stack are demonstrated. SS less than 50 mV/dec is obtained for both forward and reverse gate voltage sweeps, with minimum SSFor =37.6 mV/dec and minimum SSRev=42.2 mV/dec. A second minimum of SSRev as low as 8.3 mV/dec can be measured as the result of dynamic switching at high speed in ferroelectric HZO. The impact of parasitic capacitance on SS and dynamic hysteresis is systematically studied by both experiment and dynamic simulation. I. I NTRODUCTION Negative capacitance field-effect transistor (NC-FET) is one of the promising solutions to overcome the fundamental thermionic limit of subthreshold slope (SS) of a metal-oxide-semiconductor field-effect transistor (MOSFET), which is about 60 mV/dec at room temperature [1-10]. Meanwhile, 2-dimensional (2D) semiconductors, such as transition metal dichalcogenides (TMDs), have the potential for ultra-scaled transistor technology beyond 10 nm technology node because of their atomically thin layered channel and low dielectric constant, which offers strong electrostatic control. Junctionless MoS2 FETs exhibit high on/off ratio and strong immunity to short channel effects for transistor applications with channel length (Lch) down to sub-5 nm [11, 12]. In this work, we demonstrate steep-slope MoS2 NC-FETs with ferroelectric hafnium zirconium oxide (HZO) and internal metal gate (IMG) in the gate stack. SS less than 50 mV/dec is obtained for both forward and reverse gate voltage sweeps, with minimum SSFor=37.6 mV/dec and minimum SSRev=42.2 mV/dec. A second minimum of SSRev as low as 8.3 mV/dec can be measured as the result of dynamic switching at high speed in ferroelectric HZO. The impact of parasitic capacitance (Cf ) between drain electrode and IMG on SS and hysteresis is systematically studied by both experiment and dynamic simulation. It is found that the parasitic capacitance contributes to the reduction of SS but leads to a larger dynamic hysteresis. Therefore, the balance of SS and switching speed need to be considered in real device applications. II. EXPERIMENTAL Fig. 1(a) and 1(b) show the schematic diagram of MoS2 NC- FETs with and without internal metal gate. 20 nm Ni as IMG and 10 nm HfO2 as gate dielectric for internal MoS2 FET are inserted into the structure of Fig. 1(a) to fabricate MoS2 NC-FETs with IMG as shown in Fig. 1(b). The MoS2 NC-FETs with IMG consist of few- layer MoS2 as channel, 20 nm polycrystalline HZO layer, 3 nm amorphous aluminum oxide (Al 2O3) layer, 20 nm Ni layer and 10 nm HfO2 as the gate dielectric, heavily doped silicon substrate as the gate electrode and nickel as the source/drain contacts. Fig. 2 show the top-view SEM images of MoS2 NC-FETs with and without IMG, corresponding to the structures in Fig. 1(a). Fig. 3 shows a cross-sectional TEM image of a MoS2 NC-FET without IMG. The detailed fabrication process of MoS2 NC-FETs without IMG can be found in [1]. The device fabrication process of MoS2 NC-FETs with IMG is discussed as following. Hf 0.5Zr0.5O2 film was deposited by atomic layer deposition (ALD) at 250 o C on a heavily doped low resistivity silicon substrate after standard RCA cleaning, diluted HF dip and deionized water rinse. [(CH3)2N]4Hf (TDMAHf), [(CH3)2N]4Zr (TDMAZr), and H2O were used as the Hf precursor, Zr precursor, and oxygen precursor, respectively. The Hf 1−xZrxO2 film with x = 0.5 was achieved by controlling HfO2:ZrO2 cycle ratio of 1:1. Another 3 nm Al 2O3 was subsequently in-situ deposited using Al(CH3)3 (TMA) and H2O also at 250 °C. An amorphous Al 2O3 layer was applied for capacitance matching and gate leakage current reduction through polycrystalline HZO. Then, the IMG pattern was defined by electron-beam lithography, followed by 20 nm Ni electron-beam evaporation and lift-off process. Another 10 nm HfO2 was deposited by ALD at 250 °C using TDMAHf and H2O as precursors. The annealing process was then performed by rapid thermal annealing (RTA) in nitrogen ambient for 1 minute at 400 °C. MoS2 flakes were transferred to the substrate by scotch-tape based mechanical exfoliation. 100 nm nickel electrodes as electrical source/drain contacts were fabricated using electron-beam lithography, electron-beam evaporation and lift-off process. III. RESULTS AND DISCUSSION Fig. 4 shows the DFT calculation on the ferroelectricity of HZO/Al 2O3 gate stack. Fig. 4(a) shows the electron difference density of HZO/Al 2O3 with ion displacement in HZO. Fig. 4(b) and 4(c) show the calculated P-E and C-E curves simulated by DFT calculations based on the structure in Fig. 4(a). The HZO/Al 2O3 is implemented by ATK2016 (DFT calculation) with CI-Nudged elastic band method [8]. According to the simulation, negative capacitance behavior of the HZO/Al 2O3 gate stack can be achieved as shown in the S-shaped P-E curve, which is also evidenced in the extracted C-E curves. Experimentally, the polarization vs. voltage (Vtotal ) are directly measured at three different voltage range by a Radiant Precision LC II test system, as shown in Fig. 5 and Fig. 6 at two different RTA temperatures. Clear ferroelectricity enhancement by RTA at 450 o C can be observed comparing with no RTA sample. Vtotal here is defined as the voltage across the entire capacitor and it equals to the sum of voltage across the Al 2O3 layer (VAlO) and voltage across the HZO layer (VHZO), as shown in eqn. (1) in Fig. 8. VAlO can be calculated as eqn. (2) in Fig. 8, because Al 2O3 layer offers a linear capacitance. Therefore, by subtracting VAlO from Vtotal , VHZO can be obtained, as eqn. (3) in Fig. 8. Thus, polarization vs. voltage and electric field across the HZO layer can be obtained, as shown in Fig. 9, showing a negative slope. In addition, as dP/dV 978-1-5386-3559-9/17/$31.00 ©2017 IEEE 23.5.1 IEDM17-573
Transcript of 23.5 Sub-60 mV/dec Ferroelectric HZO MoS2 Negative ...yep/Papers/IEDM_2017_2D NCFET... · Sub-60...
Sub-60 mV/dec Ferroelectric HZO MoS2 Negative Capacitance Field-effect
Transistor with Internal Metal Gate: the Role of Parasitic Capacitance
M. Si1, C. Jiang1, C.-J. Su2, Y.-T. Tang2, L. Yang1, W. Chung1, M. A. Alam1 and P. D. Ye1,* 1School of Electrical and Computer Engineering, Purdue University, West Lafayette, USA, *email: [email protected]
2National Nano Device Laboratories, Hsinchu 300, Taiwan
Abstract—Steep-slope MoS2 NC-FETs with ferroelectric HZO and
internal metal gate in the gate dielectric stack are demonstrated. SS
less than 50 mV/dec is obtained for both forward and reverse gate
voltage sweeps, with minimum SSFor=37.6 mV/dec and minimum
SSRev=42.2 mV/dec. A second minimum of SSRev as low as 8.3
mV/dec can be measured as the result of dynamic switching at high
speed in ferroelectric HZO. The impact of parasitic capacitance on
SS and dynamic hysteresis is systematically studied by both
experiment and dynamic simulation.
I. INTRODUCTION
Negative capacitance field-effect transistor (NC-FET) is one of
the promising solutions to overcome the fundamental thermionic
limit of subthreshold slope (SS) of a metal-oxide-semiconductor
field-effect transistor (MOSFET), which is about 60 mV/dec at
room temperature [1-10]. Meanwhile, 2-dimensional (2D)
semiconductors, such as transition metal dichalcogenides (TMDs),
have the potential for ultra-scaled transistor technology beyond 10
nm technology node because of their atomically thin layered
channel and low dielectric constant, which offers strong electrostatic
control. Junctionless MoS2 FETs exhibit high on/off ratio and strong
immunity to short channel effects for transistor applications with
channel length (Lch) down to sub-5 nm [11, 12].
In this work, we demonstrate steep-slope MoS2 NC-FETs with
ferroelectric hafnium zirconium oxide (HZO) and internal metal
gate (IMG) in the gate stack. SS less than 50 mV/dec is obtained for
both forward and reverse gate voltage sweeps, with minimum
SSFor=37.6 mV/dec and minimum SSRev=42.2 mV/dec. A second
minimum of SSRev as low as 8.3 mV/dec can be measured as the
result of dynamic switching at high speed in ferroelectric HZO. The
impact of parasitic capacitance (Cf) between drain electrode and
IMG on SS and hysteresis is systematically studied by both
experiment and dynamic simulation. It is found that the parasitic
capacitance contributes to the reduction of SS but leads to a larger
dynamic hysteresis. Therefore, the balance of SS and switching
speed need to be considered in real device applications.
II. EXPERIMENTAL
Fig. 1(a) and 1(b) show the schematic diagram of MoS2 NC-
FETs with and without internal metal gate. 20 nm Ni as IMG and 10
nm HfO2 as gate dielectric for internal MoS2 FET are inserted into
the structure of Fig. 1(a) to fabricate MoS2 NC-FETs with IMG as
shown in Fig. 1(b). The MoS2 NC-FETs with IMG consist of few-
layer MoS2 as channel, 20 nm polycrystalline HZO layer, 3 nm
amorphous aluminum oxide (Al2O3) layer, 20 nm Ni layer and 10
nm HfO2 as the gate dielectric, heavily doped silicon substrate as the
gate electrode and nickel as the source/drain contacts. Fig. 2 show
the top-view SEM images of MoS2 NC-FETs with and without
IMG, corresponding to the structures in Fig. 1(a). Fig. 3 shows a
cross-sectional TEM image of a MoS2 NC-FET without IMG.
The detailed fabrication process of MoS2 NC-FETs without
IMG can be found in [1]. The device fabrication process of MoS2
NC-FETs with IMG is discussed as following. Hf0.5Zr0.5O2 film was
deposited by atomic layer deposition (ALD) at 250 oC on a heavily
doped low resistivity silicon substrate after standard RCA cleaning,
diluted HF dip and deionized water rinse. [(CH3)2N]4Hf
(TDMAHf), [(CH3)2N]4Zr (TDMAZr), and H2O were used as the
Hf precursor, Zr precursor, and oxygen precursor, respectively. The
Hf1−xZrxO2 film with x = 0.5 was achieved by controlling
HfO2:ZrO2 cycle ratio of 1:1. Another 3 nm Al2O3 was subsequently
in-situ deposited using Al(CH3)3 (TMA) and H2O also at 250 °C.
An amorphous Al2O3 layer was applied for capacitance matching
and gate leakage current reduction through polycrystalline HZO.
Then, the IMG pattern was defined by electron-beam lithography,
followed by 20 nm Ni electron-beam evaporation and lift-off
process. Another 10 nm HfO2 was deposited by ALD at 250 °C
using TDMAHf and H2O as precursors. The annealing process was
then performed by rapid thermal annealing (RTA) in nitrogen
ambient for 1 minute at 400 °C. MoS2 flakes were transferred to the
substrate by scotch-tape based mechanical exfoliation. 100 nm
nickel electrodes as electrical source/drain contacts were fabricated
using electron-beam lithography, electron-beam evaporation and
lift-off process.
III. RESULTS AND DISCUSSION
Fig. 4 shows the DFT calculation on the ferroelectricity of
HZO/Al2O3 gate stack. Fig. 4(a) shows the electron difference
density of HZO/Al2O3 with ion displacement in HZO. Fig. 4(b) and
4(c) show the calculated P-E and C-E curves simulated by DFT
calculations based on the structure in Fig. 4(a). The HZO/Al2O3 is
implemented by ATK2016 (DFT calculation) with CI-Nudged
elastic band method [8]. According to the simulation, negative
capacitance behavior of the HZO/Al2O3 gate stack can be achieved
as shown in the S-shaped P-E curve, which is also evidenced in the
extracted C-E curves. Experimentally, the polarization vs. voltage
(Vtotal) are directly measured at three different voltage range by a
Radiant Precision LC II test system, as shown in Fig. 5 and Fig. 6 at
two different RTA temperatures. Clear ferroelectricity enhancement
by RTA at 450 oC can be observed comparing with no RTA sample.
Vtotal here is defined as the voltage across the entire capacitor and it
equals to the sum of voltage across the Al2O3 layer (VAlO) and
voltage across the HZO layer (VHZO), as shown in eqn. (1) in Fig. 8.
VAlO can be calculated as eqn. (2) in Fig. 8, because Al2O3 layer
offers a linear capacitance. Therefore, by subtracting VAlO from
Vtotal, VHZO can be obtained, as eqn. (3) in Fig. 8. Thus, polarization
vs. voltage and electric field across the HZO layer can be obtained,
as shown in Fig. 9, showing a negative slope. In addition, as dP/dV
978-1-5386-3559-9/17/$31.00 ©2017 IEEE 23.5.1 IEDM17-573

can be seen as the dynamic capacitance during the measurement, the
maximum dP/dV reflects the maximum capacitance during the
measurement. The maximum capacitances (dP/dV) measured are
2.69 μF/cm2, 4.28 μF/cm2 and 5.95 μF/cm2, corresponding to 6 V, 8
V and 10 V voltage measurement ranges, as shown in Fig. 7. The
equivalent oxide thicknesses (EOT) are calculated to be 1.3 nm, 0.8
nm and 0.6 nm. As the EOT of 3 nm Al2O3 layer is about 1.3 nm,
suggesting the capacitance of HZO layer is negative to obtain EOT
less than 1.3 nm [13]. The physical origin of the negative slope
obtained in Fig. 9 and its impact by the measured low leakage
current and interface traps are still under investigation.
Fig. 10 shows the ID-VGS characteristics of a MoS2 NC-FET
with IMG and with 0.5 μm channel length (Lch) and 8 nm channel
thickness (Tch). Fig. 11 shows the ID-VGS characteristics of the
internal MoS2 FET of the same device as in Fig. 10. Fig. 12 shows a
representative MoS2 NC-FET without IMG (Gate stack annealed at
same 400 oC). Fig. 13 shows SS vs. ID in the off-state of the same
devices as in Fig. 10 and Fig.11, to compare MoS2 NC-FET with
IMG and the internal MoS2 FET with 10 nm HfO2 only as gate
dielectric. A plateau and a minimum characterize the sub-60
mV/dec SS (vs ID) during reverse sweep for MoS2 NC-FETs. These
features (SSRev,min#1 and SS Rev,min#2) are observed among almost all
fabricated devices. The second local minimum of SS is the result of
the switching between two polarization states of the ferroelectric
oxide, associated with loss of capacitance matching at high speed.
All the device ID-VGS characterization are kept at the same
measurement speed (at about 0.05 V/s). The MoS2 NC-FET with
IMG exhibits SSFor=37.6 mV/dec, SSRev,min#1=42.2 mV/dec, and
SSRev,min#2=8.3 mV/dec but with a negative 0.33 V hysteresis at ID=1
nA/μm, comparing to a negative 0.1 V hysteresis in MoS2 NC-FET
without IMG. This suggests the enhanced Cf lead to a larger
hysteresis and smaller SS [1]. The SS of the MoS2 NC-FET with
IMG is much smaller than the SS measured from the internal MoS2
FET, indicating the exist of internal amplification of the 20 nm
HZO/3 nm Al2O3 stack. Fig. 14 shows the gate leakage current
measured from the gate stack of Fig. 1(b). The calculated the gate
leakage current is less than 100 fA/μm within ±2 V so that the gate
leakage current is negligible to device I-V characteristics. Fig. 15
shows the comparison of ID-VGS characteristics measured at
VDS=0.1 V between the MoS2 NC-FET with IMG and the internal
MoS2 FET. The improved drain current suggesting the reduction of
contact resistance by the internal amplification of negative
capacitance gate stack. Fig. 16 and Fig. 17 show the internal
amplification measured from MoS2 NC-FET (VG) and the internal
MoS2 FET (Vint), where the internal amplification is defined as
dVint/dVG. Internal amplification greater than 2 is achieved for both
forward and reverse gate voltage sweeps.
To further understand the impact of parasitic capacitance (Cf) on
the SS and hysteresis of MoS2 NC-FETs, both steady-state and
dynamic simulation are performed. The hysteresis of MoS2 NC-
FETs origins from two reasons. One reason is total gate capacitance
(Cdevice+CFE) is negative and the entire system is unstable. This
reason can’t explain the hysteresis of MoS2 NC-FET in this work
since the hysteresis will disappear if the measurement sweep speed
is very slow [1]. However, the steady-state model is ideal while the
actual measurement process is dynamic because the rise time of the
gate voltage cannot be infinite so that Vmos cannot follow the change
speed of VGS, which leads to the hysteresis as the second origin [14].
The dynamic effect can be modeled by adding a dumping resistor in
series with the ferroelectric capacitor, as shown in Fig. 18. The
simulation methodology is described in detail in [1]. Fig. 19 and Fig.
20 show the dynamic and steady-state simulation of MoS2 NC-FET
with 20 nm HZO and 2 nm Al2O3 gate stack at various parasitic
capacitance. No hysteresis can be observed in the steady-state
simulation of Fig. 19, indicating the hysteresis measured in this work
is a dynamic effect of measurement. As shown in the dynamic
simulation of MoS2 NC-FET in Fig. 18, by increasing the parasitic
capacitance, SS reduces while the hysteresis is increasing. Fig. 21
shows SS versus Cf for both dynamic and steady-state simulation.
SS extracted from both forward and reverse gate voltage sweep
reduces with Cf while SSFor is close to the SS in steady-state
simulation. Therefore, the steep slope of SS measured from reverse
gate voltage sweep most likely comes from the dynamic effect of
the measurement. Fig. 22 and Fig. 23 shows the threshold voltage
(VT) and hysteresis as a function of Cf. Hysteresis is found to
increase with the increase of parasitic capacitance. Thus, high
parasitic capacitance prevents the NC-FETs to work at high speed so
that the optimization of parasitic capacitance to balance between SS
and working speed in NC-FETs is required.
ACKNOWLEDGMENT
The authors would like to thank M. Fan and H. Wang for the
technical support and S. Salahuddin, H. Ota, M. Kobayashi, K. Ng,
and T.P. Ma for valuable discussions.
REFERENCES
[1] M. Si et al., "Steep Slope MoS2 2D Transistors: Negative Capacitance and
Negative Differential Resistance," arXiv1704.06865, 2017.
[2] S. Salahuddin et al., "Use of negative capacitance to provide voltage amplification for low power nanoscale devices,” Nano Lett., vol. 8, pp. 405–410,
2008.
[3] F. McGuire et al., “Sustained Sub-60 mV/decade Switching via the Negative Capacitance Effect in MoS2 Transistors,” Nano Lett., 2017.
[4] J. Muller et al., “Ferroelectricity in Simple Binary ZrO2 and HfO2,” ACS Nano,
vol. 12, pp.4318–4323, 2012. [5] M. H. Lee et al., “Prospects for Ferroelectric HfZrOx FETs with Experimentally
CET=0.98nm, SSfor=42mV/dec, SSrev=28mV/dec, Switch-OFF<0.2V, and
Hysteresis-Free Strategies,” in IEDM Tech. Dig., pp. 616-619, 2015. [6] J. Zhou et al., “Ferroelectric HfZrOx Ge and GeSn PMOSFETs with Sub-60
mV/decade Subthreshold Swing, Negligible Hysteresis, and Improved IDS,” in
IEDM Tech. Dig., pp. 310-313, 2016. [7] K. S. Li et al., “Sub-60mV-Swing Negative-Capacitance FinFET without
Hysteresis,” in IEDM Tech. Dig., pp. 620-623, 2015.
[8] C.-J. Su et al., “Nano-scaled Ge FinFETs with Low Temperature Ferroelectric HfZrOx on Specific Interfacial Layers Exhibiting 65% S.S. Reduction and
Improved ION” in VLSI Tech. Symp., T12-1, 2017.
[9] M. Si et al., " Black Phosphorus Field-effect Transistor with Record Drain
Current Exceeding 1 A/mm," in 75th Device Research Conference, 2017.
[10] A. Nourbakhsh et al., “Subthreshold swing improvement in MoS2 transistors by
the negative-capacitance effect in a ferroelectric Al-doped-HfO2/HfO2 gate dielectric stack,” Nanoscale, vol. 9, pp. 6122-6127, 2017.
[11] B. Radisavljevic et al., “Single-layer MoS2 transistors,” Nat. Nanotechnol., vol. 6,
pp.147–150, 2011. [12] S. B. Desai et al., “MoS2 transistors with 1-nanometer gate lengths,” Science, vol.
354, pp. 99–102, 2016. [13] D. J. R. Appleby et al., “Experimental Observation of Negative Capacitance in
Ferroelectrics at Room Temperature,” Nano Lett., vol. 14, pp. 3864-3868, 2017.
[14] Y. Li et al., " Effect of ferroelectric damping on dynamic characteristics of negative capacitance ferroelectric MOSFET,” IEEE Trans. on Electron Devices,
vol. 63, pp. 3636–3641, 2016.
23.5.2IEDM17-574

Fig. 5. Hysteresis loop of polarization vs. voltage for 20 nm HZO/3 nm Al2O3 annealed at
450 oC at various voltage sweep ranges.
-10 -5 0 5 10
-20
-10
0
10
20
6 V
8 V
10 V
20 nm HZO/3 nm Al2O
3
450 oC RTA
P (
C/c
m2)
Vtotal
(V)
Fig. 1. Schematic of MoS2 NC-FETs (a) without and (b) with internal metal gate.
20 nm HZO
Heavily Doped Si
2 nm Al2O3
NiNi
20 nm HZO
Heavily Doped Si
3 nm Al2O3
NiNi
20 nm Ni
10 nm HfO2CfCf
(a) (b)
Fig. 2. Top-view SEM image of MoS2
NC-FETs.
3 µm
MoS2
Fig. 4 (a) Electron density difference of the HZO (polarization direction [001]) on α-Al2O3. (b) P-E and (c) C-E
curves of FE-HZO/Al2O3 simulated by DFT calculations. S-shaped P-E indicates negative capacitance behavior
can be achieved in the HZO/Al2O3 gate stack.
(b)
:Zr :Hf :O :Al :H
-0.5 0.50-4 -2 0 2 4
-0.5
0.0
0.5 1
cb
a
Po
lari
za
tion
(C
/m2)
E (MV/cm)
-2 -1 0 1 2
a, c
b
4
3
2
Ca
pa
cita
nce
(a
.u)
E (MV/cm)
1
(a)
(b)
(c)
Fig. 6. Hysteresis loop of polarization vs. voltage
for 20 nm HZO/3 nm Al2O3 without RTA at
various voltage sweep ranges.
-10 -5 0 5 10
-20
-10
0
10
20 20 nm HZO/3 nm Al2O
3
No RTA
P (
C/c
m2)
Vtotal
(V)
6 V
8 V
10 V
Fig. 7. dP/dV of polarization vs. voltage
characteristics in Fig. 5.
-10 -5 0 5 10
-10
0
10
2020 nm HZO/3 nm Al
2O
3
450 oC RTA
dP
/dV
(
F/c
m2)
Vtotal
(V)
6 V
8 V
10 V
Fig. 8. Illustration and calculation of voltage across
the HZO layer during polarization vs. voltage measurement.
3 nm Al2O3
20 nm HZO
Heavily Doped Si
VHZO
VAlO
Ni
P
-PP
-P
(1)
(2)
(3)
Fig. 9. Hysteresis loop of polarization vs. voltage for
20 nm HZO only annealed at 450 oC at various
voltage sweep ranges, calculated based on Fig. 8.
-8 -6 -4 -2 0 2 4 6 8
-4 -3 -2 -1 0 1 2 3 4
-20
-10
0
10
20
6 V
8 V
10 V
EHZO (MV/cm)
P (
C/c
m2)
VHZO (V)
Negative Slope
Fig. 10. ID-VGS characteristics of MoS2 NC-FET with IMG measured at room temperature, same structure
as Fig. 1(b).
-1.5 -1.0 -0.5 0.0 0.5 1.0 1.510
-14
10-13
10-12
10-11
10-10
10-9
10-8
10-7
10-6
10-5
SSFor
= 37.6 mV/dec
SSRev,min#1
= 42.2 mV/dec
SSRev,min#2
= 8.3 mV/dec
Lch
=0.5 m
Tch
=8 nm
I D (
A/
m)
VGS
(V)
VDS
=0.1 V
VDS
=0.5 V
NC w/ IMG
Fig. 11. ID-VGS characteristics of internal MoS2 FET of the same device as Fig. 10 but has 10 nm HfO2 as
gate dielectric.
-1.5 -1.0 -0.5 0.0 0.5 1.0 1.510
-14
10-13
10-12
10-11
10-10
10-9
10-8
10-7
10-6
10-5
SS=75.3 mV/dec
I D (
A/
m)
VGS
(V)
VDS
=0.1 V
VDS
=0.5 V
Internal FET
10 nm HfO2
Fig. 3. TEM cross-
sectional image of a MoS2 NC-FET as in Fig.
1(a).
HZO
Si
Al2O3
MoS2
5 nm
23.5.3 IEDM17-575

Fig. 12. ID-VGS characteristics of MoS2 NC-FET
without IMG measured at room temperature, same structure as Fig. 1(a).
-1.5 -1.0 -0.5 0.0 0.5 1.010
-13
10-12
10-11
10-10
10-9
10-8
10-7
10-6
10-5
SSFor
= 59.6 mV/dec
SSRev,min#1
= 41.7 mV/dec
SSRev,min#2
= 5.6 mV/dec
NC w/o IMG
Lch
=1 m
Tch
=5.1 nm
I D (
A/
m)
VGS
(V)
VDS
=0.1 V
VDS
=0.5 V
Fig. 13. SS vs. ID characteristics of MoS2 NC-FET with IMG and internal MoS2 FET of the same
device.
10-12
10-11
10-10
10-9
10-8
020406080
100120140160180200
SS
(m
V/d
ec)
ID (A/m)
Internal FET (10 nm HfO2)
NC w/ IMG Forward
NC w/ IMG Reverse
Fig. 14. Leakage current vs. voltage measured using
the gate stack in Fig. 1(b). The leakage current is negligible in all the I-V characteristics.
-10 -5 0 5 1010
-9
10-7
10-5
10-3
10-1
101
Leakag
e C
urr
en
t (A
/cm
2)
Voltage (V)
20 nm HZO
Heavily Doped Si
3 nm Al2O3
20 nm Ni10 nm HfO2
Ni
Voltage
Fig. 15. ID-VGS characteristics comparison between MoS2 NC-FET with IMG and the internal MoS2 FET
of the same device.
-1.5 -1.0 -0.5 0.0 0.5 1.0 1.510
-15
10-14
10-13
10-12
10-11
10-10
10-9
10-8
10-7
10-6
VDS
=0.1 V
I D (
A/
m)
VGS
(V)
NC w/ IMG
10 nm HfO2
Fig. 16. Vint vs. VG for MoS2 NC-FET with IMG calculated based on internal MoS2 FET as in Fig. 15.
-1.0 -0.9 -0.8 -0.7 -0.6 -0.5 -0.4
-0.9
-0.8
-0.7
-0.6V
int (V
)
VG (V)
Forward
Reverse
Fig. 17. Internal amplification calculated based on
dVint/dVG in Fig. 16.
-1.0 -0.9 -0.8 -0.7 -0.6 -0.5 -0.40.1
1
10
Inte
rna
l A
mp
lifi
ca
tio
n (
dV
int/d
VG)
VG (V)
Forward
Reverse
Fig. 18. Simplified small-signal capacitance representation of a MoS2 NC-FET for steady-state
and dynamic simulation.
Vmos
Gate
CFE
Cox
C2D
DrainSource
CfCf
Intrinsic
MoS2 FET
ϕsurface
RFE
Cdevice
Fig. 19. Dynamic simulation of ID-VGS
characteristics of MoS2 NC-FET with various
parasitic capacitance.
-1.5 -1.0 -0.5 0.0 0.5 1.010
-16
10-14
10-12
10-10
10-8
10-6
10-4
Dynamic
20 nm HZO/2 nm Al2O
3
VDS
=0.1 V
I D (
A/
m)
VGS
(V)
Cf=0 fF/m
Cf=4.25 fF/m
Cf=8.5 fF/m
Cf=12.75 fF/m
Fig. 20. Steady-state simulation of ID-VGS characteristics of MoS2 NC-FET with various parasitic capacitance.
-1.5 -1.0 -0.5 0.0 0.5 1.010
-18
10-16
10-14
10-12
10-10
10-8
10-6
10-4
Static
VDS
=0.1 V
20 nm HZO/2 nm Al2O
3
I D (
A/
m)
VGS
(V)
Cf=0 fF/m
Cf=4.25 fF/m
Cf=8.5 fF/m
Cf=12.75 fF/m
Fig. 21. The impact of parasitic capacitance on SS in dynamic and steady-state simulation.
0 5 10 15
40
45
50
55
60
SS
(m
V/d
ec)
Cf (fF/m)
Forward
Reverse
Static
Fig. 22. The impact of parasitic capacitance on VT in
dynamic and steady-state simulation.
0 5 10 15-1.2
-1.1
-1.0
-0.9
-0.8
-0.7
VT (
V)
Cf (fF/m)
Forward
Reverse
Static
Fig. 23. The impact of parasitic capacitance on
hysteresis in dynamic simulation.
0 5 10 150.10
0.15
0.20
0.25
Dynamic
Hy
ste
resis
(V
)
Cf (fF/m)
23.5.4IEDM17-576


![FERROELECTRIC RAM [FRAM]](https://static.fdocuments.in/doc/165x107/56816799550346895ddcd567/ferroelectric-ram-fram.jpg)

![Sangeetha [Ferroelectric Memory]](https://static.fdocuments.in/doc/165x107/55cf8f91550346703b9d9665/sangeetha-ferroelectric-memory.jpg)


