230 INFLUENCE OF DIAMETER MEASURING HEIGHT ON THE ...
10
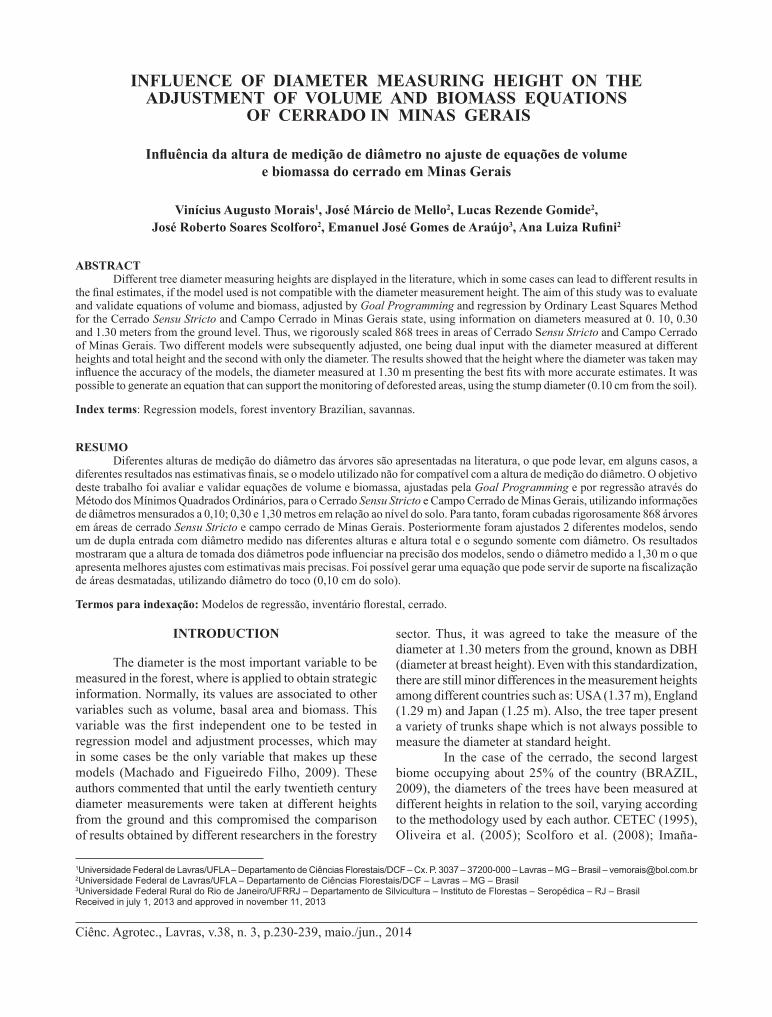
Ciênc. Agrotec., Lavras, v.38, n. 3, p.230-239, maio./jun., 2014 INFLUENCE OF DIAMETER MEASURING HEIGHT ON THE ADJUSTMENT OF VOLUME AND BIOMASS EQUATIONS OF CERRADO IN MINAS GERAIS Influência da altura de medição de diâmetro no ajuste de equações de volume e biomassa do cerrado em Minas Gerais Vinícius Augusto Morais 1 , José Márcio de Mello 2 , Lucas Rezende Gomide 2 , José Roberto Soares Scolforo 2 , Emanuel José Gomes de Araújo 3 , Ana Luiza Rufini 2 ABSTRACT Different tree diameter measuring heights are displayed in the literature, which in some cases can lead to different results in the final estimates, if the model used is not compatible with the diameter measurement height. The aim of this study was to evaluate and validate equations of volume and biomass, adjusted by Goal Programming and regression by Ordinary Least Squares Method for the Cerrado Sensu Stricto and Campo Cerrado in Minas Gerais state, using information on diameters measured at 0. 10, 0.30 and 1.30 meters from the ground level. Thus, we rigorously scaled 868 trees in areas of Cerrado Sensu Stricto and Campo Cerrado of Minas Gerais. Two different models were subsequently adjusted, one being dual input with the diameter measured at different heights and total height and the second with only the diameter. The results showed that the height where the diameter was taken may influence the accuracy of the models, the diameter measured at 1.30 m presenting the best fits with more accurate estimates. It was possible to generate an equation that can support the monitoring of deforested areas, using the stump diameter (0.10 cm from the soil). Index terms: Regression models, forest inventory Brazilian, savannas. RESUMO Diferentes alturas de medição do diâmetro das árvores são apresentadas na literatura, o que pode levar, em alguns casos, a diferentes resultados nas estimativas finais, se o modelo utilizado não for compatível com a altura de medição do diâmetro. O objetivo deste trabalho foi avaliar e validar equações de volume e biomassa, ajustadas pela Goal Programming e por regressão através do Método dos Mínimos Quadrados Ordinários, para o Cerrado Sensu Stricto e Campo Cerrado de Minas Gerais, utilizando informações de diâmetros mensurados a 0,10; 0,30 e 1,30 metros em relação ao nível do solo. Para tanto, foram cubadas rigorosamente 868 árvores em áreas de cerrado Sensu Stricto e campo cerrado de Minas Gerais. Posteriormente foram ajustados 2 diferentes modelos, sendo um de dupla entrada com diâmetro medido nas diferentes alturas e altura total e o segundo somente com diâmetro. Os resultados mostraram que a altura de tomada dos diâmetros pode influenciar na precisão dos modelos, sendo o diâmetro medido a 1,30 m o que apresenta melhores ajustes com estimativas mais precisas. Foi possível gerar uma equação que pode servir de suporte na fiscalização de áreas desmatadas, utilizando diâmetro do toco (0,10 cm do solo). Termos para indexação: Modelos de regressão, inventário florestal, cerrado. 1 Universidade Federal de Lavras/UFLA – Departamento de Ciências Florestais/DCF – Cx. P. 3037 – 37200-000 – Lavras – MG – Brasil – [email protected] 2 Universidade Federal de Lavras/UFLA – Departamento de Ciências Florestais/DCF – Lavras – MG – Brasil 3 Universidade Federal Rural do Rio de Janeiro/UFRRJ – Departamento de Silvicultura – Instituto de Florestas – Seropédica – RJ – Brasil Received in july 1, 2013 and approved in november 11, 2013 INTRODUCTION The diameter is the most important variable to be measured in the forest, where is applied to obtain strategic information. Normally, its values are associated to other variables such as volume, basal area and biomass. This variable was the first independent one to be tested in regression model and adjustment processes, which may in some cases be the only variable that makes up these models (Machado and Figueiredo Filho, 2009). These authors commented that until the early twentieth century diameter measurements were taken at different heights from the ground and this compromised the comparison of results obtained by different researchers in the forestry sector. Thus, it was agreed to take the measure of the diameter at 1.30 meters from the ground, known as DBH (diameter at breast height). Even with this standardization, there are still minor differences in the measurement heights among different countries such as: USA (1.37 m), England (1.29 m) and Japan (1.25 m). Also, the tree taper present a variety of trunks shape which is not always possible to measure the diameter at standard height. In the case of the cerrado, the second largest biome occupying about 25% of the country (BRAZIL, 2009), the diameters of the trees have been measured at different heights in relation to the soil, varying according to the methodology used by each author. CETEC (1995), Oliveira et al. (2005); Scolforo et al. (2008); Imaña-
Transcript of 230 INFLUENCE OF DIAMETER MEASURING HEIGHT ON THE ...
MORAIS, V. A. et al.230
Ciênc. Agrotec., Lavras, v.38, n. 3, p.230-239, maio./jun., 2014
INFLUENCE OF DIAMETER MEASURING HEIGHT ON THE ADJUSTMENT OF VOLUME AND BIOMASS EQUATIONS
OF CERRADO IN MINAS GERAIS
Influência da altura de medição de diâmetro no ajuste de equações de volume e biomassa do cerrado em Minas Gerais
Vinícius Augusto Morais1, José Márcio de Mello2, Lucas Rezende Gomide2, José Roberto Soares Scolforo2, Emanuel José Gomes de Araújo3, Ana Luiza Rufini2
ABSTRACTDifferent tree diameter measuring heights are displayed in the literature, which in some cases can lead to different results in
the final estimates, if the model used is not compatible with the diameter measurement height. The aim of this study was to evaluate and validate equations of volume and biomass, adjusted by Goal Programming and regression by Ordinary Least Squares Method for the Cerrado Sensu Stricto and Campo Cerrado in Minas Gerais state, using information on diameters measured at 0. 10, 0.30 and 1.30 meters from the ground level. Thus, we rigorously scaled 868 trees in areas of Cerrado Sensu Stricto and Campo Cerrado of Minas Gerais. Two different models were subsequently adjusted, one being dual input with the diameter measured at different heights and total height and the second with only the diameter. The results showed that the height where the diameter was taken may influence the accuracy of the models, the diameter measured at 1.30 m presenting the best fits with more accurate estimates. It was possible to generate an equation that can support the monitoring of deforested areas, using the stump diameter (0.10 cm from the soil).
Index terms: Regression models, forest inventory Brazilian, savannas.
RESUMODiferentes alturas de medição do diâmetro das árvores são apresentadas na literatura, o que pode levar, em alguns casos, a
diferentes resultados nas estimativas finais, se o modelo utilizado não for compatível com a altura de medição do diâmetro. O objetivo deste trabalho foi avaliar e validar equações de volume e biomassa, ajustadas pela Goal Programming e por regressão através do Método dos Mínimos Quadrados Ordinários, para o Cerrado Sensu Stricto e Campo Cerrado de Minas Gerais, utilizando informações de diâmetros mensurados a 0,10; 0,30 e 1,30 metros em relação ao nível do solo. Para tanto, foram cubadas rigorosamente 868 árvores em áreas de cerrado Sensu Stricto e campo cerrado de Minas Gerais. Posteriormente foram ajustados 2 diferentes modelos, sendo um de dupla entrada com diâmetro medido nas diferentes alturas e altura total e o segundo somente com diâmetro. Os resultados mostraram que a altura de tomada dos diâmetros pode influenciar na precisão dos modelos, sendo o diâmetro medido a 1,30 m o que apresenta melhores ajustes com estimativas mais precisas. Foi possível gerar uma equação que pode servir de suporte na fiscalização de áreas desmatadas, utilizando diâmetro do toco (0,10 cm do solo).
Termos para indexação: Modelos de regressão, inventário florestal, cerrado.
1Universidade Federal de Lavras/UFLA – Departamento de Ciências Florestais/DCF – Cx. P. 3037 – 37200-000 – Lavras – MG – Brasil – [email protected] Federal de Lavras/UFLA – Departamento de Ciências Florestais/DCF – Lavras – MG – Brasil3Universidade Federal Rural do Rio de Janeiro/UFRRJ – Departamento de Silvicultura – Instituto de Florestas – Seropédica – RJ – BrasilReceived in july 1, 2013 and approved in november 11, 2013
INTRODUCTION
The diameter is the most important variable to be measured in the forest, where is applied to obtain strategic information. Normally, its values are associated to other variables such as volume, basal area and biomass. This variable was the first independent one to be tested in regression model and adjustment processes, which may in some cases be the only variable that makes up these models (Machado and Figueiredo Filho, 2009). These authors commented that until the early twentieth century diameter measurements were taken at different heights from the ground and this compromised the comparison of results obtained by different researchers in the forestry
sector. Thus, it was agreed to take the measure of the diameter at 1.30 meters from the ground, known as DBH (diameter at breast height). Even with this standardization, there are still minor differences in the measurement heights among different countries such as: USA (1.37 m), England (1.29 m) and Japan (1.25 m). Also, the tree taper present a variety of trunks shape which is not always possible to measure the diameter at standard height.
In the case of the cerrado, the second largest biome occupying about 25% of the country (BRAZIL, 2009), the diameters of the trees have been measured at different heights in relation to the soil, varying according to the methodology used by each author. CETEC (1995), Oliveira et al. (2005); Scolforo et al. (2008); Imaña-
Influence of diameter measuring... 231
Ciênc. Agrotec., Lavras, v.38, n. 3, p.230-239, maio./jun., 2014
Encinas et al. (2009); Rufini, et al. (2010); Ribeiro et al. (2011) and Pinheiro and Durigan (2012); worked with the diameter of the tree measured at 1.30 meters from the soil (DBH). However, Abdala et al. (1998); Vale et al. (2002); Vale and Felfili (2005); Medeiros et al. (2008); Vale; Crespilho and Schiavini (2009); Lima et al. (2010); Carvalho (2011); Mews; Marimon and Maracahipes (2011); Paiva et al. (2011) and Ribeiro et al. (2012) worked with the diameter measured at 0.30 meters from the soil (DAS1). Castro and Kauffman (1998) and Siqueira (2006) used both measurement heights in their work.
There is also the possibility of taking the diameter adjusted model at 0.10 m above the ground, also called diameter at stump height (DAS2). In this case, can be used to aid environmental inspection, it enables the recovery of timber volume and biomass existing after logging, measuring only the diameter of the stumps found in the area.
Thus, the widespread use of biometric models that do not show compatibility between the dependent variable and those independent, can generate erroneous estimates. Thus, if the equation use the DBH as input, its effect may reflect the results of the inventory. The scenario presented allows inquiries regarding the predictive ability of models,
when they employ different diameter measuring height standards.
Accordingly, the objectives of the study were to evaluate and validate volume and biomass equations, adjusted for the Cerrado Sensu Stricto and Campo Cerrado of Minas Gerais state, using information on diameters measured at 0.10, 0.30 and 1.30 meters relative to the soil level. In addition, two adjustment methods were compared, Goal Programing (GP) and Ordinary Least Squares (OLS), plus the use of the form factor.
MATERIAL AND METHODS
Study area
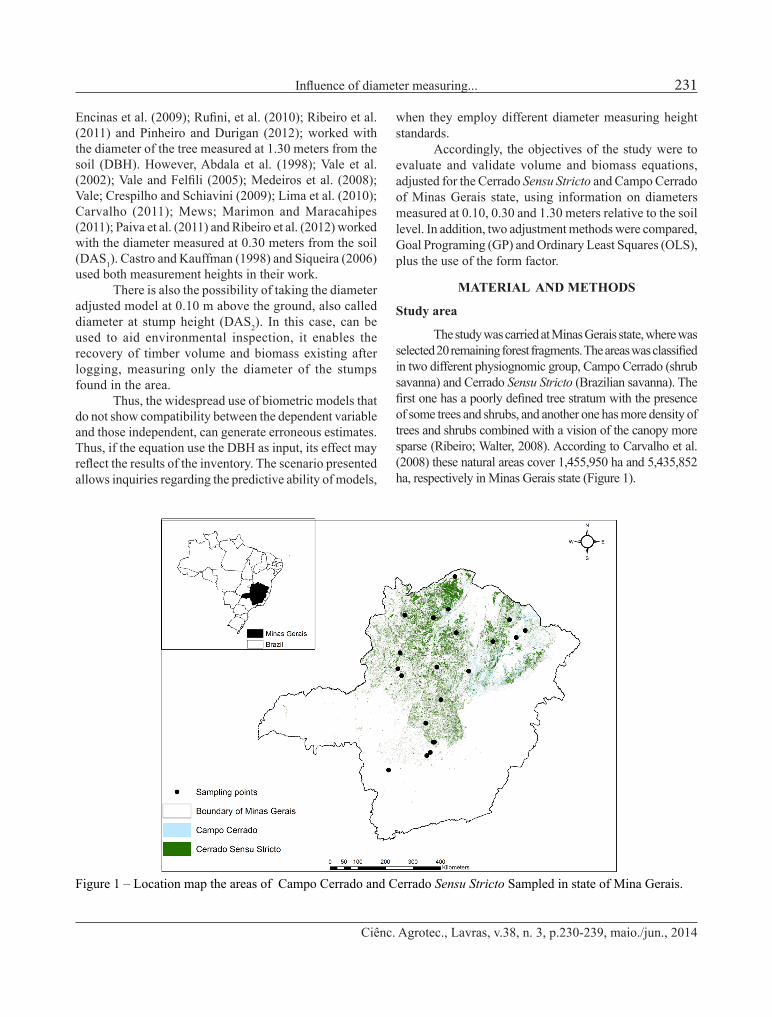
The study was carried at Minas Gerais state, where was selected 20 remaining forest fragments. The areas was classified in two different physiognomic group, Campo Cerrado (shrub savanna) and Cerrado Sensu Stricto (Brazilian savanna). The first one has a poorly defined tree stratum with the presence of some trees and shrubs, and another one has more density of trees and shrubs combined with a vision of the canopy more sparse (Ribeiro; Walter, 2008). According to Carvalho et al. (2008) these natural areas cover 1,455,950 ha and 5,435,852 ha, respectively in Minas Gerais state (Figure 1).
Figure 1 – Location map the areas of Campo Cerrado and Cerrado Sensu Stricto Sampled in state of Mina Gerais.

MORAIS, V. A. et al.232
Ciênc. Agrotec., Lavras, v.38, n. 3, p.230-239, maio./jun., 2014
Data base
The data set used in this study was from the Forest Inventory of Minas Gerais (IFMG) (Scolforo et al., 2008). Altogether were tree scaling 868 plants of 99 species were belonging to 70 genera of 37 families were scaling tree in 20 forest fragments located in different regions of the state.
The individual volume for each tree was obtained by Huber method, with following sections: 0.1-0.3 m, from 0.3-0.7 m; 0.7-1.0 m, 1.0-1.30 m, 1.3-2.0 m the aboveground, and after this last section, meter by meter, until minimum circumference of 9.4cm. In addition, was measured the total height and diameter at 0.1, 0.3 and 1.30 m above ground. The biomass was measure by estimation of the basic density, removing discs from positions corresponding to 0%, 25%, 50% 75% and 100% of the commercial height (Rufini et al., 2010).
Model selected
Based on the work of CETEC (1995), Oliveira et al. (2005), Scolforo et al. (2008), Rufini et al. (2010) and Ribeiro et al. (2011) was decided to adjust the Schumacher-Hall model in its logarithmic form (Equations 1 and 2). Table1 shows the adjustment forms made considering the type of independent variable.
In this step Method of Ordinary Least Squares (OLS) was used for generating the model parameters, which consists of minimizing the sum of squared deviations.
The verification of the fit was performed according to the following criteria: a)significance of the adjusted parameters by the t test with α=0.05significance,b) determination coefficient adjusted (R2aj.) (3), c) standard error of the estimate expressed per unit area, being t/ha for biomass and m³/ha for volume (4) and percentage (% Syx) (5), and d) graphical analysis of residuals.
Ln (Yi) = B0+ B1Ln(X1i) + B2Ln(X2i) ± Ln (Ɛi)
Ln (Yi) = B0+ B1Ln(X1i) ± Ln(Ɛi)
where: Ln = neperian logarithm; Yi = dependent variable, may be total volume with bark [TV wb (m3)] or biomass (DW (t)), X1i = diameter (cm) at different the lights, depending on the adjustment (Table 1), X2i = Ht [total height (m)] and Ɛi = estimation error.
Table1 – Different adjustment forms of the Schumacher and Hall Model.
Model Independent Variable X1 X2
1 DBH (1.30 meters from the soil) Ht2 DAS1 (0.30 meters from the soil) Ht3 DAS2 (0.10 meters from the soil) Ht4 DBH (1.30 meters from the soil) -5 DAS1 (0.30 meters from the soil) -6 DAS2 (0.10 meters from the soil) -
Adjustment of models by regression.
(1)
(2)
Radjusted2 R aj =1- 1-
SQReg
SQTotal*
n-1
n-p-12
Syx S (Y -Y) / n - p - 1yx i
^
i=1
n2= ( )∑
Syx % S % =S / Y*100 yx yx
^
( ) ( )
where: SSR= regression sum of squares; SST = total sum of squares; n = number of observations; p = number of parameters (except β0); = observed value ofi-th dependent variable; = estimated value of the i-th dependent variable; = average of.
We verified the regression model adjustment assumptions regarding the residuals (normality, independence and homoscedasticity of variance) by visual assessment of graphs of the residuals. Furthermore, we applied the Kolmogorov-Smirnov test to validate the normality of residuals. Analyses were performed using the statistical software Rversion 2.13.0 (R DEVELOPMENT CORE TEAM, 2011).
Adjustment of models by Goal Programming
The use of Goal Programming (GP) requires that the decision variables are continuous and unrestricted (-∞ < X < +∞), that is, they can assume both positive and negative values . However, there are no assumptions as those demended in the regression, the decision variablevalues being associated with the coefficients of the linear statistical model.
The mathematical formulation followed the structure of a linear programming model, where (6) represents the objective function scaled to minimize the sum of absolute deviations, (7) model restrictions (1, 2 or 3) for the i-th observation and database (8) are constraints for the model (4, 5, 6) refering to the i-th observation from the database, and (7) and (8) being applied separately.
(5)
(4)
(3)

Influence of diameter measuring... 233
Ciênc. Agrotec., Lavras, v.38, n. 3, p.230-239, maio./jun., 2014
were subdivided into: a) adjustment data used for model adjustment [696 trees] and b) validation data, used to only test predictive ability of generated models (172 trees). The criteria calculated to verify the predictive ability of the models were: sum of squared residuals, mean absolute error (MAE) (10), residual standard deviation (RSD) (11), and MAPE (9), and the closer to zero the value of these statistics, the better the outcome of the prediction (Prodan et al., 1997; Ahmad et al., 2005).
Objective Function: Minimize
Zi
n
= ( )=∑
1
d + di+
i-
Subject to:
β β β γ0 1 21 2+ + − + = ∀+ −A A d di i i i i i,
β β γ0 11+ − + = ∀+ −A d di i i i i,
β β β0 1 2; ; unrestricted
(8)
(7)
(6)
where: = value of the objective function to be minimized the derivation;= upper deviation regarding the i-th target for variable;= lower deviation regarding the i-th target for variable ; = independent variable associated to of the model, being : Ln(DBH) in Models 1 and 4, Ln(DAS1) in Models 2 and 5 and Ln (DAS2) in Models 3 and 6;= independent variable of the Models 1, 2 and 3 (Ln(Ht)); β1, β2, β3 = decision variables of the model, representing the adjustment parameters; = total number of observations (trees) of the database for adjustment of the models.
The models developed by the Goal Programing method were formulated and resolved using the Lpsolve software through the simplex algorithm, as it deals with continuous variables.
Comparison of results
The comparison of the results generated via GP and OLS was through graphics of residuals, sum of squared residuals (SSE) and Mean Absolute Percentage Error - MAPE (9), the latter being proposed by Ahmed et al. (2005).
MAPE=e
y* 100 /ni
ii
n
=∑ ( )
1
where: = residual referring to the i-th observation; = value observed referring to the i-th observation; = number of observations.
Predictive validation
The predictive ability of the models was verified using a simple validation system. For such, the data
MAE = /ni
n
i iO E=∑ −
1
SRD = (R -R ) /ni med2
i
n
=∑
1
where: = the value of the i-th observation; = estimated value for the i-th observation; = residual corresponding to i-th observation; = average residual; = number of observations.
Form Factor
In addition to generating the tested equations the form factor (ff) was also calculated (12) by diameter class (5 cm), as well as general, considering the three different diameter measuring heights adopted.
ff =V
Vobs
cil
where: = observed volume (rigorous scaling); = cylinder volume, using the diameters DBH, DAS1and DAS2.
Test of adjusted equations
In order to test whether the volumetric equations in the present study adjusted by GP and OLS, and also the form factor, could be used for the entire state of Minas Gerais, forest inventory data from 56 fragments of Cerrado Sensu Stricto and Campo Cerrado were used, as presented in IFMG. Other treatment tested was used 6 volume equations adjusted by Scolforo et al., (2008) for the watersheds. The comparison of means were made by analysis of variance (ANOVA) followed by the Tukey test at 5% significance.
RESULTS AND DISCUSSION
Table 2 contains the parameters of the models adjusted by the two methods (GP and OLS). Where all
(12)
(11)
(10)
(9)

MORAIS, V. A. et al.234
Ciênc. Agrotec., Lavras, v.38, n. 3, p.230-239, maio./jun., 2014
parameters were significant by the t test. The adjustment and validation statistics of the models are presented in table 2.
In volumetric equation adjustments by the OLS method we observed that the Syx (%) ranged from 31.55 to 54.90. The lowest values of this statistic are associated with model using DBH and total height. The same tendency was observed forR²aj.Observing the (SSE) and (MAPE) adjustment statistics, the OLS and GP adjustment methods showed no significant difference between them. Since the main advantage of GP is the not obligation of assumptions of OLS.
The graphic analysis of residuals showed that the adjusted dual input equations using DBH are that which provide a better fit to the data, while those of single input in function of the DAS2 presented a residual dispersion graphic with greater heterogeneity. The GP and OLS showed a few different trends regarding the distribution of residuals in equations using the DAS2, the first tends to underestimate the volumes in smaller diameter classes, but both tends in overestimate the volume (Figure 2).
According to the predictive validation, it was possible to observe that the equations fit better when uses DBH against the other diameter measurement the lights. The equation adjusted by GP using DBH and Ht, showed a slightly higher MAPE value than by OLS, but with a little difference. Analyzing the MAE and RSD statistics, GP performed better, except for RSD in the equation that uses DBH and Ht (Table 2).
The biomass equations presented Syx (%) values higher than the volume equations, where the DBH and Ht variables indicate a advantage of adjustments according to the volume tendency. There was no difference between the used methods (GP and OLS) adjustments. The predictive validation confirmed that the best results are those arising from the equations that consider DBH and Ht, presenting the best values for the statistics used.
The graphic analysis of residuals confirmed that the use of DBH and Ht combined provide the best adjustments (Figure 3). In terms of tendency, both fitting methods presented very similarly.
The stand error of the estimate (%) values observed in this work are justified by the great variability found in nature, and already discussed by various authors (CETEC, 1995; Chave et al., 2005; Rezende et al., 2006; Scolforo et al., 2004; Basuki et al., 2009; Imaña-Encinas et al., 2009; Rufini et al., 2010; Miranda; Melo; Sanquetta, 2011; Ribeiro et al., 2011), being more pronounced in the case of Cerrados (Rezende et al., 2006; Scolforo et al., 2008, Imaña-Encinas et al., 2009). Corroborating Ta
ble
2 –
Adj
ustm
ent p
aram
eter
s and
crit
eria
of t
he d
ual a
nd si
ngle
inpu
t mod
els u
sing
OLS
and
GP
adju
stm
ent a
nd v
alid
atio
n da
ta.
Mod
elA
djus
tmen
tPa
ram
eter
s of t
he M
odel
sA
djus
tmen
t Dat
aVa
lidat
ion
Dat
a β 0
β 1β 2
R² aj
.Sy
x (m
³)Sy
x (%
)SS
EM
APE
(%)
MA
ER
SDM
APE
Tota
l vol
ume
with
bar
k
1O
LS -9
.769
842.
4204
90.
4873
30.
980.
1058
031
.55
7.7
577
15.3
60.
0566
00.
0126
415
.02
GP
-9.7
9192
2.44
091
0.46
566
--
- 7
.747
915
.21
0.05
651
0.01
268
14.8
7
2O
LS10
.468
522.
5885
40.
4266
30.
960.
1596
147
.59
17.6
548
21.9
50.
0705
00.
0201
321
.75
GP
10.4
9572
2.62
460
0.39
115
--
-18
.346
522
.11
0.06
908
0.01
939
21.8
3
3O
LS10
.661
062.
5544
20.
4599
90.
940.
1831
554
.61
23.2
470
29.7
40.
0940
70.
0388
032
.75
GP
10.5
4503
2.54
763
0.42
827
--
-23
.196
030
.53
0.09
400
0.03
878
33.7
8
4O
LS -9
.488
032.
6703
5-
0.97
0.11
601
34.5
9 9
.340
318
.19
0.06
307
0.02
002
17.6
8G
P -9
.568
192.
6973
9-
--
- 9
.382
818
.07
0.06
269
0.01
901
17.7
6C
ontin
ue...

Influence of diameter measuring... 235
Ciênc. Agrotec., Lavras, v.38, n. 3, p.230-239, maio./jun., 2014
Mod
elA
djus
tmen
tPa
ram
eter
s of t
he M
odel
sA
djus
tmen
t Dat
aVa
lidat
ion
Dat
a β 0
β 1β 2
R² aj
.Sy
x (m
³)Sy
x (%
)SS
EM
APE
(%)
MA
ER
SDM
APE
Tota
l vol
ume
with
bar
k
5O
LS10
.309
672.
8270
7-
0.96
0.16
143
48.1
318
.084
723
.59
0.07
403
0.02
312
23.1
7G
P10
.346
692.
8446
8-
--
-18
.852
823
.90
0.07
283
0.02
161
23.4
1
6O
LS10
.526
262.
8161
0-
0.93
0.18
413
54.9
023
.529
431
.18
0.10
039
0.04
708
34.3
8G
P10
.465
712.
8096
6-
24.5
391
32.3
10.
0992
80.
0452
635
.60
Bio
mas
s
1O
LS-1
0.35
940
2.43
474
0.51
075
0.97
0.10
054
47.7
0 7
.004
921
.19
0.04
448
0.01
048
19.1
1G
P-1
0.35
359
2.44
700
0.49
171
6.9
849
21.2
30.
0443
50.
0103
919
.15
2O
LS-1
1.05
056
2.59
129
0.46
218
0.95
0.13
000
61.7
611
.741
728
.17
0.05
589
0.01
592
26.2
5G
P-1
1.12
964
2.64
282
0.44
194
12.8
512
29.0
00.
0540
50.
0147
226
.67
3O
LS-1
1.23
822
2.55
216
0.50
055
0.92
0.14
387
68.2
614
.343
335
.29
0.06
989
0.02
525
37.1
2G
P-1
1.21
750
2.55
557
0.50
661
15.2
227
36.6
70.
0676
30.
0240
838
.29
4O
LS-1
0.06
404
2.69
660
0.96
0.10
316
48.9
5 7
.385
923
.73
0.04
828
0.01
275
21.8
3G
P-1
0.10
600
2.71
495
7.3
224
23.9
50.
0469
70.
0119
621
.92
5O
LS-1
0.87
846
2.84
969
0.94
0.13
011
61.7
411
.749
329
.95
0.05
628
0.01
657
27.7
4G
P-1
0.94
847
2.88
538
12.4
274
30.9
90.
0528
50.
0147
128
.18
6O
LS-1
1.09
153
2.83
691
0.92
0.14
310
67.9
014
.212
136
.96
0.07
380
0.02
836
38.8
3G
P-1
1.01
459
2.82
762
14.5
437
38.4
60.
0722
70.
0271
940
.41
Tabl
e 2
– C
ontin
ued.
OLS
= a
djus
tmen
t by
regr
essi
on; G
P =
adju
stm
ent b
y G
oal P
rogr
amm
ing;
β0,
β 1, β 2 =
mod
el p
aram
ater
s; R
² aj.=
adj
uste
d co
effic
ient
of v
aria
tion;
Syx
(m³)
= re
sidu
al
stan
dard
err
or; S
yx (%
) = re
sidu
al st
anda
rd e
rror
in p
erce
ntag
e; S
SE =
sum
of s
quar
ed re
sidu
als;
MA
PE (%
) = m
ean
abso
lute
per
cent
age
erro
r; M
AE
= m
ean
abso
lute
er
ror;
RSD
= re
sidu
al st
anda
rd d
evia
tion.

MORAIS, V. A. et al.236
Ciênc. Agrotec., Lavras, v.38, n. 3, p.230-239, maio./jun., 2014
efforts to standardize the measurement height diameters at around 1.30m, a diameter that best describes the shape of the tree, besides there being a greater accuracy in the measures taken at this height, because at this point, the diameter measuring operation is more ergonomic. Felfili, Carvalho and Haidar (2005) justify the diameter measurement at 0.30 m above the soil by the small size of the Cerrado Sensu Strictoand Campo Cerrado trees, as well as the bifurcation of shafts near the ground.
this hypothesis, Rezende et al. (2006) affirm that such variability tends to increase as larger diameter trees are included in the database, for a simple reason; these trees are generally rare events in remnants on the Cerrado. Thus, to improve the adjustment quality, one would have an enormous sampling effort, that would make field operations unfeasible.
The DBH proved to be the dependent variables that best explains the volume and biomass, generating the most accurate results. This result reflects the
Figura 2 – Distribution of residuals of models outside bark volume adjusted for GP (red) and OLS (yellow) for cerrado Sensu Stricto and campo cerrado of Minas Gerais.
Figura 3 – Distribution of residuals of models biomass adjusted for GP (red) and OLS (yellow) for cerrado Sensu Stricto and campo cerrado of Minas Gerais.

Influence of diameter measuring... 237
Ciênc. Agrotec., Lavras, v.38, n. 3, p.230-239, maio./jun., 2014
The form factor generated for each diameter class (Table 3) showed that it is higher for DBH, decreasing towards the base (DAS2), indeed expected, since trees the near base are thicker. Among the classes, the factor increased up to 37.5 cm class, decreasing from this diameter.
In the present study the form factor showed peak in the 37.5 cm class. There are some aspects which can justify such a behavior, such as sampling, which is connected with a smaller number of tree species in the higher classes. Another aspect is the shape of the tree itself (crown architecture and shaft), belonging to few sampled species.
The diameter measured at 1.30mis the best variable to beused indifferent equations to estimate the volume and biomass for the Cerrado Sensu Stricto and Campo Cerrado of Minas Gerais.
The adjusted models in this study maybe satisfactorily used to estimate volume and biomass since the average of the errors were very low in all adjustments, the models being adjusted by GP or OLS, under the conditions of an expressive data base. The use of GP or OLS showed no expressively different results.
The diameter measurement height can interfere with the results, when estimating the volume and biomass weight in the Cerrado Sensu Stricto and Campo Cerrado of Minas Gerais. The use of DBH and total height being recommended as for adjustment model in these areas.
ACKNOWLEDGMENTS
The authors thank the coordinators of the Inventário Florestal de Minas Gerais for the availability of data used in this work. To CNPq, FAPEMIG and CAPES for providing study grants to the authors.
REFERENCES
ABDALA, G.C. et al. Above a belowground organic matter and root: shoot ratio in a Cerrado in Central Brazil. Brasilian Journal of Ecology, 2(1):11-23, 1998.
AHMAD, M.H. et al. Comparing least-square and goal programming estimates of linear regression parameters. Matematika, 21(2):101-112, 2005.
BASUKI, T.M. et al. Allometric equations for estimating the above-ground biomass in tropical lowland Dipterocarp forests. Forest Ecology and Management. 257(8):1684-1694, 2009.
BRASIL. Ministério do Meio Ambiente. Relatório técnico de monitoramento do desmatamento no bioma cerrado, 2002 a 2008: Dados Revisados. Brasília: Centro de Informação, Documentação Ambiental e Editoração Luís Eduardo Magalhães - Cid Ambiental, 2009. 69 p. (1). Disponível em: <www.mma.gov.br>. Acesso em: 12 jan. 2012.
CARVALHO, F.A. Diversidade de um cerrado Sensu Stricto com base em modelos de abundância de espécies. Bioscience Journal, 27(1):148-155, 2011.
Table 3 – Form Factor for each diameter measurement height.
Diameter ClassForm Factor
DBH DAS1 DAS27.5 0.76 0.50 0.4212.5 0.80 0.59 0.5017.5 0.89 0.68 0.5822.5 0.92 0.77 0.6727.5 0.96 0.81 0.7032.5 0.94 0.82 0.7137.5 1.01 0.88 0.7642.5 0.93 0.81 0.7047.5 0.86 0.78 0.7052.5 0.85 0.72 0.66
Average 0.89 0.74 0.64
The table 4 shows the result of F test where the p-value is 0.00133. In this case, the null hypo thesis is accepted and there was no statistical difference in use each estimating method of volume. Therefore, the use of a single equation for the whole state, the use of equations by region or the form factor will not present biased estimates of total volume with barkup to 3cmin diameter, for the Cerrado Sensu Stricto and Campo Cerrado of Minas Gerais state.
Table 4 – Analysis of variance for equations and form factor.
SV DF SS MS p-valueTreatment 3 15 5.15 0.99867Residual 219 114934 524.81
Total 222 114949 CV = 51.26%

MORAIS, V. A. et al.238
Ciênc. Agrotec., Lavras, v.38, n. 3, p.230-239, maio./jun., 2014
CARVALHO, L.M.T. et al. Análises espaciais e estatísticas da flora nativa em Minas Gerais. In: CARVALHO, L. M. T.; SCOLFORO, J. R. Monitoramento da flora nativa. 1.ed. Lavras: UFLA, 2008. p. 25-316.
CASTRO, E.A.; KAUFFMAN, J.B. Ecosystem structure in the Brazilian cerrado: a vegetation gradient of aboveground biomass, root mass and consumption by fire. Journal of Tropical Ecology, 14(3):263-283, 1998.
CETEC - CENTRO TECNOLOGICO DE MINAS GERAIS. Determinação de equações volumétricas aplicáveis ao manejo sustentado de florestas nativas no estado de Minas Gerais e outras regiões do país: relatório final. Belo Horizonte, 1995.
CHAVE, J. et al. Tree allometry and improved estimation of carbon stocks and balance in tropical forests. Ecosystem Ecology, 145:87-99, 2005.
FELFILI, J.M.; CARVALHO, F.A.; HAIDAR, R.F. Manual para o monitoramento de parcelas permanentes nos biomas cerrado e pantanal. Brasília: Universidade de Brasília, Departamento de Engenharia Florestal, 2005. 54p.
IMAÑA-ENCINAS, J. et al. Equações de volume de madeira para o cerrado de Planaltina de Goiás. Revista Floresta, 39(1):107-116, 2009.
LIMA, T.A. et al. Florística e estrutura da vegetação arbustivo-arbórea em uma área de cerrado rupestre no Parque Estadual da Serra de Caldas Novas, Goiás. Biota Neotropica, 10(2):159-166, 2010.
MEWS, H.A; MARIMON, B.S.; MARACAHIPES, L; Dinâmica da comunidade lenhosa de um Cerrado típico na região Nordeste do estado de Mato Grosso, Brasil. Biota Neotropica, 11(1):1- 10, 2011.
MACHADO, S.A; FIGUEIREDO FILHO, A. Dendrometria, 2.ed. Guarapuava: UNICENTRO, 2009. 316p.
MEDEIROS, M. B.; WALTER, B. M. T.; SILVA, G. P. Fitossociologia do cerrado Stricto Sensu no município de Carolina, MA, Brasil. Cerne, 14(4):285-294, 2008.
MIRANDA, D.L.C; MELO, A.C.G.;SANQUETTA, C.R. Equações alométricas para estimativa de biomassa e carbono em árvores de reflorestamento de restauração. Revista Árvore, 35(3- Edição Especial):679-689, 2011.
OLIVEIRA, M.L.R. et al. Equações de volume de povoamentos para fragmentos florestais naturais do município de Viçosa, Minas Gerais. Revista Árvore, 29(2):213-225, 2005.
PAIVA, A.O.; REZENDE, A.V.; PEREIRA, R.S. Estoque de carbono em cerrado Sensu Stricto do Distrito Federal. Revista Árvore, 35(3):527-538, 2011.
PINHEIRO, E.S.; DURIGAN, G. Diferenças florísticas e estruturais entre fitofisionomias do cerrado em Assis, SP, Brasil. Revista Árvore, 36(1):181-193, 2012.
PRODAN, M. et al. Mensura Forestal. San Jose: Deutsche Gesellsschaft fur Technische Zuusammenarbeit: Instituto Interamericano de Cooperación para la Agricultura, 1997, 561p.
R DEVELOPMENT CORE TEAM. R: A language and environment for statistical computing.R Foundation for Statistical Computing. Vienna, 2008. Disponível em: <http://www.R-project.org>. Acesso em: 22 out. 2011.
REZENDE, A.V. et al. Comparison of mathematical models to volume, biomass and carbon stock estimation of the woody vegetation of a Cerrado Sensu Stricto in Brasília, DF. Scientia Forestalis, 71:65-6, 2006.
RIBEIRO, J.F.; WALTER, B.M.T. Fitofisionomias do bioma Cerrado. In: SANO, S.M.; ALMEIDA, S.P.; RIBEIRO, J.F. (Ed.). Cerrado: ecologia e flora. Planaltina: Embrapa Cerrados, v. 1, 2008, p.89-168.
RIBEIRO, S.C. et al. Above- and belowground biomass in a Brazilian Cerrado. Forest Ecology and Management, 262(3):491-499, 2011.
RIBEIRO, M. N. et al. Fogo e dinâmica da comunidade lenhosa em cerrado sentido restrito, Barra do Garças, Mato Grosso. Acta Botânica Brasilica, 26(1):203-217, 2012.
RUFINI, A. L. et al. Equações volumétricas para o cerrado Sensu Stricto, em Minas Gerais. Cerne, 16(1):1-11, 2010.
Influence of diameter measuring... 239
Ciênc. Agrotec., Lavras, v.38, n. 3, p.230-239, maio./jun., 2014
SCOLFORO, J.R.S. et al. Estimativas de volume, peso seco, peso de óleo e quantidade de moirões para Candeia [Eremanthus erythropappus (DC.) MacLeish]. Cerne, 10(1):87-102, 2004.
SCOLFORO, J.R.; OLIVEIRA, A.D.; ACERBI JÚNIOR, F.W. (Ed.). Equações de Volume, Peso de Matéria Seca e Carbono para Diferentes Fitofisionomias da Flora Nativa. Lavras: UFLA, 2008, 216p.
SIQUEIRA, A. S. Alometria de Caryocar brasiliense (Caryocaraceae) em diferentes fisionomias do Parque Estadual da Serra de Caldas Novas, GO. Biota Neotropica [on line], 6(3):0-0, 2006.
VALE, A. T.; FELFILI, J. M. Dry biomass distribution
in a cerrado Sensu Stricto site in central Brazil. Revista Árvore, 29(5):661-669, 2005.
VALE, A.T.; FIEDLER, N.C.; SILVA, G. F. Avaliação energética da biomassa do cerrado em função do diâmetro das árvores. Ciência Florestal, 12(2):115-126, 2002.
VALE, V.S.; CRESPILHO, R.F.; SCHIAVINI, I. Análise da regeneração natural em uma comunidade vegetal de cerrado no Parque Victório Siquierolli, Uberlândia-MG. Bioscience Journal, 25(1):131-145, 2009.