
2.3 Coca/cocaine2.3 Coca/cocaine 161 2.3.1 Production Cultivation The global area under coca...
21
2.3 Coca/cocaine 161 Production 2.3.1 Cultivation The global area under coca cultivation decreased by 5% from 167,600 ha in 2008 to 158,800 ha in 2009, mainly due to a significant decrease in Colombia, which was not offset by increases in Peru and the Plurinational State of Bolivia. This is about the same level of cultiva- tion as during the period 2003 to 2006. Colombia remained the country with the largest area under coca cultivation but the distance to the second largest, Peru, has shrunk due to two consecutive years of decreases in Colombia and increases in Peru over the same period. In Colombia, the area under coca cultivation decreased for a third year to 68,000 ha, a 16% decrease over 2008. Most of the reduction took place in the departments of Putumayo, Nariño and Antioquía. In 2009, coca cultivation in Peru increased by 7% from 2008 and reached 59,900 ha. Peru remained the second largest coca cultivating country, after Colombia. This is the country’s third consecutive increase in three years. The cultivation level is 55% or 21,200 ha more than in 1999, when coca cultivation was at its lowest level in the last two decades at 38,700 ha. The area under cultiva- tion in the three main growing regions Alto Huallaga, Apurímac-Ene and La Convención-Lares, where large parts are already covered with coca plantations, increased only slightly. Most of the increase in absolute and per- centage terms took place in smaller growing regions such as Aguaytía, Inambari-Tambopata and Palcazú-Pichis- Pachitea, which have seen a considerable expansion of the area under coca cultivation since 2004. Coca cultivation in the Plurinational State of Bolivia in 2009 remained by and large at the 2008 level with only a slight increase of 1% to 30,900 ha. The increase took place in both large growing regions, the Yungas of La Paz and Chapare. Eradication reports from Ecuador indicated the exist- ence of small-scale coca cultivation. However, surveys implemented by UNODC in cooperation with the Government of Ecuador in 2006 and 2008 confirmed that the level of coca cultivation was insignificant. 1 1 The surveys covered provinces in the north of Ecuador bordering Colombia. Global coca bush cultivation (ha), Fig. 132: 1995-2009 Source: see Table ‘Global illicit cultivation of coca bush and production of coca leaf and cocaine, 1995-2009’ 0 25,000 50,000 75,000 100,000 125,000 150,000 175,000 200,000 225,000 95 96 97 98 99 00 01 02 03 04 05 06 07 08 09 Hectares C olombia Peru B olivia
Transcript of 2.3 Coca/cocaine2.3 Coca/cocaine 161 2.3.1 Production Cultivation The global area under coca...

2.3 Coca/cocaine
161
Production 2.3.1
Cultivation
The global area under coca cultivation decreased by 5% from 167,600 ha in 2008 to 158,800 ha in 2009, mainly due to a significant decrease in Colombia, which was not offset by increases in Peru and the Plurinational State of Bolivia. This is about the same level of cultiva-tion as during the period 2003 to 2006. Colombia remained the country with the largest area under coca cultivation but the distance to the second largest, Peru, has shrunk due to two consecutive years of decreases in Colombia and increases in Peru over the same period.
In Colombia, the area under coca cultivation decreased for a third year to 68,000 ha, a 16% decrease over 2008. Most of the reduction took place in the departments of Putumayo, Nariño and Antioquía.
In 2009, coca cultivation in Peru increased by 7% from 2008 and reached 59,900 ha. Peru remained the second largest coca cultivating country, after Colombia. This is the country’s third consecutive increase in three years. The cultivation level is 55% or 21,200 ha more than in 1999, when coca cultivation was at its lowest level in the last two decades at 38,700 ha. The area under cultiva-tion in the three main growing regions Alto Huallaga, Apurímac-Ene and La Convención-Lares, where large parts are already covered with coca plantations, increased only slightly. Most of the increase in absolute and per-centage terms took place in smaller growing regions such as Aguaytía, Inambari-Tambopata and Palcazú-Pichis-Pachitea, which have seen a considerable expansion of the area under coca cultivation since 2004.
Coca cultivation in the Plurinational State of Bolivia in 2009 remained by and large at the 2008 level with only a slight increase of 1% to 30,900 ha. The increase took place in both large growing regions, the Yungas of La Paz and Chapare.
Eradication reports from Ecuador indicated the exist-ence of small-scale coca cultivation. However, surveys implemented by UNODC in cooperation with the Government of Ecuador in 2006 and 2008 confirmed that the level of coca cultivation was insignificant.1
1 The surveys covered provinces in the north of Ecuador bordering Colombia.
Global coca bush cultivation (ha), Fig. 132: 1995-2009
Source: see Table ‘Global illicit cultivation of coca bush and production of coca leaf and cocaine, 1995-2009’
0
25,000
50,000
75,000
100,000
125,000
150,000
175,000
200,000
225,000
95 96 97 98 99 00 01 02 03 04 05 06 07 08 09
Hec
tare
s
Colombia Peru Bolivia
162
World Drug Report 2010
Global illicit cultivation of coca bush and production of coca leaf and cocaine, 1995-2009Table 19:
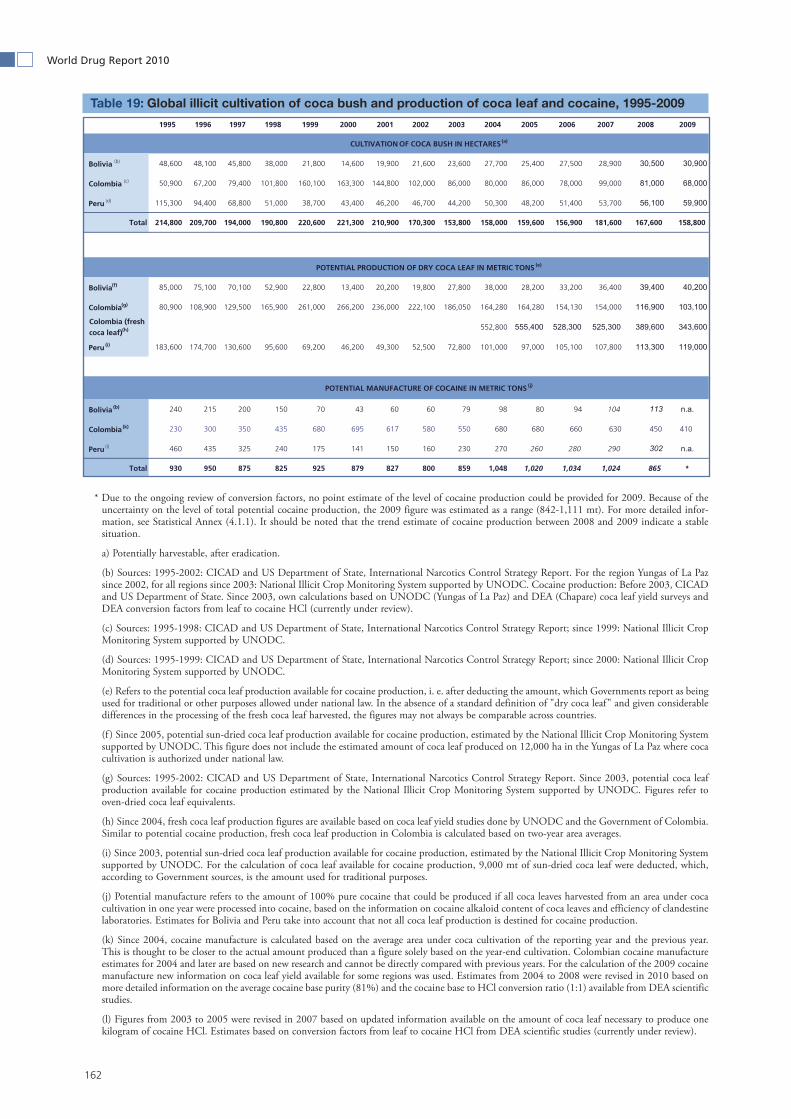
* Due to the ongoing review of conversion factors, no point estimate of the level of cocaine production could be provided for 2009. Because of the uncertainty on the level of total potential cocaine production, the 2009 figure was estimated as a range (842-1,111 mt). For more detailed infor-mation, see Statistical Annex (4.1.1). It should be noted that the trend estimate of cocaine production between 2008 and 2009 indicate a stable situation.
a) Potentially harvestable, after eradication.
(b) Sources: 1995-2002: CICAD and US Department of State, International Narcotics Control Strategy Report. For the region Yungas of La Paz since 2002, for all regions since 2003: National Illicit Crop Monitoring System supported by UNODC. Cocaine production: Before 2003, CICAD and US Department of State. Since 2003, own calculations based on UNODC (Yungas of La Paz) and DEA (Chapare) coca leaf yield surveys and DEA conversion factors from leaf to cocaine HCl (currently under review).
(c) Sources: 1995-1998: CICAD and US Department of State, International Narcotics Control Strategy Report; since 1999: National Illicit Crop Monitoring System supported by UNODC.
(d) Sources: 1995-1999: CICAD and US Department of State, International Narcotics Control Strategy Report; since 2000: National Illicit Crop Monitoring System supported by UNODC.
(e) Refers to the potential coca leaf production available for cocaine production, i. e. after deducting the amount, which Governments report as being used for traditional or other purposes allowed under national law. In the absence of a standard definition of "dry coca leaf" and given considerable differences in the processing of the fresh coca leaf harvested, the figures may not always be comparable across countries.
(f ) Since 2005, potential sun-dried coca leaf production available for cocaine production, estimated by the National Illicit Crop Monitoring System supported by UNODC. This figure does not include the estimated amount of coca leaf produced on 12,000 ha in the Yungas of La Paz where coca cultivation is authorized under national law.
(g) Sources: 1995-2002: CICAD and US Department of State, International Narcotics Control Strategy Report. Since 2003, potential coca leaf production available for cocaine production estimated by the National Illicit Crop Monitoring System supported by UNODC. Figures refer to oven-dried coca leaf equivalents.
(h) Since 2004, fresh coca leaf production figures are available based on coca leaf yield studies done by UNODC and the Government of Colombia. Similar to potential cocaine production, fresh coca leaf production in Colombia is calculated based on two-year area averages.
(i) Since 2003, potential sun-dried coca leaf production available for cocaine production, estimated by the National Illicit Crop Monitoring System supported by UNODC. For the calculation of coca leaf available for cocaine production, 9,000 mt of sun-dried coca leaf were deducted, which, according to Government sources, is the amount used for traditional purposes.
(j) Potential manufacture refers to the amount of 100% pure cocaine that could be produced if all coca leaves harvested from an area under coca cultivation in one year were processed into cocaine, based on the information on cocaine alkaloid content of coca leaves and efficiency of clandestine laboratories. Estimates for Bolivia and Peru take into account that not all coca leaf production is destined for cocaine production.
(k) Since 2004, cocaine manufacture is calculated based on the average area under coca cultivation of the reporting year and the previous year. This is thought to be closer to the actual amount produced than a figure solely based on the year-end cultivation. Colombian cocaine manufacture estimates for 2004 and later are based on new research and cannot be directly compared with previous years. For the calculation of the 2009 cocaine manufacture new information on coca leaf yield available for some regions was used. Estimates from 2004 to 2008 were revised in 2010 based on more detailed information on the average cocaine base purity (81%) and the cocaine base to HCl conversion ratio (1:1) available from DEA scientific studies.
(l) Figures from 2003 to 2005 were revised in 2007 based on updated information available on the amount of coca leaf necessary to produce one kilogram of cocaine HCl. Estimates based on conversion factors from leaf to cocaine HCl from DEA scientific studies (currently under review).
1995 1996 1997 1998 1999 2000 2001 2002 2003 2004 2005 2006 2007 2008 2009
Bolivia (b) 48,600 48,100 45,800 38,000 21,800 14,600 19,900 21,600 23,600 27,700 25,400 27,500 28,900
Colombia (c) 50,900 67,200 79,400 101,800 160,100 163,300 144,800 102,000 86,000 80,000 86,000 78,000 99,000
Peru (d) 115,300 94,400 68,800 51,000 38,700 43,400 46,200 46,700 44,200 50,300 48,200 51,400 53,700
Total 214,800 209,700 194,000 190,800 220,600 221,300 210,900 170,300 153,800 158,000 159,600 156,900 181,600 167,600 158,800
Bolivia (f) 85,000 75,100 70,100 52,900 22,800 13,400 20,200 19,800 27,800 38,000 28,200 33,200 36,400
Colombia (g) 80,900 108,900 129,500 165,900 261,000 266,200 236,000 222,100 186,050 164,280 164,280 154,130 154,000
Colombia (fresh coca leaf) (h) 552,800
Peru (i) 183,600 174,700 130,600 95,600 69,200 46,200 49,300 52,500 72,800 101,000 97,000 105,100 107,800
Bolivia (b) 240 215 200 150 70 43 60 60 79 98 80 94 104
Colombia (k) 230 300 350 435 680 695 617 580 550 680 680 660 630 450 410
Peru (l) 460 435 325 240 175 141 150 160 230 270 260 280 290
Total 930 950 875 825 925 879 827 800 859 1,048 1,020 1,034 1,024 865 *
CULTIVATION OF COCA BUSH IN HECTARES (a)
POTENTIAL PRODUCTION OF DRY COCA LEAF IN METRIC TONS (e)
POTENTIAL MANUFACTURE OF COCAINE IN METRIC TONS (j)

163
2. Drug statistics and trends Coca/cocaine
Production
Due to the ongoing review of conversion factors from coca leaves to 100% pure cocaine HCl used to estimate the potential cocaine production in the Plurinational State of Bolivia and Peru, no point estimate of the level of cocaine production could be provided for these coun-tries in 2009. Because of this uncertainty, global cocaine production in 2009 was estimated as a range (842-1,111 mt).2 The uncertainty concerning conversion factors from leaves to cocaine affects the level of cocaine pro-duction in 2009, but other years prior to 2009 may be affected as well. Indeed, production figures provided by UNODC between 2005 and 2009 may be revised once more precise estimates can be elaborated for the conver-sion factors, which depend on the alkaloid content of the leaves and laboratory efficiency. They do not show major changes from one year to another. Thus, in spite of the uncertainty around the level of the 2009 estimates it can be noted that the total production trend between 2008 to 2009 remained stable.
Cocaine HCl production estimates for Colombia were revised, reflecting the availability of more detailed infor-mation on specific elements of the conversion process from the DEA scientific studies. This led to a slight increase in the estimated level of potential cocaine pro-duction since 2004. However, potential cocaine produc-tion in Colombia declined by 9% from 450 mt in 2008 to 410 mt in 2009.3
In the absence of a point estimate for the level of poten-tial cocaine production in 2009, estimates of coca leaf production can provide additional information on recent illicit production trends. To be able to compare coca leaf production across countries, fresh coca leaf production estimates were used where available (Colombia) or cal-
2 For more detailed information, see Annex ‘The process of estimating the production of pure cocaine HCL.’
3 For more details, see Ibid.
culated from sun-dried leaf production (Plurinational State of Bolivia and Peru) using a conversion factor.4
Global potential production of fresh coca leaf was rela-tively stable between 2004 and 2007 at about 850,000 mt, but declined significantly between 2007 and 2008 (by 14%) and again between 2008 and 2009 (by 4%) to just over 700,000 mt. Between 2004 and 2009, Colom-bia always accounted for the largest share of coca leaf production. However, while Colombia contributed almost two thirds (63%) of total production in 2004, in 2009, it accounted for less than half (48%). Peru’s share grew from 27% in 2004 to 39% in 2009, due to a decline in coca leaf production in Colombia in absolute terms and an increase in production in Peru over the same period.
4 The average weight loss from fresh to sun-dried leaf measured in UNODC’s yield studies ranged from 52% (Bolivia, Yungas of La Paz) to 57% (average Peru). Only the amount of coca leaves estimated to be available for cocaine production was included in the estimate. More details see Table ‘Global illicit cultivation of coca bush and production of coca leaf and cocaine, 1995-2009.’
Reported spraying and manual eradication of coca bush (ha), 1995-2009Table 20:
Note: The Plurinational State of Bolivia: Since 2006, voluntary and forced eradication. Peru: includes voluntary and forced eradication. Source: UNODC ARQ, Government reports, US Department of State (INCSR)
Global potential production of fresh Fig. 133: coca leaf available for cocaine production (mt), 2004-2009
Source: National monitoring systems supported by UNODC. For more details see Table ‘Global illicit cultivation of coca bush and production of coca leaf and cocaine, 1995-2009’
1995 1996 1997 1998 1999 2000 2001 2002 2003 2004 2005 2006 2007 2008 2009
Bolivia manual 5,493 7,512 7,000 11,620 15,353 7,653 9,395 11,839 10,089 8,437 6,073 5,070 6,269 5,484 6,341
Colombia manual 1,487 4,057 2,262 3,126 1,046 3,495 1,745 2,762 4,219 6,234 31,980 43,051 66,805 95,634 60,557
spraying 23,915 18,519 41,861 66,029 43,112 58,073 94,153 130,364 132,817 136,552 138,775 172,026 153,134 133,496 104,772
Peru manual 1,259 3,462 7,834 14,733 6,208 6,436 7,134 11,312 10,399 12,237 12,688 12,072 10,143 10,025
Ecuador manual 4 18 9 12 12 6
Venezuela manual 181 18 0 0 0 38 47 0 0 118 40 0 0 0
0100,000200,000300,000400,000500,000600,000700,000800,000900,000
1,000,000
2004 2005 2006 2007 2008 2009
Met
ric
ton
s
Colombia Peru Bolivia

164
World Drug Report 2010
Measuring coca leaf yieldThree elements are needed to estimate cocaine production each year: i) number of hectares under coca leaf cultiva-tion; ii) annual coca leaf yield (quantity of leaves harvested per hectare in a year); and iii) alkaloid content of the leaves and efficiency of clandestine laboratories to extract these alkaloids, which determine the quantity of coca leaves needed to produce pure cocaine hydrochloride (HCl). Coca leaf yield is the element that probably shows the high-est variation since it is affected by unpredictable factors such as weather, plant diseases, as well as eradication activi-ties. The effect of these factors varies not only from year to year and during the course of a year but also from one cultivating region to the other. Thus, the annual coca leaf yield can be estimated with less certainty than the other elements.
Since 2004, UNODC, in cooperation with the respective Governments, undertook coca leaf yield studies in many coca growing regions in the Plurinational State of Bolivia, Colombia and Peru. The core element of these studies is the controlled harvest of mature coca fields. For this purpose, sample plots are selected randomly among a set of fields which are also randomly selected among all fields under coca leaf cultivation. All coca leaves in the sampled plots are harvested and weighed on the spot. In the Plurinational State of Bolivia and Peru, where farmers sun-dry coca leaves after the harvest, an additional weight measurement is taken after the sun-drying. The weight of the harvested coca leaves divided by the area of the sample plots is the yield per hectare of that plot (for one harvest). Yield measurements from all plots and fields are used to determine the per hectare yield in the studied area.
The coca bush allows several harvests per year, with four being a typical number. Depending on seasonal variations, such as periods with higher precipitation or variations in farming practices (application of fertilizer and/or irrigation) or counter-narcotics activities such as spraying with herbicide, the yield varies from harvest to harvest. These varia-tions have to be taken into account. Ideally, all harvests in the selected plots should be measured. However, often the security situation in coca cultivation regions does not allow for a return to sample fields for further measure-ments. Then, information from farmers’ interviews can be used to estimate the number and yield of past harvests. The annual yield is the sum of all coca leaf yields in the course of one year.
Due to the different post-harvest processing methods in the Andean countries, coca leaf yield and production figures can be expressed in fresh, sun-dry or oven-dry leaf. Fresh coca leaf is typically used in Colombia, where the leaves are processed directly after harvesting to extract the alkaloids, often by the farmers themselves. In the Plurinational State of Bolivia and Peru, farmers dry the harvested coca leaves in a process referred to as sun- or air-drying before the alkaloids are extracted. Sun-drying is also used to produce coca leaves for traditional uses such as tea preparation and mastication (chewing). Sun-drying reduces the weight of the fresh leaves by more than 50%. It makes transpor-tation easier and increases the shelf life of the coca leaves. Oven-dry weight is a standard that allows comparing coca leaf yields across countries with different post-harvest processing methods. Coca leaves are dried in an oven to extract moisture until their weight is stable. This method requires a scientific laboratory. After oven-drying, coca leaves have only about one third of their fresh weight.
Total cocaine production can be estimated by determining the cocaine alkaloid content of coca leaves and multiply-ing it with the total coca leaf production estimated from yield and cultivation surveys. As clandestine laboratories are not able to extract 100% of the cocaine alkaloids contained in the leaf, a factor representing the efficiency of these laboratories is applied. Depending on the extraction method used, clandestine laboratories can extract between 40% and 80% of the alkaloids present in the coca leaves.
Sources: United Nations International Drug Control Programme, Guidelines for yield assessment of opium gum and coca leaf from brief field visits New York, 2001; US Government, DEA Studies, 1993-2005.
Clandestine laboratories
In 2008, Governments reported the detection of 9,730 clandestine installations (‘laboratories’) involved in coca processing, compared to 7,245 in 2007. As in past years, about 4% of the total installations detected were pro-ducing cocaine HCl. Over 99% of coca processing labo-ratories were located in the three coca cultivating countries, Plurinational State of Bolivia, Colombia and
Peru. Over the last four years, there was a significant increase in coca processing laboratories reported destroyed in these countries and also worldwide.
In 2008, cocaine laboratories were also reported from other countries in South America, such as Argentina (20), the Bolivarian Republic of Venezuela (10), Chile (4) and Ecuador (3). Outside South America, Spain (25), the Netherlands (4), the Republic of Moldova (1)

165
2. Drug statistics and trends Coca/cocaine
and Greece (1) reported the detection of cocaine labora-tories. Preliminary reports from Governments of coun-tries with coca cultivation indicate that in 2009, the number of clandestine coca processing laboratories detected was almost as high as in 2008, and significantly higher than 2005-2007.
Clandestine coca processing installations, 2005-2008Table 21:
Note: Previous years’ figures were revised based on updated information received from Governments. Source: UNODC ARQ, Government reports
2005 2006 2007 2008
Cocaine paste/base producing installations 5,690 6,849 6,930 9,341
Percentage of coca processing installations detected in coca cultivating countries >99% >99% >99% >99%
Cocaine HCl producing laboratories 212 244 315 389
Cocaine HCl labs as % of total installations 4% 3% 4% 4%
Cocaine HCl labs in coca cultivating countries 166 215 308 322
Total coca processing installations detected 5,902 7,093 7,245 9,730

166
World Drug Report 2010
Seizures2.3.2
Following a significant increase over the period 2002-2005, global cocaine seizure totals have followed a stable trend, amounting to 712 mt in 2007 and 711 mt in 2008. Seizures continued to be concentrated in the Americas and Europe. However, the transition from 2007 to 2008 brought about a geographical shift in seizures towards the source countries for cocaine. Sei-zures in South America accounted for 59% of the global total for 2008, compared with 45% in 2007. This was mainly due to increases in several South American coun-tries, notably Colombia, and simultaneous decreases in North America and Europe.
More cocaine stopped at the source
Cocaine seizures in South America reached record levels in 2008, amounting to 418 mt (cocaine base and salts) – almost one third more than the level in 2007 (322 mt). In absolute terms, the largest increase from 2007 was by far the one registered in Colombia (an increase of 61.9 mt). In relative terms, significant increases were also recorded in Peru (where seizures almost doubled), the Plurinational State of Bolivia (where seizures rose by 62%), Argentina (51%), Brazil (21%) and Ecuador (12%). One exception to the generally increasing trend
prevalent in South America was Chile, which registered a decrease of 12%. Seizures in the Bolivarian Republic of Venezuela remained essentially stable.
Comparison of cocaine seizures in South America and other regions, 2000-2008Fig. 134:
Source: UNODC ARQ/DELTA
-450 -300 -150 0 150 300 450
2000
2001
2002
2003
2004
2005
2006
2007
2008
Metric tons
North America
South America
West and CentralEurope
Rest of the world
United States
Colombia
South America Rest of the world
Trend in South American cocaine Fig. 135: seizures (excluding Colombia), 2007-2008
Source: UNODC ARQ/DELTA
0
5
10
15
20
25
30
35
40
Ven
ezue
la
Boliv
ia
Ecua
dor
Peru
Braz
il
Arg
entin
a
Chi
le
Met
ric
ton
s
2007
2008+62% +12%
+6%
+96%
+21%
+51% -12%
150300450

167
2. Drug statistics and trends Coca/cocaine
From 2002 onwards, Colombia and the United States consistently registered the largest and second largest annual cocaine (base and salts) seizures worldwide, respectively. Over the 2002-2007 period, cocaine sei-zures in the United States, the country with the largest consumer market for cocaine, were in line with those in Colombia, the country with the largest manufacture of cocaine, to a remarkable degree (with a correlation coef-ficient of 0.96). However, the trends in the two coun-tries diverged in 2008. Seizures in Colombia reached record levels, rising from 195 mt in 2007 to 257 mt5 in 2008, while seizures in the United States fell sharply, from 148 mt in 2007 to 98 mt in 2008 (-34%).
5 Observatorio de Drogas de Colombia. Data for Colombia from the ARQ (part III) for 2008 were not available.
Mexico continued to be the key transit country for large quantities of cocaine trafficked from the Andean region to the United States. In line with the trend in the United States, cocaine seizures in Mexico fell sharply in 2008, amounting to 19.3 mt. Cocaine seizures by authorities in the United States along the border with Mexico fol-lowed a generally decreasing trend between the last quarter of 2005 and the second quarter of 2008,6 sug-gesting that the amount of cocaine reaching the United States through the border with Mexico was in decline. In fact, between 2006 and 2008, cocaine seizures along this border fell by more than 40%. Partial data suggests that the decreased level was essentially sustained into
6 National Drug Intelligence Center, United States Department of Justice, National Drug Threat Assessment 2009, December 2008.
Cocaine seizures in Colombia and the United States, 2000-2008Fig. 136:
Source: UNODC ARQ/DELTA
0
50
100
150
200
250
300
2000
2001
2002
2003
2004
2005
2006
2007
2008
Ton
s
Colombia United States
20012003
2006
2007
2005
2004
2002
20002008
90
100
110
120
130
140
150
160
170
180
70 120 170 220 270
Co
cain
e se
ized
in U
S (t
on
s)Coc aine s eized in Colombia (tons )
L ine of bes t fit(2000-2007)
Cocaine seizures in Europe, 1998-2008 Fig. 137:
Source: UNODC ARQ/DELTA
0
20
40
60
80
100
120
140
1998 1999 2000 2001 2002 2003 2004 2005 2006 2007 2008
Ton
s
Rest of Europe
Ireland
Germany
Belgium
Italy
United Kingdom
France
Portugal
Netherlands
Spain
-48%

169
2. Drug statistics and trends Coca/cocaine
ever, seizure data suggest that this pattern may have started to subside. Cocaine seizures in West and Central Africa increased from 98 kg in 2002 to 4.6 mt in 2007, but in 2008 declined to 2.3 mt.
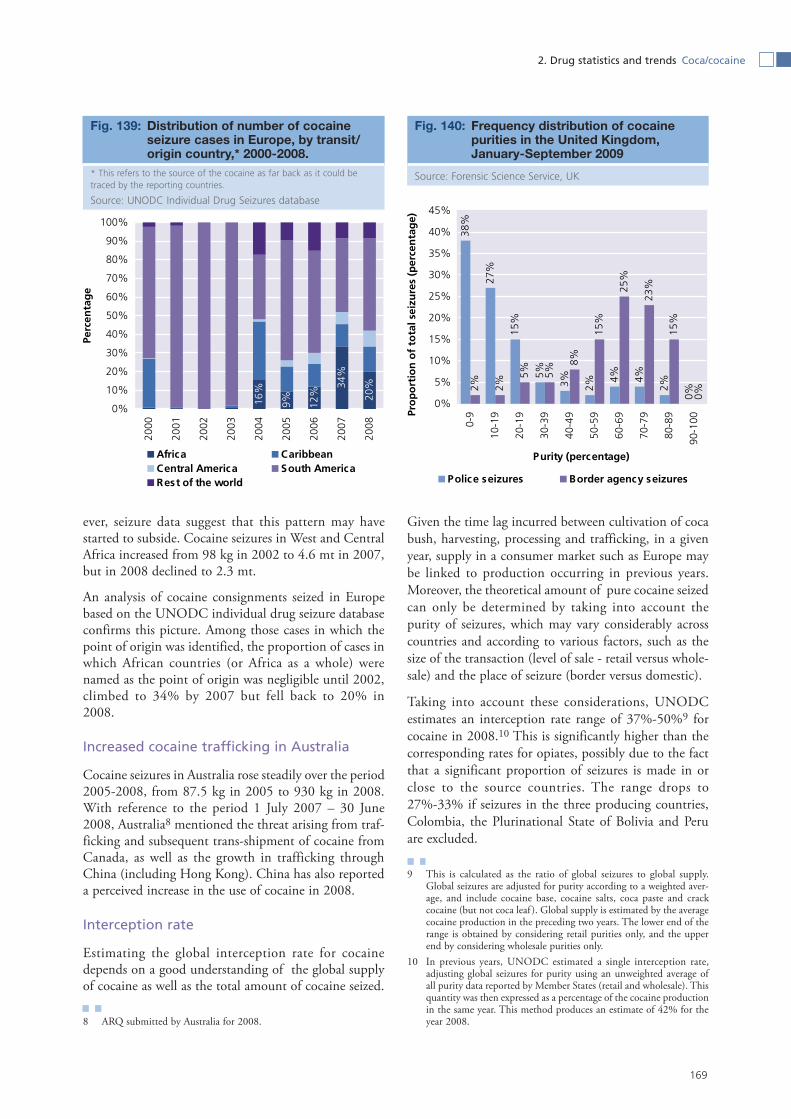
An analysis of cocaine consignments seized in Europe based on the UNODC individual drug seizure database confirms this picture. Among those cases in which the point of origin was identified, the proportion of cases in which African countries (or Africa as a whole) were named as the point of origin was negligible until 2002, climbed to 34% by 2007 but fell back to 20% in 2008.
Increased cocaine trafficking in Australia
Cocaine seizures in Australia rose steadily over the period 2005-2008, from 87.5 kg in 2005 to 930 kg in 2008. With reference to the period 1 July 2007 – 30 June 2008, Australia8 mentioned the threat arising from traf-ficking and subsequent trans-shipment of cocaine from Canada, as well as the growth in trafficking through China (including Hong Kong). China has also reported a perceived increase in the use of cocaine in 2008.
Interception rate
Estimating the global interception rate for cocaine depends on a good understanding of the global supply of cocaine as well as the total amount of cocaine seized.
8 ARQ submitted by Australia for 2008.
Given the time lag incurred between cultivation of coca bush, harvesting, processing and trafficking, in a given year, supply in a consumer market such as Europe may be linked to production occurring in previous years. Moreover, the theoretical amount of pure cocaine seized can only be determined by taking into account the purity of seizures, which may vary considerably across countries and according to various factors, such as the size of the transaction (level of sale - retail versus whole-sale) and the place of seizure (border versus domestic).
Taking into account these considerations, UNODC estimates an interception rate range of 37%-50%9 for cocaine in 2008.10 This is significantly higher than the corresponding rates for opiates, possibly due to the fact that a significant proportion of seizures is made in or close to the source countries. The range drops to 27%-33% if seizures in the three producing countries, Colombia, the Plurinational State of Bolivia and Peru are excluded.
9 This is calculated as the ratio of global seizures to global supply. Global seizures are adjusted for purity according to a weighted aver-age, and include cocaine base, cocaine salts, coca paste and crack cocaine (but not coca leaf ). Global supply is estimated by the average cocaine production in the preceding two years. The lower end of the range is obtained by considering retail purities only, and the upper end by considering wholesale purities only.
10 In previous years, UNODC estimated a single interception rate, adjusting global seizures for purity using an unweighted average of all purity data reported by Member States (retail and wholesale). This quantity was then expressed as a percentage of the cocaine production in the same year. This method produces an estimate of 42% for the year 2008.
Distribution of number of cocaine Fig. 139: seizure cases in Europe, by transit/ origin country,* 2000-2008.
* This refers to the source of the cocaine as far back as it could be traced by the reporting countries.
Source: UNODC Individual Drug Seizures database
16%
9% 12%
34%
20%
0%
10%
20%
30%
40%
50%
60%
70%
80%
90%
100%
2000
2001
2002
2003
2004
2005
2006
2007
2008
Perc
enta
ge
Africa CaribbeanCentral America South AmericaRest of the world
38%
27%
15%
5%
3% 2%
4% 4%
2%
0%
2% 2%
5% 5%
8%
15%
25%
23%
15%
0%
0%
5%
10%
15%
20%
25%
30%
35%
40%
45%
0-9
10-1
9
20-1
9
30-3
9
40-4
9
50-5
9
60-6
9
70-7
9
80-8
9
90-1
00
Purity (percentage)
Pro
po
rtio
n o
f to
tal s
eizu
res
(per
cen
tag
e)
Police seizures Border agency seizures
Frequency distribution of cocaine Fig. 140: purities in the United Kingdom, January-September 2009
Source: Forensic Science Service, UK

170
World Drug Report 2010
Prices2.3.3
Cocaine prices in 2008 reflected the well-known traf-ficking routes from South America to North America and Europe. The lowest wholesale prices were to be found in Peru, the Plurinational State of Bolivia and Colombia. Prices were, on average, noticeably higher in the rest of South America and slightly higher in Central America and the Caribbean. There was a clear markup in prices outside Latin America and the Caribbean. Wholesale prices in West Africa were significantly higher, but lower than prices in Europe. The wholesale price in Spain was significantly lower than the average in Europe, possibly reflecting Spain’s role as a major point of entry for cocaine into the European market. Very high whole-sale prices were registered in Saudi Arabia, Pakistan and the Russian Federation. The markup from wholesale to retail price can be more clearly observed when typical prices are adjusted by typical purities.
A comparison of prices in the producer countries and major consumer markets shows a markup of approxi-mately 30 times between prices of coca derivatives in the Plurinational State of Bolivia, Colombia and Peru and cocaine wholesale prices in the United States, and 60 times in the case of Europe.
In the United States, after a sharp increase in prices and decrease in purity, 2009 brought the first signs of stabilization
In the United States, price and purity data confirmed the reduced availability of cocaine. Data from the US Drug Enforcement Agency point to a distinct transition between the fourth quarter of 2007 and the fourth quar-ter of 2008, with purity dropping by 27% and the price per pure gram of cocaine rising by 72%, suggesting a shortage of cocaine in the US market. The increased price level was sustained into the third quarter of 2009,11 when it appeared to stabilize at the higher levels.
11 US Department of Justice, National Drug Threat Assessment 2010. Based on data extracted from System To Retrieve Information on Drug Evidence (STRIDE).
Cocaine wholesale prices worldwide, Fig. 141: 2008
Source: UNODC ARQ
Comparison of coca derivative prices Fig. 142: in producing countries and consumer markets, 2000-2008 (US dollars)
aWeighted average of 18 countries.Sources: National monitoring systems in the Plurinational State of Bolivia, Colombia and Peru and UNODC ARQ
100
1,000
10,000
100,000
2000
2001
2002
2003
2004
2005
2006
2007
2008
US$
/Kg
(lo
gar
ith
mic
sca
le)
Bolivia (P lurinational State of), street price of cocainebase in producing regionsColombia, farm-gate price of coca paste
Peru, farm-gate price of coca paste (PBC)
US wholesale price of cocaine
Western Europe, wholesale priceª
24 2736 39
4960
148156
171
8.16.62.32.31.30
20
40
60
80
100
120
140
160
180
200
Peru
Boliv
ia
Col
ombi
aRe
st o
f So
uth
Am
eric
a1
Cen
tral
Am
eric
a
Gha
na2
USA
2
Togo
Can
ada
Spai
n
Euro
pe1,
3
Russ
ian
Fede
ratio
n
Paki
stan
Saud
i Ara
bia
US$
/g
1 Simple average2 Average of minimum and maximum price3 Excluding Spain and the Russian Federation

171
2. Drug statistics and trends Coca/cocaine
Mixed picture in Europe
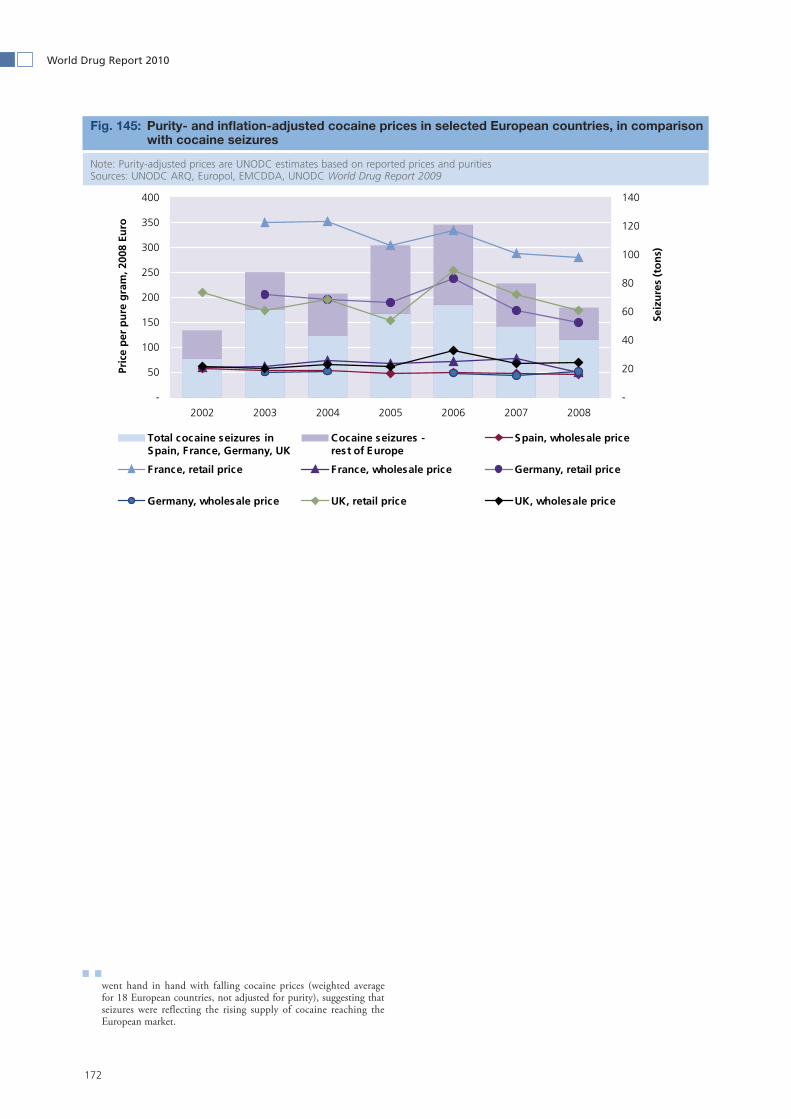
Prices per pure gram of cocaine for European countries were generally not available. On average,12 European cocaine prices, expressed in euro and adjusted for infla-tion (but not for purity), displayed a decreasing trend over the period 2006-2008, at both the retail and whole-sale levels. However, over the same period, prices increased when expressed in dollars and adjusted for inflation, suggesting that the trend has been more sensi-tive to the exchange rate between US dollar and euro than changes in the market.
A comparison of purity- and inflation-adjusted prices13 with cocaine seizures in selected European countries suggests a certain sensitivity of prices - notably at the retail level - to success in interdiction, as measured by seizure totals. In 2006, European seizures peaked, along with the purity- and inflation-adjusted retail price in France, Germany and the United Kingdom. This was due to a change in purity in some cases and a change in bulk price in other cases. Since 2006, the purity- and inflation-adjusted retail price declined, in line with sei-zure totals. One possible explanation for the correlation between the trends in price and seizures could be related to the effect of law enforcement activities: the stronger the effect of law enforcement, the higher are the amounts seized and the associated risk of trafficking which take the price to a higher level.14
12 Weighted average of 18 European countries, based on ARQ, data from Europol and UNODC estimates; see UNODC, World Drug Report 2009.
13 UNODC estimates based on reported prices and purities.14 In contrast, over the period 2000-2006, rising seizures in Europe
Purity-adjusted and non-adjusted cocaine retail and wholesale prices in US dollars, 2008 Fig. 143: (log-log scale)
Note: On a linear scale, the slope of the line of best fit (through the origin) for purity-adjusted prices is 2.94. This means that, overall, there is a markup in price of 194% from wholesale to retail level.Source: UNODC ARQ
y = 2.94x
y = x
1
10
100
1,000
1 10 100 1,000
Wholesale price, US dollars per gram (log scale)
Ret
ail p
rice
, US
do
llars
per
gra
m, (
log
sca
le)
Latin America and Caribbean, unadjusted (purity not available)
Other countries, purity adjusted
Other countries, unadjusted,purity available
Other countries, unadjusted, purity not available
Line of best fit (adjusted prices)
Line of nil markup
Cocaine prices and purities in the Fig. 144: United States, 2006-2009 (STRIDE*)
*STRIDE is a database of drug exhibits maintained by the US Drug Enforcement Administration. The values reported here represent aver-ages of all cocaine purchases in the database. Although not collected as a representative sample of the US market, STRIDE data reflect the best information available available on changes in cocaine price and purity in the US market.
Source: National Drug Threat Assessment 2010, United States Department of Justice
$198
$174
$115
46%45%
61%
$0
$50
$100
$150
$200
$250
Jan-
Mar
06
Jul-S
ep 0
6
Jan-
Mar
07
Jul-S
ep 0
7
Jan-
Mar
08
Jul-S
ep 0
8
Jan-
Mar
09
Jul-S
ep 0
9
Mea
n p
rice
per
pu
re g
ram
(U
S d
olla
rs)
0
10
20
30
40
50
60
70
80
Mea
n p
uri
ty (
per
cen
tag
e)
Mean price per pure gram (left axis)
Mean purity (right axis)
172
World Drug Report 2010
went hand in hand with falling cocaine prices (weighted average for 18 European countries, not adjusted for purity), suggesting that seizures were reflecting the rising supply of cocaine reaching the European market.
-
50
100
150
200
250
300
350
400
2002 2003 2004 2005 2006 2007 2008
Pric
e p
er p
ure
gra
m, 2
008
Euro
-
20
40
60
80
100
120
140
Seiz
ure
s (t
on
s)
Total cocaine seizures inSpain, France, Germany, UK
Cocaine seizures -rest of Europe
Spain, wholesale price
France, retail price France, wholesale price Germany, retail price
Germany, wholesale price UK, retail price UK, wholesale price
Purity- and inflation-adjusted cocaine prices in selected European countries, in comparison Fig. 145: with cocaine seizures
Note: Purity-adjusted prices are UNODC estimates based on reported prices and purities Sources: UNODC ARQ, Europol, EMCDDA, UNODC World Drug Report 2009
2. Drug statistics and trends Coca/cocaine
173
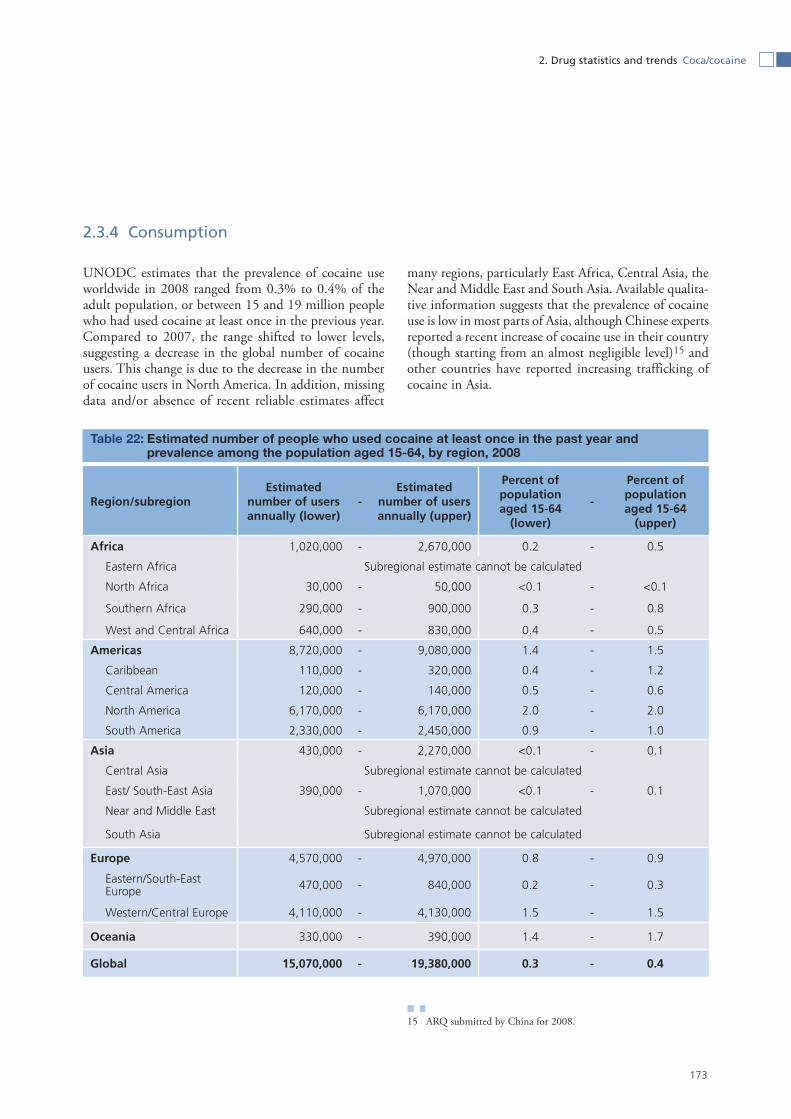
Consumption2.3.4
UNODC estimates that the prevalence of cocaine use worldwide in 2008 ranged from 0.3% to 0.4% of the adult population, or between 15 and 19 million people who had used cocaine at least once in the previous year. Compared to 2007, the range shifted to lower levels, suggesting a decrease in the global number of cocaine users. This change is due to the decrease in the number of cocaine users in North America. In addition, missing data and/or absence of recent reliable estimates affect
many regions, particularly East Africa, Central Asia, the Near and Middle East and South Asia. Available qualita-tive information suggests that the prevalence of cocaine use is low in most parts of Asia, although Chinese experts reported a recent increase of cocaine use in their country (though starting from an almost negligible level)15 and other countries have reported increasing trafficking of cocaine in Asia.
15 ARQ submitted by China for 2008.
Estimated number of people who used cocaine at least once in the past year and Table 22: prevalence among the population aged 15-64, by region, 2008
Region/subregionEstimated
number of users annually (lower)
-Estimated
number of users annually (upper)
Percent of population aged 15-64
(lower)
-
Percent of population aged 15-64
(upper)
Africa 1,020,000 - 2,670,000 0.2 - 0.5
Eastern Africa Subregional estimate cannot be calculated
North Africa 30,000 - 50,000 <0.1 - <0.1
Southern Africa 290,000 - 900,000 0.3 - 0.8
West and Central Africa 640,000 - 830,000 0.4 - 0.5
Americas 8,720,000 - 9,080,000 1.4 - 1.5
Caribbean 110,000 - 320,000 0.4 - 1.2
Central America 120,000 - 140,000 0.5 - 0.6
North America 6,170,000 - 6,170,000 2.0 - 2.0
South America 2,330,000 - 2,450,000 0.9 - 1.0
Asia 430,000 - 2,270,000 <0.1 - 0.1
Central Asia Subregional estimate cannot be calculated
East/ South-East Asia 390,000 - 1,070,000 <0.1 - 0.1
Near and Middle East Subregional estimate cannot be calculated
South Asia Subregional estimate cannot be calculated
Europe 4,570,000 - 4,970,000 0.8 - 0.9
Eastern/South-East Europe 470,000 - 840,000 0.2 - 0.3
Western/Central Europe 4,110,000 - 4,130,000 1.5 - 1.5
Oceania 330,000 - 390,000 1.4 - 1.7
Global 15,070,000 - 19,380,000 0.3 - 0.4

174
World Drug Report 2010
Global trend in the perception of cocaine use: unweighted average of trends as reported Fig. 148: by national experts*
* The graph measures the trend of the number of countries reporting an increase or decrease in drug use (not the trend in number of drug users).
Source: UNODC ARQ
2007
2008
10
12
14
16
18
20
22
24
Nu
mb
er o
f d
rug
use
rs in
mili
on
s
World annual cocaine usersFig. 146:
Source: UNODC ARQ
Cocaine use: lower and upper range Fig. 147: of numbers and annual prevalence globally and by region
0
1
2
3
0 0 0 0 0 0Low
er/
Up
per
Pre
vale
nce
Ran
ge
(%)
0
5
10
15
20
25
0 0 0 0 0 0
Low
er/
Up
per
Pre
vale
nce
Ran
ge
(in
Mill
ion
s)
0
2
4
6
8
10
1998(54)
1999(63)
2000(49)
2001(65)
2002(77)
2003(79)
2004(88)
2005(82)
2006(75)
2007(80)
2008(73)
Year (Member State Expert Responses)
Cu
mu
lati
ve u
nw
eig
hte
d a
vera
ge
of
per
ceiv
ed
tren
ds
in c
oca
ine
use
as
rep
ort
ed b
y co
un
trie
sAverage increase over past year
Baseline (if all countries hadperceived 'some' increase)
Glo
bal
Oce
ania
Euro
pe
Am
eric
as
Asi
a
Afr
ica
Glo
bal
Oce
ania
Euro
pe
Am
eric
as
Asi
a
Afr
ica

175
2. Drug statistics and trends Coca/cocaine
North America, the largest cocaine market, is shrinking
The highest prevalence of cocaine use remains in North America, at 2% of the adult population aged 15 to 64. In the United States, many indicators show a downward trend in cocaine use over the past years, which mirrors a decreasing trend in cocaine production in Colombia, the source country of the cocaine reaching the United States, as well as increased difficulties faced by the Mex-
ican drug cartels to have cocaine shipped from Colom-bia via Mexico into the United States. Data from 2008 confirm the decreasing trend both in the adult and young populations. There has been a significant reduc-tion in the use of cocaine and crack among the popula-tion aged 12 and older. The annual prevalence of cocaine use declined to 2.1% in 2008 from 2.3% in 2007. The perceived easy availability of cocaine among youth aged 12 to 17 also decreased significantly, from 25% in 2007 to 22.1% in 2008.16
16 Substance Abuse and Mental Health Services Administration Results from the 2008 National Survey on Drug Use and Health, National Findings, Office of Applied Studies (OAS), SAMHSA, US Depart-ment of Health and Human Services, September 2009.
United States: Annual prevalence of Fig. 149: cocaine use among the population aged 12 and older
Source: Substance Abuse and Mental Health Services Adminis-tration, Results from the 2008 National Survey on Drug Use and Health, National Findings, Office of Applied Studies (OAS), US Department of Health and Human Services
2.5 2.5 2.4 2.32.5
2.32.1
0.7 0.6 0.5 0.6 0.6 0.60.4
0
0.5
1
1.5
2
2.5
3
2002 2003 2004 2005 2006 2007 2008
An
nau
l pre
vale
nce
(%
)
Cocaine Crack
Annual cocaine users in the AmericasFig. 150:
Source: UNODC ARQ
2007
2008
8
8.2
8.4
8.6
8.8
9
9.2
9.4
9.6
9.8
10
Nu
mb
er o
f d
rug
use
rs in
mili
on
s
United States: annual prevalence of cocaine use among high school students, 1991-2009Fig. 151: Source: National Institute on Drug Abuse, Monitoring the Future, Overview of key findings in 2009, Bethesda, Maryland, USA, 2009
1.11.5
1.72.1
2.63 3.1
2.7 2.6 2.52.3 2.2
22.2
2 21.8
1.6
2.2
2.8
3.5
4.2
4.7 4.74.9
4.4
3.64
3.33.7
3.53.2
3.43
2.7
3.53.1
3.33.6
4
4.9
5.55.7
6.2
54.8
54.8
5.35.1
5.7
5.2
4.4
3.4
2.82.11.9
0
1
2
3
4
5
6
7
1991 1993 1995 1997 1999 2001 2003 2005 2007 2009
An
nu
al p
reva
len
ce o
f co
cain
e u
se (
%)
8th grade 10th grade 12th grade
176
World Drug Report 2010
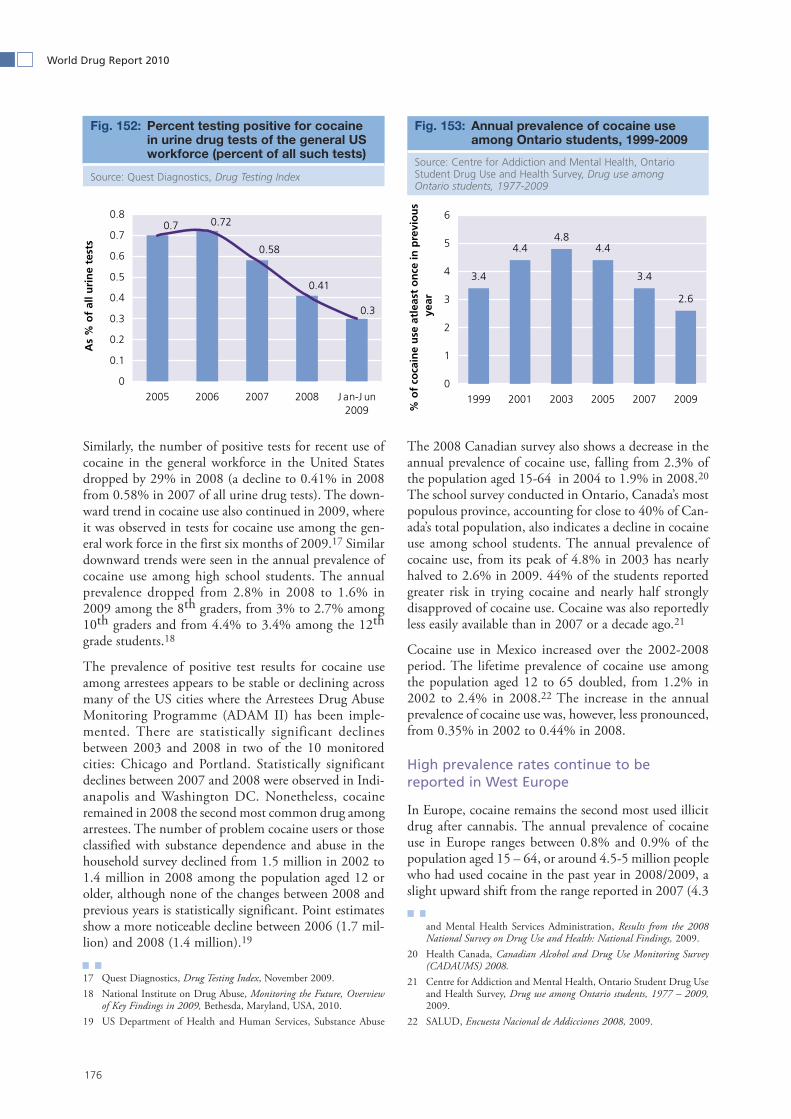
Similarly, the number of positive tests for recent use of cocaine in the general workforce in the United States dropped by 29% in 2008 (a decline to 0.41% in 2008 from 0.58% in 2007 of all urine drug tests). The down-ward trend in cocaine use also continued in 2009, where it was observed in tests for cocaine use among the gen-eral work force in the first six months of 2009.17 Similar downward trends were seen in the annual prevalence of cocaine use among high school students. The annual prevalence dropped from 2.8% in 2008 to 1.6% in 2009 among the 8th graders, from 3% to 2.7% among 10th graders and from 4.4% to 3.4% among the 12th grade students.18
The prevalence of positive test results for cocaine use among arrestees appears to be stable or declining across many of the US cities where the Arrestees Drug Abuse Monitoring Programme (ADAM II) has been imple-mented. There are statistically significant declines between 2003 and 2008 in two of the 10 monitored cities: Chicago and Portland. Statistically significant declines between 2007 and 2008 were observed in Indi-anapolis and Washington DC. Nonetheless, cocaine remained in 2008 the second most common drug among arrestees. The number of problem cocaine users or those classified with substance dependence and abuse in the household survey declined from 1.5 million in 2002 to 1.4 million in 2008 among the population aged 12 or older, although none of the changes between 2008 and previous years is statistically significant. Point estimates show a more noticeable decline between 2006 (1.7 mil-lion) and 2008 (1.4 million).19
17 Quest Diagnostics, Drug Testing Index, November 2009.18 National Institute on Drug Abuse, Monitoring the Future, Overview
of Key Findings in 2009, Bethesda, Maryland, USA, 2010.19 US Department of Health and Human Services, Substance Abuse
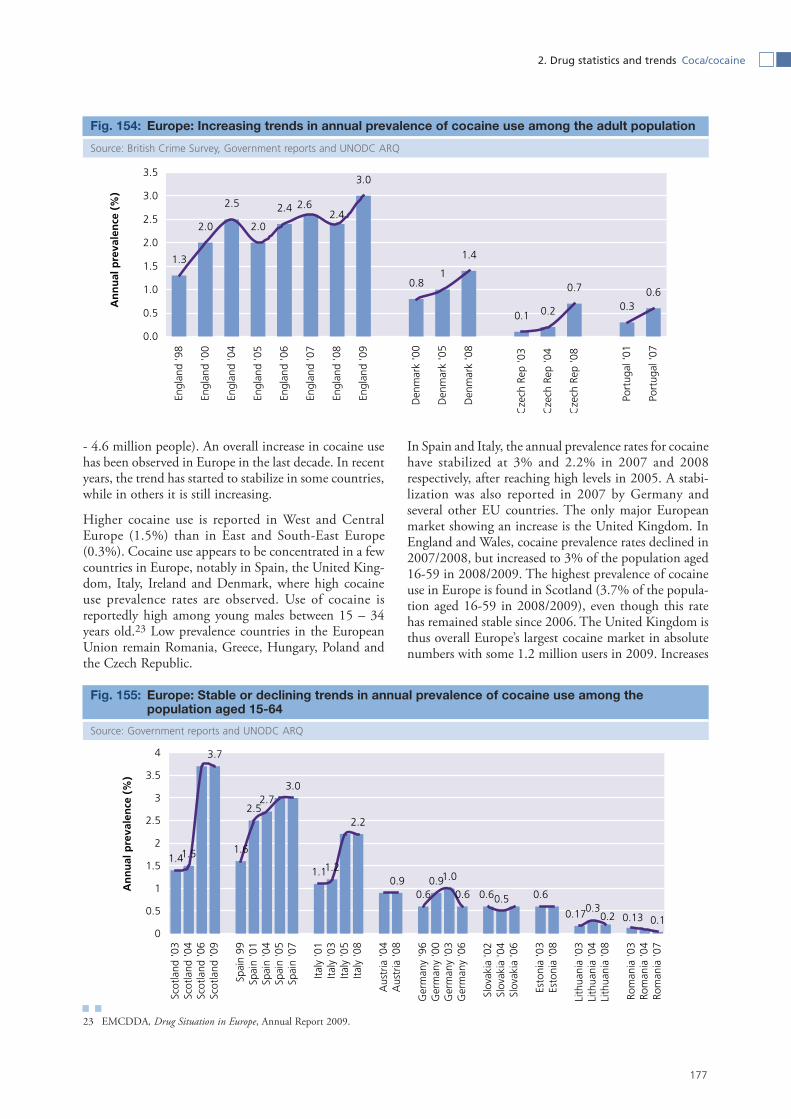
The 2008 Canadian survey also shows a decrease in the annual prevalence of cocaine use, falling from 2.3% of the population aged 15-64 in 2004 to 1.9% in 2008.20 The school survey conducted in Ontario, Canada’s most populous province, accounting for close to 40% of Can-ada’s total population, also indicates a decline in cocaine use among school students. The annual prevalence of cocaine use, from its peak of 4.8% in 2003 has nearly halved to 2.6% in 2009. 44% of the students reported greater risk in trying cocaine and nearly half strongly disapproved of cocaine use. Cocaine was also reportedly less easily available than in 2007 or a decade ago.21
Cocaine use in Mexico increased over the 2002-2008 period. The lifetime prevalence of cocaine use among the population aged 12 to 65 doubled, from 1.2% in 2002 to 2.4% in 2008.22 The increase in the annual prevalence of cocaine use was, however, less pronounced, from 0.35% in 2002 to 0.44% in 2008.
High prevalence rates continue to be reported in West Europe
In Europe, cocaine remains the second most used illicit drug after cannabis. The annual prevalence of cocaine use in Europe ranges between 0.8% and 0.9% of the population aged 15 – 64, or around 4.5-5 million people who had used cocaine in the past year in 2008/2009, a slight upward shift from the range reported in 2007 (4.3
and Mental Health Services Administration, Results from the 2008 National Survey on Drug Use and Health: National Findings, 2009.
20 Health Canada, Canadian Alcohol and Drug Use Monitoring Survey (CADAUMS) 2008.
21 Centre for Addiction and Mental Health, Ontario Student Drug Use and Health Survey, Drug use among Ontario students, 1977 – 2009, 2009.
22 SALUD, Encuesta Nacional de Addicciones 2008, 2009.
Percent testing positive for cocaine Fig. 152: in urine drug tests of the general US workforce (percent of all such tests)
Source: Quest Diagnostics, Drug Testing Index
0.7 0.72
0.58
0.41
0.3
0
0.1
0.2
0.3
0.4
0.5
0.6
0.7
0.8
2005 2006 2007 2008 J an-J un2009
As
% o
f al
l uri
ne
test
s
Annual prevalence of cocaine use Fig. 153: among Ontario students, 1999-2009
Source: Centre for Addiction and Mental Health, Ontario Student Drug Use and Health Survey, Drug use among Ontario students, 1977-2009
3.4
4.44.8
4.4
3.4
2.6
0
1
2
3
4
5
6
1999 2001 2003 2005 2007 2009%
of
coca
ine
use
atl
east
on
ce in
pre
vio
us
year
177
2. Drug statistics and trends Coca/cocaine
- 4.6 million people). An overall increase in cocaine use has been observed in Europe in the last decade. In recent years, the trend has started to stabilize in some countries, while in others it is still increasing.
Higher cocaine use is reported in West and Central Europe (1.5%) than in East and South-East Europe (0.3%). Cocaine use appears to be concentrated in a few countries in Europe, notably in Spain, the United King-dom, Italy, Ireland and Denmark, where high cocaine use prevalence rates are observed. Use of cocaine is reportedly high among young males between 15 – 34 years old.23 Low prevalence countries in the European Union remain Romania, Greece, Hungary, Poland and the Czech Republic.
23 EMCDDA, Drug Situation in Europe, Annual Report 2009.
In Spain and Italy, the annual prevalence rates for cocaine have stabilized at 3% and 2.2% in 2007 and 2008 respectively, after reaching high levels in 2005. A stabi-lization was also reported in 2007 by Germany and several other EU countries. The only major European market showing an increase is the United Kingdom. In England and Wales, cocaine prevalence rates declined in 2007/2008, but increased to 3% of the population aged 16-59 in 2008/2009. The highest prevalence of cocaine use in Europe is found in Scotland (3.7% of the popula-tion aged 16-59 in 2008/2009), even though this rate has remained stable since 2006. The United Kingdom is thus overall Europe’s largest cocaine market in absolute numbers with some 1.2 million users in 2009. Increases
Europe: Increasing trends in annual prevalence of cocaine use among the adult population Fig. 154:
Source: British Crime Survey, Government reports and UNODC ARQ
1.3
2.0
2.5
2.0
2.4
3.0
0.81
1.4
0.1 0.2
0.7
0.30.6
2.62.4
0.0
0.5
1.0
1.5
2.0
2.5
3.0
3.5En
glan
d '9
8
Engl
and
'00
Engl
and
'04
Engl
and
'05
Engl
and
'06
Engl
and
'07
Engl
and
'08
Engl
and
'09
Den
mar
k '0
0
Den
mar
k '0
5
Den
mar
k '0
8
Cze
ch R
ep '0
3
Cze
ch R
ep '0
4
Cze
ch R
ep '0
8
Port
ugal
'01
Port
ugal
'07
An
nu
al p
reva
len
ce (
%)
Europe: Stable or declining trends in annual prevalence of cocaine use among the Fig. 155: population aged 15-64
Source: Government reports and UNODC ARQ
1.41.5
3.7
1.6
2.52.7
3.0
1.11.2
2.2
0.90.6
0.91.0
0.6 0.5 0.60.3
0.6
0.13 0.10.20.17
0
0.5
1
1.5
2
2.5
3
3.5
4
Scot
land
'03
Scot
land
'04
Scot
land
'06
Scot
land
'09
Spai
n 99
Spai
n '0
1Sp
ain
'04
Spai
n '0
5Sp
ain
'07
Italy
'01
Italy
'03
Italy
'05
Italy
'08
Aus
tria
'04
Aus
tria
'08
Ger
man
y '9
6G
erm
any
'00
Ger
man
y '0
3G
erm
any
'06
Slov
akia
'02
Slov
akia
'04
Slov
akia
'06
Esto
nia
'03
Esto
nia
'08
Lith
uani
a '0
3Li
thua
nia
'04
Lith
uani
a '0
8
Rom
ania
'03
Rom
ania
'04
Rom
ania
'07
An
nu
al p
reva
len
ce (
%)

178
World Drug Report 2010
in the annual prevalence rate were also reported in Alba-nia, the Czech Republic and Denmark over the last period. Among the six European countries that reported updated information on cocaine use for 2008, only Lithuania registered a decrease in the adult prevalence, from 0.3% in 2004 to 0.2% in 2008.
In the United Kingdom, cocaine has been a problem drug for some time. Since 2000/2001, there has been a large increase in reported episodes of non-fatal hospital admissions for cocaine poisoning in England. Since 2004, there has also been an upward trend of cocaine-related deaths, which accounted for 14% of all drug-related deaths in 2008.24
The lifetime prevalence of cocaine use among 15-16 year old school students in Europe25 was on average 3%. Cocaine use, however, remains much lower than can-nabis use. In half of the 28 reporting countries, in 2007, the prevalence rate ranged between 1% and 2%. Most of the remaining countries reported prevalence levels between 3% and 4%. France, Italy and the United King-dom reported levels around 5%. Like for most other drugs, lifetime prevalence of cocaine use among males is higher than among females.26
The number of clients entering drug treatment with cocaine as the primary drug has been increasing in Europe for several years. Between 2002 and 2007, the
24 United Kingdom, The Cocaine Trade – Home Affairs Committee, Trends in Cocaine Use, March 2010.
25 European School Survey Project on Alcohol and Other Drugs (ESPAD).
26 Hibell, B., Andersson B., et al. ESPAD: The 2007 ESPAD Report: Substance use among students in 35 European Countries, The Swed-ish Council for Information on Alcohol and other Drugs (CAN), EMCDDA, Council of Europe, Co-operation Group to Combat Drug Abuse and Illicit Trafficking in Drugs (Pompidou Group).
largest proportional increases among new clients were reported by Spain, Ireland and Italy. In those countries the number of all clients entering treatment citing cocaine as their primary drug increased as a proportion from 13% to 19%. The proportion of cocaine clients in treatment is now also increasing in other countries such as Denmark, Ireland, Greece and Portugal.27
Increasing trends of cocaine use in most countries in South America
The annual prevalence of cocaine use in South America is between 0.9% and 1% of the population aged 15-64, thus comparable to cocaine use in Europe, though far lower than in North America. The aggregate annual prevalence of cocaine use in Central America ranges between 0.5% and 0.6%, and in the Caribbean, from 0.4% to 1.2%. In contrast to North America, national experts in South America continue to report an increas-ing trend in cocaine use.
Increases in cocaine use in recent years were reported by the Bolivarian Republic of Venezuela, Ecuador, Brazil, Argentina and Uruguay, as well as countries in Central America (Guatemala and Honduras) and the Caribbean (Jamaica and Haiti). Compared to the previous year, new quantitative information for 2008 was available only from two countries: Chile, where an increase in the annual prevalence among the adult population aged 15-64 was observed (from 1.7% in 2006 to 2.4% in 208) and Suriname, where there was a decrease (from 0.5% in 2002 to 0.3% in 2007).
The highest prevalence of cocaine use in South America
27 EMCDDA, Drug Situation in Europe 2009: Problem cocaine use and treatment demand, 2009.
United Kingdom: Cocaine-related Fig. 156: poisoning episodes and deaths, 2000-2008
Source: United Kingdom, The Cocaine Trade – Home Affairs Committee, Trends in Cocaine Use
833807
641
520
360317
262
54
176 190 196235
0
100
200
300
400
500
600
700
800
900
2000
/01
2000
1/02
2002
/03
2003
/04
2004
/05
2005
/06
2006
/07
2008
Nu
mb
er o
f ep
iso
des
Non fatal admissions Deaths
South America: Prevalence of cocaine Fig. 157: and pasta base use among students aged 13-17, selected countries
Source: UNODC/CICAD, Informe subregional sobre uso de drogas en poblacion escolarizada, 2009/2010
1.41.1
1.9
3.53.2
1.09
2.7
1.32
0.620.84
1.42
2.82
0
0.5
1
1.5
2
2.5
3
3.5
4
E cuador Bolivia Chile
As
% o
f p
op
ula
tio
nCocaine Coca paste

179
2. Drug statistics and trends Coca/cocaine
was reported from Argentina (2.7%), followed by Chile (2.4%) and Uruguay 1.4%). The annual prevalence of cocaine use in Argentina and Chile are comparable to the prevalence in United States. Brazil and Argentina constitute the biggest cocaine markets in South America in terms of absolute numbers (more than 900,000 and 600,000 users, respectively). According to the school survey conducted by UNODC and CICAD in the South American countries, the highest annual preva-lence of cocaine use among students was in Chile, fol-lowed by Uruguay and Argentina.28 The pasta base or the cocaine base is also frequently abused in South America. However, both for the student and adult pop-ulations, the use of cocaine HCl is generally higher than coca paste. In Chile, the Plurinational State of Bolivia and Peru, there were comparable rates of cocaine and pasta base use among the students surveyed.
Experts are reporting rising cocaine use in Africa
For most parts of Africa, there are no recent or reliable estimates of cocaine use. Nevertheless, the annual preva-lence of cocaine use in Africa is estimated at between 0.2% and 0.5% of the population aged 15 to 64. The upper bound of the estimate fell compared to last year when it was 0.7%. The major reason for this drop is the removal of national estimates which were more than 10 years old. However, experts from Africa report that cocaine use has increased in many parts of the continent, notably West and Central Africa. In South Africa, one of the few countries that have data to substantiate the expert perceptions, treatment demand for cocaine-re-lated problems has shown a strong increase over the past
28 UNODC and CICAD Informe subregional sobre uso de drogas en poblacion escolarizada, 2009/2010.
10 years, where it has increased from 5% of treatment demand in 1998 to 8% in the first half of 2009. How-ever, there has been a declining trend in treatment demand for cocaine since 2008.29
For large parts of Asia and the Near and Middle East, there are no recent or reliable estimates available on cocaine use. In Asia, the annual prevalence of cocaine use is estimated at maximum 0.1%, or between 430,000 and 2.3 million cocaine users. Hong Kong, China is the only territory in Asia reporting new information in 2008, revealing an increase in the estimated annual adult prevalence rate from 0.003% in 2003 to 0.3% in 2008.30 In Hong Kong, China, there are indications of increasing availability and decreasing prices of cocaine since 2004.31 In the school survey conducted in Hong Kong, China in 2008/2009, the lifetime prevalence of cocaine and ‘ecstasy’ use among students was 13.8%, compared to 11.3% in 2004/2005.32
29 Pluddemann A., Parry C., Bhana A., et al, Alcohol and Drug Abuse Trends: January – June 2009 (Phase 26), South African Community Epidemiology Network on Drug Use, November 2009.
30 Data extrapolated from the results of a school survey.31 Narcotics Bureau, Hong Kong Police, Drug Situation Report – Hong
Kong Special Administrative Region of the People’s Republic of China, January 2009.
32 Narcotics Division, Security Bureau, The 2008/2009 Survey of Drug Use among Students, 2010.
South America: annual adult (aged Fig. 158: 15-64) prevalence of cocaine use in selected countries, 2006-2007
Source: UNODC/CICAD, Elementos Orientadores para las Politicas Publicas sobre Drogas en la Subregion: Primer Estudio Comparativo sobre Consumo de Drogas y Factores Asociados en Poblacion de 15 a 64 años, 2008
South Africa: Percent of all treatment Fig. 159: admissions for cocaine, 1997-2009
Source: Pluddemann A., Parry C., Bhana A., et al, Alcohol and Drug Abuse Trends: January-June 2009 (Phase 26), South Afri-can Community Epidemiology Network on Drug Use, Novem-ber 2009
2.67
1.68
1.31
0.66
0.4
0.14
0.110.
3
0.62
0.54
0.36
0.09
0
0.5
1
1.5
2
2.5
3
Arg
entin
a
Uru
guay
Chi
le
Boliv
ia
Peru
Ecua
dor
An
nu
al p
reva
len
ce (
%) Cocaine HCl
Coca Base
0
2
4
6
8
10
12
1997
a19
97b
1998
a19
98b
1999
a19
99b
2000
a20
00b
2001
a20
01b
2002
a20
02b
2003
a20
03b
2004
a20
04b
2005
a20
05b
2006
a20
06b
2007
a20
07b
2008
a20
08b
2009
a
In %
of
all t
reat
men
t


![Coca cultivation survey 2014 July 2015 - unodc.org · Coca cultivation survey 2014 July 2015 Government of Colombia. COLOMBIA Coca cultivation survey 2014 July 2015 ... 2UODQGR *RQ]iOH]](https://static.fdocuments.in/doc/165x107/5bf4f2de09d3f2be5a8cb6b8/coca-cultivation-survey-2014-july-2015-unodc-coca-cultivation-survey-2014.jpg)
