221 EXCHANGE RATES
26
1 453 EXCHANGE RATES 22 22.1 Determination of exchange rates Imagine you have just landed in New Delhi. You have big plans to see the sights, visit museums, try new foods and generally make the most of your time in India. As your plane begins to land, you wonder how much money you will need. As you enter the terminal, you observe that the banks are charging different rates from those back home. Are the banks making big profits at your expense, or did something happen to change the value of the currency while you were travelling? An exchange rate shows the price of one currency in terms of the amount of another. For example, if the pound sterling (the British pound, GBP) is valued at $1.50, then the exchange rate between the pound and the US dollar is 1.5 USD = 1 GBP. This valuation can also be expressed in reverse, as the amount of pounds needed to buy one US dollar. To determine this number, take the reciprocal of the original ratio. In this example, 1 USD/1.5 GBP, or 0.666 pounds would be needed to buy one US dollar. Table 22.1 shows a range of currency values, with the reciprocal values noted. TABLE 22.1 SELECTED EXCHANGE RATES USD EUR GBP INR AUD CAD ZAR NZD JPY SGD RMB 1 USD 1.00000 0.74993 0.64936 44.5798 1.08044 1.00076 7.48278 1.40721 93.0339 1.37308 6.82730 inverse 1.00000 1.33345 1.53997 0.02243 0.9255 0.99924 0.13364 0.71063 0.01075 0.72829 0.14647 1 EUR 1.33345 1.00000 0.86590 59.4450 1.44071 1.33446 9.97794 1.87644 124.056 1.83094 9.10388 inverse 0.74993 1.00000 1.15487 0.01682 0.69410 0.74937 0.10022 0.53292 0.00806 0.54617 0.10984 1 GBP 1.53997 1.15487 1.00000 68.6515 1.66384 1.54113 11.5233 2.16706 143.269 2.11450 10.5138 inverse 0.64936 0.86590 1.00000 0.01457 0.60102 0.64887 0.08678 0.46146 0.00698 0.47292 0.09511 Learning outcomes " Gzrnckp"vjcv"vjg"xcnwg"qh"cp"gzejcpig"tcvg"kp"c"hnqcvkpi"u{uvgo"ku"fgvgtokpgf"d{"vjg" fgocpf"hqt."cpf"uwrrn{"qh."c"ewttgpe{0 " Fkuvkpiwkuj"dgvyggp"c"fgrtgekcvkqp"qh"vjg"ewttgpe{"cpf"cp"crrtgekcvkqp"qh"vjg" ewttgpe{0 " Ftcy"c"fkcitco"vq"ujqy"fgvgtokpcvkqp"qh"gzejcpig"tcvgu"kp"c"hnqcvkpi"gzejcpig" tcvg"u{uvgo0 " *JN"qpn{+"Ecnewncvg"vjg"xcnwg"qh"qpg"ewttgpe{"kp"vgtou"qh"cpqvjgt"ewttgpe{0 An exchange rate is the value of one country’s currency expressed in terms of the amount of another country’s currency needed to buy it (e.g. the amount of euro per dollar). How much money should I exchange to cover holiday expenses? Should I change cash, or withdraw money using my credit card?
Transcript of 221 EXCHANGE RATES

1
453
EXCHANGE RATES22
22.1 Determination of exchange rates
Imagine you have just landed in New Delhi. You have big plans to see the sights, visit museums, try new foods and generally make the most of your time in India. As your plane begins to land, you wonder how much money you will need. As you enter the terminal, you observe that the banks are charging different rates from those back home. Are the banks making big profits at your expense, or did something happen to change the value of the currency while you were travelling?
An exchange rate shows the price of one currency in terms of the amount of another. For example, if the pound sterling (the British pound, GBP) is valued at $1.50, then the exchange rate between the pound and the US dollar is 1.5 USD = 1 GBP.
This valuation can also be expressed in reverse, as the amount of pounds needed to buy one US dollar. To determine this number, take the reciprocal of the original ratio. In this example, 1 USD/1.5 GBP, or 0.666 pounds would be needed to buy one US dollar. Table 22.1 shows a range of currency values, with the reciprocal values noted.
TABLE 22.1 SELECTED EXCHANGE RATES
USD EUR GBP INR AUD CAD ZAR NZD JPY SGD RMB
1 USD 1.00000 0.74993 0.64936 44.5798 1.08044 1.00076 7.48278 1.40721 93.0339 1.37308 6.82730
inverse 1.00000 1.33345 1.53997 0.02243 0.9255 0.99924 0.13364 0.71063 0.01075 0.72829 0.14647
1 EUR 1.33345 1.00000 0.86590 59.4450 1.44071 1.33446 9.97794 1.87644 124.056 1.83094 9.10388
inverse 0.74993 1.00000 1.15487 0.01682 0.69410 0.74937 0.10022 0.53292 0.00806 0.54617 0.10984
1 GBP 1.53997 1.15487 1.00000 68.6515 1.66384 1.54113 11.5233 2.16706 143.269 2.11450 10.5138
inverse 0.64936 0.86590 1.00000 0.01457 0.60102 0.64887 0.08678 0.46146 0.00698 0.47292 0.09511
Learning outcomes� ([SODLQ�WKDW�WKH�YDOXH�RI�DQ�H[FKDQJH�UDWH�LQ�D�IORDWLQJ�V\VWHP�LV�GHWHUPLQHG�E\�WKH�
GHPDQG�IRU��DQG�VXSSO\�RI��D�FXUUHQF\�� 'LVWLQJXLVK�EHWZHHQ�D�GHSUHFLDWLRQ�RI�WKH�FXUUHQF\�DQG�DQ�DSSUHFLDWLRQ�RI�WKH�
FXUUHQF\�� 'UDZ�D�GLDJUDP�WR�VKRZ�GHWHUPLQDWLRQ�RI�H[FKDQJH�UDWHV�LQ�D�IORDWLQJ�H[FKDQJH�
UDWH�V\VWHP�� �+/�RQO\��&DOFXODWH�WKH�YDOXH�RI�RQH�FXUUHQF\�LQ�WHUPV�RI�DQRWKHU�FXUUHQF\�
An exchange rate is the value of one country ’s currency expressed in terms of the amount of another country ’s currency needed to buy it (e.g. the amount of euro per dollar).
How much money should I exchange to cover holiday expenses? Should I change cash, or withdraw money using my credit card?
M22_ECON_SB_0673_CH22.indd 453 30/07/2015 14:21

EXCHANGE RATES
454
22
EXERCISES
1
2
3
4
According to Table 22.1, what are the current values of the Indian rupee (INR) in terms of the US dollar (USD), the euro (EUR) and the pound sterling (GBP)?
What are the inverse values (i.e. the values of USD, euro, and GBP in terms of INR)?
Explain how you would calculate these numbers.
Assuming there were no transaction fees, how much in pounds (GBP) would it cost for a British tourist to buy a South African bottle of wine for 350 rand (ZAR)?
The foreign exchange marketCurrency as a free market commodity is relatively new. At the close of World War II, in an attempt to organize the post-war global financial system, the Allied nations created a fixed-rate system of foreign exchange. In this system, the value of currency was pegged in relation to other currencies, and that rate was backed up by the country’s gold reserves. Since the 1970s, countries have increasingly freed their currencies to float with supply and demand.
The foreign exchange market, also known as the forex or currency market, is said to be as close to a perfectly competitive market as there is. Prices are widely known because of easy telecommunication. Products are homogeneous. As a market, it is certainly unusual in many respects. There are millions of buyers and sellers on any given day. It spans the globe and operates 24 hours a day except for weekends. Prices are updated constantly through the use of rapid telecommunications and the internet. Profit margins tend to be low, and profits tend to be made through volume of sales. The market is enormous. The average daily turnover in global foreign exchange markets is estimated at $3.98 trillion, as of April 2007.
The market has a variety of actors, from the smallest retail currency traders up to the most powerful central banks (Figure 22.1).
forex brokers
speculation/hedge funds
remittancecompanies
retail/individual
investmentbanks and
other banks
central banks
An individual buying currency on the streets of Delhi is probably buying at the retail level, from a small trader who buys from a forex broker. These brokers, at the highest levels, buy and sell currency to nearly all the other actors on the market. The brokers normally make profits from charging an explicit service fee of some fixed or percentage amount. They can also create spread (a gap) between the buying and selling prices, from which they take their profit.
Figure 22.1 Actors in the foreign exchange market.
M22_ECON_SB_0673_CH22.indd 454 30/07/2015 14:21

455
Central banks buy and sell currency to influence the exchange rate, but sometimes have less power over the rate than the brokers themselves. Remittance companies exchange money for foreign workers who are sending money back home, and therefore need it to be converted to their home currency. Investment banks and hedge funds account for a very large share of forex trading, and often do so with pure speculation in mind. In other words, they buy currency with the specific intent of trading it later at a higher value. At its most dynamic, the forex market is highly speculative and subject to wide swings in values, as well as to panic-selling and runs on a currency when the value of one currency suddenly drops.
Floating exchange ratesA floating exchange rate is one where the value of a currency is determined by the demand for and supply of that currency on the foreign exchange market. Currency floats freely when the government does not intervene on the market, and allows the exchange rate to fluctuate.
Figure 22.2 shows the market for the most heavily traded currency, the US dollar, in terms of the second most heavily traded one, the euro. The dollars bought and sold are priced in terms of the euro. Just as with the demand for any commodity, the demand is downward sloping and the supply is upward sloping. Those demanding dollars are presumably holding euros and seeking to purchase dollars, whereas the suppliers of dollars are holding dollars and are willing to exchange them for euros. Where the supply and demand intersect is the equilibrium exchange rate. Using the rate noted in Table 22.1, this would make the rate 0.749 euro (75 euro cents) for every dollar. (Note that Figure 22.2 has been slightly truncated in order to magnify the area of equilibrium.)
pric
e of
USD
in te
rms o
f EU
R
quantity of USD
D
S
0.749
0 QE
This exchange can also be viewed from the perspective of the market for euros. As noted in Table 22.1, the reciprocal of the euro value of dollars is the dollar value of euros. In this case, dollars are purchased for euros at the prevalent rate of 0.749 euros per dollar. Conversely, euros purchased with dollars will be bought at a rate of 1.33 dollars per euro.
Appreciation and depreciationWhen floating exchange rates change, the increase in the value of one currency against another is called appreciation. It follows that the relative decrease in value of the other currency is called depreciation. Using our dollars and euros example, let’s assume that one
A floating exchange rate is one where the price of a currency is determined by the free market interaction of supply and demand for the currency.
To learn more about currency, visit www.pearsonhotlinks.com, enter the title or ISBN of this book and select weblink 22.1.
Figure 22.2 Floating currency equilibrium.
The most heavily traded currencies in 2009 were:
t� 64�EPMMBS�64%
t� &VSPQFBO�FVSP�FVSP
t� +BQBOFTF�ZFO� +1:
t� #SJUJTI�QPVOE�(#1
t� 4XJTT�GSBOD�$)'
t� $BOBEJBO�EPMMBS�$"%
t� "VTUSBMJBO�EPMMBS�"6%
t� 4PVUI�"GSJDBO�SBOE�(ZAR)
M22_ECON_SB_0673_CH22.indd 455 30/07/2015 14:21

EXCHANGE RATES
456
22
of the factors influencing the demand for dollars diminishes, reducing overall demand for dollars. As with all other demand curves, the demand for dollars shifts to the left to D1 (Figure 22.3).
pric
e of
USD
in te
rms o
f EU
R
quantity of USD
S
DD1
0.749
0.66
0 Q1 QE
At the new euros-for-dollars exchange rate, it takes 0.66 euros to buy a dollar, rather cheaper than before. The price of dollars, in euro terms, has decreased, and we can say that the dollar has depreciated against the euro. In turn, this sets the dollars-for-euros exchange rate at approximately 1.50 dollars, rather higher than before. Correspondingly, we can say that the euro has appreciated against the dollar.
In Figure 22.4, the dollar depreciates for a different reason – an increase in supply. The holders of dollars are putting more on the foreign exchange market to be sold. Thus, supply shifts to the right to S1, and the equilibrium price falls from 0.749 euros per dollar to 0.66 euros per dollar.
pric
e of
USD
in te
rms o
f EU
R
quantity of USD
S
D
S10.749
0.66
0 Q1QE
For an exchange rate to appreciate (rise in value), either demand must increase or supply must decrease. In the first instance, an increase in demand for the currency shifts demand to the right, raising the amount of the opposite currency that is needed to buy each unit of this currency. Figure 22.5 shows an increase of demand for dollars, shifting demand out to the right. At the new equilibrium, more quantity (Q1) of dollars is traded, and the price has risen from 0.749 euros per dollar to 0.80 euros per dollar.
%FQSFDJBUJPO�JT�B�decrease in the free market exchange rate of a currency.
Appreciation is an increase in the free market value of a currency.
Figure 22.3 %FQSFDJBUJPO��EFNBOE�decrease.
Figure 22.4 %FQSFDJBUJPO��TVQQMZ�JODSFBTF�
M22_ECON_SB_0673_CH22.indd 456 30/07/2015 14:21

457
pric
e of
USD
in te
rms o
f EU
R
quantity of USD
S
D
D1
0.749
0
0.80
Q1QE
The other cause of appreciation is a decrease in supply, causing the price of the currency to rise. In Figure 22.6, the supply of dollars contracts, reducing the amount of dollars traded (Q1 ) and increasing the price in euros paid for each dollar. The exchange rate for dollars appreciates from 0.749 to 0.80 euros per dollar.
pric
e of
USD
in te
rms o
f EU
R
quantity of USD
S
D
S1
0.749
0
0.80
Q1 QE
22.2 Causes of change in the exchange rate
Figure 22.5 Appreciation: demand increase.
Figure 22.6 Appreciation: supply decrease.
Learning outcomes� 'HVFULEH�WKH�IDFWRUV�WKDW�OHDG�WR�FKDQJHV�LQ�FXUUHQF\�GHPDQG�DQG�VXSSO\��LQFOXGLQJ�
IRUHLJQ�GHPDQG�IRU�D�FRXQWU\ďV�H[SRUWV��GRPHVWLF�GHPDQG�IRU�LPSRUWV��UHODWLYH�LQWHUHVW�UDWHV��UHODWLYH�LQIODWLRQ�UDWHV��LQYHVWPHQW�IURP�RYHUVHDV�LQ�D�FRXQWU\ďV�ILUPV��IRUHLJQ�GLUHFW�LQYHVWPHQW�DQG�SRUWIROLR�LQYHVWPHQW��DQG�VSHFXODWLRQ�
� 'UDZ�GLDJUDPV�WR�VKRZ�FKDQJHV�LQ�WKH�GHPDQG�IRU��DQG�VXSSO\�RI��D�FXUUHQF\�
M22_ECON_SB_0673_CH22.indd 457 30/07/2015 14:21

EXCHANGE RATES
458
22
Determinants of exchange rateLike the supply and demand for any good, the non-price factors that shift supply and demand are called the determinants. Some of the principal determinants of exchange rates are discussed below.
Demand for goods and servicesThe relative demand for imports and exports can directly influence the purchase of currencies, and so alter the exchange rate. When demand for a country’s exports increases, it increases demand for the currency itself. To buy the exports, the importers first need to buy the exporting country’s currency to pay for them. To import Canadian maple syrup, for example, the importer first needs to buy Canadian dollars.
Thus, demand for a country’s currency is partially derived from the relative demand for its exports compared to that of the trading country. For example, an increase in European demand for Thai goods should increase the demand for the Thai baht, and cause an appreciation of the baht in euro terms. Correspondingly, it would result in a depreciation of the euro versus the Thai baht.
Furthermore, the interaction of imports and exports with the exchange rate can be self-correcting. As the Thai baht climbs, the price of Thai goods in euro terms rises and makes them less attractive. European consumers, if sensitive to the price change caused by the new exchange rate, may reduce overall Thai imports and lower demand for baht again. Thus, extreme levels of appreciation and depreciation can be balanced out by the export price and demand changes that are the result. This can have implications for the balance of payments and specifically the current account (Chapter 23).
Demand for foreign direct investmentForeign investors may find it necessary to buy a foreign currency to make particular kinds of investment in that country. To make any kind of significant foreign direct investment (FDI) by opening a branch location, starting a new firm, or creating a joint venture in another country, requires that country’s currency to buy capital equipment, rent space, pay salaries and purchase materials. This suggests that increases in FDI appreciate a currency, and the loss of FDI depreciates it.
Demand for financial investments and capital flowsFinancial investments such as the buying of foreign company shares, or interest-earning deposits in a foreign bank, are also likely to require purchase of the home currency. In other words, demand for a country’s financial investments appreciates the currency.
In particular, a change in a country’s interest rate can attract or repel foreign financial investors. Should the interest rates offered to depositors increase, individuals and banks would be attracted to the higher relative interest rate and buy the local currency to deposit in the bank. This event would be called a capital inflow, and would appreciate the currency, as long as the difference in interest rates exceeds whatever exchange fees are paid in the transaction.
The reverse could also be true: a decrease in relative interest rates at home could cause some depositors to flee domestic banks and buy other currencies in search of a better rate of return. This would, in turn, depreciate the value of the currency. In other words, if the Bank of Turkey were to raise interest rates relative to other countries, some investors would buy Turkish lire and deposit the amount to earn higher returns. This capital inflow would raise the value of the Turkish lira and relatively depreciate other currencies.
M22_ECON_SB_0673_CH22.indd 458 30/07/2015 14:21

459
Relative inflation ratesAs the prices of one country rise faster than those of another, its exports become more expensive and, therefore, less desirable. At the same time, imports will be relatively cheaper than before and more attractive. If Paraguay’s prices were to soar relative to its neighbour Argentina, the demand for Paraguayan exports and the corresponding demand for the Paraguayan guarani would decrease. And Paraguay would seek out more imports from Argentina, increasing demand for the Argentine peso. This higher relative inflation would also hurt the trade balance (Chapter 23). Simply put, higher inflation tends to depreciate a currency, and lower relative inflation tends to appreciate it.
SpeculationThe holders of foreign currencies can also speculate on future values. As with the buying and selling of shares, speculators may buy a currency hoping it will appreciate, sell it when they believe it has reached peak value, and take the resulting profits. The exact portion of forex trading devoted to speculation is unknown, but it is believed to make up the majority of a market that was worth 4 trillion USD in 2007, and expected to rise.
The actions of speculators can cause large swings in the value of the currency, particularly downward during a run. For this reason, forex speculation has been criticized for worsening currency crises like the Asian financial crisis of 1997. Defenders of currency speculation have pointed out that speculators provide a service because they have an interest in rationally assessing a currency’s true value. Speculators, they argue, merely accelerate a process that would otherwise take much longer.
With this in mind, it is important to remember that speculators not only make their bets on a variety of purely economic factors such as the balance of payments situation and relative budget deficits, but also on political events and other less tangible factors.
Central bank intervention on the forex marketThe central banks may buy or sell large amounts of foreign exchange with several goals in mind. They may seek to prop up the value of their currency by using foreign currency reserves to buy up their own. They may also sell their own currency if they seek to reduce its value, perhaps to increase the desirability of their exports and reduce the domestic consumption of imports. Indeed, they may also seek an overall balance between the current and capital accounts in the balance of payments.
Most countries’ central banks do this to some extent, and economists call this intervention a managed float system (page 465). In this system, a country may target an acceptable range of exchange rate values and use reserves to keep the currency within that range. In the most extreme cases, the range is narrow and the country is essentially pursuing a fixed exchange rate (page 461).
22.3 Effects of change in the exchange rate
Learning outcomes� (YDOXDWH�WKH�SRVVLEOH�HFRQRPLF�FRQVHTXHQFHV�RI�D�FKDQJH�LQ�WKH�YDOXH�RI�
D�FXUUHQF\��LQFOXGLQJ�WKH�HIIHFWV�RQ�D�FRXQWU\ďV�LQIODWLRQ�UDWH��HPSOR\PHQW��HFRQRPLF�JURZWK�DQG�FXUUHQW�DFFRXQW�EDODQFH�
To access Worksheet 22.1 on exchange rate determinants, please visit www.pearsonbacconline.com and follow the onscreen instructions.
M22_ECON_SB_0673_CH22.indd 459 30/07/2015 14:21

EXCHANGE RATES
460
22
Assuming a generally free-floating exchange rate, a change in the value of a currency can have significant consequences for the country’s economy.
AppreciationAdvantages to appreciationLess expensive imports
The increased value of the currency means that buying imported goods is now relatively less expensive than before. With increased buying power in these terms, a country can enjoy cheaper foreign consumer goods and capital goods. This can help those firms that import raw materials and capital goods, lowering their costs of production. At the same time, increased consumer goods can improve the standard of living and round out the economy in helpful ways. For developing countries, the ability to buy cheaper capital goods and energy resources could be a significant advantage. Where a country relies heavily on imports of any kind, an appreciation of the exchange rate can put downward pressure on inflation.
Competitive pressure on domestic exporters
An indirect effect of the higher exchange rate is that domestic firms exporting to other countries are at a price disadvantage relative to their foreign competitors. As the exchange-rate-adjusted price of their exports rises, they are compelled to seek out new ways of cutting costs and innovating. As a result, the company may find that it is a more robust and energetic competitor should the exchange rate ever return to previous levels.
Disadvantages to appreciationExport levels reduced
The distinction between competitive pressure and competitive disadvantage is blurred, and companies attempting to export at consistently high exchange rates may come to believe that while their import costs are low, it may not compensate for the challenge of selling at the higher exchange rate. As a result, many export industries may find that their overall sales revenues drop considerably. Significant unemployment in these industries can be a consequence.
Greater imports hurt domestic production
Relatively cheap imports may hurt even non-exporting domestic industries. If those industries cannot match the exchange rate discount now available on imported goods, their share of the market and their sales may drop as well. This could also result in unemployment in those industries.
Effect on major economic goalsTo summarize, appreciation reduces inflationary pressure where the demand for imports is relatively inelastic (e.g. energy resources). This may eventually help with economic growth. However, the more immediate impact on growth is to reduce exports and decrease real gross domestic product (GDP). This is likely to reduce employment, especially in exporting industries. Furthermore, the trade balance of exports to imports is likely to move towards a deficit, as exports slow down and cheaper imports increase.
M22_ECON_SB_0673_CH22.indd 460 30/07/2015 14:21

461
DepreciationAdvantages to depreciationExpansion of domestic industries
Foreign consumers view exports as relatively cheap, and are likely to import more. This raises revenues in those exporting companies and could increase employment. However, even non-exporting domestic industries benefit because the increase in the relative price of imported goods makes their domestic products seem cheaper. Therefore, non-exporting domestic industries are also more likely to expand and hire more workers, perhaps lowering domestic unemployment rates.
Disadvantages to depreciationImported inflation
Where countries need to import significant levels of raw materials or resources, a decrease in the exchange rate can bring on a certain amount of imported inflation. In particular, when the country has a relatively inelastic demand for those goods and therefore cannot adjust its expenditures, imports can be a persistent source of inflation, as long as the exchange rate stays high. Therefore, any decision by interventionist governments to devalue the currency should consider this possible result as a realistic consequence.
Effect on major economic goalsTo summarize, appreciation increases inflationary pressure when demand for imports is relatively inelastic (e.g. energy resources). This may slow down economic growth. However, to the degree that a country already offers exports, the reduced price is likely to increase exports and increase real GDP. This should add to employment, especially in export industries. Furthermore, depreciation should improve the trade balance of exports and imports, with increased exports and a decreased demand for relatively more expensive imported goods.
22.4 Government intervention
Fixed exchange ratesIn a fixed exchange rate system, the value of a currency is locked into (pegged) to the value of another currency. The central bank determines this value and enacts massive and constant intervention to maintain the established rate. This can be done by buying and
A fixed exchange rate is one that, through government action, is held to a narrow band of possible prices. Managed rates are those that are manipulated to fall within a wide band of prices.
Learning outcomes� 'HVFULEH�D�IL[HG�H[FKDQJH�UDWH�V\VWHP�LQYROYLQJ�FRPPLWPHQW�WR�D�VLQJOH�IL[HG�UDWH�� 'LVWLQJXLVK�EHWZHHQ�D�GHYDOXDWLRQ�RI�D�FXUUHQF\�DQG�D�UHYDOXDWLRQ�RI�D�FXUUHQF\�� ([SODLQ��XVLQJ�D�GLDJUDP��KRZ�D�IL[HG�H[FKDQJH�UDWH�LV�PDLQWDLQHG�� ([SODLQ�KRZ�D�PDQDJHG�H[FKDQJH�UDWH�RSHUDWHV��ZLWK�UHIHUHQFH�WR�WKH�IDFW�WKDW�
WKHUH�LV�D�SHULRGLF�JRYHUQPHQW�LQWHUYHQWLRQ�WR�LQIOXHQFH�WKH�YDOXH�RI�DQ�H[FKDQJH�UDWH�
� ([DPLQH�WKH�SRVVLEOH�FRQVHTXHQFHV�RI�RYHUYDOXHG�DQG�XQGHUYDOXHG�FXUUHQFLHV�
To learn more about exchange rates, visit www.pearsonhotlinks.com, enter the title or ISBN of this book and select weblink 22.2.
M22_ECON_SB_0673_CH22.indd 461 30/07/2015 14:21

EXCHANGE RATES
462
22
selling currency reserves, as well as making other adjustments to currency and monetary policy.
Let’s imagine that the Argentine central bank decided that the currency (Argentine peso) should be at par with the American dollar, so that 1 Argentine peso = 1 USD. If the equilibrium level happened by chance to be at that rate, no intervention would be required. However, if there were a surge in US beef productivity that lessened demand for Argentine beef exported to the US, then demand for pesos would decrease (Figure 22.7).
pric
e of
pes
o in
term
s of U
SD
quantity of peso
central bank buys pesos or raises interest rates
decreased demand for Argentine beef
supply peso
demand pesoD1
1.0
0.85
0 Q1 QE
If the value of the peso were floating freely, this would decrease the value of pesos priced in dollars to 0.85 USD per Argentine peso. In that event, to maintain the 1 to 1 value of the peso and avoid depreciation, the Argentine central bank could immediately buy up the surplus pesos on the market using their reserve of US dollars. This would shift demand for the peso back to the desired price of 1 peso to 1 USD.
There are two possible directions in which a country could go in the process of maintaining its exchange rate. These are exemplified by Argentina (which, in the early 2000s, sought to maintain an exchange rate that was seen by many as artificially high) and China (which, for many years, has been seen as manipulating its currency to be artificially low). These two cases are examined below.
Government methods to sustain a high fixed exchange rate: ArgentinaOfficial reserves
If Argentina wanted to keep its currency at par with the dollar, despite a tendency for the peso to drop below that value, it could buy up pesos with its reserve of dollars. This tactic alone is probably unsustainable as it can put tremendous pressure on the foreign exchange reserves.
Interest rates
Argentina could also use a tool of monetary policy by increasing interest rates offered by domestic banks. This would offer a higher relative rate of return and attract foreign depositors. Such depositors must buy pesos to get the higher interest rates. The resulting capital inflow would increase the demand for and price of the peso. A disadvantage to using interest rates primarily for this purpose is that it puts significant limitations on the
Figure 22.7 Fixed exchange rates.
M22_ECON_SB_0673_CH22.indd 462 30/07/2015 14:21

463
degree to which monetary policy can be used to manage the domestic money supply and, correspondingly, the levels of domestic employment and inflation.
Exchange controls
Exchange controls are limits imposed by a country on the amount of foreign currency that can be bought by domestic residents. This serves to slow the amount of pesos leaving the country by decreasing the amount available for the purchase of imports, travel purposes, or the purchase of financial assets abroad. Exchange controls thus restrict the supply of pesos on the market and reduce the downward pressure on the exchange rate. While these controls can be effective, they can frustrate domestic consumers and producers who seek opportunities in foreign markets. They can also discourage investors and speculators from buying the currency in the first place.
Import limits
Argentina could also augment the value of the peso by cutting back demand for imports and slowing the demand for foreign currency. This can be done by expenditure reduction, or reduction in aggregate demand (AD) by contractionary fiscal policies. The higher interest rates noted above can also achieve this by lowering consumption and investment. Of course, this policy brings significant trade-offs in the loss of domestic national income and employment. A second method of import limitation would be to impose trade barriers against imported goods. These barriers, discussed at length in Chapter 21, may be effective at reducing demand for foreign currency but can severely limit the market for important imported resources, inspire retaliation among affected countries, and run foul of WTO rules.
EXERCISES
5
6
7
a Using the figure below, identify the exchange rate for pesos in 2001, 2002, 2008 and 2010.
Exchange rate: Argentine peso per USD
peso
/USD
4.0
3.5
3.0
2.5
2.0
1.5
1.0
0.51999 2000 2001 2002 2003 2004 2005 2006 2007 2008 2009 2010
b Explain what appears to have changed between the period 1999–2001 and the period that followed?
List and explain some of the measures Argentina may have taken in 1999–2001.
Make a list of possible stakeholders in this event. Evaluate the effect of the change you identified in exercise 6 on those stakeholders (importers, exporters, etc.).
In 2001, Argentina’s one-to-one peso-to-dollar peg collapsed after fraud, money laundering and capital flight made it impossible for the central bank to maintain the artificially high rate. By 2002, the peso had devalued by 75%, traded on the street at 4 pesos per dollar.
M22_ECON_SB_0673_CH22.indd 463 30/07/2015 14:21

EXCHANGE RATES
464
22
Government methods to sustain a low fixed exchange rate: ChinaOfficial reserves
China can keep its exchange rate low by consistently supplying extra yuan to the market and thus buying up foreign currency in exchange. This must be done carefully as it can lead to an overall increase in the money supply and have an inflationary effect. At the same time, the country must keep foreign reserves on hand, or may use them to selectively buy other foreign capital assets.
Import/export policyLower exchange rates can be a significant export advantage and tend to lower the demand for imported goods. If the promotion of exports is especially successful, it can breed resentment among the importing countries. In this case, China has seen a dramatic rise in protectionist measures taken against it over the years. As a result, there is pressure on China to voluntarily limit its exports, to revalue its currency or to face charges in the WTO.
Interest ratesTo keep the exchange rate low, interest rates must not be allowed to rise too much. Keeping interest rates consistently low could have a stimulative effect on AD and cause inflation.
Exchange controlsA country wishing to keep its exchange rates low may restrict the amount of domestic currency that can be held by foreign enterprises doing business there. For example, China could restrict the amount of yuan held by foreign banks operating in China. This would limit demand for the domestic currency as well, and keep exchange rates low. It also poses a significant bureaucratic and economic barrier to foreign firms operating in the country, and can limit foreign direct investment.
Changing fixed exchange ratesWhenever a country operating fixed exchange rates determines to change the value of its currency, it employs the methods above to move supply and demand towards their new desired rate. To drive the exchange rate upward is to revalue it, and to reduce the exchange rate is to devalue it.
EXERCISES
8 a Using the figure below, how would you characterize the change in the RMB’s exchange rate in the pre-1994 years and in the years that followed?
Exchange rate: RMB per USD
RMB
per U
SD
9
8
7
6
5
4
3
2198919871985 1991 1993 1995 1997 1999 2001 2003 2005 2007 2009
To access Worksheet �����PO�$IJOB�T�TJMWFS�bullet, please visit www.pearsonbacconline.com and follow the onscreen instructions.
M22_ECON_SB_0673_CH22.indd 464 30/07/2015 14:21

465
9
10
b Is the rate for 1994 onward a higher or lower exchange rate than before?
What advantages did China possibly gain from making this change? Disadvantages?
List three possible policy measures that China might have used to put this change into effect.
Managed exchange ratesManaged float systemWhile fewer and fewer countries fix their currencies in the way described above, most are still willing to intervene should the exchange rate climb too high or fall too far for their liking. These countries may still peg their own currency to the value of another or to a basket of several currencies. However, they have a much wider acceptable range of values than a strictly fixed system. When the exchange rate approaches either the upper or lower limit, the central bank acts to keep the value within that range.
The degree to which a country can manage its currency depends on the same factors that determine whether or not it can fix its rate: in particular, the amount of foreign and domestic reserves and relative interest rates. The more narrow the band, the more potential difficulty in maintaining the rate.
Why enact this halfway measure between fixed and freely floating exchange rate policies? The managed system puts a priority on stability, particularly between two pegged currencies. This stability could be an advantage, depending on the degree of trade and other economic integration with the other country. For example, it is rather common for countries seeking to adopt the euro to peg their currencies. This allows for stable import and export prices between countries and is viewed as a necessary step to joining the eurozone club.
Currency valuationWhen the supply and demand of a currency meet, as they do at equilibrium, there is no overvaluation or undervaluation. However, any time a country holds a currency above or below that equilibrium, the resulting overvaluation or undervaluation can have significant effects on its overall economy.
Overvalued currencies
In Figure 22.7, Argentina initially lost value from the target rate of 1 USD to 1 peso. If it tried to maintain this as the official rate, without intervention to prop up its value, we would say that the peso is overvalued. It is likely that black markets would arise, where the actual street price for pesos would be between the equilibrium of 0.85 USD and 0.99 USD.
Overvaluing a currency presents some advantages. Developing countries may wish to import capital goods or materials at a cheaper price, something the higher rates would enable. However, overvaluation almost certainly hurts exports which, combined with greater import purchasing power, is likely to lead to a trade balance deficit. Overvaluation can also hurt domestic industries, which now face competition from cheap imports. Should a country decide that these costs are too great, it must either intervene to revalue the currency or be prepared to devalue the currency.
Undervalued currencies
Keeping a currency undervalued can have advantages. By keeping exports relatively cheap, undervaluation can improve exports and reduce the attractiveness of importing goods.
A managed float exchange rate system is one where the government periodically intervenes to keep the rate within a wide band of acceptable values.
M22_ECON_SB_0673_CH22.indd 465 30/07/2015 14:21

EXCHANGE RATES
466
22
This may improve the trade balance, but can also create an opportunity for imported inflation. Countries have employed this as a means to gain access to greater amounts of foreign exchange and to accelerate economic growth. However, as a sustained practice, undervaluation can be viewed by competitors as a form of unfair trade promotion and protectionism, since it both encourages exports and discourages imports by distorting prices. This can lead to charges of unfair trade and retaliatory protectionism.
22.5 Evaluation of different exchange rate systems (HL only)
Fixed exchange rateAdvantages of a fixed rateStability
With fixed exchange rates, foreign investors do not have to take into account possible changes in exchange rates when calculating costs and sales. This simplifies business plans and reduces the cost of potential FDI companies. It can also help domestic companies with significant foreign sales or imported cost components.
Inflation control
When locked into a fixed rate, exports are vulnerable to the effects of domestic inflation, which would raise export prices and could reduce the demand for those exports. Governments are, therefore, compelled to manage inflation to keep their export prices competitive.
Protection against speculation
Free-floating rates are at the mercy of the market, where large speculators can heavily influence the buying and selling of a currency. When a government pledges to support the value of a currency, as under a fixed system, speculators have less incentive to make speculative actions against the currency’s value. However, this does occasionally happen in fixed-rate systems.
Disadvantages of a fixed rateLimitations on domestic policyt Where the fixed-rate system is managed largely by manipulation of interest rates, the
option of using those same interest rates for domestic policy purposes is significantly restricted. For example, if a fixed-rate country faces a recession, it would normally enact expansionary monetary policy, lowering interest rates to stimulate consumption and investment. However, to attract foreign deposits and keep demand for the currency
Learning outcomes� &RPSDUH�DQG�FRQWUDVW�D�IL[HG�H[FKDQJH�UDWH�V\VWHP�ZLWK�D�IORDWLQJ�H[FKDQJH�UDWH�
V\VWHP��ZLWK�UHIHUHQFH�WR�IDFWRUV�LQFOXGLQJ�WKH�GHJUHH�RI�FHUWDLQW\�IRU�VWDNHKROGHUV��HDVH�RI�DGMXVWPHQW��WKH�UROH�RI�LQWHUQDWLRQDO�UHVHUYHV�LQ�WKH�IRUP�RI�IRUHLJQ�FXUUHQFLHV�DQG�IOH[LELOLW\�RIIHUHG�WR�SROLF\PDNHUV�
To access Worksheet 22.3 on managed exchange rates, please visit www.pearsonbacconline.com and follow the onscreen instructions.
M22_ECON_SB_0673_CH22.indd 466 30/07/2015 14:21

467
high, it would be compelled to leave interest rates high. This could deepen a recession and possibly limit economic growth overall.
t If the rate is kept low, it is possible that continued buying of high-priced imports would cause imported inflation. This inflation could not be addressed in the traditional manner, with higher interest rates, because the interest rates are being kept low to suppress the exchange rate.
t When the currency is fixed too high, it can cause a trade deficit because exports are priced uncompetitively. This imbalance cannot be corrected by devaluation (that would defeat the purpose of maintaining the high fixed rate), so countries must either enact protectionism (increasingly difficult) or enact expenditure-reducing policies. These policies aim to reduce national income, and thus reduce the demand for imported goods. While solving the trade deficit, this could also have severe effects on economic growth and employment.
Limited options with external shocks
In times of economic crisis, the single-minded pursuit of a fixed exchange rate can limit the range of options available to respond to the crisis. For example, a spike in the price of an imported energy resource could trigger a current account deficit. This happened in 2008 when Russia shut of supplies of natural gas to a range of nearby countries, most especially Ukraine. With more import money going out, there is a drain on foreign exchange reserves. If reserves are running low, more dramatic and potentially damaging measures such as protectionism and export controls are required to maintain the fixed rate.
Need to hold foreign reserves
Fixed-rate regimes require large amounts of foreign reserves to protect against speculators. In the absence of such reserves, foreign governments and investors will not be confident that the government can properly defend the currency. So, reserves lie dormant for the sake of market confidence in the fixed rate when they could be better used to buy and sell needed resources.
Risk of speculation
If a country has fixed a high exchange rate and is running low on reserves, speculators aggravate the problem by betting against the currency. They believe that the government must inevitably devalue, so they sell the currency, which depreciates it further. This forces the government to defend the currency by spending more reserves, weakening its position further, and inviting more speculation that it will default. These are the makings of a run on a currency.
Setting the rate
Determining what the ultimate fixed rate should be is an enormously complex decision, and includes a number of unknown factors. A high rate can hurt exporters and domestic industry, while a low rate may help exports but cause imported inflation.
Vulnerability to charges of unfair competition
If a country can sustain a low relative exchange rate that dramatically increases its exports, it may encounter resentment from competitor nations. This can result in poor trade relations, trade sanctions or protectionist policies being levied against the fixed-rate country.
M22_ECON_SB_0673_CH22.indd 467 30/07/2015 14:21

EXCHANGE RATES
468
22
Floating rateAdvantages of a floating rateDomestic policy freedom
Overall growth and inflation management is enormously difficult even under normal conditions, without the need to factor in the management of exchange rates as well. Allowing the exchange rate to float freely means that one is free to manipulate monetary policy, specifically interest rates, to manage the balance between domestic growth rates and inflation. This also means that it will not be necessary to use fiscal policy to manage exports and thus the exchange rate.
Self-adjustment and balance of payments
A surge in demand for exports can lead to a surplus trade balance. The increased demand for the currency leads to appreciation, however. And the higher valued currency may discourage continued export sales. This could, therefore, reduce some of the accumulating trade surplus. This demonstrates the self-adjusting nature of the balance of payments when the exchange rate is allowed to float according to market wishes.
No surplus currency reserves
Because floating rate schemes do not require the stockpiling of currency reserves to prop up or devalue a currency, financial resources are allocated more efficiently. Foreign exchange can then be used to more productive ends, such as purchasing capital goods or imported resources.
Flexible response to external shocks
Sudden disruptions to the economy can be managed without the need to devote resources to fixing a rate. In the event of a massive debt relief package, such as that agreed by the EU for some of its members in 2010, countries would normally see their currency depreciate as faith and expectations for growth fall. This depreciation would allow for greater exports, and for growth to return. This growth would help the debtor country pay off its debts. (Because many EU countries have the euro as currency, they cannot do this independently. Unless the euro itself depreciates significantly, these countries will find it difficult to get enough export-led growth to pay off debts quickly.)
Disadvantages of a floating rateUncertainty for investors
When entering new or unfamiliar markets, foreign investors put a priority on holding as many factors as possible stable and predictable. Exchange rates are very important here because the foreign company may need to import materials and capital equipment. Simultaneously, it will be paying wages and property costs in local currency. This would also be true of domestic companies with foreign sales or investment aspirations. Navigating wide fluctuations in the exchange rate adds administrative cost and makes both predicting costs and setting product prices very difficult.
Influence of random events prevent automatic adjustment
While floating rates permit a flexible response to economic crises, not all shocks can be solved by exchange rate self-adjustment. Severe international political tension, domestic social turmoil, and other random events can depress markets and limit growth, despite any self-adjustment in exchange rates.
M22_ECON_SB_0673_CH22.indd 468 30/07/2015 14:21
469
Risk of imported inflation
Countries that have constant need of foreign resources may find themselves with a persistently low exchange rate. In that situation, where the country has little opportunity to change the nature of its imports, it will import inflationary pressure on the economy as a whole. This is true of countries importing natural resources like oil, and those importing capital resources to build industry. The resulting cost-push inflation can slow economic growth on the supply side.
Volatility
Wide swings in currency values make doing business much more difficult, especially for those who import or export on a regular basis. With this in mind, developing countries often seek to peg their currency to a large trading partner. In extraordinary circumstances of great volatility, a rescue of the currency is required. Typically administered by the IMF, these rescue plans can come with significant conditions that may dictate the management of domestic fiscal policy (Chapter 28.)
HL EXERCISES
11
12
13
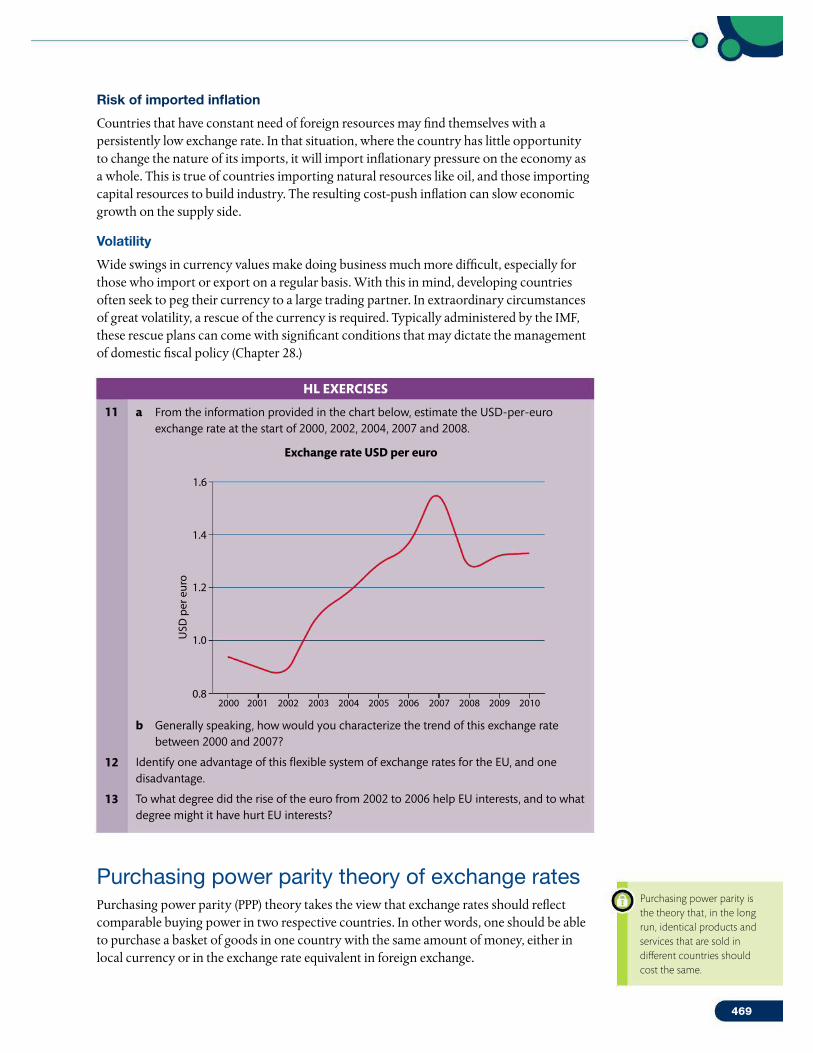
a From the information provided in the chart below, estimate the USD-per-euro exchange rate at the start of 2000, 2002, 2004, 2007 and 2008.
Exchange rate USD per euro
USD
per
eur
o
1.6
1.4
1.2
1.0
0.82000 2001 2002 2003 2004 2005 2006 2007 2008 2009 2010
b Generally speaking, how would you characterize the trend of this exchange rate between 2000 and 2007?
Identify one advantage of this flexible system of exchange rates for the EU, and one disadvantage.
To what degree did the rise of the euro from 2002 to 2006 help EU interests, and to what degree might it have hurt EU interests?
Purchasing power parity theory of exchange ratesPurchasing power parity (PPP) theory takes the view that exchange rates should reflect comparable buying power in two respective countries. In other words, one should be able to purchase a basket of goods in one country with the same amount of money, either in local currency or in the exchange rate equivalent in foreign exchange.
1VSDIBTJOH�QPXFS�QBSJUZ�JT�the theory that, in the long run, identical products and services that are sold in different countries should cost the same.
M22_ECON_SB_0673_CH22.indd 469 30/07/2015 14:21

EXCHANGE RATES
470
22
For example, if the exchange rate between the Japanese yen (JPY) and the US dollar were 100 JPY per USD, then a 1000 USD computer should cost 100 000 JPY. Likewise, any Japanese item priced at 100 000 JPY would cost 1000 USD.
Because inflation affects purchasing power domestically, it can affect this relationship. If US inflation grew by 10%, then US dollars would buy less at home and it would require 1100 USD to buy the computer. PPP theory argues that the exchange rate should reflect this loss of purchasing power, so that the exchange rate would now be 1.1 USD per 100 JPY, and that approximately 91 JPY would be equal to 1 USD.
Deviations from the PPP exchange rate may indicate that a country’s currency is overvalued or undervalued. Using the above example, if the value of the yen does not rise to reflect purchasing power, if it trades at 97 JPY per USD despite US inflation, then PPP theory would imply that the yen is undervalued at that rate, and should, over time, appreciate to match the purchasing power parity rate of 91 JPY per dollar.
PPP theory thus suggests that steady inflation tends to depreciate a country’s currency. It also suggests exchange rates would not be necessary, if the value of currency reflected exact purchasing power. Currency would be easily exchanged to buy a good without concern for any losses or gains from overvaluation or undervaluation.
Limitations of PPP theoryHowever, PPP theory overestimates the effects of relative price levels, and ignores the other factors that influence exchange rate changes.
Speculation
It has been estimated that the majority of the money traded on the forex market is done with speculative purposes in mind. Instead of reflecting levels of purchasing power, this suggests that over half of the market is traded based on perceived value of the currency as an asset. Thus, speculation must be considered a significant limitation on the applicability of PPP theory.
Confidence
Investors may choose to buy factories or do business in a country based on prospects for growth and future income. The level of confidence in the economy plays a major role in the currency value.
Capital inflows
Changes in relative interest rates can enhance or diminish the attractiveness of domestic financial investments and deposits. A high real interest rate, for example, could still drive up demand for the currency, while low real interest rates may hinder demand for the currency even if prices are stable.
Much trade is not international
PPP theory is based on the idea of arbitrage. This means if a good were priced cheaply, in exchange rate terms, the good would be purchased at the low exchange rate price and be resold where it can bring a higher price. This will eventually equalize prices and drive the actual exchange rate to be equal to the PPP rate. However, the percentage of goods traded internationally (while growing) is still unlikely to make up a majority of GDP for most countries. With that in mind, the validity of the price equalization aspect of PPP is in question.
M22_ECON_SB_0673_CH22.indd 470 30/07/2015 14:21

471
Barriers to trade
Further limiting the drive towards price equalization across borders is the continuing practice of protectionism. Limits to the free trade of goods impede the trend towards free movement of goods and, therefore, towards true purchasing power parity.
Goods not always comparable
PPP theory works best when the goods traded or compared are excellent substitutes. Indeed, the most famous test cases of PPP theory involve highly standardized products – the McDonald’s Big Mac, and Starbucks coffees. Comparing prices between these goods can be instructive, since the products are the same. However, differences in product types and quality make further comparison significantly more problematic.
22.6 Exchange rate calculations and linear functions (HL only)
Supply and demand for currency with linear functionsAs you learned in Chapter 2, the supply and demand for a product can be calculated using linear demand functions. We can do the same with exchange rates because foreign exchange is traded in much the same manner as any other product.
Calculating exchange rates from linear functionsJust as with product and labour markets, the market for foreign exchange can be understood and expressed using linear equations for supply and demand. Again, the linear demand equation format is:
Q D = a – bP
However, in this function, P stands for the exchange rate of the currency, in terms of another currency. So, using this demand function we can derive a specific demand function for the currency, in this case the euro:
Q D EURO = a – bP
Again, P represents the exchange rate of the currency. For our example, a plausible demand function might be:
Q D EURO = 100 – 10P
To learn more about purchasing power parity, visit www.pearsonhotlinks.com, enter the title or ISBN of this book and select weblink 22.3.
Assessment statements� &DOFXODWH�WKH�H[FKDQJH�UDWH�IURP�OLQHDU�GHPDQG�DQG�VXSSO\�IXQFWLRQV�� 3ORW�GHPDQG�DQG�VXSSO\�FXUYHV�IRU�D�FXUUHQF\�IURP�OLQHDU�IXQFWLRQV�DQG�LGHQWLI\�WKH�
H[FKDQJH�UDWH�� 8VLQJ�H[FKDQJH�UDWHV��FDOFXODWH�WKH�SULFH�RI�D�JRRG�LQ�GLIIHUHQW�FXUUHQFLHV�� &DOFXODWH�WKH�FKDQJHV�LQ�WKH�YDOXH�RI�D�FXUUHQF\�IURP�D�VHW�RI�GDWD�
M22_ECON_SB_0673_CH22.indd 471 30/07/2015 14:21

EXCHANGE RATES
472
22
Using this demand function, we can calculate the quantity demanded of euros at several USD-per-euro exchange rates, and then show them on a demand curve. Table 22.2 shows the amount of euros demanded at each exchange rate.
Before plotting the demand schedule, let’s compute the supply schedule as well. Recall that linear supply functions look like this:
Q S = c + dP
So, for the euro:
Q S EURO = c + dP
Which, for our example, might be:
Q S EURO = 55 + 20P
Therefore, a linear supply schedule for the supply of euros is shown in Table 22.3.
We can determine the equilibrium by solving for the equilibrium exchange rate (P) and quantity (Q ) by setting supply equal to demand.
Worked example
55 + 20P = 100 – 10P
30P = 45
P = 1.5
So, the exchange rate is $1.50 per euro.
Putting the exchange rate (P) into both functions, and we get the equilibrium quantity of 85.
Diagramming exchange rates using linear demand functionsNow that we have the quantities supplied and demanded, we can plot the market diagram for euros. Figure 22.8 shows the intersection of supply and demand to be at $1.5 per euro, with 85 billion euro traded.
pric
e of
EU
R in
USD
2
1.75
1.5
1.25
0 75 80 85 90D
S
95 100quantity of euros
TABLE 22.2 EXCHANGE RATE DEMAND SCHEDULE
Exchange rate / USD per euro Quantity of euros demanded / billions
2 80
1.75 82.5
1.5 85
1.25 87.5
1 90
EXCHANGE RATE SUPPLY SCHEDULE
Exchange rate / USD per euro Quantity of euros supplied / billions
2 95
1.75 90
1.5 85
1.25 80
1 75
M22_ECON_SB_0673_CH22.indd 472 30/07/2015 14:21

473
Changes in foreign exchange equilibrium using linear functionsFreely floating exchange rates are subject to change, of course. And these changes can also be expressed using linear functions. In the linear demand function, a represents the level of autonomous demand. When this amount changes, demand has changed, and a new curve representing a new set of prices and quantities must be created. The same is true for c in linear supply functions. A change in c is a change in supply, requiring a new supply schedule and new supply curve.
For example, let’s consider the demand function above when the a variable has increased by 7.5 from 100 to 107.5; the new demand function is:
Q D EURO = 107.5 – 10P
This increases demand at all prices and results in a new demand schedule (Table 22.4).
TABLE 22.4 EXCHANGE RATE DEMAND SCHEDULE
Exchange rate / USD per euro Quantity of euros supplied / billions
2 87.5
1.75 90
1.5 92.5
1.25 95
1 97.5
Notice, that all the quantities demanded have increased by 7.5 units. Again, we can solve for equilibrium exchange rate (P) and quantity (Q ) by setting supply equal to demand.
Worked example 55 + 20P = 107.5 – 10P
30P = 52.5
P = 1.75
The exchange rate is $1.75 per euro
When paired with the old supply numbers, the new market equilibrium becomes apparent (Table 22.5). At $1.75 per euro, 90 billion euros are bought and sold.
TABLE 22.5 EXCHANGE RATE MARKET SCHEDULE
Exchange rate / USD per euro
Quantity of euros demanded / billions
Quantity of euros supplied / billions
2 87.5 95
1.75 90 90
1.5 92.5 85
1.25 95 80
1 97.5 75
Figure 22.9 (overleaf) shows the new equilibrium, created by a shift of the demand for euros to the right or upwards by 7.5 billion euros at every price.
M22_ECON_SB_0673_CH22.indd 473 30/07/2015 14:21

EXCHANGE RATES
474
22
pric
e of
EU
R in
USD
quantity of euros
2
1.75
1.5
1.25
0 75 80 85 90D
D1
S
95 100
Supply shifts can be represented in the same way. For example, let’s go back to the original supply and demand functions and change the supply variable c by 15 units. This represents a major increase in supply, as something like a panic sets in about the strength of the euro.
Many euro holders are offering up their currency on the market, shifting supply to the right. The new linear supply function is:
Q S EURO = 70 + 20P
The resulting supply schedule is shown in Table 22.6
We can determine the equilibrium by solving for the equilibrium exchange rate (P) and quantity (Q ) by setting supply equal to the original demand function.
Worked example
70 + 20P = 100 – 10P
30P = 30
P = 1
So, the exchange rate is $1.00 per euro.
All supply quantities have increased by 15 units. This represents an increased supply at all prices and a parallel shift in the supply curve for euros. When paired with the old demand numbers, the new equilibrium is apparent at $1 per euro, and 90 billion exchanged (Table 22.7).
TABLE 22.7 EXCHANGE RATE MARKET SCHEDULE
Exchange rate (USD per euro) Quantity demanded euros (billions)
Quantity supplied euros (billions)
2 80 110
1.75 82.5 105
1.5 85 100
1.25 87.5 95
1 90 90
TABLE 22.6 EXCHANGE RATE SUPPLY SCHEDULE
Exchange rate / USD per euro Quantity of euros supplied / billions
2 110
1.75 105
1.5 100
1.25 95
1 90
M22_ECON_SB_0673_CH22.indd 474 30/07/2015 14:21

475
Figure 22.10 shows the new equilibrium for euros.
2
1.75
1.5
1.25
1
0 75 80 85 90D
S1
S
95 100
pric
e of
EU
R in
USD
quantity of euros
It is possible to express the supply and demand for any currency in terms of a linear function. At the same time, these functions can help calculate full supply and demand schedules, diagrams and market equilibrium from these functions.
Calculating exchange rates from a set of dataCurrency information is reported in many forms and can be deduced from various sources of information. Therefore, you need to be able to calculate exchange rates from different types of data.
Changes in the price of traded goods and services
Sometimes, the prices of imported and exported goods change because the exchange rate has changed. For example, if the Mexican peso appreciates by 20%, you would expect the price of Mexican exports to increase by the same amount. To look at it from the other side, if the price of Mexican imports increased by 20%, you might, all other things being equal, conclude that the peso has appreciated by that amount.
You are expected to be able to calculate the inferred change in the exchange rate, given the change in the price of exports. Consider a box of matches imported from Thailand into the eurozone. The price of the matches is 75 Thai baht (THB), which is equivalent to 1.5 EUR, assuming that there are no exchange fees or import duties. This price is in accordance with a baht-to-euro exchange rate of 50 THB per EUR.
Suddenly, the price of matches increases in the eurozone. It now requires 2 EUR to buy one box, which is still priced at 75 THB. What must have happened to the exchange rate? Clearly the euro has depreciated against the baht, but how far? We can calculate the new exchange rate based on this change in prices.
Worked example
At the old exchange rate: 1 EUR = 50 THB
This could be inferred from the fact that Thai matches cost: 1.5 EUR or 75 THB
forex price of the good
______________________ domestic price of the good = exchange rate for foreign currency
75 THB _______ 1.5 EUR = 50 THB per EUR
Figure 22.10 &YDIBOHF�SBUF�TIJGUT �MJOFBS�functions.
M22_ECON_SB_0673_CH22.indd 475 30/07/2015 14:21

EXCHANGE RATES
476
22
Using the same formula, we can derive the new exchange rate:
75 THB _______ 2 EUR = 37.5 THB per EUR
So the euro has depreciated against the baht, and the baht has appreciated against the euro. It now takes more euros to buy Thai baht, and to buy imported Thai goods like a box of matches. The exchange rate has changed from 50 THB per EUR to 37.5 THB per EUR.
HL EXERCISES
14 Given the following linear demand and supply functions for the USD in terms of Chinese RMB: QS = 10 + 3P; QD = 50 – 2P
a Calculate the exchange rate for USD in terms of RMB.
b Plot the linear supply and demand curves on a diagram, indicating the equilibrium price and quantity.
15 Assume that the exchange rate for British pounds and USD is 1.60 USD per GBP.
a Calculate the value in GBP for 1 USD.
b For the information given above, calculate how many pounds would be received in exchange for 1200 USD.
c Calculate in USD the price of a Manchester United football jersey that costs 45 GBP.
d Assume that large pack of US writing pens costs 10 GBP. A change in the exchange rate raises their price to 11 GBP. Calculate the value of the new USD per GBP exchange rate.
16 Last year, Japan could import athletic jerseys from China costing 60 RMB, which cost 720 JPY at current exchange rates. Now the same 60 RMB jersey costs 780 JPY. What is the current exchange rate?
PRACTICE QUESTIONS
1 India faces rising currency
1 The Indian economy has performed remarkably well in the past 10 years, achieving levels of growth only beaten by China. However, India is not without problems including rural poverty and the lack of infrastructure, which threaten to limit the gains from economic growth. Now the strength of the Indian economy and its attractiveness to foreign investors is causing a new and unexpected problem – a rising currency. This week the Indian rupee reached its highest value against the US$ since 1998.
2 During 2007, foreign investment into India increased by more than 80% to a record US$44 billion. India is an attractive place for investment because it is a developing economy with the potential for future economic growth. The relatively cheap labour available in India makes it an attractive place for manufacturing and call centres. For these reasons, the Indian rupee has appreciated 15% against the US$ in the past year.
3 While large capital inflows are beneficial for the economy, the rising currency may cause increasing hardship for exporters, especially India’s labour-intensive manufacturing industries. Exports account for 10% of the US$854 billion economy and the government is counting on strong exports to support economic growth in India. India’s economy expanded by 9.2% in the past year, the highest growth rate in two decades.
4 The nation’s largest computer-services provider said the Indian rupee’s ‘drastic’ gains will reduce earnings by over US$7 billion. The Federation of Indian Exporters says ‘the currency is overvalued and we are asking the government to intervene’.
To access Quiz 22, an interactive, multiple-choice quiz on this chapter, please visit www.pearsonbacconline.com and follow the onscreen instructions.
M22_ECON_SB_0673_CH22.indd 476 30/07/2015 14:21

477
5 India’s central bank, which sold a record US$11.9 billion [worth of ] Indian rupees in February in a bid to slow the currency’s gains, is, however, also concerned about India’s rising inflation rate.
6 The Reserve Bank of India is torn between the need to contain inflation, which accelerated at 7 % in February, the fastest pace for more than two years, and the need to limit the appreciation of the currency. To reduce inflation, one policy response is to increase interest rates but this is likely to further strengthen the Indian rupee.
adapted from The Economist, 13 December 2007; Bloomberg, 17 April 2008;
Economics Help, 12 November 2008
a Define the following terms indicated in bold in the text:
i economic growth (paragraph 1) [2 marks] [AO1]
ii interest rates (paragraph 6). [2 marks] [AO1]
b Using an appropriate diagram, explain why the Indian rupee has ‘increased 15% against the US$ in the past year’ (paragraph 2 ). [4 marks] [AO2], [AO4]
c Using an aggregate supply and demand diagram, explain how the rupee’s appreciation will affect exports and overall economic performance (paragraph 3). [4 marks] [AO2], [AO4]
d Using information from the text/data and your knowledge of economics, evaluate the extent to which the Indian government should intervene to manage the value of the Indian rupee. [8 marks] [AO3]
© International Baccalaureate Organization 2010 (part a only)
M22_ECON_SB_0673_CH22.indd 477 30/07/2015 14:21

EXCHANGE RATES
478
22
2
The benefits of a lower dollar
1 The current decline in the US dollar ($) will provide a much-needed stimulus to the US economy. The depreciation of the dollar will bring especially welcome relief to the US manufacturing sector, which has suffered the disastrous consequences of lost jobs, reduced profits, and decreased investment as a result of the dollar’s overvaluation for the past several years. However, although the dollar has come down significantly from its peak in February 2002, it has not yet fallen nearly enough to reverse the damage caused by its high value since the late 1990s.
2 The high value of the dollar since the late 1990s has acted like a massive tax on US exports and a huge subsidy to US imports. As a result, although US manufacturing firms have made substantial investments in new technologies and US manufacturing workers have vastly increased their productivity, these achievements have not been successful because foreign products have been selling at artificially low prices due to the overvalued dollar. Specifically, the overvalued dollar has resulted in:
t� �"CPVU���������MPTU�KPCT�JO�UIF�NBOVGBDUVSJOH�TFDUPS�CZ������o�NPSF�UIBO�POF�quarter of the 2.6 million jobs lost in manufacturing since 1998.
t� �"�EFDSFBTF�PG�OFBSMZ�64�����CJMMJPO�JO�UIF�BOOVBM�QSPmUT�PG�64�NBOVGBDUVSJOH�companies by 2002.
t� �"�GBMM�JO�JOWFTUNFOU�JO�UIF�EPNFTUJD�NBOVGBDUVSJOH�TFDUPS�CZ�PWFS�64����CJMMJPO�annually as of 2002, representing a loss of 25 % of US manufacturing investment.
3 There is a situation where the United States of America is running up foreign debt at a rate unseen in history. In the fourth quarter of 2002, the current account deficit of the world’s largest economy hit an annualized rate of 5.2% of GDP, well above the 3.4% deficit reached in 1987, the last time the USA faced an international financial crisis.
adapted from Blecker, RA. The benefits of a lower dollar, 30 May 2003, EPI Briefing Paper; Bulletin with Newsweek, 13 May 2003, 121(6372):20
a Define the following terms indicated in bold in the text:
i current account deficit (paragraph 3) (2 marks) [AO1]
ii subsidy (paragraph 2). (2 marks) [AO1]
b Using an appropriate diagram, explain why the value of the US dollar has declined (paragraph 1). [4 marks] [AO2], [AO4]
c Using an appropriate diagram explain why the increased value of the dollar appears to be harming the overall economy (paragraphs 1 and 2). [4 marks] [AO2], [AO4]
d Using information from the text and your knowledge of economics, discuss the degree to which the US government should intervene to lower the US dollar exchange rate. [8 marks] [AO3]
© International Baccalaureate Organization 2005 (part a only)
M22_ECON_SB_0673_CH22.indd 478 30/07/2015 14:21