22 Dynamic
13
ISSN: 2319-8753 International Journal of Innovative Research in Science, Engineering and Technology (An ISO 3297: 2007 Certified Organization) Vol. 2, Issue 11, November 2013 Copyright to IJIRSET www.ijirset.com 6081 Dynamic Stability Analysis of Compliant Offshore Structures – A Case Study of Single Hinged Articulated Tower Atreya, Prashant 1 ; Islam, Najrul 2 ; Alam, Mehtab 3 ; Hassan, Syed Danish 4 Research Scholar, Department of Civil Engineering, Jamia Milia Islamia, New Delhi, India-110025 1 Professor, Department of Civil Engineering, Jamia Milia Islamia, New Delhi, India-110025 2 Professor, Department of Civil Engineering, Jamia Milia Islamia, New Delhi, India-110025 3 Reader, University Polytechnic, Aligarh Muslim University, India -202001 4 Abstract: All the researchers in past have carried out dynamic response analysis of the structure under Wave, Earthquake or Wind loads or a combination of these loads and studied its behavior. Very few investigations have been reported which effectively incorporate hydrodynamic drag nonlinearity and study its effect on the stability of the systems. As oceanic waves are better modeled as stochastic process, there is a need to investigate the stochastic stability of flexible offshore structures as well. Present study have been carried out to determine seismic response of single hinged Articulated Tower under Wave and Earthquake loads followed by its dynamic Stability analysis. Dynamic stability analysis of compliant offshore structures constitute an interesting area of research because of their inherent non-linearities. The study has explored dynamic instabilities existing during the different phases of wave / earthquake loading on SHAT. A simple method of two-dimensional phase plots and bifurcation assessment has been used to identify phases of dynamic instability existing within the responses of SHAT under various conditions of loading. Keyword: Single Hinged Articulated Tower, Earthquake, Time History, Phase Plot I. INTRODUCTION Complex non-linear and chaotic responses are observed in various types of compliant offshore structures. These structures have large displacements with inherent non-linearities, so prediction of behavior of these structures in oceanic environment is difficult and is met with many challenges. These systems are characterized by strong geometric non-linearity, non-linear excitation forces in form of waves and earthquake and non-linear restoring forces. The non-linear restoring forces arising due to fluid structure interaction finally leads to the possibility of dynamic instability of the systems. On account of these non-linearities, numerical investigations of compliant offshore structures have revealed complex behavior involving sub- harmonic, super-harmonic and aperiodic solutions[1,2 & 3]. SHAT platform is one of the compliant structures(Fig.1) which is economically attractive especially as loading and mooring terminal in deep waters. These platforms are comparatively light compared to the conventional fixed platforms. The tower itself is a linear structure, flexibly connected to the sea bed through a cardon / universal joint and held vertically by the buoyancy force acting on it. The part of the tower emerging from the water supports the super structure designed to suit the particular application e.g. a tanker to be loaded, flaring of waste gases, etc. As the connection to the sea bed is through the articulation, the structure is free to oscillate in any direction and does not transfer any bending moment to the
-
Upload
akhilesh120 -
Category
Documents
-
view
213 -
download
0
description
Dynamic Stability Analysis of CompliantOffshore Structures – A Case Study of SingleHinged Articulated Tower
Transcript of 22 Dynamic

ISSN: 2319-8753
International Journal of Innovative Research in Science,
Engineering and Technology
(An ISO 3297: 2007 Certified Organization)
Vol. 2, Issue 11, November 2013
Copyright to IJIRSET www.ijirset.com 6081
Dynamic Stability Analysis of Compliant
Offshore Structures – A Case Study of Single
Hinged Articulated Tower
Atreya, Prashant1; Islam, Najrul
2; Alam, Mehtab
3; Hassan, Syed Danish
4
Research Scholar, Department of Civil Engineering, Jamia Milia Islamia, New Delhi, India-1100251
Professor, Department of Civil Engineering, Jamia Milia Islamia, New Delhi, India-1100252
Professor, Department of Civil Engineering, Jamia Milia Islamia, New Delhi, India-1100253
Reader, University Polytechnic, Aligarh Muslim University, India -202001
4
Abstract: All the researchers in past have carried out dynamic response analysis of the structure under Wave, Earthquake
or Wind loads or a combination of these loads and studied its behavior. Very few investigations have been reported which
effectively incorporate hydrodynamic drag nonlinearity and study its effect on the stability of the systems. As oceanic
waves are better modeled as stochastic process, there is a need to investigate the stochastic stability of flexible offshore
structures as well. Present study have been carried out to determine seismic response of single hinged Articulated Tower
under Wave and Earthquake loads followed by its dynamic Stability analysis. Dynamic stability analysis of compliant
offshore structures constitute an interesting area of research because of their inherent non-linearities. The study has
explored dynamic instabilities existing during the different phases of wave / earthquake loading on SHAT. A simple
method of two-dimensional phase plots and bifurcation assessment has been used to identify phases of dynamic instability
existing within the responses of SHAT under various conditions of loading.
Keyword: Single Hinged Articulated Tower, Earthquake, Time History, Phase Plot
I. INTRODUCTION
Complex non-linear and chaotic responses are observed in various types of compliant offshore structures. These structures
have large displacements with inherent non-linearities, so prediction of behavior of these structures in oceanic environment
is difficult and is met with many challenges. These systems are characterized by strong geometric non-linearity, non-linear
excitation forces in form of waves and earthquake and non-linear restoring forces. The non-linear restoring forces arising
due to fluid structure interaction finally leads to the possibility of dynamic instability of the systems. On account of these
non-linearities, numerical investigations of compliant offshore structures have revealed complex behavior involving sub-
harmonic, super-harmonic and aperiodic solutions[1,2 & 3].
SHAT platform is one of the compliant structures(Fig.1) which is economically attractive especially as loading and
mooring terminal in deep waters. These platforms are comparatively light compared to the conventional fixed platforms.
The tower itself is a linear structure, flexibly connected to the sea bed through a cardon / universal joint and held vertically
by the buoyancy force acting on it. The part of the tower emerging from the water supports the super structure designed to
suit the particular application e.g. a tanker to be loaded, flaring of waste gases, etc. As the connection to the sea bed is
through the articulation, the structure is free to oscillate in any direction and does not transfer any bending moment to the

ISSN: 2319-8753
International Journal of Innovative Research in Science,
Engineering and Technology
(An ISO 3297: 2007 Certified Organization)
Vol. 2, Issue 11, November 2013
Copyright to IJIRSET www.ijirset.com 6082
base. As the articulated tower is compliant in nature, it moves with the waves and thus the wave force and bending moment
along the tower will be less compared to a fixed structure. Efforts have been made to use simplified realistic mathematical
models to gain important insight into the response behavior of these structures and to explore the possibility of their
dynamic instability and chaotic motion.
II. STRUCTURE IDEALIZATION AND SYSTEM MODEL
SHAT has been modeled as a stick. The universal joint at base has been modeled as mass-less rotational spring of zero
stiffness. The main piles are assumed to cluster near the centre of the tower cross-section, hence soil reaction at the sea-bed
is modelled as rotational spring of fairly small stiffness, considered as zero (Fig. 2). The problem has been solved using
Finite element method. The submerged elements of the tower have been subjected to time dependent hydro-dynamic
loading and elements of the tower above still water level have been exposed to wind forces. Due to non-linear forces acting
on the tower, the number of submerged elements also varies with respect to time. Drag force has been assumed to be
proportional to the relative water particle velocity w.r.t. the structure, oscillating under wave and ground motion. The
structural damping of the system has been specified as a fraction of the critical damping corresponding to the un-deflected
configuration of the tower.
(Fig.1 – Single Hinged Articulated Tower) (Fig.2- Stick Model of SHAT)

ISSN: 2319-8753
International Journal of Innovative Research in Science,
Engineering and Technology
(An ISO 3297: 2007 Certified Organization)
Vol. 2, Issue 11, November 2013
Copyright to IJIRSET www.ijirset.com 6083
III. SOLUTION APPROACH TO DYNAMIC STABILITY ANALYSIS OF SEISMIC RESPONSE OF SHAT
In Articulated Towers, due to large rotations, displacements and relative structural and water particle velocities, equation of
motions become highly non-linear. Since at each time step, the instantaneous submergence, inclination and geometry of the
tower changes appreciably, the buoyancy, added mass, stiffness, hydrodynamic forces and damping also changes. Due to
combined effect of instantaneous tower’s orientation, current and variable free water surface profile, this variation is much
pronounced. Lagrange’s method has the capability of relating the Kinetic, Potential energies and work of the conservative and non-conservative forces in terms of generalized rotational degrees of freedom. So, Lagrange’s approach has been used to arrive at non-linear dynamic formulation of articulated tower.
Wave forces on the submerged part of the tower have been estimated by the modified Morison’s equations, which duly takes into account the relative motion of the structure and water. Seismic inputs have been applied using El-Centro /
Northridge spectra. The water particle velocities and accelerations has been stipulated by Airy’s Linear wave theory. To
incorporate the effect of variable submergence, Chakrabarti’s approach [4 & 5] has been adopted. The transformation
matrix has been used to compute the normal and tangential component of the hydrodynamic forces on each element of the
tower corresponding to instantaneous deformed configuration of the tower. The updated mass-moment of inertia of the
tower has been incorporated in the consistent mass and damping matrices. Newmark’s Beta integration scheme has been
deployed to solve the equation of motion taking into account all non-linearities involved in the system. The responses
obtained were subjected to dynamic stability assessments.
Let us consider SHAT model in Fig.3. Flow chart for solution is given at Chart.-1.

ISSN: 2319-8753
International Journal of Innovative Research in Science,
Engineering and Technology
(An ISO 3297: 2007 Certified Organization)
Vol. 2, Issue 11, November 2013
Copyright to IJIRSET www.ijirset.com 6084
(Chart 1 – Flow Chart for solution to Dynamic Stability problem of SHAT)
The equations mentioned in the chart, after integration, have been used to determine the instantaneous hydrodynamic
loading along the submerged height of the shaft. Moments about the axis of rotation, due to these forces are determined by
multiplying the differential force equation by the appropriate moment arms and then integrating over the length of the
cylindrical shaft to obtain the total moment. As the total height of the shaft shall be divided into a finite number of elements
for determination of the wave forces and moments. The total force is obtained by the summation of all elemental values.
The above Equations were solved to obtain the transient responses at Heel and Deck level in form of angular deflection,
angular velocity, angular acceleration etc. These were further solved to obtain the Shear Force, Bending Moment, Axial
Force, Base Shear Force etc. along the axis of SHAT during various time intervals thereby providing total transient
behavior of the tower.

ISSN: 2319-8753
International Journal of Innovative Research in Science,
Engineering and Technology
(An ISO 3297: 2007 Certified Organization)
Vol. 2, Issue 11, November 2013
Copyright to IJIRSET www.ijirset.com 6085
IV. DYNAMIC STABILITY SOLUTION USING CONCEPT OF PHASE PLOT & BIFURCATION
A phase portrait is a collection of trajectories that represent the solution of these equations in the phase space. To obtain
phase plots, velocities are plotted on abscissa and displacement / rotation are plotted on x-axis. In general, a phase portrait
contains information about both the transient and the asymptotic behaviors of the solutions of a system. The phase plots are
extensively used to identify transitions of solutions from stable to unstable zone[8]. In Phase Plots, instability phenomenon
is shown in form of symmetry breaking bifurcations caused by nT sub-harmonic / super-harmonic oscillations and
aperiodic responses. The bifurcation concept is a mathematical study of changes in qualitative or topological behavior of
structure[6]. Without occurrence of bifurcation, the system seems to be quiet stable. In reality bifurcations may occur in
both continuous and discrete systems. In a dynamical system, a bifurcation occurs when a small smooth change made to the
bifurcation parameter causes a sudden qualitative or topological alteration in structural behavior. When the symmetry of a
Phase Plot is disturbed, bifurcation is termed as symmetry breaking bifurcation. Sub-harmonic oscillations occur when the
time period of subsequent cycle lessens by 1/n times than the previous time period. When the time period of subsequent
cycle increases n times of previous time period, the oscillation is super-harmonic.
No Bifurcation and Stable System Bifurcation and Unstable System
(Fig-4 – Phase Plot of Stable and Unstable System)
V. RESULTS AND DISCUSSION
A Single Hinged Articulated Tower with following structural parameters was subjected to longer duration (2000 sec.) of
moderate regular sea wave load having height as 2.15m and time period as 4.69 sec[7]. Wave load was applied at 0 sec. and
after the excitation impact due to wave load got stabilized due to hydrodynamic damping, Northridge Earthquake load was
applied at 498.4 sec. To assess the dynamic behavior of Tower at various stages, analysis was done for a longer duration of
2000 sec. of wave load.
Height of Tower (l) 400 m
Water depth (d) 350 m
Height of Ballast (HBL ) 120 m
Height of Buoyancy chamber (H) 70 m
Position of Buoyancy chamber (PBC ) 310 m
X
Ẋ
X
Ẋ

ISSN: 2319-8753
International Journal of Innovative Research in Science,
Engineering and Technology
(An ISO 3297: 2007 Certified Organization)
Vol. 2, Issue 11, November 2013
Copyright to IJIRSET www.ijirset.com 6086
The Responses obtained in form of various parameters are given in Table I, II & III. The Time period of SHAT was
obtained as 29.4 sec.
Table- I – MAXIMUM AND MINIMUM VALUES OF RESPONSES
Heel
Angle
(deg/rad.)
Deck
Displ.
(m)
Time
(sec.)
Shear
Force
(N)
Axial
Force
(N)
Bending
Moment
(Nm)
Base Shear
Force
(N)
Base
Axial Force
(N) Maxm 3.23 deg./
0.5665E-
01rad
0.2265E+2 505.50 0.9341E+7 0.5108E+8 0.1961E+12 0.9338E+7 0.1653E+7
Minm -4.34deg
/-0.7618E-
01rad
-0.3044E+2 498.78 -0.1021E+8 -0.2412E+9 -0.2069E+12 -0.1006E+8 -0.2200E+9
Table- II – MEAN, RMS AND STANDARD DEVIATION OF RESPONSES
Mean RMS SD
Heel Angle(deg.) 0.1264E-03 0.2420E-01 0.2419E-01
Tip Displacement(m) 0.5059E-01 0.9675E+01 0.9674E+01
Base Shear Force(N) 0.2032E+05 0.1432E+07 0.1432E+07
Base Axial Force(N) -0.1924E+09 0.1926E+09 0.8092E+07
Table- III – STABILIZING AND DESTABILIZING MOMENTS
Stabilizing
Moment(Nm)
Maxm
. Moment due
to Drag and
Inertia(Nm)
Moment of Tower
Weight and
Deck(Nm)
Total Destabilizing
Moment(Nm)
Net Stabilizing
Moment(Nm)
8.65E+10 3.65E+09 2.87E+10 3.23E+10 5.42E+10
Time History plots for Heel angle rotation and Tip displacement for complete duration of wave loading were obtained and
are given below at Fig.5 - 6. Similarly, Time History plots for Heel Angle rotation from 0 - 450 sec. and 450 – 1100 sec.
were obtained to provide an enlarged view of Time History, these are given at Fig.7-8.

ISSN: 2319-8753
International Journal of Innovative Research in Science,
Engineering and Technology
(An ISO 3297: 2007 Certified Organization)
Vol. 2, Issue 11, November 2013
Copyright to IJIRSET www.ijirset.com 6087
(Fig.5- Time History plot for Heel Angle rotation for 2000 sec.)
(Fig.6- Time History plot for Deck Displacements for 2000 sec.)
-1.0E-01
-8.0E-02
-6.0E-02
-4.0E-02
-2.0E-02
0.0E+00
2.0E-02
4.0E-02
6.0E-02
8.0E-02
0 200 400 600 800 1000 1200 1400 1600 1800 2000
TIME (sec.)
AN
GU
LAR
A
NG
ULA
R R
OT
AT
ION
(ra
d.)
Time History for Regular Wave H-2.15m, T-4.69s - Heel Angle Rotation
-4.0E+01
-3.0E+01
-2.0E+01
-1.0E+01
0.0E+00
1.0E+01
2.0E+01
3.0E+01
0 200 400 600 800 1000 1200 1400 1600 1800 2000
TIME (sec.)
AN
GU
LAR
A
NG
ULA
R R
OT
AT
ION
(ra
d.)
Time History for Regular Wave H-2.15m, T- 4.69s - Tip Displacement

ISSN: 2319-8753
International Journal of Innovative Research in Science,
Engineering and Technology
(An ISO 3297: 2007 Certified Organization)
Vol. 2, Issue 11, November 2013
Copyright to IJIRSET www.ijirset.com 6088
(Fig.7- Time History plot for Heel Angle Rotation from 0 – 450 sec.)
(Fig.8- Time History plot for Heel Angle Rotation from 450 – 1100 sec.)
Fig.5 and Fig.6 show the Time History plots for complete duration of 2000 sec. of loading. Fig.7 and Fig.8 give the
enlarged view from 0 – 450 sec. and 450 – 1100 sec. As the motion got stabilized after 300 sec. of wave load, the shape of
-1.0E-02
-5.0E-03
0.0E+00
5.0E-03
1.0E-02
0 50 100 150 200 250 300 350 400 450
TIME (sec.)
AN
GU
LAR
A
NG
ULA
R R
OT
AT
ION
(ra
d.)
Time History for Regular Wave H-2.15m, T-4.69s - Heel Angle Rotation
-8.0E-02
-6.0E-02
-4.0E-02
-2.0E-02
0.0E+00
2.0E-02
4.0E-02
6.0E-02
450 500 550 600 650 700 750 800 850 900 950 1000 1050 1100
TIME (sec.)
AN
GU
LAR
A
NG
ULA
R R
OT
AT
ION
(ra
d.)
Time History for Regular Wave H-2.15m, T-4.69s - Heel Angle Rotation
ISSN: 2319-8753
International Journal of Innovative Research in Science,
Engineering and Technology
(An ISO 3297: 2007 Certified Organization)
Vol. 2, Issue 11, November 2013
Copyright to IJIRSET www.ijirset.com 6089
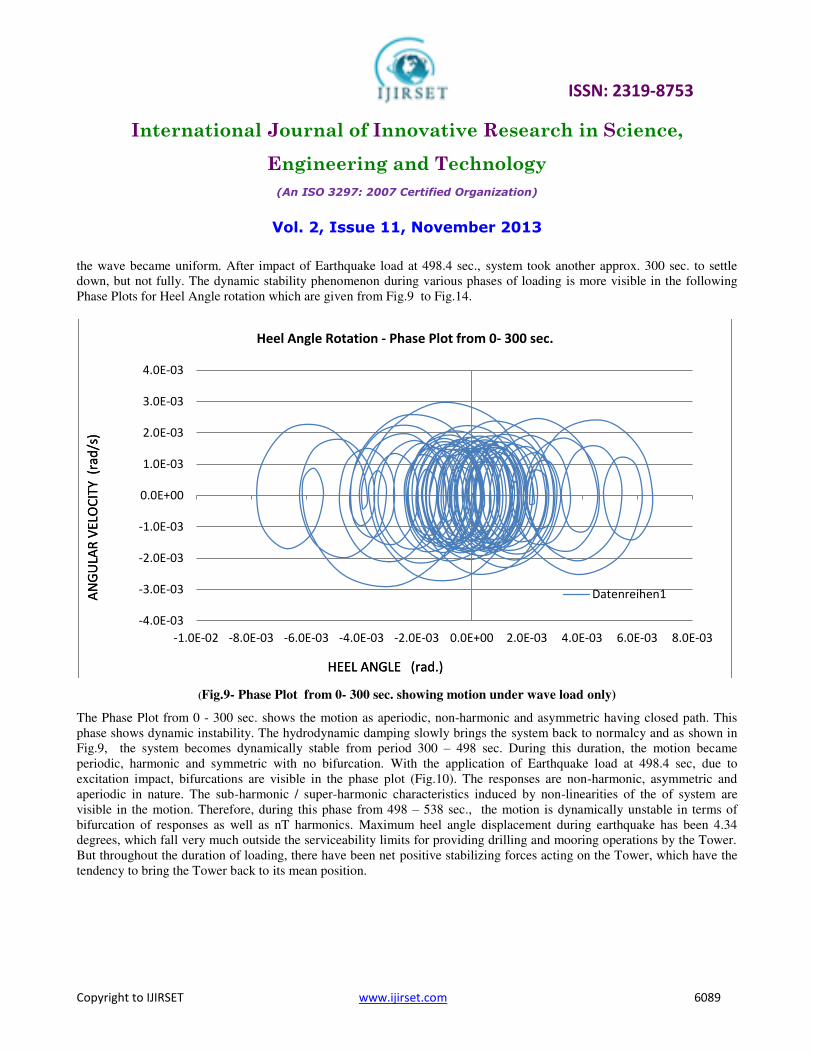
the wave became uniform. After impact of Earthquake load at 498.4 sec., system took another approx. 300 sec. to settle
down, but not fully. The dynamic stability phenomenon during various phases of loading is more visible in the following
Phase Plots for Heel Angle rotation which are given from Fig.9 to Fig.14.
(Fig.9- Phase Plot from 0- 300 sec. showing motion under wave load only)
The Phase Plot from 0 - 300 sec. shows the motion as aperiodic, non-harmonic and asymmetric having closed path. This
phase shows dynamic instability. The hydrodynamic damping slowly brings the system back to normalcy and as shown in
Fig.9, the system becomes dynamically stable from period 300 – 498 sec. During this duration, the motion became
periodic, harmonic and symmetric with no bifurcation. With the application of Earthquake load at 498.4 sec, due to
excitation impact, bifurcations are visible in the phase plot (Fig.10). The responses are non-harmonic, asymmetric and
aperiodic in nature. The sub-harmonic / super-harmonic characteristics induced by non-linearities of the of system are
visible in the motion. Therefore, during this phase from 498 – 538 sec., the motion is dynamically unstable in terms of
bifurcation of responses as well as nT harmonics. Maximum heel angle displacement during earthquake has been 4.34
degrees, which fall very much outside the serviceability limits for providing drilling and mooring operations by the Tower.
But throughout the duration of loading, there have been net positive stabilizing forces acting on the Tower, which have the
tendency to bring the Tower back to its mean position.
-4.0E-03
-3.0E-03
-2.0E-03
-1.0E-03
0.0E+00
1.0E-03
2.0E-03
3.0E-03
4.0E-03
-1.0E-02 -8.0E-03 -6.0E-03 -4.0E-03 -2.0E-03 0.0E+00 2.0E-03 4.0E-03 6.0E-03 8.0E-03
Heel Angle Rotation - Phase Plot from 0- 300 sec.
Datenreihen1
HEEL ANGLE (rad.)
AN
GU
LAR
VE
LOC
ITY
(ra
d/s
)
HEEL ANGLE (rad.)
AN
GU
LAR
VE
LOC
ITY
(ra
d/s
)

ISSN: 2319-8753
International Journal of Innovative Research in Science,
Engineering and Technology
(An ISO 3297: 2007 Certified Organization)
Vol. 2, Issue 11, November 2013
Copyright to IJIRSET www.ijirset.com 6090
(Fig.10- Phase Plot from 300- 498 sec. showing Stable motion under wave load only)
(Fig.11- Phase Plot from 498-538 sec. showing Unstable motion under wave and Earthquake load)
-2.0E-03
-1.5E-03
-1.0E-03
-5.0E-04
0.0E+00
5.0E-04
1.0E-03
1.5E-03
2.0E-03
-2.0E-03 -1.5E-03 -1.0E-03 -5.0E-04 0.0E+00 5.0E-04 1.0E-03 1.5E-03 2.0E-03
Heel Angle Rotation - Phase Plot from 300- 498 sec.
Datenreihen1
HEEL ANGLE (rad.)
AN
GU
LAR
VE
LOC
ITY
(ra
d/s
)
HEEL ANGLE (rad.)
AN
GU
LAR
VE
LOC
ITY
(ra
d/s
)
-1.0E-02
-8.0E-03
-6.0E-03
-4.0E-03
-2.0E-03
0.0E+00
2.0E-03
4.0E-03
6.0E-03
8.0E-03
-1.0E-01 -8.0E-02 -6.0E-02 -4.0E-02 -2.0E-02 0.0E+00 2.0E-02 4.0E-02 6.0E-02 8.0E-02
Heel Angle Rotation - Phase Plot from 498 -538 sec.
Datenreihen1
HEEL ANGLE (rad.)
AN
GU
LAR
VE
LOC
ITY
(ra
d/s
)
HEEL ANGLE (rad.)
AN
GU
LAR
VE
LOC
ITY
(ra
d/s
)

ISSN: 2319-8753
International Journal of Innovative Research in Science,
Engineering and Technology
(An ISO 3297: 2007 Certified Organization)
Vol. 2, Issue 11, November 2013
Copyright to IJIRSET www.ijirset.com 6091
(Fig.12- Phase Plot from 538-838 sec. showing motion trying to stabilize after impact of Earthquake is over)
The motion as shown in Fig.12, from 538 – 838 sec. shows recovery from excitation impact of Earthquake. The motion
although seems to be non-harmonic, aperiodic and asymmetric, but seems to be moving towards limit cycle. The phase plot
shows the dynamically unstable period.
(Fig.13- Phase Plot from 838-1000 sec. showing motion trying to further calm down after Earthquake)
Motion in above Fig.13 shows the periodic behavior of motion with closed path and without bifurcations. The phase from
838 – 1000 sec. shows the dynamically stable period.
-1.2E-02
-1.0E-02
-8.0E-03
-6.0E-03
-4.0E-03
-2.0E-03
0.0E+00
2.0E-03
4.0E-03
6.0E-03
8.0E-03
-4.0E-02 -2.0E-02 0.0E+00 2.0E-02 4.0E-02 6.0E-02
Heel Angle Rotation - Phase Plot from 538 -838 sec.
Datenreihen1
HEEL ANGLE (rad.)
AN
GU
LAR
VE
LOC
ITY
(ra
d/s
)
HEEL ANGLE (rad.)
AN
GU
LAR
VE
LOC
ITY
(ra
d/s
)
-2.5E-03
-2.0E-03
-1.5E-03
-1.0E-03
-5.0E-04
0.0E+00
5.0E-04
1.0E-03
1.5E-03
2.0E-03
2.5E-03
-3.00E-03 -2.00E-03 -1.00E-03 0.00E+00 1.00E-03 2.00E-03 3.00E-03
Heel Angle Rotation - Phase Plot from 838 to 1000 sec.
Datenreihen1
HEEL ANGLE (rad.)
AN
GU
LAR
VE
LOC
ITY
(ra
d/s
)
HEEL ANGLE (rad.)
AN
GU
LAR
VE
LOC
ITY
(ra
d/s
)
HEEL ANGLE (rad.)
AN
GU
LAR
VE
LOC
ITY
(ra
d/s
)
HEEL ANGLE (rad.)
AN
GU
LAR
VE
LOC
ITY
(ra
d/s
)
STABLE PHASE

ISSN: 2319-8753
International Journal of Innovative Research in Science,
Engineering and Technology
(An ISO 3297: 2007 Certified Organization)
Vol. 2, Issue 11, November 2013
Copyright to IJIRSET www.ijirset.com 6092
(Fig.14- Phase Plot from 1900 - 2000 sec. showing Stabilized motion under Wave load after recent Earthquake)
Fig. 14 shows that after longer duration of loading, the motion under influence of regular wave becomes dynamically stable
after settling down with the excitation impact of Northridge Earthquake. The phase plot shows the motion as harmonic,
periodic and symmetric.
VI. CONCLUSIVE REMARKS ON STABILITY ANALYSIS OF SHAT
In addition to above load case, the SHAT model was also subjected to a vide variety of regular waves with different
Earthquake loading combinations. Few conclusions drawn are given below:
1. It has been seen that subsequent to application of wave load at 0 sec., due to damping effects, the impact of regular
wave excitations gradually die out over a period of approx. 8-10 times the time period of the structure.
2. In all the regular wave cases evaluated under the study, it has been seen that dynamic instability is visible during the
initial period pertaining to onset of waves or period pertaining to Earthquake loading. During these periods / shorter
duration loadings, system is non-harmonic, asymmetric and aperiodic. Sub-harmonics / super-harmonic are existent in
system and bifurcations are easily visible in the phase plots confirming the dynamic instability.
3. With the passage of time, the hydrodynamic dampening effects reduce excitation responses. During larger duration
loadings, the motion becomes harmonic, periodic and symmetric. No bifurcations are visible on the phase plots and the
structure show dynamic stability. The larger size waves dampen out excitations much early as compared to smaller size
waves and system becomes dynamically stable at an early duration which gets clearly visible in the Phase plots.
4. The net positive stabilizing forces acting in the system bring the SHAT back to its mean position, thereby assuring
stability in all respects.
REFERENCES
[1] Banik, A.K.and Datta T.K “Stochastic response and Stability of Single leg Articulated Tower”, Proceeding of International Conference on Offshore Mechanics and Arctic Engineering (OMAE), Cancun, Mexico, June 8-13, pp. 431-438, 2003
-2.0E-03
-1.5E-03
-1.0E-03
-5.0E-04
0.0E+00
5.0E-04
1.0E-03
1.5E-03
2.0E-03
-1.50E-03 -1.00E-03 -5.00E-04 0.00E+00 5.00E-04 1.00E-03 1.50E-03
Datenreihen1
HEEL ANGLE (rad.)
AN
GU
LAR
VE
LOC
ITY
(ra
d/s
)
HEEL ANGLE (rad.)
AN
GU
LAR
VE
LOC
ITY
(ra
d/s
)
HEEL ANGLE (rad.)
AN
GU
LAR
VE
LOC
ITY
(ra
d/s
)
HEEL ANGLE (rad.)
AN
GU
LAR
VE
LOC
ITY
(ra
d/s
)
HEEL ANGLE (rad.)
AN
GU
LAR
VE
LOC
ITY
(ra
d/s
)
HEEL ANGLE (rad.)
AN
GU
LAR
VE
LOC
ITY
(ra
d/s
)
Heel Angle Rotation - Phase Plot from 1900 - 2000 sec..

ISSN: 2319-8753
International Journal of Innovative Research in Science,
Engineering and Technology
(An ISO 3297: 2007 Certified Organization)
Vol. 2, Issue 11, November 2013
Copyright to IJIRSET www.ijirset.com 6093
[2] Banik, A.K. and Datta, T.K., “Stability Analysis of an Articulated Loading Platform in Regular Sea” Journal of Computational
Nonlinear Dynamics, ASME, Vol. 3, Issue 1, 011013 (9 pages) doi:10.1115/1.2815332, 2009.
[3] Banik, A.K. , “Dynamic Stability Analysis of Compliant Offshore Structures”, PhD. Thesis, IIT, Delhi, 2004
[4] Chakrabarti S.K., “Stability Analysis of Interaction of an articulated tower with waves”, Proceedings of Fluid interaction, Heikidiki,
Greece. Vol.1, pp.281-292, 2001.
[5] Chakrabarti, S. And Cotter, D., “Motion Analysis of Articulated Tower” Journal of Waterway, Port, Coastal and Ocean Division,
ASCE, Vol.105, pp.281-292, 1979.
[6] Islam Saiful, A.B.M, “Nonlinear Dynamic Behaviour of Fully Coupled SPAR Platform”, PhD. Thesis, Deptt. Of Civil Engg., University of Malaya, Kuala Lumpur, 2013.
[7] Jameel, M., & Ahmad, S., “Fatigue Reliability Assessment of Coupled Spar- Mooring System”. Paper presented at the ASME 30th
International Conference on Ocean, Offshore and Arctic Engineering(OMAE 2011-49687), Rotterdam, Netherlands, 2011.
[8] Mallik, A.K. and Bhattacharjee, J.K., “Stability Problems in Applied Mechanics”. Narosa Publishing House, Chapter 2 & 3, 2005.