2.1st.AIAA Aerodynamic Measurement Technology and … · Example results of applying WlCS to a...
24
AIAA 2000-2383 IMPLEMENTATION OF THE WICS WALL INTERFERENCE CORRECTION SYSTEM AT THE NATIONAL TRANSONIC FACILITY Venkit lyer, Lockheed Martin Joel L. Everhart, NASA Langley Research Center Pamela J. Bir, ViGYAN, Inc. NASA Langley Research Center Hampton, VA 23681 and Norbert Ulbrich, Sverdrup Technology, Inc. NASA Ames Research Center Moffett Field, CA 94035 2.1st.AIAA Aerodynamic Measurement Technology and Ground Testing Conference 19-22 June 2000 / Denver, CO For permission to copy or republish, contact the American Institute of Aeronautics and Astronautics 1801 Alexander Bell Drive, Suite 500, Reston, VA 20191 https://ntrs.nasa.gov/search.jsp?R=20000057509 2018-09-07T19:59:03+00:00Z
Transcript of 2.1st.AIAA Aerodynamic Measurement Technology and … · Example results of applying WlCS to a...
AIAA 2000-2383
IMPLEMENTATION OF THE WICS WALL
INTERFERENCE CORRECTION SYSTEM AT THENATIONAL TRANSONIC FACILITY
Venkit lyer, Lockheed Martin
Joel L. Everhart, NASA Langley Research Center
Pamela J. Bir, ViGYAN, Inc.
NASA Langley Research Center
Hampton, VA 23681
and
Norbert Ulbrich, Sverdrup Technology, Inc.NASA Ames Research Center
Moffett Field, CA 94035
2.1st.AIAA AerodynamicMeasurement Technology
and Ground Testing Conference19-22 June 2000 / Denver, CO
For permission to copy or republish, contact the American Institute of Aeronautics and Astronautics
1801 Alexander Bell Drive, Suite 500, Reston, VA 20191
https://ntrs.nasa.gov/search.jsp?R=20000057509 2018-09-07T19:59:03+00:00Z
AIAA 2000-2383
IMPLEMENTATION OF THE WICS WALL INTERFERENCE CORRECTION
SYSTEM AT THE NATIONAL TRANSONIC FACILITY
Venkit Iyer', Lockheed Martin
Joel L. Everhart*, NASA Langley Research CenterPamela J. Bir*, ViGYAN, Inc.
and
Norbert Ulbrich _, Sverdrup Technology, Inc.
ABSTRACT
The Wall Interference Correction System (WICS) is
operational at the National Transonic Facility (NTF) of
NASA Langley Research Center (NASA LaRC) forsemispan and full span tests in the solid wall (slots
covered) configuration. The method is based on thewall pressure signature method for computing
corrections to the measured parameters. It is an
adaptation of the WICS code operational at the 12 ftpressure wind tunnel (12ft PWT) of NASA Ames
Research Center (NASA ARC). This paper discussesthe details of implementation of WlCS at the NTF
including tunnel calibration, code modifications fortunnel and support geometry, changes made for the
NTF wall orifices layout, details of interfacing with thetunnel data processing system, and post-processing of
results. Example results of applying WlCS to a semi-
span test and a full span test are presented. Comparisonwith classical correction results and an analysis of
uncertainty in the corrections are also given. As aspecial application of the code, the Mach number
calibration data from a centerline pipe test wascomputed by WICS. Finally, future work for
expanding the applicability of the code including on-line implementation is discussed.
INTRODUCTION
The National Transonic Facility (NTF) was designedfor high Reynolds number testing in a cryogenic,
pressurized environment with slotted tunnel walls toalleviate transonic wall interference effects. Recently,
the facility has developed the capability to run tests on
large high-lift models at subsonic speeds with thetunnel wall slots covered. The need for an accurate and
reliable method to compute wall interferencecorrections for full span and semispan testing under
solid wall conditions became apparent. Stringentaccuracy requirements on corrected equivalent free-air
values of measured parameters limit the use of
classical corrections except at low lift conditions.
The wall interference code WICS _ is based on the wall
signature method of Hackett 2 to compute corrections for
solid-walled tunnels. It has been operational at theAmes 12 ft pressurized wind tunnel for several years. In
this method, the aerodynamic test article is represented
by a discrete number of singularities whose strengthsare computed by a global fit of the tunnel wall pressures
and the measured forces and moments. Subsequently,the code computes the averaged blockage and AOA
corrections based on interpolation from databases ofperturbation velocities or influence coefficients. These
corrections are then applied to the tunnel parameters toapproximate the equivalent free-air flow field. In
addition, the code provides the wall interferencevariation in the vicinity of the model (which is not
obtainable from simpler classical methods). Theadvantage of the method is that it is fast, robust and
suited for real-time application; therefore, it wasselected for implementation at the NTF.
The method is currently operational at NTF and has
been successfully applied to recent semispan and fullspan tests. This paper presents a summary of tunnelcalibration activities, WICS implementation for semi-
span and full span tests, and a sample of results
obtained. Work reported here falls under one of the
• Aeronautical Engineer, Senior Member AIAA.t Research Engineer, Senior Member AIAA.
Research Engineer. Member AIAA.Senior Aerodynamicist.
Copyright © 2000 by the American Institute of Aeronautics and Astronautics, Inc. No copyright is asserted in the United States under Title 17,U.S Code. The U.S. Government has a royalty-free license to exercise all rights under the copyright claimed herein for Government Purposes.All other rights are reserved by the copyright owner.

four mainareasof theNTF characterizationeffortdescribedinReference3.
NTFIMPLEMENTATION ISSUES
Conversion of WICS from the ARC 12 ft PWT
implementation to an NTF version required the
completion of several related tasks. Tunnel emptycalibration under closed slots condition and installation
of a new upstream reference pressure measurement
system and calibration were done. The new highaccuracy flow reference system (FRS) became
necessary since the plenum reference pressure systemused for slots open tests is not valid for closed slotsapplications.
Supporting tests were conducted to calibrate the tunnel
at empty condition as well as with a centerline pipe, andwith the model support in place (for full span models).The centerline pipe calibration provided the Mach
number correction using the FRS system. This Machnumber correction provides the correct tunnel referencevelocity and Mach number at model center of rotation.
An interface program was developed to handle variousfacility-dependent conversions for WlCS.Modifications to the WICS code itself were done to
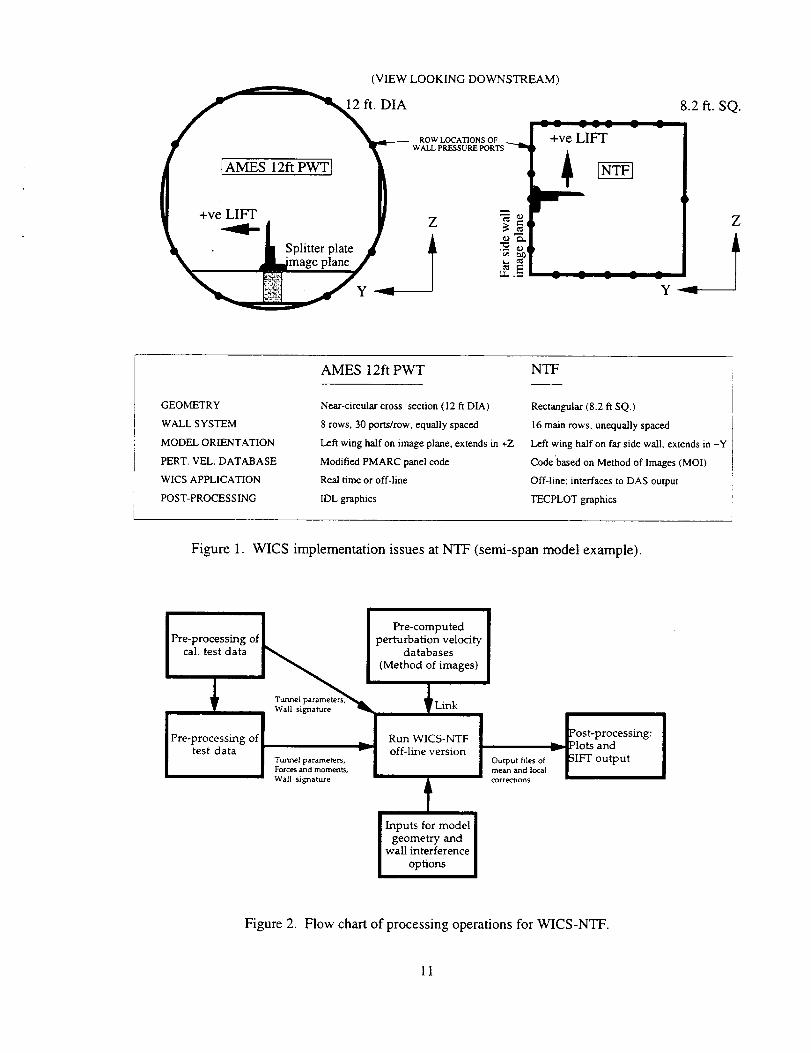
address issues such as tunnel geometry, supportgeometry and kinematics, image plane differences,tunnel calibration and post-processing. Figure 1 shows
a concise description of changes made for semispanapplication as an example.
Since the wall signature is a key input for WICS, the
electronically-scanned pressure (ESP) measurementsfrom the tunnel wall ports are required at the same levelof accuracy as the model measurements. An ESP
health monitoring system was put in place to monitorreference pressure ports and signal when re-calibrationswere necessary. The wall ESP system was held to a0.1% of full scale standard. This translated into a
+ 0.0025 psi variance for the differential pressure
measurements on the wall ESP modules. For example,averages of 10 samples of reference pressures weretaken every 15 seconds and used to alert a calibration
drift. The measured wall data were also displayed and
monitored during the test to ensure quality wallsignature inputs into WlCS.
Data quality is an important issue for the tunnel emptydata since it serves as the basis for the tare corrections
to the closed slot tunnel tests. Detailed analysis of the
quality and consistency of tunnel empty data wasperformed to remove outliers and identify calibration
drifts. Scaling methods were employed to improve the
quality of high noise data under low Q conditions. Thetunnel empty database currently consists of a test matrix
of 12 points with 4 Mach numbers (0.1, 0.2, 0.3, 0.45)
and 3 total pressure values (PT = 15, 52, 89 psi). Thecalibration database for the model support also 'covers
the above Mach number and PT range with theadditional variable of sting support system angle of
attack. Future calibrations will expand this database toa larger envelope.
For semispan tests, the original WICS code was
designed to be applied to a near-circular geometry with
an image plane and with the model mounted vertically.At NTF, the image plane is on the far side wall (i.e., the
left wall when looking from upstream of test section)
and the model is mounted horizontally. Thecorresponding changes have been made in the code.
The original code assumes the 12ft PWT wall layout,consisting of 8 rows on the wall with each row havingequal number of equally distributed ports. At NTF,more rows are available and a subset of the entire wall
set is used to input the wall signature. The database
generation program used for WICS-NTF is designed to
accommodate specific port selections and specificationof fictitious ports to fit the fixed number of ports per
row requirement in the code. The fictitious ports areexcluded during computation of the corrections. The
implementation of these changes led to the
development of a new pre-processing procedure toprepare data for running the code.
Since the NTF tunnel has a rectangular cross-section,
the method of images (MOI) can be used to generatethe perturbation velocity databases (see next section for
more details). This is much simpler than the original
method of using a modified panel code to generatethem. A new program was developed to generate thedatabases in a format identical to the previous modified
PMARC 4 panel method. The resulting databases are
more accurate and has none of the convergenceproblems sometimes found in the panel method.
Post-processing of WICS-NTF output is done usingTECPLOT _ graphics. The corrections and other
diagnostic data are output in files in TECPLOT _
format. A number of plot scripts using data extraction
programs and layout files are available to quicklypresent data in a number of standard plots. The code
was modified to implement these changes.
Figure 2 shows a flow chart of processing operationsfor WlCS-NTF. The tunnel calibration and database
generation processes are done prior to a test. Currentimplementation is for a post-run or end-of-shift
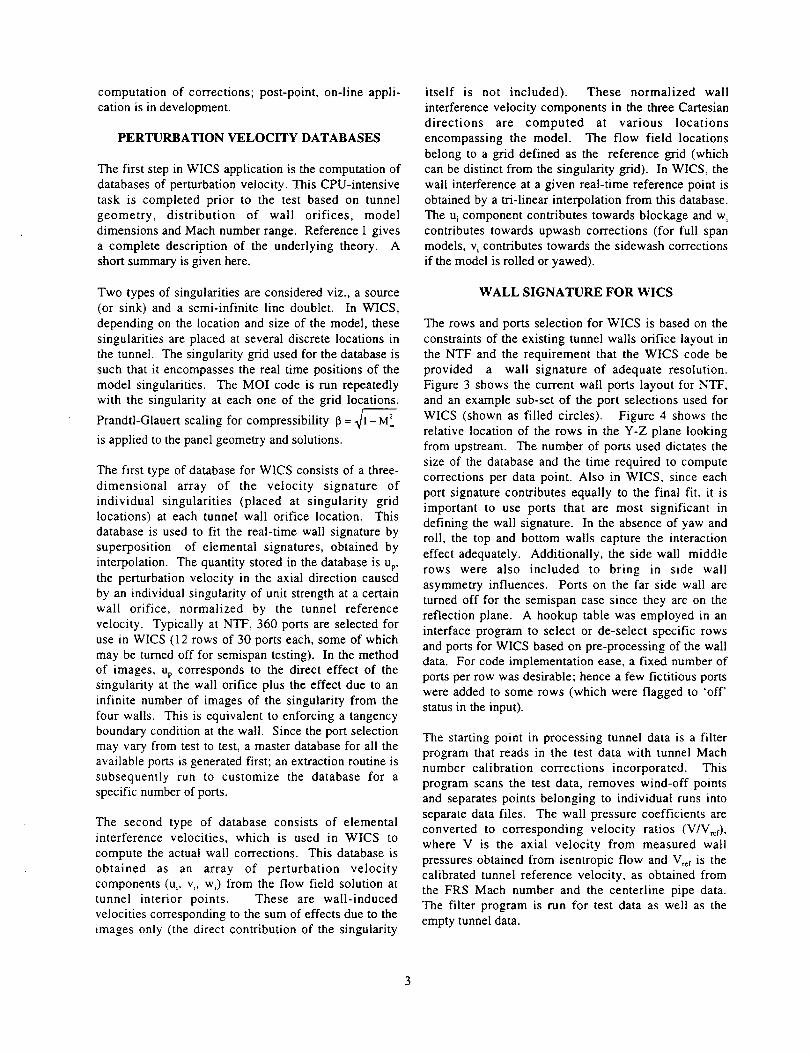
computationof corrections;post-point,on-lineappli-cationisindevelopment.
PERTURBATION VELOCITY DATABASES
The first step in WICS application is the computation ofdatabases of perturbation velocity. This CPU-intensive
task is completed prior to the test based on tunnel
geometry, distribution of wall orifices, modeldimensions and Mach number range. Reference I gives
a complete description of the underlying theory. Ashort summary is given here.
Two types of singularities are considered viz., a source(or sink) and a semi-infinite line doublet. In WICS,
depending on the location and size of the model, thesesingularities are placed at several discrete locations in
the tunnel. The singularity grid used for the database is
such that it encompasses the real time positions of themodel singularities. The MOI code is run repeatedly
with the singularity at each one of the grid locations.
Prandtl-Glauert scaling for compressibility 13= _!- M 2_
is applied to the panel geometry and solutions.
The first type of database for WICS consists of a three-
dimensional array of the velocity signature of
individual singularities (placed at singularity gridlocations) at each tunnel wall orifice location. Thisdatabase is used to fit the real-time wall signature by
superposition of elemental signatures, obtained by
interpolation. The quantity stored in the database is up,the perturbation velocity in the axial direction caused
by an individual singularity of unit strength at a certainwall orifice, normalized by the tunnel reference
velocity. Typically at NTF, 360 ports are selected for
use in WICS (12 rows of 30 ports each, some of whichmay be turned off for semispan testing). In the method
of images, up corresponds to the direct effect of thesingularity at the wall orifice plus the effect due to aninfinite number of images of the singularity from the
four walls. This is equivalent to enforcing a tangencyboundary condition at the wall. Since the port selectionmay vary from test to test, a master database for all the
available ports is generated first; an extraction routine is
subsequently run to customize the database for aspecific number of ports.
The second type of database consists of elementalinterference velocities, which is used in WlCS to
compute the actual wall corrections. This database is
obtained as an array of perturbation velocitycomponents (u_, v, w,) from the flow field solution at
tunnel interior points. These are wall-inducedvelocities corresponding to the sum of effects due to theimages only (the direct contribution of the singularity
itself is not included). These normalized wallinterference velocity components in the three Cartesian
directions are computed at various locations
encompassing the model. The flow field locations
belong to a grid defined as the reference grid (whichcan be distinct from the singularity grid). In WICS, the
wall interference at a given real-time reference point isobtained by a tri-linear interpolation from this database.
The ui component contributes towards blockage and w,contributes towards upwash corrections (for full spanmodels, vi contributes towards the sidewash corrections
if the model is rolled or yawed).
WALL SIGNATURE FOR WICS
The rows and ports selection for WICS is based on theconstraints of the existing tunnel walls orifice layout in
the NTF and the requirement that the WICS code be
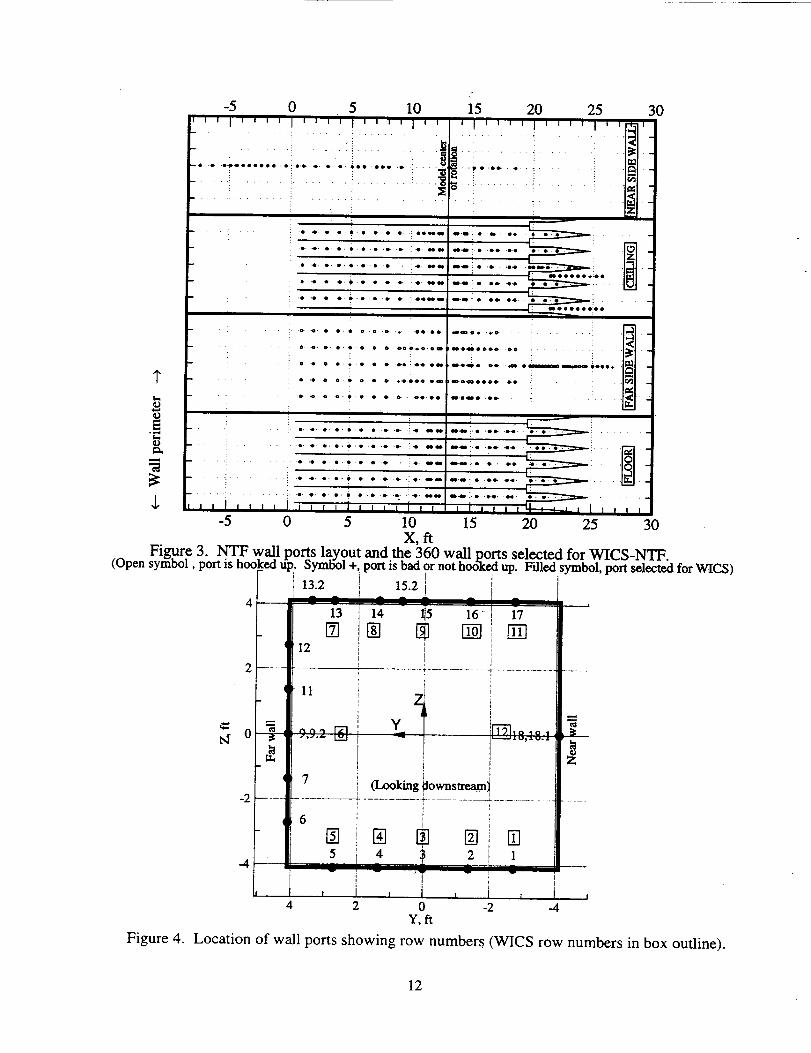
provided a wall signature of adequate resolution.Figure 3 shows the current wall ports layout for NTF,
and an example sub-set of the port selections used forWICS (shown as filled circles). Figure 4 shows the
relative location of the rows in the Y-Z plane lookingfrom upstream. The number of ports used dictates the
size of the database and the time required to computecorrections per data point. Also in WlCS, since each
port signature contributes equally to the final fit, it is
important to use ports that are most significant indefining the wall signature. In the absence of yaw androll, the top and bottom walls capture the interaction
effect adequately. Additionally, the side wall middle
rows were also included to bring in side wall
asymmetry influences. Ports on the far side wall areturned off for the semispan case since they are on the
reflection plane. A hookup table was employed in aninterface program to select or de-select specific rows
and ports for WICS based on pre-processing of the walldata. For code implementation ease, a fixed number ofports per row was desirable; hence a few fictitious ports
were added to some rows (which were flagged to 'off'status in the input).
The starting point in processing tunnel data is a filter
program that reads in the test data with tunnel Machnumber calibration corrections incorporated. This
program scans the test data, removes wind-off pointsand separates points belonging to individual runs into
separate data files. The wall pressure coefficients areconverted to corresponding velocity ratios (V/Vrcf),
where V is the axial velocity from measured wallpressures obtained from isentropic flow and Vta is thecalibrated tunnel reference velocity, as obtained from
the FRS Mach number and the centerline pipe data.
The filter program is run for test data as well as theempty tunnel data.

Subsequently,aninterfaceprogramis runtoproducefilesin theWlCSinputformat.Thefollowingdataextractionandconversiontakesplacein theinterfaceprogram:test,run,pointinformation;runparametersintheproperunits(Pr,Pr_f,V_f,M_:f,Qr_f);pointdata(AOA,lift, dragandpitchingmoment)in theproperunits;wallorificevaluesof (V/Vref) forthe360selectedportswithsettingof goodor badflagsfor theportsbasedonanalysisofdata.
Notethattheportflagsfor emptytunneldataandagiventestrundatasetarecombinedsothatthe final'on' statusof aportis possibleonlyif bothdatasetflagsagree.Thisis toensurethatsubtractionof tunnelemptywallsignatureis doneproperlyin WICS.Forfull spantests,themodelsupportcalibrationdataandinterferenceresultsareadditionallyrequired.
THE WICS CORRECTION METHODOLOGY
Details of theory, formulation and implementation ofWlCS are given in References 1 and 5. Here, we
present a summary relevant to the NTF semispan
version. Additional considerations for full span modelsare also noted.
After reading the test data and empty tunnel data, the
code does an interpolation from the empty tunnel datato obtain the empty tunnel signature exactly
corresponding to each test point Mach number and Px.Subsequently, this signature is subtracted from the test
point values thereby eliminating specific wall orificevariations, tunnel geometry and tunnel wall boundary
layer effects. Figure 5a shows a contour plot for this'tared' wall signature at the top and bottom walls forone representative test point.
The problem now reduces to one of computing thestrength of the singularities representing the model bysuperposition of the effect of each individual
singularity. Since the number of wall orifices is usually
much more than the number of unknowns, the system is
over-specified and hence lends itself to a least squarefitting procedure.
The strength of the wing doublets as a group can bedirectly computed from the measured lift from theKutta-Joukowski formula e. If the model has a tailsurface, another row of doublets is defined at the tail
1/4 chord line to represent the tail lifting effect. In this
case, the pitching moment is also used in the equation
to determine the strength of the tail group of linedoublets. Once the doublet strength as a group is
established, the distribution of strengths of individualdoublets in the span direction is based on the input (or
optionally, computed) weight factors which defines thewing loading.
The cumulative wall signature of the line doublets is
then calculated. The perturbation database type 1 fordoublets is used here for interpolation depending on the
real time position of each doublet singularity. Linearaddition of effect due to each singularity yields the
combined effect due to doublets. The resulting wallsignature is then subtracted form the 'tared' wall
signature. The remaining portion of the signature is dueto the blockage effect from the model volume and from
the wake (represented by sources and sinks). Again,grouping of singularities results in two unknowns viz.,
strength of the source-sink pair and the combinedstrength of the wake sources. These two unknowns are
determined in a least square fitting procedure such thatthe computed or 'fit' signature is the best fit of the wallsignature in a global sense. Figure 5b shows a contourplot of the 'fit' signature (with the effect of doublets
added back on), which should be a good approximationto the real signature shown in Figure 5a.
Note that WICS does not compute the fit row by row;
the fit is performed in a global sense. The advantage ofthis approach is that a few bad ports do not adversely
affect the computation. The code has a quality check ofthe wall signature, which identifies and discards outliers
in a second pass (based on 3_ limits obtained from the
fit in the first pass).
Finally, once all the singularity strengths are computed,interpolation from the database type 2 is used tocompute corrections at any location in the flow field
within the reference grid. The code also does a straightor weighted averaging of the corrections along theactual fuselage axis, wing 3/4 chord line, and otherinput reference lines to determine mean corrections. If
the axial component of the averaged interference fieldis u_ and the V_r is the measured tunnel reference
velocity, then blockage factor (including solid and wake
blockages) is defined as e = u i / Vref. If Mrc f is the
measured tunnel reference Mach number and Qref the
dynamic pressure, the Mach number and dynamicpressure corrections are computed to first orderaccuracy as
Similarly, for a model mounted horizontally, if w_ is the
averaged vertical component of the interference field,the angle of attack correction is computed as
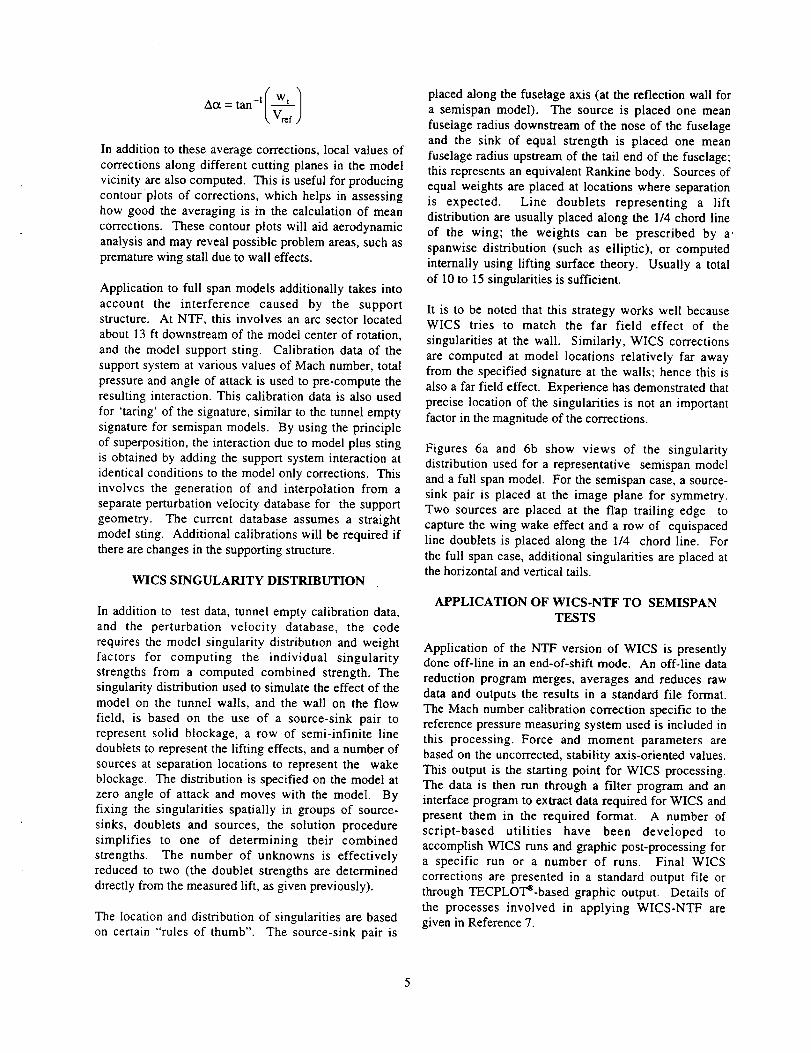
Inadditiontotheseaveragecorrections,localvaluesofcorrectionsalongdifferentcuttingplanesin themodelvicinityarealsocomputed.Thisisusefulforproducingcontourplotsof corrections,whichhelpsin assessinghowgoodtheaveragingis in thecalculationof meancorrections.Thesecontourplotswillaidaerodynamicanalysisandmayrevealpossibleproblemareas,suchasprematurewingstallduetowalleffects.
Applicationtofull spanmodelsadditionallytakesintoaccountthe interferencecausedby the supportstructure.AtNTF,thisinvolvesanarcsectorlocatedabout13ft downstreamof themodelcenterofrotation,andthemodelsupportsting. Calibrationdataof thesupportsystematvariousvaluesof Machnumber,totalpressureandangleofattackisusedtopre-computetheresultinginteraction.Thiscalibrationdataisalsousedfor 'taring'ofthesignature,similartothetunnelemptysignatureforsemispanmodels.Byusingtheprincipleofsuperposition,theinteractionduetomodelplusstingisobtainedbyaddingthesupportsysteminteractionatidenticalconditionstothemodelonlycorrections.Thisinvolvesthegenerationof andinterpolationfromaseparateperturbationvelocitydatabasefor thesupportgeometry.Thecurrentdatabaseassumesa straightmodelsting.Additionalcalibrationswill berequirediftherearechangesinthesupportingstructure.
WICS SINGULARITY DISTRIBUTION
In addition to test data, tunnel empty calibration data,
and the perturbation velocity database, the code
requires the model singularity distribution and weightfactors for computing the individual singularitystrengths from a computed combined strength. Thesingularity distribution used to simulate the effect of the
model on the tunnel walls, and the wall on the flow
field, is based on the use of a source-sink pair torepresent solid blockage, a row of semi-infinite line
doublets to represent the lifting effects, and a number ofsources at separation locations to represent the wake
blockage. The distribution is specified on the model atzero angle of attack and moves with the model. Byfixing the singularities spatially in groups of source-
sinks, doublets and sources, the solution procedure
simplifies to one of determining their combinedstrengths. The number of unknowns is effectively
reduced to two (the doublet strengths are determineddirectly from the measured lift, as given previously).
The location and distribution of singularities are based
on certain "rules of thumb". The source-sink pair is
placed along the fuselage axis (at the reflection wall for
a semispan model). The source is placed one meanfuselage radius downstream of the nose of the fuselage
and the sink of equal strength is placed one meanfuselage radius upstream of the tail end of the fuselage;
this represents an equivalent Rankine body. Sources ofequal weights are placed at locations where separation
is expected. Line doublets representing a liftdistribution are usually placed along the 1/4 chord line
of the wing; the weights can be prescribed by a.
spanwise distribution (such as elliptic), or computedinternally using lifting surface theory. Usually a total
of I0 to 15 singularities is sufficient.
It is to be noted that this strategy works well becauseWICS tries to match the far field effect of the
singularities at the wail. Similarly, WICS corrections
are computed at model locations relatively far awayfrom the specified signature at the walls; hence this is
also a far field effect. Experience has demonstrated that
precise location of the singularities is not an importantfactor in the magnitude of the corrections.
Figures 6a and 6b show views of the singularitydistribution used for a representative semispan model
and a full span model. For the semispan case, a source-sink pair is placed at the image plane for symmetry.
Two sources are placed at the ftap trailing edge tocapture the wing wake effect and a row of equispacedline doublets is placed along the 1/4 chord line. For
the full span case, additional singularities are placed atthe horizontal and vertical tails.
APPLICATION OF WICS-NTF TO SEMISPANTESTS
Application of the NTF version of WlCS is presentlydone off-line in an end-of-shift mode. An off-line data
reduction program merges, averages and reduces rawdata and outputs the results in a standard file format.
The Mach number calibration correction specific to thereference pressure measuring system used is included in
this processing. Force and moment parameters arebased on the uncorrected, stability axis-oriented values.
This output is the starting point for WICS processing.The data is then run through a filter program and an
interface program to extract data required for WlCS andpresent them in the required format. A number of
script-based utilities have been developed toaccomplish WICS runs and graphic post-processing fora specific run or a number of runs. Final WICS
corrections are presented in a standard output file orthrough TECPLO'I'_-based graphic output. Details of
the processes involved in applying WlCS-NTF aregiven in Reference 7.

Wepresenthereresultsfromarepresentativerunof alarge(wingreferencearea/ tunnel cross-section area of0.098) high-lift semispan model at Mach 0.2 and a
dynamic pressure Q of 2.4 psi. The AOA range was -5to 24.
The most important indication of how accurate the
WlCS corrections are, can be obtained by examininghow well the raw wall signature is matched by WICS.
The contour plots already presented in Figures 5a, 5bgive an overall picture of the real wall signature and the
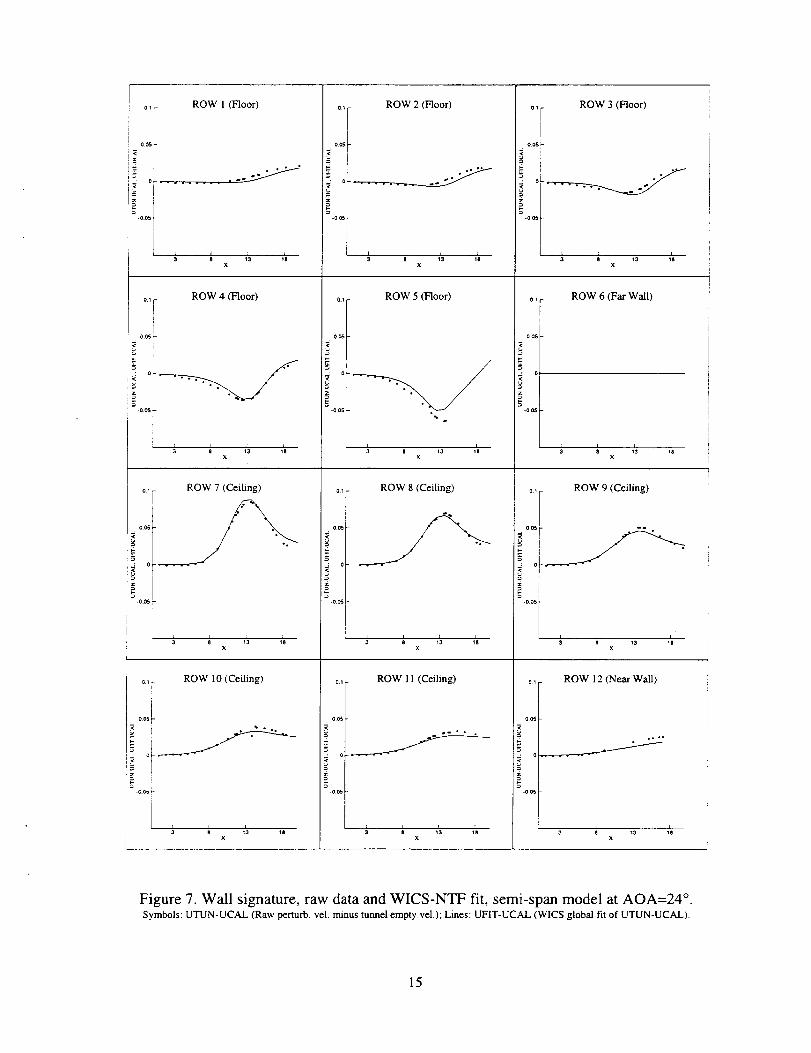
WICS least square fit. In Figure 7 we present a closer
look at the comparison for each of the 11 wall rows
used in this semispan case. The point corresponding toAOA of 24 is shown here. The wall signature is in
terms of perturbation velocity increment relative to thetunnel empty baseline and normalized by the reference
velocity at model center of rotation. The raw datacomputed from measured differential pressures using
isentropic assumption are shown as filled symbols.Points flagged as 'bad' based on data analysis or pre-setselection criteria are not shown here. For the same
points, the WlCS-computed wall signature match is
shown as solid lines. Since the method uses a globalleast square solution for the collective input wall
signature based on singularity strengths and location,the WICS fit is not to be interpreted as a least square fitin the local sense. Rather, it is a best match result of
the wall signature based on measured parameters,
tunnel and model geometry, and assumptions of far-field effect and linear potential theory.
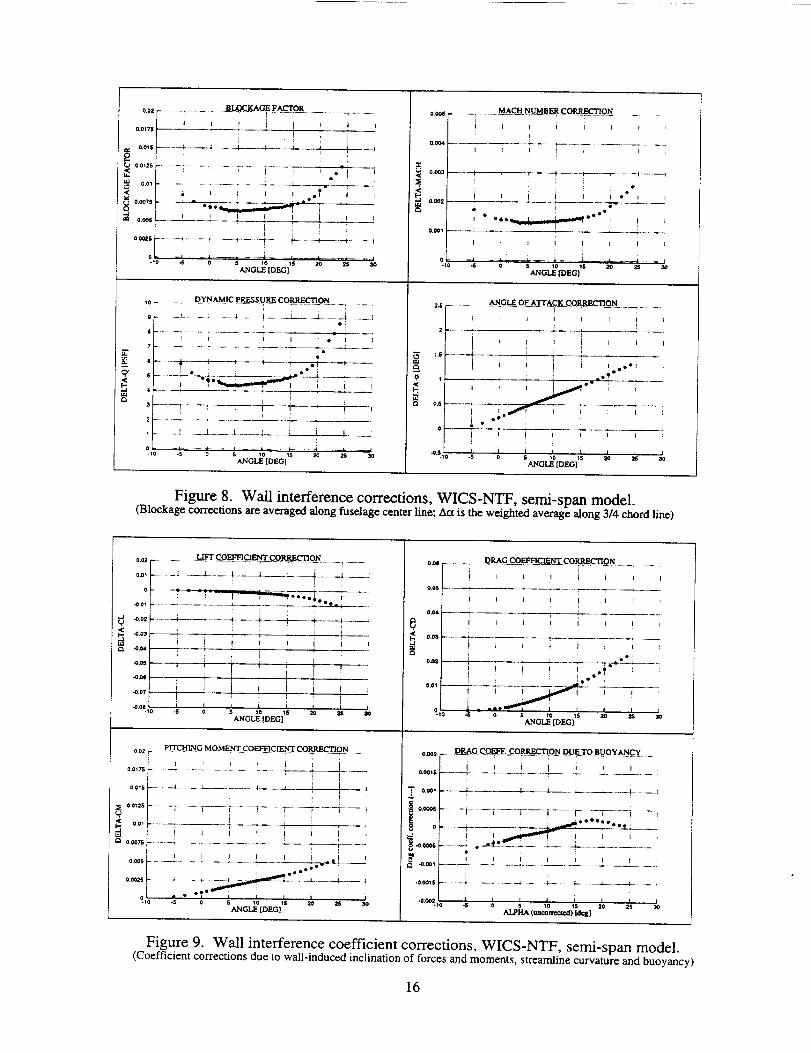
The mean corrections relating to blockage (blockage
factor _, A-Mach, A-Q; averaged along real time
fuselage axis) and upwash (weight-averaged Aa at the
real-time 3/4 chord line) are shown in Figure 8 for theAOA range of-5 to 24. These values can be directly
compared with classical corrections for low-liftattached flow conditions (see the section 'Comparisonwith Classical Corrections' for more details). It is also
possible to define other model-fixed or tunnel-fixed
reference axes and compute mean corrections alongthem.
WICS also computes corrections called secondarycorrections, which can be applied directly to the
uncorrected coefficients CL, CD, and CM. Corrections to
CL and Co are due to the inclination of the lift and dragforce caused by wall interference, and are based on themean upwash correction at the 1/4 chord line. The
correction to the pitching moment takes into account
wall induced changes to the streamline curvature andthe shift of center of pressure. Drag coefficientcorrection due to wail-interference induced changes in
the horizontal buoyancy is also computed by integrating
the variation of blockage along model surface. These
corrections are shown in Figure 9.
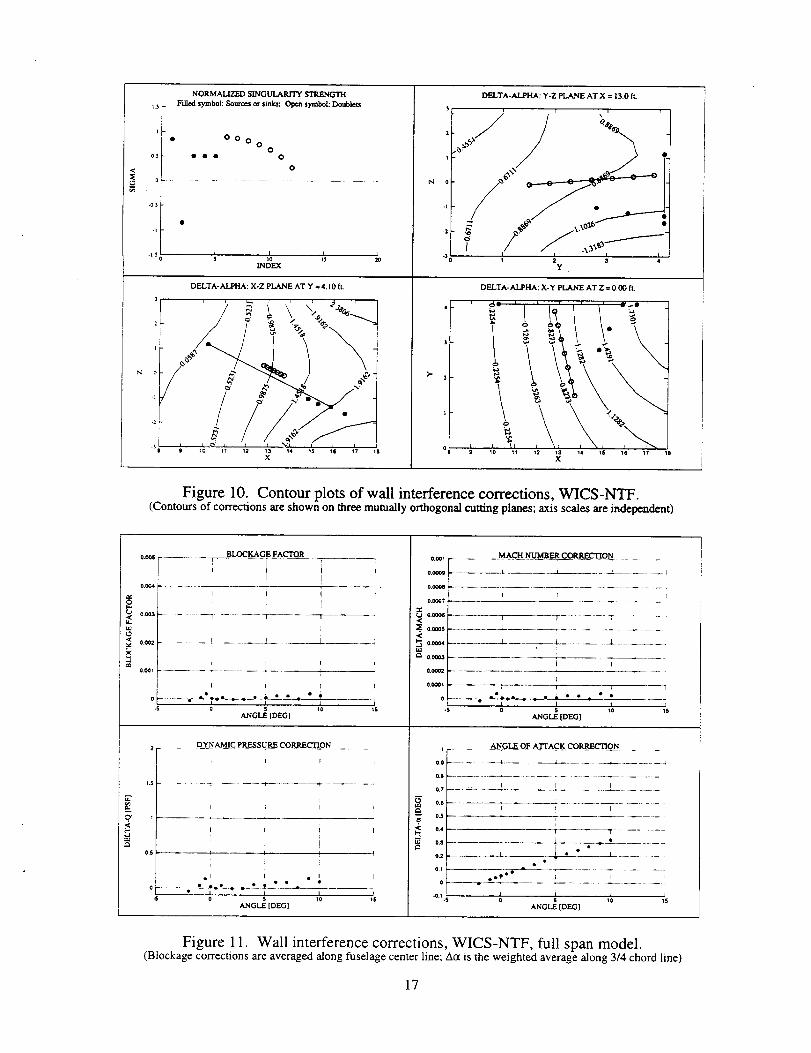
It is possible to compute local values of corrections at
various locations in the tunnel and study their variationalong different tunnel-fixed cutting planes in the modelvicinity. Contour plots of these local corrections are
useful in assessing the assumption of uniformity of thecorrection implicit in averaging. Figure 10 shows an
example of a contour plot of the local upwash
corrections in the model region along the 3 planesX=13 (tunnel cross section), Y--4.1 (reflection wall)
and Z=0 (horizontal plane). Symbols representing the
spatial location of the singularities and their computedstrengths are also shown. The span-wise variation of
Aoc as seen in the X-Y plane panel indicates good
conformity with the 1/4 chord line, in this case.
APPLICATION OF WICS-NTF TO FULL SPANTESTS
The full span test used here as an example is the genericPathfinder I transport model, adopted as a check
standard for the facility. This model is a typically-sizedtransonic configuration with a wing reference area /
tunnel cross-section area of 0.030. The four majordifferences for the full span case compared to the semi-span case are the model support system and kinematics,
the tunnel empty data, the perturbation velocitydatabase and the use of rows from all four walls. Once
these changes are accounted for, the procedure tocompute corrections is essentially the same for bothcases.
At the NTF, the model support system for a full span
test consists of a non-metric model sting attached to thearc sector roll drive on one end and the model balance
located inside the model on the upstream end. Astraight sting is commonly used although other bent
stings have been used for various purposes. The modelis capable of pitch and roll rotations; a combination of
the two is used to achieve yaw rotation. The modelkinematics and lift vector direction are important inWICS because the position and orientation of the
singularities are based on it. The present version ofWlCS assumes pitch rotation only.
Since the sting is in the model wake, it is important to
'tare' the full-span test data with an empty tunnel wallsignature with the sting alone in the flow at the same
conditions. This enables computation of theinterference due to the model only if we neglect thesecond-order effect due to flow interaction between the
model and the sting. The tunnel empty calibrationdatabase for the full span case thus consists of wall

signatureat variousP'r,Machnumberand stingincidenceangles.If theinterferencedueto thestingaloneis desired,thiscalibrationdatacanbe 'tare'-dagainstthefullyemptytunneldata(usedin semispancase)andusedasinputfor aspecialversionof WICSmeant for support configuration interferencecomputation. The correspondingdatabaseofcorrectionsis also usedfor linear additionofinterferencevelocitiesif it is desiredto computetestarticleplusstinginterferencecorrections.
Theperturbationvelocitydatabaseforthefull spancaseis differentfrom thesemispancasebecauseof theobviousdifferencein effectivetunnelaspectratioaswell asdueto differencesin theplacementof thesingularityandreferencegridsdiscussedearlierunderthe'PerturbationVelocityDatabases'section.Sincethereisnoreflectionplane,thewallsignatureusedforWICScannowincluderowsfromthefarwallalso.
Thesingularitydistributionfor thefull spanmodelisshowninFigure6(b).Becauseof thepresenceof thetail lifting surfaces,the pitchingmomentis nowrequiredinadditiontothelift to computetheeffectivedoubletstrength.Figure11showsplotsof themeancorrectionscomputedfor the Pathfindermodel.ComparisonwithFigure8showsthattheblockagedueto the full spanmodelis an at leastanorderofmagnitudelessthanthatof thesemispanmodel.Thisisconsistentwiththesmallerfrontalareaandwakeofthistransportmodel.Notethatwhileblockageis greatlyreducedoverthatof thesemispanmodel,asignificantcorrectiontotheangleofattackisstillpresent.
Figure12showsacomparisontherow-wisesignaturedistributionfrom the test and WICS. The wallsignatureisconsiderablysmallercomparedto thesemi-spancase.Asa result,theWlCSfit hasa smallerstandarddeviationvalue. In addition,thefull spanmodelhasa higheraspectratio thanthesemispanmodelandamoreconventionalpressuredistributiononthe wing,whichleadsto a betterfit of the wallsignature.
MACH NUMBER CALIBRATION FROM WICS
A special application of the WICS code was made to
predict the Mach number variation along the tunnelcenterline from the tunnel flow reference system (FRS)measurement location at station X=-2 to the tunnel
model reference station X=13. This is typically
obtained from a centerline pipe test and applied as aMach number correction added to the measured
reference value to the get the conditions at the modelreference station.
The Mach number change from the FRS location tomodel center location in an empty tunnel occurs due to
the boundary layers on the walls which is a function ofthe Mach number and Reynolds number. Based on the
centerline pipe data, the change in reference conditions
is expressed as a set of calibration curves AM=f(M,Re).
This blockage effect can be modelled in WICS byspecifying a number of source-sink-source triples
distributed along the centerline (this implicitly assumessymmetry in the signature at the four walls and uniform
flow at the tunnel section where the FRS is located).The wall signature from the tunnel empty test is used as
input directly into WICS (no 'taring' required) with
tunnel reference velocity Vr_ f set to the FRS-based
velocity. It is also required to generate a specialdatabase of elemental perturbation velocities with the
singularity and reference grids positioned along thecenterline in a denser distribution. The resulting localvalues of the Mach number correction is added to the
FRS value to get the WlCS-predicted Mach numberdistribution along the centerline.
Figure 13 shows a comparison of the local Mach
numbers from centerline pipe data and WICS for the
test conditions M=0.45, Q=I 1 psi (Re=16 million/ft).The centerline pipe data and error bar are from three
repeat points at each location averaged from 4 ports,
90 ° apart. The results from the WICS calculations also
correspond to these three repeat points. In order toaccount for slight differences between the centerline
and wall flows at X =-2, the WlCS results were shifted
by a fixed amount corresponding to the averagedifference in Mach number at the centerline and wall at
the FRS location. A good match of the experimentaldistribution has been obtained.
The above procedure was repeated for all the points inthe tunnel empty data set. Figure 14 shows a plot of the
AM values from WICS compared to the experimental
calibration values taken at tunnel station 13, the model
center of rotation. A good match of the calibrationvalues to within +/-0.0005 in Mach number has been
obtained. This application serves as a validation ofWICS in addition to the use of it to check the centerline
pipe calibration.
ANALYSIS OF UNCERTAINTY OFCORRECTIONS
It is difficult to assign definite values to the uncertainty
in the corrections because the accuracy of corrections isdependent on the method, the measurements and the
interference flow field, all of which vary from test to
test. The true answer is available only indirectlythrough test data from models of various scales in
tunnelsof varyingsizes,whichcanindicatethetrendtothe'freeair'solution.
TheWICSmethodmakestheassumptionthattherotationalflow in thevicinityof thewallandin thevicinityofthemodelarefarremovedsothattheeffectsofoneontheothercanbemodeledinalumpedfashion.Whenthis is violated(largermodels,highvaluesofAOAandsemispanimageplaneissuesareexamples),theaccuracyofWICStendstobedegradedandcanbedirectlyseenin therow-wisestandarddeviationof theWlCSfit. Thetunnelupwashcorrectionis directlycomputedfromthepitchingmomentandthelift; theuncertaintyin its valueis mainlydependenton theapproximationused in wing and tail loadingdistribution.Theblockagecorrectionresultsfromthesubtractionof the lift-inducedeffectfrom thetotalsignatureandcontainsmost of the uncertaintiesresultingfromthemeasurements,thetunnelflow non-
uniformity and orifice error. Therefore the blockage
corrections have a larger degree of uncertainty in themespecially in a model with small blockage and a largelift. Results from WlCS at the 12 ft PWT show that the
accuracy of the wall signature is a key parameter. In a
particular test, the scatter in the blockage predictionswas found to increase from +/-0.001 to +/-0.005 if wall
pressure ESP modules were not re-zeroed for each
change in the dynamic pressure. An indirectverification of blockage correction also is seen from a
12 ft PWT test with a full length flap and a half spanflap. The blockage correction decreased for the half-
span flap case approximately by half that of the full-span flap when compared to the classical correction
value with no flap. Another approach is to
systematically perturb the WlCS input parameters andfind the sensitivity indices; once these are available, thestandard deviation of the WlCS corrections can be
obtained based on input deviations. This work is
currently ongoing. This does not address otheraccuracy issues relating to flow features of a specifictest article.
COMPARISON WITH CLASSICAL
CORRECTIONS
An assessment of the predictive capability of the WICScode may be obtained by comparing its results with
those given by classical theory. Accordingly, the wind
tunnel measurements of the high-lift semispan modelwere also corrected for wall effects using standardmethods presented in Barlow, Rae, and Pope s ,AGARDograph 1099 and AGARDograph 336 l°. An
extended version of Maskell's theory _l developed by
Hackett 12 was used to correct for the separated wakeflow generated by the high-lift system. Hackett's two-
step extension removes the over-correction tendency of
the Maskeil theory by separating the wake blockage
and wake gradient effects into constituent parts, in lieuof the original combined correction.
Prior to comparing the correction increments, a generaldiscussion of the effect of the tunnel walls on measured
data is in order. In solid wall tunnels, the flow is
constrained such that an over-acceleration around the
model is present. This effect is known as blockageinterference; it is a function of the model volume and its
wake; and, the correction is to increase the effective
tunnel velocity and dynamic pressure, resulting in lower
values of the aerodynamic coefficients. The presence ofthe wake generates two effects. First, the area betweenthe wake and the tunnel walls is constrained and causes
an increase in the velocity that is sensed upstream as a
change in the flow velocity. This increased velocity is
manifested as an additional change in the dynamicpressure known as wake blockage. The second effect is
due to the wake-flow velocity gradient over the model.This effect generates a drag correction in the same
manner as that due to an empty tunnel gradient. Thewalls also increase the lift for a given angle of attack,which for a given lift has the corrective effect of
increasing the model incidence. In linear flow regimes,
this effect is proportional to the lift and it is known aslift interference. Fluid streamlines must be parallel to
the tunnel walls in the vicinity of the wall, instead ofballooning around the model as in unconstrained flow.This flattening reduces the curvature of the flow near
the model and redistributes the loading, effectively
reducing the camber of the model. This re-camberingyields an increment in the pitching moment known asstreamline curvature interference.
In classical theory, these tunnel wall interference
variations are captured by the appropriate selection of e,
the total blockage parameter; 8o, the lift interference
parameter; and 81, the streamline curvature parameter.
These parameters are defined as:
Au 213H C= --; 80 = zXo_C---_--;8_= AC(sc -
U. SC L c SC L
where Au is the velocity increment due to blockage,
Atx is the wall induced increment in angle of attack,
Act_¢ is the wall induced increment due to streamline
curvature interference, C is the tunnel cross-sectional
area, H is the tunnel height, S is the model reference
area, and c is the mean aerodynamic chord. When
applying classical theory, much latitude exists duringthe selection of interference parameters. These
parameters are determined from charts and equationsthat are dependent on the specifics of tunnel and model

geometricdetails,suchastheinclusionofcomerfilletsin thetestsectionareaandsemispanstandoffin themodelvolume.Byreversingtheprocess,outputfromtheWICScodecanbeusedtocomputevaluesof theinterferenceparameters.Inthepresentcase,becauseofthe wide latitudein parameterselection,the liftinterferenceparameter,50,wasselectedas0.11tomatchthe WICS-computedresultsof the cruiseconfigurationof thismodel;5o wasthereafterheldconstant.Thestreamlinecurvatureparameterwasdeterminedas 6_= 2.1356ousingReference9. TheblockageEwasdeterminedusingReferences8, 11,and12.
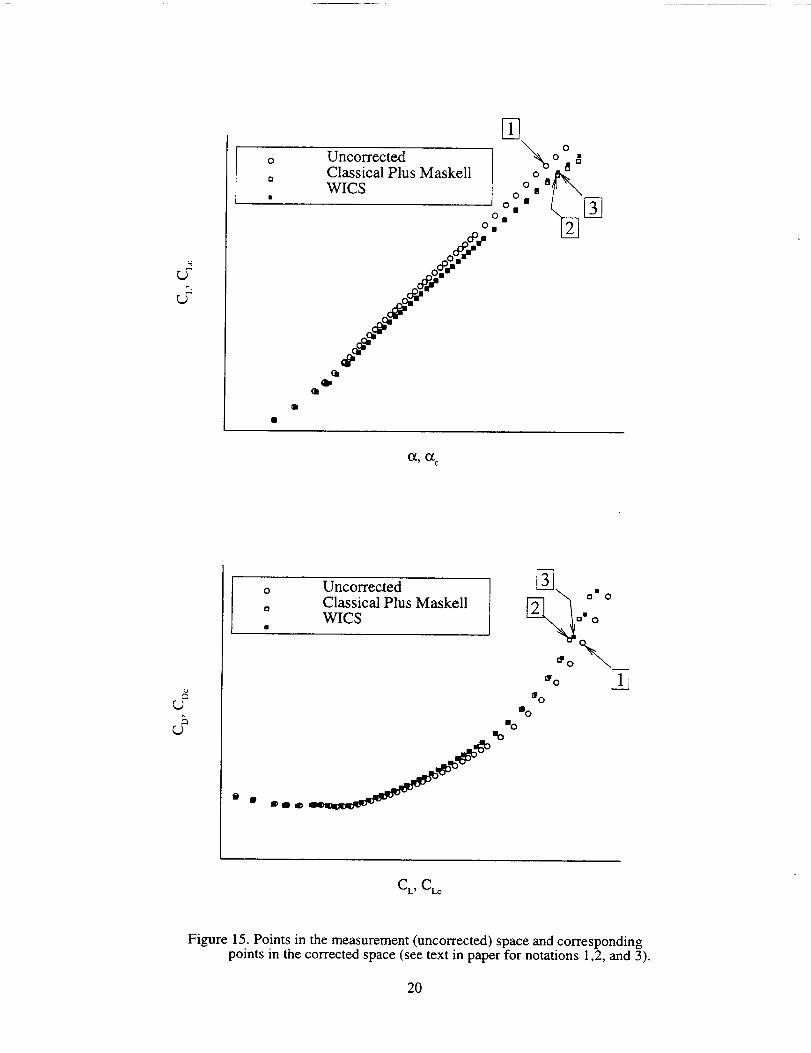
Fromthepreviousdiscussion,it isobviousthattunnelflow conditions,model attitude settings,andaerodynamiccoefficientsdeterminedfrommeasuredloads,all, changewith the applicationof wallinterferencecorrections.In other words,whencorrectionsare applied,dataare transformedinmeasurementspacefromthepoint(M, Re,q,c_,CL,CD,CpM)to thecorrectionpoint(Mc,Rec,qc,_, Ct.c,CDc,CpMC).This is illustratedin Figure15whererepresentativeuncorrectedmeasurementsarecomparedwithboththe"ClassicalPlusMaskell"(CM)andtheWICScorrectedmeasurements.Lift results(CLvs.cz)arepresentedintheupperportionofFigure15anddragresults(CDvs.CL)arepresentedin thelowerportion.An examinationof the resultsdemonstratesatransformationconsistingof arotationandscalingofthepolarsfromtheuncorrectedstate(circles)to thecorrectedstate(openandfilledsquares).Forexample,theuncorrectedcirclelabeled"1" onthedragpolaristransformedto theCM-correctedopensquarelabeled"2" andtheWICS-correctedfilledsquarelabeled"3".In thiscase,relativelysmallchangesindragcorrectionoccurwhilelargecorrectionstolift andangleofattackarepresent,asnotedin theupperfigure.This is animportantConceptto rememberin the followingpresentationwheretotal incrementsbetweenthecorrectedanduncorrectedaerodynamiccoefficientsarepresented.
Totalincrementsbetweenthecorrectedanduncorrectedlift, drag,andpitchingmomentmeasurementshavebeenplottedasafunctionof uncorrectedlift coefficientin Figure16for theCM andtheWlCSmethods.Ineachcase,theopensymbolsrepresentCM theory,whiletheclosedsymbolsrepresentthatdueto WICS.In all cases,the incrementsvary in a similarandconsistentmanner,regardlessofthecorrectionmethod;however,significantdifferencesarepresent.Examiningthelift resultsinFigure16arevealsarotationbetween
thecurvesandanonlinearspreadingof theirseparationaboveCLof 1.Whenapplyingclassicaltheory,mostofthedifferencesdueto rotationcanberemovedby"judiciouslytuning"valuesreadfromcharts.However,the nonlinearwideningreflectsdifferencesin themethodsandtheirabilityto properlycapturetheflowphysics.TheCM theoryimposesa mathematicalboundarysimulationof noflowthroughthewall,whiletheWlCStheoryimposesa realityin theformof ameasuredpressureboundary.Thismeasuredpressureboundaryinherentlyreflectsthestateof thetunnelgeometryandthewallboundarylayer,thepresenceofwhichhasbeendemonstratedto alleviatebothsolidwall blockage and the streamline curvatureinterferenceS3.14.In effect,thetunnelwallboundarylayerallowsa measureof streamliningaswouldanadaptivewall tunnel.The WlCScodeappearstocapturethesecharacteristicsas evidencedby thereducedtotalcorrectionsfor lift andfor pitchingmomentas seenin Figure16c.Drag incrementspresentedinFigure16bcompareextremelywellatCLvaluesup to 0.7wherethetotalcorrectiongrowstoabout35dragcountsandthedifferencebetweenthemethodsis under3 dragcounts.Beyondthis,theinfluenceof theflow separationbecomessignificantandthedifferencebetweenthemethodsgrowsto 40dragcountsataCLof 1.3,andevengreaterathigherliftcoefficients.It isunknownwhichmethoddefinitivelyyieldsthemorecorrectvalue.However,atthispoint,WICSis themorecrediblesolutionbecauseof itsmorerealisticboundaryconditionandbecauseof similarresultspresentedby Ruegerinreference15wherehecomparedthetwo"measured-variable"techniquewiththewallsignaturemethod(WlCS)andCMcorrections.Thoughnotpresented,computationalresultsfromtheWICS code indicate a reduction in blockageinterferencewith increasingReynoldsnumber.Thisreductionisconsistentwithtunnelareachangesduetowall boundarylayerthinningas Reynoldsnumberincreases.Variationsin blockagedueto ReynoldsnumbercannotbeassessedusingCMtechniques.
FUTURE WORK
On-line implementation of WICS on a post-point basisis a key item for future work. The method is
computationally efficient enough to make this possible
in near real-time. Each test point contains all theinformation required for WICS computations; the entire
polar is therefore not required (classical corrections forseparated wake blockage may require the entire polar).
Future work also involves added capability to processtests with roll and hence a change in the lift vector
direction. Augmentation of calibration data withadditional tests with other support configurations is alsorequired. Additional calibration data is also required to
9

extend the Mach and Reynolds number range of the
current databases. An effort is under way to improve
the quality of the wall signature by additional portlocations on the near wall, rectification of some of the
known problem ports, relocation of ESP modules, and
re-plumbing of lines. An analysis of the sensitivity ofcorrections to turning off different rows is being done.More tests are required to build confidence in themethod.
CONCLUSION
The wall interference code WICS based on the wall
signature method has been successfully implemented atthe National Transonic Facility. The method uses pre-
computed databases of corrections, which helps in fastand reliable computations. The code has been appliedto a recent low-speed, high-lift semispan model and afull span model. Analysis of the results indicates that
the wall signature is well matched by the code. Theglobal least square nature of the wall signature matchresults in corrections that are insensitive to isolated badinput data.
ACKNOWLEDGMENTS
A part of the work reported in this paper was performedunder NASA Langley contract NAS 1-96014.
REFERENCES
1. Ulbrich, N., "The real-time wall interference
correction system of the NASA Ames 12-foot
pressure tunnel," NASA/CR-1998-208537, July1998.
2. Hackett, J.E., Wilsden, D.J., and Lilley, D.E.,"Estimation of tunnel blockage from wall pressuresignatures: a review and data correlation," NASACR-152241, March 1979.
3. Bobbitt, C., Everhart, J., Foster, J., Hill, J.,McHatton, R., and Tomek, B., "National Transonic
Facility characterization status," AIAA-2000-0293,
January 2000.
4. Ashby, D.L., Dudley, M.R., Iguchi, S.K., Browne,
L., and Katz, J., "Potential flow theory andoperation guide for the panel code PMARC,"NASA TM 102851, NASA Ames Research Center,
Moffett Field, CA, January 1991.5. Ulbrich, N. and Boone, A.R., "Real-time wall
interference correction system of the 12ft pressure
wind tunnel," AIAA 98-0707, January 1998.
6. Ulbrich, N., and Steinle, Jr., F.W., "Semispanmodel wall interference prediction based on thewall signature method," AIAA 95-0793.
7. Iyer, V., "WICS-NTF User Manual," NTF Internal
Report, April 2000.
8. Barlow, Jewel B., Rae, William H., Jr., and Pope,
Alan, "Low-Speed Wind Tunnel Testing", 3 rd ed.,John Wiley and Sons, Inc., New York, 1999.
9. Garner, H. C., Rogers, E. W. E., Acum, W. E. A.,and Maskell, E. C., "Subsonic Wind Tunnel Wall
Corrections", AGARDograph 109, October 1966.10. Ewald, B. F. R. (Editor), "Wind Tunnel Wall
Correction", AGARDograph 336, October 1998.
11. Maskell, E.C., "A Theory of the Blockage Effectson Bluff Bodies and Stalled Wings in a ClosedWind Tunnel", R&M 3400, November 1963.
12. Hackett, J.E., "Tunnel-Induced Gradients and Their
Effect on Drag", Lockheed Georgia Co., LockheedEngineering Rept. LG83ER0108 Revision 1,
Marietta, GA, September 1994.
13. Berndt, S. B., "On the Influence of Wall BoundaryLayers in Closed Transonic Test Sections," FAARept. 71, 1957.
14. Adcock, J. B. and Barnwell, R. W., "Effect of
Boundary Layers on Solid Walls in Three-Dimensional Subsonic Wind Tunnels", AIAA
Journal, Vol. 22, March 1984, pp. 365-371.15. Rueger, M. L., Crites, R. C., and Weirich, R. F.,
"Comparison of Conventional and Emerging("Measured Variable") Wall CorrectionTechniques for Tactical Aircraft in Subsonic Wind
Tunnels", AIAA 95-0108, January 1995.
10
iAMES 12ft PWT)
+ve LIFT
Splitter plateplane
(VIEW LOOKING DOWNSTREAM)
12 ft. DIA
ROW LOCATIONS OF
WALL PRESSURE PORTS
+ve LIFT
P
A
Av
A A
8.2 ft. SQ.Av
Z
Iy-._--
AMES 12ft PWT NTF
GEOMETRY
WALL SYSTEM
MODEL ORIENTATION
PERT. VEL. DATABASE
WICS APPLICATION
POST-PROCESSING
Near-circular cross section (12 ft DIA)
8 rows, 30 poxts/row, equally spaced
Left wing half on image plane, extends in +Z
Modified PMARC panel code
Real time or off-line
IDL graphics
Rectangular (8.2 ft SQ.)
16 main rows, unequally spaced
Left wing half on far side wall, extends in -Y
Code'based on Method of Images (MOI)
Off-line; interfaces to DAS output
TECPLOT graphics
Figure 1. WlCS implementation issues at NTF (semi-span model example).
Pre-processing ofcal. test data
Pre-computed
perturbation velocity
databases
(Method of images)
Wall signature 'q_ _ Link
n
Prepr°cess g°fI IRunWICSNTFItest data _ off-line version
Tunnel parameters, Out'put files of
Forces and moments, mean and local
Wall signature 1 corrections
Inputs for model ]
geometry and ]
wall interference ]
options ]
ost-processing: ]
.__ [Plots and
IFT output
Figure 2. Flow chart of processing operations for WlCS-NTF.
11
$I,.m
.,.q
$
-5 0 5 10 15 20'1 I ill I I ill IIIIIllll , IllJ I
25 30
I I I I I I I _ I
•., • .i,-.-,-,..: ..... i .....r_
'le.ll .o.o- O,4U' _
+ ++++''-+....+.,+++:.... _
7 + [
+o4o I <, *_o- _ ...... ._=r,I
iIol,il, t lill- ,ill OllllllWiU_llli_.iliOil,k . . -
k_
eo.o_o o o o o. o_ • ..... .... _ _
• i i _io o_l. ,ol_ •
5i! i;2 iii 1-
15 20 25 30
,e .......
- o
o
• o
o
o
.... •e.
,o.
.o.
I ' I I i I i I I l
-5 0
J+,oo.ooo+.,.o+oo
_, o o. ! • • o +oo+o o_4
4oi+_iIIII:441_
.oo.o.+oo_,.o.o++o_
_.+o,oooo_ ++oo
: i
5 10
X, ftFigure 3. NTF wall ports layout and the 360 wall ports selected for WICS-NTF.
symbol, port is hooked up. SymiSol +, port is bad or not hooked up. Filled symbol, port selected for WICS)i 13.2 ,! i5.2 i
ii'3 +14 I_5
m+m12 i
t
11
(Open
.......
i
: Y'_ "_ et_,_ 1"7"1M 0 + ..... ,,,,
d
!
16"i --17
i ;
i
, -..
7 ,i (looking ¢lownstrea.m.)
! i ',6 : : :
5 4 + 2 i 1
I ; i
4 2 0 -2 -4
Y, ft
Figure 4. Location of wall ports showing row numbers (WICS row numbers in box outline).
12

MEASURED (RAW) WALL SIGNATUREINCREMENTAL VELOCITY CONTOURS)
o 511 0.011 I I
10 0.O09
9 0.007
8 0.005
7 0.003
6 0.001
5 -0.001
4 -0.003
3 -0.005
2 -0.007
l -0,009
1"
E.,-
m
$
....... I" f r_'F-',_-_")'-I..
.....; •I..: ....... \'\_,-'k"V-,J /"• o o o o _ Q
Ir
li
• • • o • • o o • Io le I _oolo ooi
!• • . • • • . o ooao. I_t,_oeoo Io
10 15 20 25
_oio
o . • • • e o Q ooooJ ooo_ooo,_o_o _°o/
• ° o • • ° a o ° J° .o • _o°Do °°
•_...... 1_.._._._
0 5 10 X, ft 15 20 25
(a)
WICS FIT OF WALL SIGNATURE
INCREMENTAL VELOCITY CONTOURS)
0 511 00II
10 _)009
g 0.007
8 0.005
7 0003
6 0.001
5 -0,001
4 -0,003
3 -0.005
2 -0,007
1 -0.009
$
e-,
$
10 15 20 25
........ 4 .//_:--Zt-_._
......... ((_i)
.......... \ \ k:_\-,,-r/_.
o o o . . . . _ ° oo _o _ o_0o o_
0 ° ° . • . o o °°°Q. ,_I °o°°°°o°o ,°
: : :: : : :: ::i:_:. ::::.................• • • • , o • o o _ oo _ ° _o
........ __._
........ ,. _ ........ , .... \._ 7.i._.i I I I r i I i i i i ] i I t i I i i i I t-t--rm--.-_, J i
0 5 10 X, ft 15 20 25
(b)
Figure 5. Wall signature from a full span (Pathfinder-I) model at c_=10 °(a) from raw data, (b) from WICS-NTF fit to the raw data.
13

4
N 1
10 11
1 - ii ................ !
Co)
Figure 6. Singularity distribution and model lines for (a) a semi-span case, (b) full span case;open symbols are semi-infinite line doublets; filled symbols are point sources or sinks
14
o,: ROW 1 (Floor)r
o.05-
<
o-. ........ m-r.
i
o_ - ROW 2 (Floor)
oos -
I
ROW 3 (Floor)°1F
oos_-
: o
.oo5 --0.05 -
1
x
o., - ROW 4 (Floor)
o_
x
ROW 5 (Floor) oi I-
!
• o_o5
ROW 6 (Far Wall)
o.os _-
i .o
_ °_
$-o.1_ -
o _r ROW 7 (Ceiling)
d<
-o.os -
ol F
J tt3 1;0x
ROW 10 (Ceiling)
L
oos_
z
.oo5_
x
5-0.05
o,- ROW 8 (Ceiling)
• 0.05 -
=
o
.005
o., - ROW 11 (Ceiling)
oo_ -
<;., .. • o
5.oo_I
o
-O05 -
X
o, ROW 9 (Ceiling)
o.os! --
: 0 _
x
o, - ROW 12 (Near Wall)
005 -
.oo_I
x
Figure 7. Wall signature, raw data and WlCS-NTF fit, semi-span model at AOA=24 °.Symbols: UTUN-UCAL (Raw perturb, vel. minus tunnel empty vel.); Lines: UFIT-UCAL (WlCS global fit of UTUN-UCAL).
15
, _ i ! i
I0 _ .......J.............J ...............£................I..............J...... +k...... I .....r, I-_0 -S 0 5 10 15 gO 2S 30
,MqOItIDEG]
/'t" -: ....... 1...... Z .- .L.................L ................-_...... -L _
z •
F I i I i I I • I I8 ...................................?...............+ ................ _ .....
41 ! II +
sL. • : I ,, : Io, [ ..........._.........""-'_ ............_.Z_,_....__.__..........Z........< , r_i ; ; r
3 ........................i............................l + ---',
2 F- ......................•.......
I"..........! ...............r.............L..............2.........2 L { r
o h- --* ...i ......... i ............ #........._ ......._...............t................
ANGLE (DEG{
o._ ........,........_AC_ .N.._BER_O_ON .....
I i I I I I I i
r_ 0,003
_' i •i i + i , ,.'i
Oj_2 _ .................
' t ..,1, _eo
I l I i I I I
ANGLE |DEG]
<
_. ........_0_0{ A_TTACK__CO_ON ......+ ..........t
, i ,
i i , , iI
0.S I i • I_! l l { l {
0l I i I l I {
+% • ' i ,'o ,', _' _ _oANGLE [DEG]
Figure 8. Wall interference corrections, WICS-NTF, semi-span model.(Blockage corrections are averaged along fuselage center line; As is the weighted average along 3/4 chord line)
l
OF- -e-_c_ : . r {
{ ', I * _,, lib. e ! I
-0.04 i
I i I-0.__ .+ i [ i
.k ,' i
i ;T"
! !{ i i
ANGLE IDEG]
o.o2 PITCHING MQMEN T CO_CI_ CORRECTION
+ , i i i ,t
0.0' 7S ............................... tl ''_ ll_ .....
' I
} .... _ k ...... r ............ r ................. t ....... r .......... rllll l" "_ ...... _ ......... ]
, + ! i + /• o.o'__ ........
l | , , , , i , i ,
l I l l I I l l
O.OOS[- ..........................._ ................._____u._.l.L,e ...........; ii I
o.oo_s -+ .......... __;_ ..........4.-.---..14-........
{ ee, eo / i • I I I I I I l•lo .s o s lO 1s 20 25 3o
ANGLE [DEG]
o.o31
{ I I i i i i l
l I l I i ! p
[
°.;o !
ii , i i , i
{ I i Y { I I
i !! e e
I l I I eei ,- I
F i j._-_l-'--"T-'--T .......... i
ALPHA (uneonec_l) Id_]
Figure 9. Wall interference coefficient corrections, WICS-NTF, semi-span model.(Coefficient corrections due to wall-induced inclination of forces and moments, streamline curvature and buoyancy)
16
NORMALIZED SINGULAR.rTy STRENGTH
i_ - Filled symbol: Sources or sinks; Open symbol: Doublets
i
• OOOoo
05 e • • O
O
o ...................................
INDEX
DELTA-ALPHA: X-Z PLANE AT Y = 4. l0 ft.
- 9 _ -..o
X
N O
-I
-2
-3
DI:I TA-ALPHA: Y-Z PLANE ATX = 13.0 ft.
/' _.'% '
Y
DELTA-ALPHA: X-Y PLANE AT Z = 0.00 ft.
l \1\ °°
X
Figure 10. Contour plots of wall interference corrections, WICS-NTF.(Contours of corrections are shown on three mutually orthogonal cutting planes; axis scales are independent)
ooos .....................................B__.r__G_E F&C_R ..................
[- , i i: i
0.0_ _-
i O.OO3 t
_ 0.002
................. r ................. I.................. --1
........ ._.........................._.......... __
* " _'_- ............. -I'-..... -----7 ................-$ 0 $ 10 lS
ANGLE [DEGI
_ D_Y_AMJC PP._ssu __. CO P_EHC_ON ....
1.5 _- ........... _ .............................. ¢- ............... -'r ............................
I I
' i
i !
I
I
• 1 • • IO I
o ,'o ,'ANGLE [DEG]
o oo_ ...... MAa-I NUMBER CO_ON
• l"--_ ......... ............................i.........................
0.0009 _ ........ ---..--.t .................. J--... ................ _ ................. Io.0_. ...... ;.................:....................._.............0.O007 ............................................... I
,-r
rO o.ooo_ T ................ 'T ......................... "I" .......<
<
o.0oo* .................. t ........... L- ............... -k ............. J
°.0,,,..............................L._ ..........................I i I
0.0001 _ -F l
., o" , • ,,,ANGLE [DEG]
6NG___ OF _ACK CO_OU
0.9 ......................... _ ............. _ ..................... --k-- ......................... ;
0.7 ...... .........• _ .............. d ............. _ ............. !
0*....... --7-..................;....................-7 ..............
•' 0_ 4 _ ................=
oa t _,_...k ........ -....L_ .......................
0.I I-,- ................ ._j_e ..............................................
ee_ ••..........-.----:- .............. -'....................- ................... o' i ,: ,_
/_NGI.E [DEG]
Figure 11. Wall interference corrections, WICS-NTF, full span model.(Blocka=e corrections are averaged along fuselage center line; A(x is the weighted average along 3/4 chord line)
17

ROW 1 (Floor)0O4 r
0.O3-
, o.o3 -
_o.ol _-
i.....
0.0, - ROW 2 (Floor)
0.02 -
_o.ol -
_ o-
_; .001 -
-0.03 i-
....F ; ; ,, ,x
ROW 4 (Floor)0.04 f-
003-
002-
o,ol I"J
S
_ °_._:_ -0.01 -
-OO2 -
-0.03 -
x
o.o, _ ROW 7 (Ceiling)
o o3 i
002+--
I = o.o_ -
_" o - ,o , o
_ -o.ol -
.0.02
*0'03 1
x
0.O4-
0,03
! _ o.o2
. o.ol
E
_ og
.o o2t-
-oo3 _
i
ROW t0 (Ceiling)
ii3 IL83×
-0.02 -
-0.03 -
-0.04 E/ 113 1is
ROW 5 (Root)
oo,_oo31.-
F
°°= tL
o.o_i
gi oL_
_ -0.01 -
-0.02 -
-0.03 -
.... = , , ,_x
o.o,- ROW 8 (Ceiling)
0.03 -
• o,o2 -
_ o-
z -o,ol -
-0.02 -
-O.O3 -
.... _ _ ,3 ,x
ROW 11 (Ceiling)0,04-
0.03 -
0.02 -
<
o.o_
O-<
z -ool -
-O.O2 -
i
-O.O3 I
.... _ _ • ,x
o.o4- ROW 3 (Floor)
0102 -
O.Ol -
m
-0.03 -
X
o._ [-!
oo3-
• 0.02-
_ 0.01-
_ 01-
z -o.o_ -
-oo3 -
i-O.O4 _
ROW 6 (Far Wall)
• o . • . .= _-', .°o .*_
o.o_- ROW 9 (Ceiling)
0.02
<
0.01
_o
_ .o,oi
.oo_!.
-O.O3 •
x
o._ ROW 12 (Near Wail)
0.03 I
i ,._ 002+-
< I
_- o ,. , , ° oo o,, ° **_a,
z .O.Ol -
-0.02 -
x
Figure 12. Wall signature, raw data and WICS-NTF fit, full span model at AOA=10 °.Symbols: UTUN-UCAL (Raw perturb, vel. minus tunnel empty vel.); Lines: UFIT-UCAL (WICS global fit of UTUN-UCAL).
18

Center LineMach Number
0.46 .....
Machn_ s = 0.45Re / ft = 16 million
0.455
0.45
0.445
'_ ,T__ _" _:--_ CL......Pipe data\V_q!S Calcul'ati0n ....
. _ FRS.station : Model station --_ . ..
,vI , i i4 8 12 16
Test Section Station, ft.
Figure 13. Center-line Mach number values from WICS-NTF and pipe data.
Mach number correction at Station 13 (air, slots closed)0.01 -
0.009
0.008
0.007
0.006d_
E
" 0.005
0.004 "
0.003
0.002
0.001
Re,=l mill.(CL pipe) O
....... Re--6 mill.(CL pipe) D
Re=14 mill.(CL pipe) O
Re-_ to 16 mill.(WICS)
Re=4 to 8 mill.(WlCS)
Re=l to 4 milI.(WlCS)
.... Calibration from S
: center-line pipe, d_ta .f
WICS calculation from _//_//'_
O0 , I I0.1I I I [ I
0.2 0.3 0.4 0.5Math number
Figure 14. Mach number calibration with varying Mach and Reynolds numbers.
19
2:
Uncorrected
Classical Plus MaskellWlCS
m
oO,'_o N0 I
Om
I11
0_) O_ c
r,.)
r,=)
o UncorrectedClassical Plus Maskell
o
WICS
Io
D ® m ® _o_ _)_'O_'d_
°<0 o
° 0
S o
"o
CL_ CLc
Figure 15. Points in the measurement (uncorrected) space and correspondingpoints in the corrected space (see text in paper for notations 1,2, and 3).
20

0.02 .....
0.01
0.00
-0.01
-0.02
-0.03
..... , ..... LIFt CORRECTION
i i........................ _............................. !..(a) !.......
- :I °-0._ .......................
-0._ ...............................
-0.08 i i L-0.2 0 0.2 0.4
13:-,13. • ............
i !13 •!.. o _ ..........
Classical Plus Maskell 1 •
WICS |_ ..........n..i ...............:
i ,............................. I"I .......
I i I I I i
0.6 0.8 I 1.2 1.4 1.6c,
0.014
0.012
0.010
0.008
= 0.006
0.004
0.002
0.000
-0.002
....... DRAG CORREETION ......
i................ i .........._......... (b) i,.... .... i i•_.........
........: ..... i ..... i .... _..... _..... i • .... i.....
. _o °°°.................... 0 ........
-i,.......................................°:omm i
-0.004 i i i i i i i t i-0.2 0 0.2 0.4 0.6 0.8 1 1.2 1.4 1.6
CL
0.014 PITCHING MOMENT CORRECTION ,
!...........,.tc) ! i0.012 .................. i................. _...........
0.010 ........ i ...... i ....... i .... , ......... _ +m .
0.008 .......................... o ......
o0.006 ....................... o m"
i=io •
0.004 ....... o o ooo ...... • ! ....
• • ilil_i_m'_ "-
0.002 ................. ]........ ]...............; ...... [. [..... [...........
0.000 ............. , ...... , ...........................................
i i-0.002 ....................................................................
-0.004 i I I I I I t I I-0.2 0 0.2 0.4 0.6 0.8 1 1.2 1.4 1.6
CL
Figure 16. Comparison of corrections from WICS and classical plus Maskell methods.
21