21st. Annual International Emme Users Conference, Toronto, CA, 10.-12. October 2007 Jiri Dufek...
23
21st. Annual International Emme Users Conference, Toronto, CA, 10.-12. October 2007 Jiri Dufek Transport Research Centre Lísenská 33a 636 00 Brno Czech Republic e-mail: [email protected] Modelling of an optimal future road connection between Northeast Austria and the Czech Republic with minimal environmental impacts.
-
Upload
polly-scott -
Category
Documents
-
view
216 -
download
0
Transcript of 21st. Annual International Emme Users Conference, Toronto, CA, 10.-12. October 2007 Jiri Dufek...

21st. Annual International Emme Users Conference, Toronto, CA, 10.-12. October 2007
Jiri DufekTransport Research Centre
Lísenská 33a636 00 Brno
Czech Republice-mail: [email protected]
Modelling of an optimal future road connection between Northeast Austria and the Czech Republic
with minimal environmental impacts.

21st. Annual International Emme Users Conference, Toronto, CA, 10.-12. October 2007
Outline
1. Project objective and brief description of traffic situation
2. Problems with environmentally protected areas
3. Description of transport plans in 2 scenarios
4. Model approach:
- creation of model transport network
- demand modelling
- traffic assignment
- matrix and network calibration
- freight transport
- supposed general transport growth to 2020 (in all Czech Republic)

21st. Annual International Emme Users Conference, Toronto, CA, 10.-12. October 2007
Outline
5. Resulted traffic volumes in 2020 year:
- “Do nothing” scenario
- Official scenario
- Alternative scenario
6. Scenarios comparison
- “do nothing” vs. official
- “do nothing” vs. alternative
- official vs. alternative
7. Conclusions

21st. Annual International Emme Users Conference, Toronto, CA, 10.-12. October 2007
1. Project objective and brief description of traffic situation
• to optimise future road connection between North East (NE) Austria and the Czech Republic
• to increase the vehicle speed, to mitigate congestions
• to minimize environmental impacts - the intersection of future infrastructure and protected natural areas
Project objective
Alternatives (year 2020)
• zero – no new infrastructure
• official – one new, two widened roads, one motorway and one road city bypasses
• alternative – one new (different route), one widened, one motorway city bypass

21st. Annual International Emme Users Conference, Toronto, CA, 10.-12. October 2007
The model area
• a sub-model of the national Czech Republic model: two from totally fourteen regions
• a 1/7 of the whole Czech Republic area – about 10 000 sq.km
• added on North East part of Austria
1. Project objective and brief description of traffic situation

21st. Annual International Emme Users Conference, Toronto, CA, 10.-12. October 2007
Two protected natural areas in the vicinity of roads
• A – natural wetland „Nove Mlyny: many endangered species
• B – protected natural forest area „Vate Pisky“ („Drifted Sand)
• pure regime: both are in European „Natura 2000“ structure – no building of new infrastructure allowed (unless it would be „public interest“)
A
B
2. Problems with environmentally protected areas

21st. Annual International Emme Users Conference, Toronto, CA, 10.-12. October 2007
The „official“
• 4-lane motorway (R52) enlarged enlarged to the southto the south, a new 4-lane motorway (R55) is designed western form present road I/55, two towns bypasses planned
• very old: planned since 70-ties (lack of environmental protection at this time), impact on traffic already modelled, an implementation is problematic – many mitigation measures required (i.e. fauna passages)
A
BR52
R55
bypass 2bypass 1
3. Description of transport plans in 2 scenarios

21st. Annual International Emme Users Conference, Toronto, CA, 10.-12. October 2007
The „alternative“
• 4-lane motorway (R52) not enlarged, a new motorway (R55) is designed eastern from the present road I/55, motorway, one town bypass planned (town of Breclav, 4-lanes)
• environmentally frendlier - avoidance of natural areas
• impact of traffic unknown – that is why this project was started (by NGO´s)
A
B
bypass 1
R52 R
55
3. Description of transport plans in 2 scenarios

21st. Annual International Emme Users Conference, Toronto, CA, 10.-12. October 2007
The model approach
• subnetwork of the our National Czech Model (also done in EMME)
• zones: cities towns, big villages,
• the sub-model contains two from totally 14 Czech regions, about 1/7 of the total area
• the North East Austria network added
• new zones added: smaller villages, new external zones (traffic from/to another Czech regions)
The model contains
• 3 network scenarios: „zero“, „official“ and „alternative“
• each scenario contains 172 zones:
• 111 Czech internal zones (cties, towns, villages)
• 7 Austrian internal zones (cities, towns)
• 49 Czech external zones (entries to/from model area)
• 5 Austrian external zones
4. The model approach

21st. Annual International Emme Users Conference, Toronto, CA, 10.-12. October 2007
Demand modelling • No. of inhabitants of the cities and villages
• data from population census: no. of people leaving a zone (commuting, schools)
• attractivity: No. of jobs, area of shopping centres
• enthropy model used: e^-θ.Upq
• model does not involve public transport
• that is why - no modal split modelling done: used an average split (42 % of car transport) in the Czech Republic
Calibration of demand matrix• modification of θ parameter: θ = 0.05 – avg. travel time 28,8 min (corresponds
to statistics available)
• monitoring of demand changes betwen selected big zones due to the change of θ parameter:
• final calibration: help of the macro „demadj22“ – improvement of R2 from 0.895 to 0.975
4. The model approach
21st. Annual International Emme Users Conference, Toronto, CA, 10.-12. October 2007
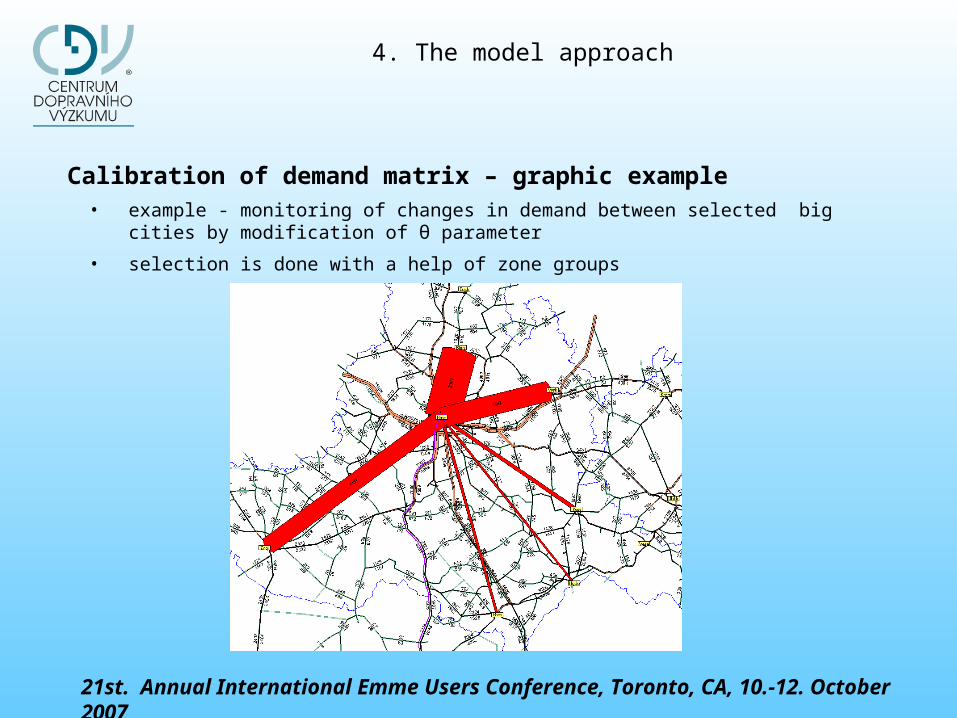
Calibration of demand matrix – graphic example• example - monitoring of changes in demand between selected big cities by
modification of θ parameter
• selection is done with a help of zone groups
4. The model approach
21st. Annual International Emme Users Conference, Toronto, CA, 10.-12. October 2007
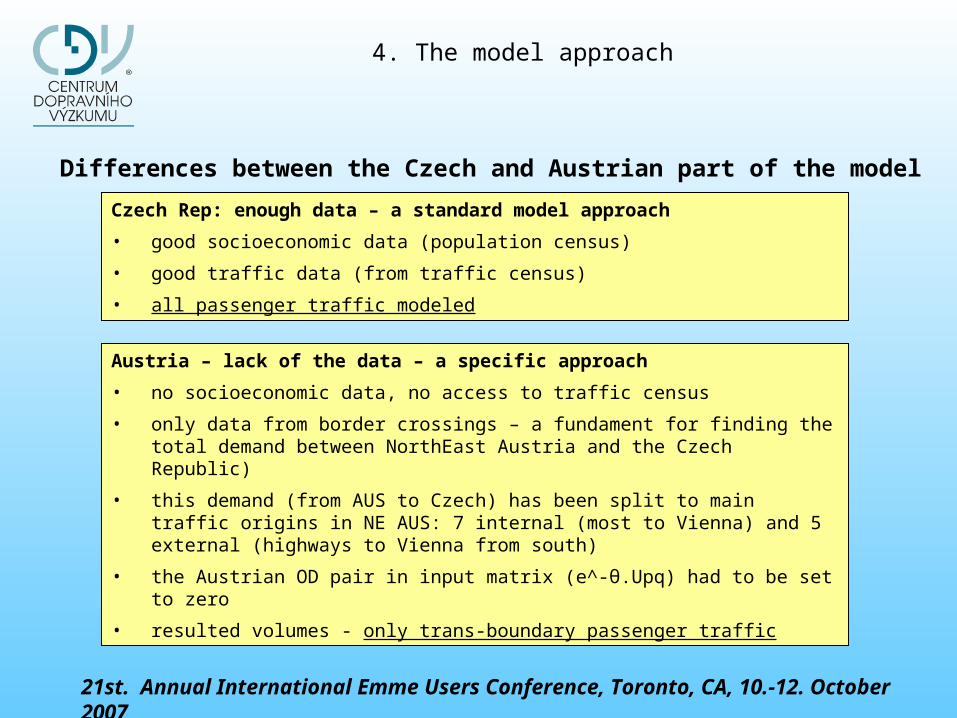
Differences between the Czech and Austrian part of the model
Czech Rep: enough data – a standard model approach
• good socioeconomic data (population census)
• good traffic data (from traffic census)
• all passenger traffic modeled
Austria – lack of the data – a specific approach
• no socioeconomic data, no access to traffic census
• only data from border crossings – a fundament for finding the total demand between NorthEast Austria and the Czech Republic)
• this demand (from AUS to Czech) has been split to main traffic origins in NE AUS: 7 internal (most to Vienna) and 5 external (highways to Vienna from south)
• the Austrian OD pair in input matrix (e^-θ.Upq) had to be set to zero
• resulted volumes - only trans-boundary passenger traffic
4. The model approach

21st. Annual International Emme Users Conference, Toronto, CA, 10.-12. October 2007
Differences between the Czech and Austrian part of the model
• displayed link value: observed counts
• five CZE-AUS border crossings
• No. of cars passing known
• total of crossing is considered as a total demand between NE AUS and CZE
4. The model approach

21st. Annual International Emme Users Conference, Toronto, CA, 10.-12. October 2007
Differences between the Czech and Austrian part of the model
• total: 7289 cars per a day in each direction
• displayed: observed counts – passenger transport (ul3)
7289 7
289
4. The model approach
21st. Annual International Emme Users Conference, Toronto, CA, 10.-12. October 2007
Freight traffic in model
• freight transport – not especially modelled – no freight demand matrix calculated
• averages of heavy vehicles percentage (to all traffic)
• 40.3 % of heavy hehicles in motorways (average)
• 25.0 % of heavy hehicles in 1st class roads
• 20.6 % vehicles on 2nd class roads
• 18.3 % on country roads (3rd class)
• extra link attribute: @hdvpr used – observed percentage of heavy vehicles
• in future scenarios – supposed changes:
• traffic calming in 1 border cross „Valtice – Schrattenberg (now heavy vehicles permitted)
• a permission of heavy vehicles in 1 border crossing „Postorna – Reintal“ (now heavy vehicles prohibited)
4. The model approach

21st. Annual International Emme Users Conference, Toronto, CA, 10.-12. October 2007
Resulted traffic in 2020
• assignment of 3 network scenarios by a present and a future matrix
• equilibrium assignment: VDF : BPR function:
• variables: free flow speed, No. of lanes, link capacity
• differences between present and future matrices:
• different future demand of OD pairs when future infrastructure exceed modeled area
• official traffic growth coefficients applied for 2020 year, compared to 2005 :
• 1.29 for cars (car traffic increase by 29 % supposed )
• 1.06 for heavy vehicles (supposed freight traffic increase by 6 %)
5. Resulted traffic volumes in 2020 year
21st. Annual International Emme Users Conference, Toronto, CA, 10.-12. October 2007
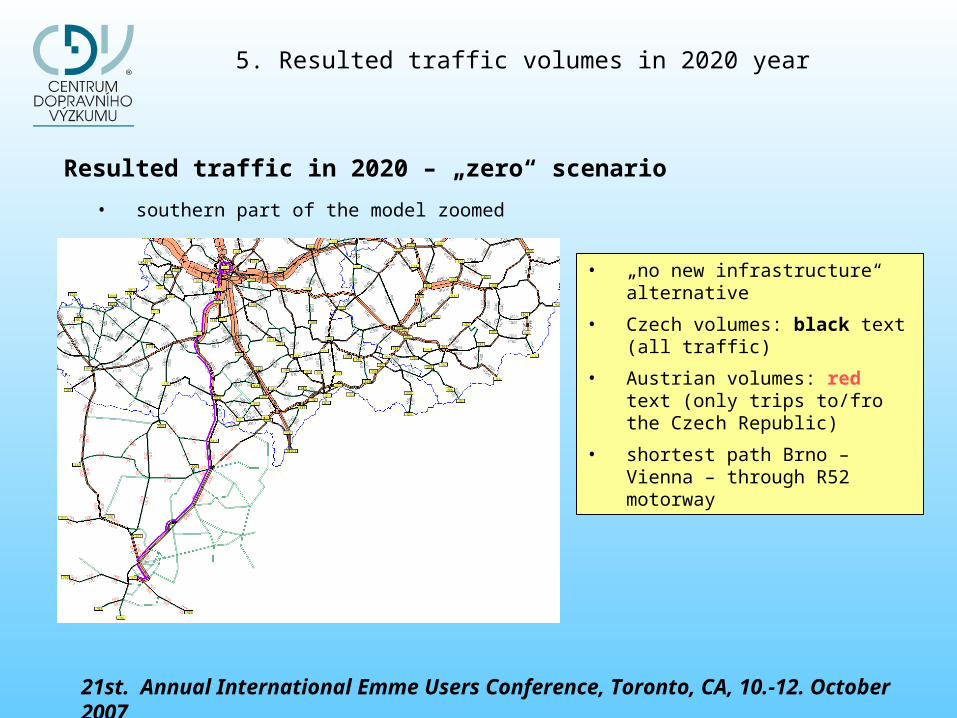
Resulted traffic in 2020 – „zero“ scenario
• „no new infrastructure“ alternative
• Czech volumes: black text (all traffic)
• Austrian volumes: red text (only trips to/fro the Czech Republic)
• shortest path Brno – Vienna – through R52 motorway
• southern part of the model zoomed
5. Resulted traffic volumes in 2020 year

21st. Annual International Emme Users Conference, Toronto, CA, 10.-12. October 2007
Resulted traffic in 2020 – „official“ scenario
• Czech volumes black text (all)
• Austrian volumes red text (only transboundary)
• green links – new (or widened) infrastructure
• in Czech R: 2 bypasses, 2 new motorways
• in Ausatria: Vienna bypass (planned), A5 motorway
• shortest path Brno – Vienna – through R52 motorway UNCHANGED
• southern part of the model displayed
5. Resulted traffic volumes in 2020 year

21st. Annual International Emme Users Conference, Toronto, CA, 10.-12. October 2007
Resulted traffic in 2020 – „alternative“ scenario
• Czech volumes black text (all)
• Austrian volumes red text (only transboundary)
• green links – new (or widened) infrastructure
• in Czechia: 2 bypasses, 2 new motorways
• in Austria: Vienna bypass (planned), A5 motorway
• shortest path Brno – Vienna – through D1 motorway CHANGED
• southern part of the model zoomed
5. Resulted traffic volumes in 2020 year

21st. Annual International Emme Users Conference, Toronto, CA, 10.-12. October 2007
Scenarios comparison: „zero“ vs. „official“
on 80%
on 30%
Positive effect: reduction on I/55
road
on 50%
6. Scenarios comparison

21st. Annual International Emme Users Conference, Toronto, CA, 10.-12. October 2007
Scenarios comparison: „zero“ vs. „alternative“
on 50%
on 40%
the same positive effect:
reduction on I/55 road:
on 60%
Second positive effect: reduction on I/52 road,
traffic shift to D2 motorway
6. Scenarios comparison

21st. Annual International Emme Users Conference, Toronto, CA, 10.-12. October 2007
Scenarios comparison: „A“ vs „O“ („ alternative: vs “official“)
RED - traffic increase in „A“,
• green links – A < Ol
• red links – A > O
• future roads are not displayed
GREEN - traffic decrease in „A“,
6. Scenarios comparison

21st. Annual International Emme Users Conference, Toronto, CA, 10.-12. October 2007
• „zero“ scenario is unsustainable – new infrastructure needed,
• „official“ and „alternative“ scenarios have approx. the same (positive) impact on traffic in eastern part of the modeled area (planned R55 motorway),
• „official“ and „alternative“ scenarios have a different impact in western part of the modeled area (alternative scenario will shift traffic to present highway D2),
• the „alternative“ scenario should change shortest path between Brno and Vienna cities,
• „alternative“ scenario will affect environmentally sensitive areas substantially less that the „official“ one – IT SHOULD BE PREFERED,
• a new EIA study comparing all 3 scenarios is desirable.
Thank you for your attention !
7. Conclusions