2/16/05 1 Studying the Doctor-Patient Relationship: Consumer Evaluations of Care Ron D. Hays, Ph.D....
63
2/16/05 2/16/05 1 Studying the Doctor-Patient Studying the Doctor-Patient Relationship: Consumer Relationship: Consumer Evaluations of Care Evaluations of Care Ron D. Hays, Ph.D. Ron D. Hays, Ph.D. February 24, 2005 (1-3pm) http://www.gim.med.ucla.edu/FacultyPages /Hays/
-
Upload
constance-todd -
Category
Documents
-
view
220 -
download
2
Transcript of 2/16/05 1 Studying the Doctor-Patient Relationship: Consumer Evaluations of Care Ron D. Hays, Ph.D....

2/16/05 2/16/05 11
Studying the Doctor-Studying the Doctor-Patient Relationship: Patient Relationship:
Consumer Evaluations of Consumer Evaluations of CareCare
Ron D. Hays, Ph.D.Ron D. Hays, Ph.D. February 24, 2005 (1-3pm)
http://www.gim.med.ucla.edu/FacultyPages/Hay
s/

2/16/05 2/16/05 22
HS265
• Esrailian, Eric
• Gardner, Keri
• Haley, Theresa
• Kim, Joe
• Rodriguez, Roberto
• Sayles, Jennifer
• Traina, Shana

2/16/05 2/16/05 33
Rationale for CAHPS® Rationale for CAHPS® • Many surveys but no
standardization• Little comparative data• Science uneven and fragmented• National, multi-institutional,
collaborative project launched in 1995 with financing from AHRQ

2/16/05 2/16/05 44
CAHPS® GoalsCAHPS® Goals
• Develop public domain consumer surveys and reports focused on the quality of health care
• Evaluate surveys and reports
• Disseminate products and support use

2/16/05 2/16/05 55
CAHPS® Design PrinciplesCAHPS® Design Principles
•Provide information consumers say they want and need to help select a health plan.
•Collect information for which the consumer is the best or only source.
•Develop core items applicable to everyone.
•Develop a smaller set of supplemental items to address needs of specific populations:
– Medicaid, Medicare, Children

2/16/05 2/16/05 66
CAHPS®: CAHPS®: A National StandardA National Standard
• NCQA uses CAHPS for accreditation• CMS uses Medicare version nationally• Many other organizations use CAHPS• 130 million Americans enrolled in
health plans that collect CAHPS data• Over one-half million Americans
complete CAHPS surveys each year

2/16/05 2/16/05 77
Strong ScienceStrong Science
• Diverse research and development team– AHRQ; AIR; Harvard; RAND; RTI; Westat
• Combination of focus groups, cognitive, psychometric, and protocol testing
• Pilot tested in many populations with nearly 20,000 respondents
• Many contributions to survey science motivated by the development of real world products

2/16/05 2/16/05 88
Extensive Stakeholder Extensive Stakeholder InputInput
• Advisory Committee• NCQA• ABMS Boards• Public comment• Stakeholder meetings• User Group meetings• Continuous patient involvement in
development and testing

2/16/05 2/16/05 99
CAHPS® SurveysCAHPS® Surveys•Standardized survey instruments.
– Reports about health care.– Ratings of health care.
•Adult and child survey versions.
•Spanish and English survey versions.
•Phone and mail modes.
• http://www.cahps-sun.org/ Hargraves JL, Hays RD, & Cleary PD. Psychometric properties of
the Consumer Assessment of Health Plans Study (CAHPS) 2.0 adult core survey. Health Services Research, 38, 1509-1527, 2003.

2/16/05 2/16/05 1010
CAHPS® Global Ratings (4 items)CAHPS® Global Ratings (4 items)
• Health plan
• Health care
• Personal doctor
• Specialist care
2/16/05 2/16/05 1111
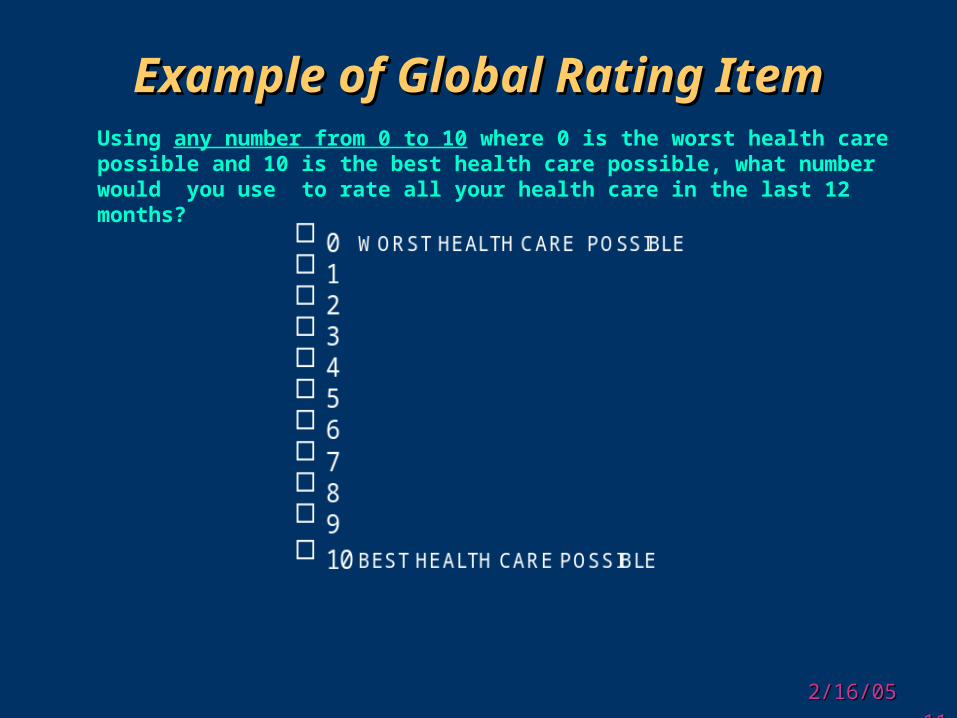
Example of Global Rating ItemExample of Global Rating Item
Using any number from 0 to 10 where 0 is the worst health care possible and 10 is the best health care possible, what number would you use to rate all your health care in the last 12 months?

2/16/05 2/16/05 1212
Reports about Care (20 items)Reports about Care (20 items) • How well doctors communicate (4)• Courtesy/respect/helpfulness of staff
(2)• Getting care that is needed (4)• Getting care quickly (4)• Customer service/information from
plan (3)• Claims processing (3)

2/16/05 2/16/05 1313
How Well Doctors Communicate How Well Doctors Communicate (4 items)(4 items)
In the last 12 months, how often did doctors or other health providers:
• Listen carefully to you?• Explain things in a way you could
understand?• Show respect for what you had to say?• Spend enough time with you?
Never, Sometimes, Usually, Always

2/16/05 2/16/05 1414
Getting Care Quickly (4 items)Getting Care Quickly (4 items)In the last 12 months, how often:
• Did you get the help or advice you needed?
• Did you get care for an illness, injury or condition when you needed care right away?
• (Not counting times you needed care right away), did you get an appointment for health care as soon as you wanted?
• Were you taken to the exam room within 15 minutes of your appointment?
Never, Sometimes, Usually, Always

2/16/05 2/16/05 1515
Courteous and Helpful Courteous and Helpful Office Staff (2 items)Office Staff (2 items)
In the last 12 months, how often did/were office staff:
• Treat you with courtesy and respect?• As helpful as you thought they should
be?
Never, Sometimes, Usually, Always
2/16/05 2/16/05 1616
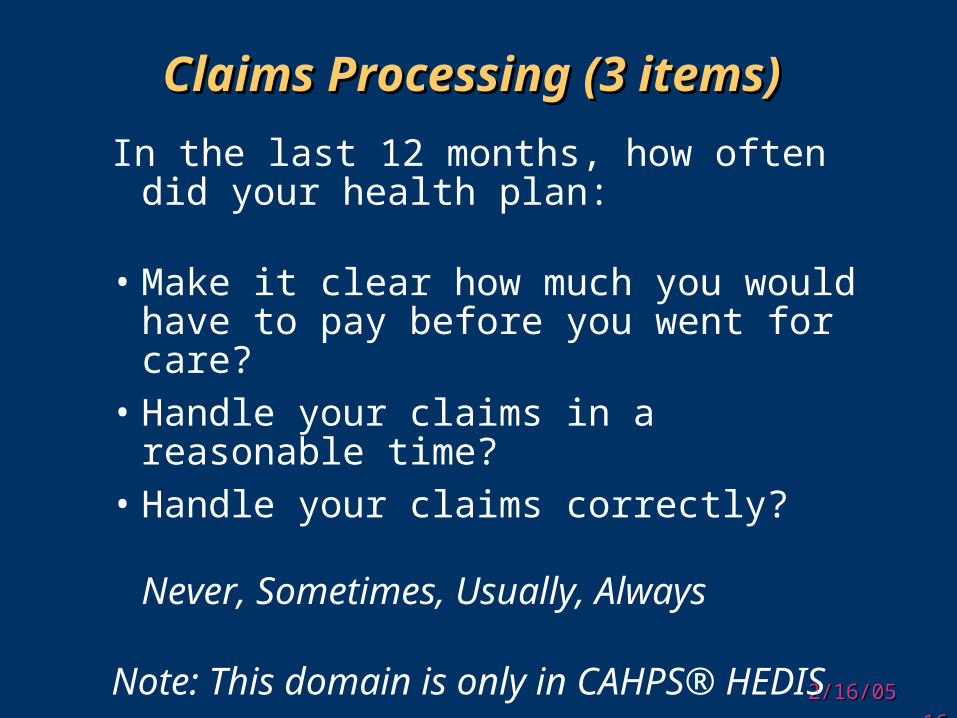
Claims Processing (3 items) Claims Processing (3 items)
In the last 12 months, how often did your health plan:
• Make it clear how much you would have to pay before you went for care?
• Handle your claims in a reasonable time?
• Handle your claims correctly?
Never, Sometimes, Usually, Always
Note: This domain is only in CAHPS® HEDIS

2/16/05 2/16/05 1717
Getting Needed Care (4 items)Getting Needed Care (4 items)
In the last 12 months, how much of a problem, if any, was:
• Getting a personal doctor or nurse you are happy with?
• Getting to see a specialist you needed?
• Getting care, tests or treatment you or a doctor believed necessary?
• Delays in health care while waiting for approval?
Big Problem, Small Problem, No Problem

2/16/05 2/16/05 1818
Customer Service (3 items)Customer Service (3 items)
In the last 12 months, how much of a problem, if any, was:
• Finding or understanding information [about how your health plan works in written material or on the Internet]?
• Getting the help you needed when you called your plan’s customer service?
• Paperwork for your health plan?
Big Problem, Small Problem, No Problem

2/16/05 2/16/05 1919
Range of CAHPS®Range of CAHPS® •Health plan•Physician group•Individual provider•Hospital
http://www.cms.hhs.gov/quality/hospital/3State_Pilot_Analysis_Final.pdf
•Nursing home•Behavioral health care
http://www.hcp.med.harvard.edu/echo/home.htmlhttp://www.hcp.med.harvard.edu/echo/home.html
•ESRD•American Indian•Chiropractic, dental care, people with mobility
impairments

2/16/05 2/16/05 2020
Physician Value Check (PVC)Physician Value Check (PVC)
•Pacific Business Group on Health (PBGH)
– Purchaser driven– Hold HMO provider groups accountable– Stimulate quality-based competition
•Help consumers and purchasers choose physician groups
•Results publicly reported (www.healthscope.org)
2/16/05 2/16/05 2121
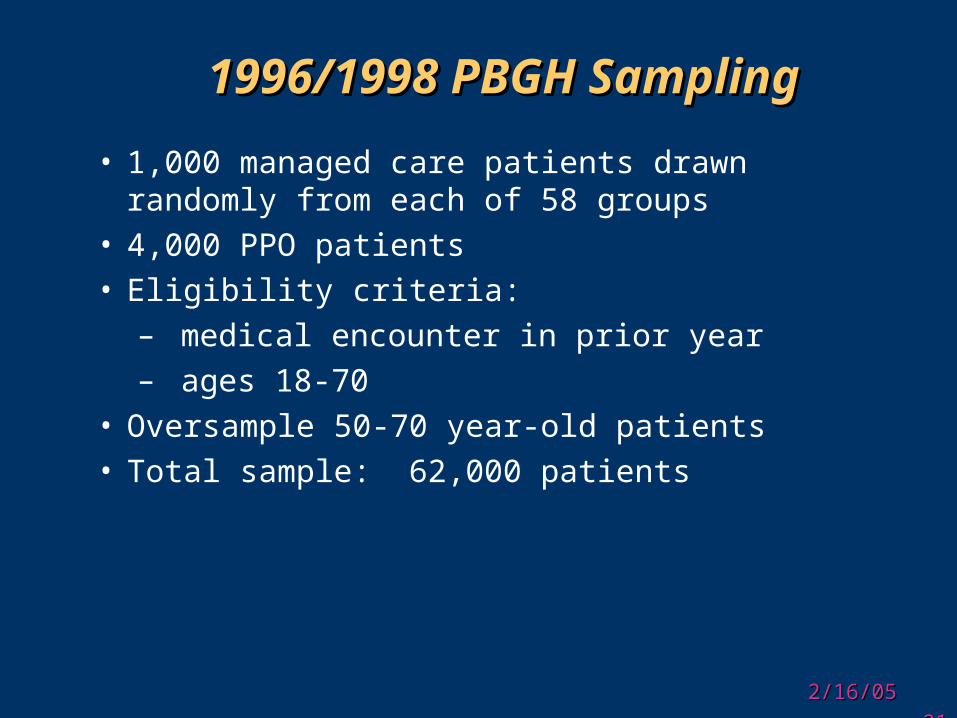
1996/1998 PBGH Sampling1996/1998 PBGH Sampling
• 1,000 managed care patients drawn randomly from each of 58 groups
• 4,000 PPO patients• Eligibility criteria:
– medical encounter in prior year– ages 18-70
• Oversample 50-70 year-old patients• Total sample: 62,000 patients

2/16/05 2/16/05 2222
Provider LevelProvider Level
Growing interest in shifting focus of measurement down to provider level
– Consumers choose doctors first, then select plan affiliated with doctor
– Closer to unit of accountability and change
– More useful for quality improvement

2/16/05 2/16/05 2323
Would you put your Would you put your trust intrust in this doctor?this doctor?

2/16/05 2/16/05 2424

2/16/05 2/16/05 2525
New CAHPS® SurveysNew CAHPS® Surveys(Ambulatory CAHPS = A-(Ambulatory CAHPS = A-
CAHPS)CAHPS)• Will include surveys about individual
physicians
• Some comparability across levels (e.g., physicians and health plans) to reduce redundancy
• Measure only the functions that are appropriate for each level/group-e.g., do not assess prevention by surgeons

2/16/05 2/16/05 2626
Picker Survey (Medical, Picker Survey (Medical, Surgical, Childbirth)Surgical, Childbirth)
• Coordination of care (6 items)• Continuity and transition (4 items)• Emotional support (6 items)• Information and education (5 items)• Involvement of family/friends (3 items)• Physical comfort (5 items)• Respect for Patient’s Preferences (4 items)• Overall impression
http://www.pickereurope.org/http://www.nationalresearch.com/patsat.html
Fremont AM. Patient-centered processes of care and long-term outcomes of myocardial infarction. JGIM, 16, 800-808, 2000.

2/16/05 2/16/05 2727
Picker Mail MethodologyPicker Mail Methodology
• Mailed to randomly selected discharged patients along with cover letter from hospital CEO
• 2 weeks later, postcard reminder• 2 weeks later, 2nd questionnaire mailed
with cover letter• 8 week data collection field period

2/16/05 2/16/05 2828
Hospital CAHPS®Hospital CAHPS®• Communication with nurse (3 items; 1-3) • Communication with doctors (3 items; 5-7)• Communication about medication (2 items; 16, 17)• Nursing services (2 items; 4, 11)• Discharge information (2 items; 19, 20)• Pain control (2 items; 13, 14)• Physical environment (2 items; 8-9)• Global rating of hospital (21)• Recommend hospital to family and friends (22)

2/16/05 2/16/05 2929
National Committee on Quality National Committee on Quality Assurance 1999 State of Assurance 1999 State of
Managed Care QualityManaged Care Quality
• 247 managed health care organizations
• 410 health plan products (HMO and POS plans)
– there were 650 HMOs in US (half NCQA accredited)
• 70 million Americans represented

2/16/05 2/16/05 3030
Plans in Highest Quartile on Plans in Highest Quartile on CAHPS CAHPS
Provide Better Quality of CareProvide Better Quality of Care

2/16/05 2/16/05 3131
National Healthcare Quality National Healthcare Quality ReportReport
National Healthcare Disparities National Healthcare Disparities ReportReport
http://www.qualitytools.ahrq.gov/qualityreport/
http://www.qualitytools.ahrq.gov/disparitiesreport/

2/16/05 2/16/05 3232
National CAHPSNational CAHPS®® Benchmarking Database Benchmarking Database
(NCBD)(NCBD)• National repository of CAHPS® data (data from
about 700 health plans each year)
• 2.3 million respondents over 7 years
• Used for benchmarking and research
• Generic and customized reports
• Funded by AHRQ and administered by Westat

2/16/05 2/16/05 3333
Spanish language Hispanics Spanish language Hispanics have negative experiences have negative experiences
with carewith care
• More negative perceptions of provider communication than reported by Latino/English or non-Hispanic white respondents among 6,911 adults (Morales et al., 1999)
• More negative perceptions of adult and children’s care than non-Hispanic whites
• 9,540 children for CAHPS® 1.0 (Weech-Maldonado et al., 2001)
• 49,327 adults in Medicaid for CAHPS® 2.0 (Weech-Maldonado et al., 2003)
– National CAHPS® Benchmarking Database

2/16/05 2/16/05 3434
Asians tend to have most Asians tend to have most negative perceptions of negative perceptions of
carecare
• Especially Asians that speak a language other than English
– 6,911 Unified Medical Group Association patients • 72% of Asians vs. 55% whites believed improvement
needed in obtaining treatment (Snyder et al., 2000)
– National CAHPS® Benchmarking Database• 28,354 adults and 9,540 children for CAHPS® 1.0 • 49,327 adults in Medicaid for CAHPS® 2.0
– 120,855 Healthcare Market Guide respondents (Haviland et al., 2003)

2/16/05 2/16/05 3535
• Asian adults reported worse experiences with care but similar global ratings compared to whites in commercial and Medicaid plans (Morales et al., 2001)
• Worse reports of care but similar global ratings for Asian children compared to whites in Medicaid managed care (Weech-Maldonado et al., 2001)
Differences in Reports Differences in Reports Greater than for RatingsGreater than for Ratings

2/16/05 2/16/05 3636
• African Americans, Hispanic-Spanish speakers, American Indians/whites and whites speaking a non-English language more likely than white-English language speakers to be clustered in worse plans.
• But within plan differences in race exceeded between plan differences.
Weech-Maldonado et al. (2004)
Within Plan Differences Within Plan Differences Account for Majority of Account for Majority of Race/Ethnic DifferencesRace/Ethnic Differences

2/16/05 2/16/05 3737
Medicare Managed Medicare Managed CareCare
• 2002 CAHPS Medicare Managed Care survey
• Respondents– Response rate (unadjusted): 82% – 125,369 adults enrolled in 181 Medicare
managed care plans across the US• 8,463 Hispanics (7%)
– 7,110 English speakers– 1,353 Spanish speakers
• 13,264 Other racial/ethnic minorities (11%)

2/16/05 2/16/05 3838
Independent VariablesIndependent Variables • Race/ethnicity
– White– Hispanic or Latino– Black or African
American– Asian– Pacific Islanders– American
Indian/Alaskan Native– American
Indian/White– Black/White– Other– Missing
• Hispanic language subgroups based on survey language– Hispanic English– Hispanic Spanish
• Case Mix Variables– Age– Health status– Education– Gender
• Medicaid/Medicare dually eligible

2/16/05 2/16/05 3939
Data AnalysisData Analysis
• Ordinary least squares regression– Reports = f (race/ethnicity,
Hispanic language, case mix)
• Standard errors adjusted for the clustered nature of the data (using the Huber/White correction)

2/16/05 2/16/05 4040
Summary TableSummary Table
Composites
Tim
elin
ess
Pro
vid
er
Com
m.
Sta
ffH
elp
ful
Pla
nS
erv
ice
Acce
ssM
Ds
Hom
e
Health
Med
icines
Aw
are
ness
Hispanic English
-6.0 -2.0 -2.6 -5.5 -9.8 -3.9 -0.8
Hispanic Spanish
-6.8 -2.8 -3.4 3.6 -4.5 -2.3
Comparison group- Whites. Beta coefficients shown if p< 0.05 level.

2/16/05 2/16/05 4141
• Hispanic English reported worse experiences with care than whites for all dimensions except provider communication
• Hispanic Spanish reported worse experiences with care than whites for 5 dimensions of care (timeliness, communication, staff helpfulness, prescriptions, and awareness), but better perceptions of getting needed care
Ethnicity ResultsEthnicity Results

2/16/05 2/16/05 4242
• Spanish speakers had worse reports about provider communication than English speakers
• Spanish speakers had more positive reports than English speakers for getting needed care
Language ResultsLanguage Results
2/16/05 2/16/05 4343
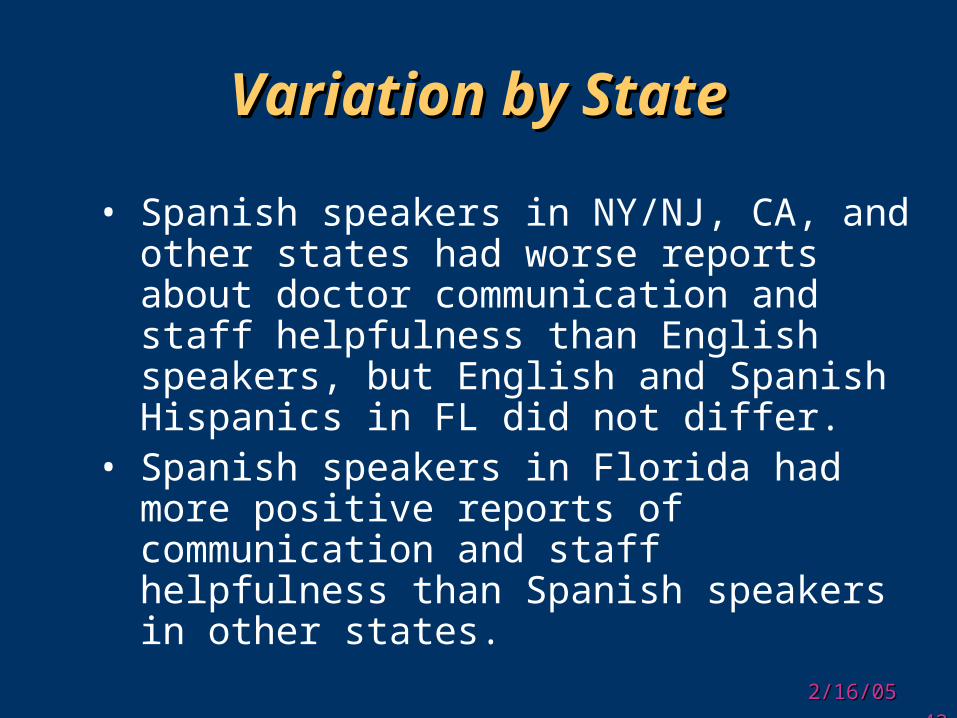
Variation by StateVariation by State
• Spanish speakers in NY/NJ, CA, and other states had worse reports about doctor communication and staff helpfulness than English speakers, but English and Spanish Hispanics in FL did not differ.
• Spanish speakers in Florida had more positive reports of communication and staff helpfulness than Spanish speakers in other states.
2/16/05 2/16/05 4444
True differences or True differences or response “bias”response “bias”
• 2 of 9 rating items displayed differential item functioning between Hispanics and non-Hispanic whites (Morales et al. 2000)
• Support for equivalence of CAHPS® 1.0 data for Hispanics and non-Hispanic whites (Marshall et al., 2001)
• Similar reliability and construct validity for English and Spanish language respondents to CAHPS® 2.0 survey (Morales et al., 2003)

2/16/05 2/16/05 4545
Race/Ethnic Differences Race/Ethnic Differences LiteratureLiterature
• Morales, L. S., Cunningham, W. E., Brown, J. A., Liu, H., & Hays, R. D. (1999). Are Latinos less satisfied with communication from health care providers? Journal of General Internal Medicine, 14, 409-417.
• Morales, L., Reise, S., & Hays, R.D. (2000). Evaluating the equivalence of health care ratings by whites and Hispanics. Medical Care, 38, 517-527.
• Snyder, R., Cunningham, W., Nakazono, T. T., & Hays, R. D. (2000). Access to medical care reported by Asians and Pacific Islanders in a West Coast physician group association. Medical Care Research and Review, 57, 196-215.
• Morales, L. S., Elliott, M. N., Weech-Maldonado, R., Spritzer, K.L., & Hays, R. D. (2001). Differences in CAHPS® adult survey ratings and reports by race and ethnicity: An analysis of the National CAHPS® Benchmarking Data 1.0. Health Services Research, 36, 595-617.
• Marshall, G. N., Morales, L. S., Elliott, M., Spritzer, K., & Hays, R. D. (2001). Confirmatory factor analysis of the Consumer Assessment of Health Plans Study (CAHPS) 1.0 core survey. Psychological Assessment, 13, 216-229.

2/16/05 2/16/05 4646
Race/Ethnic Differences Race/Ethnic Differences LiteratureLiterature
• Weech-Maldonado, R., Morales, L. S., Spritzer, K., Elliott, M., & Hays, R. D. (2001). Racial and ethnic differences in parents’ assessments of pediatric care in Medicaid managed care. Health Services Research, 36, 575-594.
• Weech-Maldonado, R., Morales, L. S., Elliott, M., Spritzer, K. L., Marshall, G., & Hays, R. D. (2003). Race/ethnicity, language and patients’ assessments of care in Medicaid managed care. Health Services Research., 38, 789-808.
• Morales, L. S., Weech-Maldonado, R., Elliott, M. N., Weidmer, B., & Hays, R. D. (2003). Psychometric properties of the Spanish Consumer Assessment of Health Plans Survey (CAHPS). Hispanic Journal of Behavioral Sciences., 25 (3), 386-409.
• Haviland, M. G., Morales, L. S., Reise, S. P., & Hays, R. D. (2003). Do health care ratings differ by race/ethnicity? The Joint Commission Journal on Quality and Safety, 29, 134-145.
• Weech-Maldonado, R., Elliott, M., Morales, L. S., Spritzer, K. L., Marshall, G., & Hays, R. D. (2004). Health plan effects on patient assessments of Medicaid managed care among racial/ethnic minorities. Journal of General Internal Medicine., 19, 136-145.

2/16/05 2/16/05 4747
Online InformationOnline Information
• http://uc.chooser.pbgh.org/• http://www.medicare.gov/

2/16/05 2/16/05 4848

2/16/05 2/16/05 4949
What do the stars mean?
• Excellent– More than 80% of the medical plan members had
a positive experience.
• Good– 3 of every 4 of the members had a positive
experience.
• Fair– 2/3 of the members had a positive experience
• Poor– 60% of the members had a positive experience

2/16/05 2/16/05 5050
visit Healthscope.org.
• The Member Rating of Health Plan summary topic is based on a single CAHPS® survey question that asks members to rate all of their experience with the health plan. The seven topics that are listed in the Member Rating of Health Plan section are not included in that topic’s summary score. Member experiences in these seven areas influence their overall rating of the health plan.
2/16/05 2/16/05 5151

2/16/05 2/16/05 5252

2/16/05 2/16/05 5353
Methods Methods (Spranca et al., Health Services Research, 35 (5Pt 1) 933-947, 2000)
• Research participants: 311 privately insured adults in Los Angeles County
• Asked to imagine they were trying to pick a health plan for themselves
• Presented with materials for four health plans
• Booklet on plan features plus:
• Booklet or computerized guide with CAHPS® health plan reports and ratings
• Ask to “choose” a plan and then rate materials

2/16/05 2/16/05 5454
Variations in CAHPSVariations in CAHPS®® Ratings Ratings
• Half of experimental group:– Plans with more coverage (higher
premiums) were assigned higher ratings
• Other half of experimental group:– Plans with less coverage (lower
premiums) were assigned higher ratings
2/16/05 2/16/05 5555
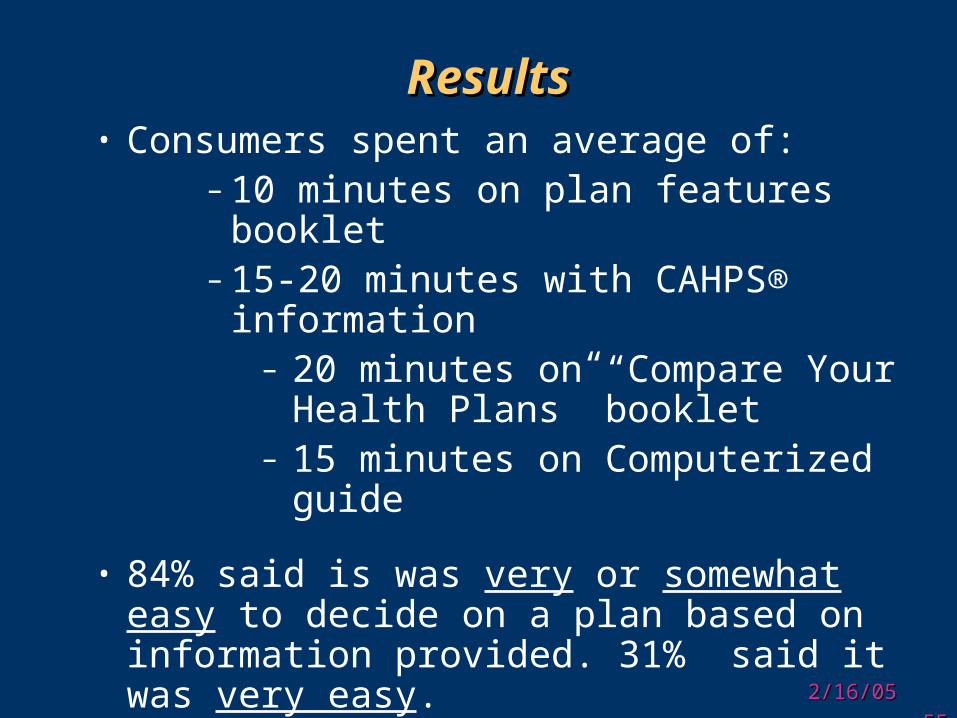
ResultsResults• Consumers spent an average of:
– 10 minutes on plan features booklet
– 15-20 minutes with CAHPS® information
– 20 minutes on “Compare Your Health Plans” booklet
– 15 minutes on Computerized guide
• 84% said is was very or somewhat easy to decide on a plan based on information provided. 31% said it was very easy.

2/16/05 2/16/05 5656
How Easy to Understand How Easy to Understand Information?Information?
Very Easy
Somewhat Easy
Very or somewhat
hard
Plan Features Booklet
63% 32% 5%
CAHPS® Booklet
48% 41% 11%
CAHPS® Computer
42% 44% 14%

2/16/05 2/16/05 5757
Importance RatingsImportance Ratings
Print Guide
Computer Guide
Control
Benefits Package 9.7 9.5 9.6
Premiums 9.5 9.1 9.5
Out-of-Pocket Costs 9.4 8.9 9.2
Type of Plan 8.9 8.8 8.6
Own Doctor In Plan 8.9 8.7 8.7
Consumer Reports/Ratings
6.7 7.3 6.9
NOTE: Mean on a scale from 0 to 10.

2/16/05 2/16/05 5858
Effects of CAHPSEffects of CAHPS®® Information Information on Choice of Planon Choice of Plan
• In the control group, most people (86%) chose the more expensive plan that provided greater benefits (14% did not)
• If more expensive plans were linked with higher CAHPS® ratings, no shift in preferences
• If less expensive plans were linked with higher CAHPS® ratings, many consumers (41%) chose the less expensive plan

2/16/05 2/16/05 5959
Summary of Lab StudySummary of Lab Study
• Quality information about health plans from the consumer perspective is new, and consumers are not yet convinced of its usefulness and objectivity
• Even so, results suggest that, under certain conditions, consumers will use quality ratings in choosing a plan
• CAHPS® data affect plan choices in situations where they reveal high-quality plans that cost less

2/16/05 2/16/05 6060
Demonstration SitesDemonstration Sites•Positive association between self-report
of use of report and perceived ability to judge plan quality, but…
•No overall effect on plan choice in IowaFarley, D. O., et al. Impact of CAHPS performance information
on health plan choices by Iowa Medicaid beneficiaries. Medical Care Research and Review, 59, 319-336, 2002.
•No overall effect on plan choice in New Jersey, but small effect on subgroup of “receptive” Medicaid beneficiaries.
Farley, D. O., et al. Effects of CAHPS health plan performance information on plan choices by New Jersey Medicaid beneficiaries. Health Services Research, 37, 985-1007, 2002.

2/16/05 2/16/05 6161

2/16/05 2/16/05 6262
Patients Who Wanted to See a Patients Who Wanted to See a Specialist, But Did Not, were Specialist, But Did Not, were
Twice as Inclined to Leave the Twice as Inclined to Leave the PlanPlan
(Kerr et al., (Kerr et al., Journal of General Internal MedicineJournal of General Internal Medicine, , 1414, 287-296, 1999), 287-296, 1999)

2/16/05 2/16/05 6363
Satisfaction with Access and Satisfaction with Access and Office Wait Associated With Office Wait Associated With
Wanting to Leave GroupWanting to Leave Group(Hays et al., Archives of Internal Medicine, 158, 785-790, 1998)