21595 k12650 wo5 UAG Cov - IIS Windows...
153
2006 Annual Report
Transcript of 21595 k12650 wo5 UAG Cov - IIS Windows...

2006 Annual Report
United
Auto
2006 A
nnual R
eport
United Auto Group, Inc.2555 Telegraph RoadBloomfield Hills, MI 48302-0954
www.unitedauto.com
in 2008Coming
www.smartusa.com

Dealership FacilitiesState-of-the-art
Turnersville Auto Mall — Turnersville, New JerseyBrands Represented: Acura, BMW, Cadillac, Chevrolet, Honda, HUMMER, Hyundai, Nissan, Scion, Toyota
Inskip Auto Mall — Warwick, Rhode IslandBrands Represented: Acura, Audi, BMW, Bentley, Infiniti, Lexus, Mercedes-Benz, MINI, Nissan, Porsche, Volvo
■ Total Revenue $11.2 Billion – up 16.4%
■ Same-Store Retail Revenue – up 4.3%
■ Income $130.6 Million – up 9.6%
■ Earnings Per Share $1.39 – up 9.4%
21%
18%
16%
10%
7%
4%
4%
3%
Other 6%
Brand Mix
2006 Brand Mix by Manufacturer
7%
31%
62% Premium
DaimlerChrysler 11%
United States 68% 4.8%
Outside U.S. 32% 3.2%
Gross Profit Per Vehicle
New $2,993
Used $2,427
Finance and Insurance $917
Financial Highlights(Based on Continuing Operations)
2006
VolumeForeign Brands
GM, Ford, Chrysler (7%)
Foreign Nameplates(93%)
Same-StoreRevenue Mix Retail Revenue
Growth

hile 2006 was a challenging yearfor many in the automotive industry,I am pleased with UnitedAuto’s
performance and the accomplishments of ourtalented employees. Our business producedgrowth in revenue, gross profit, operatingincome, income from continuing operationsand related earnings per share. During theyear we issued our first ever 2-for-1 stocksplit, and we rewarded our stockholders byincreasing our dividends to $0.28 per share.
At UnitedAuto, we believe the foundations ofour continued growth are our brand mix andgeographical diversification, coupled with ourcapital investment program. As a result, wefocus our investments in an effort to enhancethese areas.
During 2006, we acquired businesses with annualized revenues of over $1.5 billion.We also invested more than $220 million inthe expansion and improvement of ourdealership operations. These investmentsfurther enhanced our brand mix and geographicdiversity, and allowed us to place over 90 incremental service bays into operation.As a result, we increased the percent of ourrevenue attributable to foreign nameplates to 93% of our total revenues, increased thecontribution of our foreign operations to 32% of our total revenues, and achieved a6.9% same-store revenue increase in ourhigher margin service and parts operations.
The execution of our vision over time hashelped us achieve consistent same-storegrowth. In 2006, UnitedAuto achieved itseighth consecutive year of same-storerevenue increases, posting a 4.3% increasein retail same-store revenue for the year,including growth of 4.8% in the United Statesand 3.2% internationally. We have alsorealized an average 9.4% same-store growthin our higher margin service and partsoperations over the last five years.
Another critical element of our success is theoutstanding dedication of UnitedAuto’s nearly16,000 worldwide employees. Successfulautomotive retailing requires providingoutstanding customer satisfaction—and ourgoal is to exceed expectations at every levelwithin our organization. Through extensivehiring, training and development practices,we strive to create long-term employee
retention to provide a consistent contact forour customers. During 2006, we reduced ouremployee turnover to 31%, representing an8.8% improvement over the prior year.
UnitedAuto also solidified its capital structurethis year by raising $750 million in long-termdebt. The capital raised from these transactionswas used to repurchase 1,000,000 shares ofour outstanding common stock and to repayexisting debt. Our new capital structure locksin today’s attractive interest rates and providesus with the financial flexibility to continue theexecution of our business strategies.
I look forward to 2007 and the challenges of another exciting year in our business.During the coming year, we expect tocomplete construction projects in Turnersville, New Jersey and Warwick, Rhode Island,where we have been under construction for almost three years. We are optimistic that these campuses provide us with theopportunity to generate long-term growth and customer satisfaction in those markets.Coupled with the continuing maturity of otherprojects we have completed in the UnitedStates and abroad, we believe we havesignificant opportunities for our dealerships to increase sales and profitability.
Looking to 2008, we are excited about ourexclusive distribution of the smart brand inthe United States. There is a great deal ofinterest in this product from customers andpotential retailers. We are currently evaluatingpotential retail partners and expect toannounce the first phase of dealers duringthe second quarter of 2007. Additionally, wewill help establish the smart brand in theUnited States by staging a cross-country roadshow to highlight the innovativeness andfunctionality of this unique car. We believeconsumers will be surprised by all this car hasto offer, and we look forward to delivering thefirst fortwo in the first quarter of 2008.
We remain excited about the opportunities inthe automotive retail industry and thank you,our shareholders, for your continued support.
Roger S. PenskeChairman
W
Roger S. PenskeChairman of the Boardand CEO
StockholdersTo Our

ARIZONAAcura North ScottsdaleAudi North ScottsdaleBMW North ScottsdaleJaguar North ScottsdaleJaguar ScottsdaleLand Rover North ScottsdaleLand Rover ScottsdaleLexus of ChandlerMercedes-Benz of Chandler MINI North ScottsdalePorsche North ScottsdaleRolls-Royce ScottsdaleScottsdale Aston MartinScottsdale AudiScottsdale BentleyScottsdale Ferrari MaseratiScottsdale LexusTempe HondaVolkswagen North ScottsdaleVolvo North Scottsdale
ARKANSASAcura of FayettevilleChevrolet/HUMMER of FayettevilleHonda of FayettevilleLanders Chevrolet HUMMERLanders Chrysler Jeep DodgeLanders Ford Lincoln MercuryToyota-Scion of Fayetteville
CALIFORNIAAcura of EscondidoAston Martin of San DiegoAudi EscondidoAudi Stevens CreekBMW of San DiegoCapitol HondaCerritos Buick Pontiac HUMMER GMCHonda Mission ValleyHonda NorthHonda of EscondidoJaguar Kearny MesaKearny Mesa AcuraKearny Mesa Toyota-ScionLexus Kearny MesaLos Gatos AcuraMarin HondaMazda of EscondidoMercedes-Benz of San Diego (& Maybach)Penske Cadillac HUMMER South BayPorsche of Stevens Creek
CONNECTICUTAudi of FairfieldHonda of DanburyMercedes-Benz of FairfieldPorsche of Fairfield
FLORIDACentral Florida Toyota-ScionCitrus Chrysler Jeep DodgePalm Beach MazdaPalm Beach SubaruPalm Beach Toyota-ScionWest Palm Nissan
GEORGIAAtlanta Toyota-ScionHonda Mall of GeorgiaUnited BMW of GwinnettUnited BMW of Roswell
INDIANAPenske ChevroletPenske Honda
MICHIGANHonda BloomfieldRinke CadillacRinke Pontiac GMC TruckRinke Toyota-ScionToyota-Scion of Waterford
MINNESOTAMotorwerks BMW/MINI
MISSISSIPPILanders DodgeLanders Nissan
NEW JERSEYAcura of TurnersvilleBMW of TurnersvilleChevrolet HUMMER Cadillac of TurnersvilleDiFeo BMWFerrari Maserati of Central New JerseyGateway Toyota-ScionHonda of TurnersvilleHudson NissanHudson Toyota-ScionHyundai of TurnersvilleLexus of BridgewaterNissan of TurnersvilleToyota-Scion of Turnersville
NEW YORKHonda of NanuetMercedes-Benz of NanuetWestbury Toyota-Scion
NEVADAPenske Wynn Ferrari Maserati
OHIOHonda of MentorInfiniti of BedfordMaserati of ClevelandMercedes-Benz of BedfordNissan of North OlmstedToyota-Scion of Bedford
OKLAHOMAJaguar of TulsaLincoln Mercury of Tulsa (4111 S Memorial)Lincoln Mercury of Tulsa (9607 S Memorial)United Ford NorthUnited Ford SouthUnited HUMMER of TulsaVolvo of Tulsa
RHODE ISLANDInskip AcuraInskip AudiInskip Autocenter (Mercedes-Benz)Inskip Bentley ProvidenceInskip BMWInskip InfinitiInskip LexusInskip NissanInskip PorscheInskip Volvo
TENNESSEELanders Ford of MemphisWolfchase Toyota-Scion
TEXASBMW of AustinGoodson Honda NorthGoodson Honda West
VIRGINIAAston Martin of Tysons CornerAudi of Tysons CornerMercedes-Benz of Tysons Corner
(& Maybach)Porsche of Tysons Corner
DealershipsUnitedAuto Group

UNITED KINGDOMBentley Lamborghini BirminghamBentley Lamborghini EdinburghBentley ManchesterBradford AudiGraypaul Edinburgh (Ferrari/Maserati)Graypaul Nottingham (Ferrari/Maserati)Guildford AudiGuy Salmon Jaguar AscotGuy Salmon Jaguar CoventryGuy Salmon Jaguar GatwickGuy Salmon Jaguar MaidstoneGuy Salmon Jaguar NorthamptonGuy Salmon Jaguar OxfordGuy Salmon Jaguar Thames DittonGuy Salmon Land Rover AscotGuy Salmon Land Rover CoventryGuy Salmon Land Rover GatwickGuy Salmon Land Rover KnutsfordGuy Salmon Land Rover LeedsGuy Salmon Land Rover MaidstoneGuy Salmon Land Rover PortsmouthGuy Salmon Land Rover SheffieldGuy Salmon Land Rover StockportGuy Salmon Land Rover Stratford-upon-AvonGuy Salmon Land Rover Thames DittonGuy Salmon Land Rover WakefieldGuy Salmon Stratford (Aftersales)Harrogate AudiKings Bristol Chrysler Jeep DodgeKings Cheltenham & Gloucester
(Chrysler, Jeep, Dodge)Kings Manchester (Chrysler, Jeep, Dodge)Kings Swindon (Chrysler, Jeep, Dodge)Leeds AudiLexus BirminghamLexus BristolLexus CardiffLexus LeicesterLexus Milton KeynesLexus OxfordMayfair AudiMercedes-Benz of BathMercedes-Benz of BedfordMercedes-Benz of CarlisleMercedes-Benz of Cheltenham and GloucesterMercedes-Benz of Cribbs CausewayMercedes-Benz of KetteringMercedes-Benz of Milton KeynesMercedes-Benz of NewburyMercedes-Benz of NorthamptonMercedes-Benz of SunderlandMercedes-Benz of TeessideMercedes-Benz of Weston-Super-MareMercedes-Benz/smart of BristolMercedes-Benz/smart of New CastleMercedes-Benz/smart of SwindonOxford SaabPorsche Centre EdinburghPorsche Centre GlasgowPorsche Centre Mid-SussexPorsche Centre Silverstone
Reading AudiRedhill HondaRolls-Royce Motor Cars SunningdaleRydale BMW/MINI CardiffRydale BMW/MINI CentralRydale BMW/MINI NewportRydale BMW/MINI SuttonRydale BMW/MINI WarleyRyfield Chrysler Jeep Dodge New CastleRyfield Chrysler Jeep Dodge StocktonSlough Audismart North East Stocktonsmart of Milton KeynesSytner Canary Wharf (BMW/MINI) Sytner Chigwell (BMW/MINI)Sytner Coventry (BMW/MINI)Sytner Harold Wood (BMW/MINI)Sytner High Wycombe (BMW)Sytner Leicester (BMW/MINI)Sytner Nottingham (BMW/MINI, Alpina)Sytner Rolls-Royce Motor CarsSytner Sheffield (BMW/MINI)Sytner Solihull (BMW/MINI)Sytner Sunningdale (BMW/MINI)Tollbar Coventry (Volvo)Tollbar Twickenham (Volvo)Tollbar Warwick (Volvo)Toyota World (Birmingham)Toyota World (Bridgend)Toyota World (Bristol North)Toyota World (Bristol South)Toyota World (Cardiff)Toyota World (Newport)Toyota World (Tamworth)Victoria Audi (After Sales)Wakefield AudiWest London Audi
GERMANYAutohaus Augsburg (BMW(4)/MINI)Tamsen, Bremen (Aston Martin, Bentley, Ferrari,
Maserati, Rolls-Royce)Tamsen, Hamburg (Aston Martin, Ferrari,
Lamborghini, Maserati, Rolls-Royce)
PUERTO RICOLexus de San JuanTriangle Chrysler, Dodge, Jeep, Honda
del OesteTriangle Chrysler, Dodge, Jeep de Ponce Triangle Honda 65 de InfanteriaTriangle Honda-Suzuki de PonceTriangle Mazda de PonceTriangle Nissan del Oeste Triangle Toyota-Scion de San Juan
We also own approximately 50% of the following dealerships:
GERMANYAix Automobile (Toyota, Lexus)Audi Zentrum AachenAutohaus Krings (Volkswagon)Autohaus Nix (Frankfurt) (Toyota, Lexus)Autohaus Nix (Offenbach) (Toyota, Lexus)Autohaus Nix (Wachtersbach) (Toyota, Lexus)Autohaus Piper (Volkswagen)Autohaus Reisacher (Krunback) (BMW)Autohaus Reisacher (Memmingen) (BMW, MINI)Autohaus Reisacher (Ulm) (BMW, MINI)Autohaus Reisacher (Vöhringen) (BMW)J-S Auto Park Stolberg (Volkswagen)TCD (Toyota)Volkswagen Zentrum AachenWolff & Meir (Volkswagen)
MEXICOToyota de AguascalientesToyota de LindavistaToyota de Monterrey

Executive Officers
Roger S. PenskeChairman of the Board and CEO
Robert H. Kurnick, Jr.Vice Chairman
Roger S. Penske, Jr.President
Paul F. Walters Executive Vice President – Human Resources
Robert O’ShaughnessyChief Financial OfficerExecutive Vice President – Finance
Operations
George BrochickExecutive Vice President – West Operations
Gerard NieuwenhuysManaging Director –Sytner Group
R. Whitfield RamonatExecutive Vice President – Central Operations andFinancial Services
Investor Relations
Anthony R. PordonSenior Vice President
Corporate Secretary
Shane M. SpradlinVice President
Board of Directors
Roger S. Penske Chairman of the Board and CEOUnitedAuto Group
Robert H. Kurnick, Jr.Vice ChairmanUnitedAuto Group
John D. BarrCEOPapa Murphy’s International, Inc.
Michael R. EisensonManaging Director & CEOCharlesbank Capital Partners, LLC
Hiroshi IshikawaExecutive Vice PresidentInternational BusinessUnitedAuto Group
William J. LovejoyRetired Group Vice PresidentN. A. vehicle sales, service & marketingGeneral Motors Corporation
Kimberly J. McWatersCEOUniversal Technical Institute, Inc.
Eustace W. MitaChairmanAchristavest Properties, LLC
Lucio A. NotoRetired Vice ChairmanExxonMobil Corporation
Richard J. PetersManaging DirectorTransportation Resource Partners, LP
Ronald G. SteinhartRetired Chairman & CEOCommercial Banking GroupBank One Corporation
H. Brian ThompsonChairmanComsat International
Executive Offices
United Auto Group, Inc.2555 Telegraph RoadBloomfield Hills, MI 48302-0954248 648-2500
Investor Relations and Corporate CommunicationsAnthony R. PordonSenior Vice President 2555 Telegraph RoadBloomfield Hills, MI 48302 248 648-2540
Stock Exchange ListingUnitedAuto Group common stock istraded on the New York Stock Exchangeunder the ticker symbol UAG
Transfer AgentComputershare Investor ServicesP.O. Box 43069Providence, RI 02940-3069
Independent AuditorsDeloitte & Touche LLP600 Renaissance CenterSuite 900Detroit, MI 48243
Form 10-KThe Company’s Form 10-K is on file with the Securities and Exchange Commission.You may download an electronic copy byaccessing the Company’s Investor Relationssection at www.unitedauto.com.
©2007 United Auto Group, Inc.
UnitedAuto GroupLeadership

UNITED STATES SECURITIES AND EXCHANGE COMMISSIONWashington, D.C. 20549
Form 10-K¥ ANNUAL REPORT PURSUANT TO SECTION 13 OR 15(d)
OF THE SECURITIES EXCHANGE ACT OF 1934
For the fiscal year ended December 31, 2006
n TRANSITION REPORT PURSUANT TO SECTION 13 OR 15(d)OF THE SECURITIES EXCHANGE ACT OF 1934
For the transition period from to
Commission file number 1-12297
United Auto Group, Inc.(Exact name of registrant as specified in its charter)
Delaware(State or other jurisdiction of incorporation or organization)
22-3086739(I.R.S. Employer
Identification No.)
2555 Telegraph RoadBloomfield Hills, Michigan
(Address of principal executive offices)
48302-0954(Zip Code)
Registrant’s telephone number, including area code (248) 648-2500
Securities registered pursuant to Section 12(b) of the Act:
Title of Each Class Name of Each Exchange on Which Registered
Voting Common Stock, par value $0.0001 per share New York Stock Exchange
Securities registered pursuant to Section 12(g) of the Act: None.
Indicate by check mark if the registrant is a well-known seasoned issuer, as defined in Rule 405 of the SecuritiesAct. Yes ¥ No n
Indicate by check mark if the registrant is not required to file reports pursuant to Section 13 or Section 15(d) of theExchange Act. Yes n No ¥
Indicate by check mark whether the registrant (1) has filed all reports required to be filed by Section 13 or 15(d) of theSecurities Exchange Act of 1934 during the preceding 12 months (or for such shorter period that the registrant was required tofile such reports), and (2) has been subject to such filing requirements for the past 90 days. Yes ¥ No n
Indicate by check mark if disclosure of delinquent filers pursuant to Item 405 of Regulation S-K is not contained herein, andwill not be contained, to the best of the registrant’s knowledge, in definitive proxy or information statements incorporated byreference in Part III of this Form 10-K or any amendment to this Form 10-K. ¥
Indicate by check mark whether the registrant is a large accelerated filer, an accelerated filer or a non-accelerated filer.(Check one):
Large accelerated filer ¥ Accelerated filer n Non-accelerated filer n
Indicate by check mark whether the registrant is a shell company (as defined in Rule 12b-2 of the ExchangeAct). Yes n No ¥
The aggregate market value of the voting common stock held by non-affiliates as of June 30, 2006 was $862,144,726.
As of February 19, 2007, there were 94,471,686 shares of voting common stock outstanding.
Documents Incorporated by Reference
Certain portions, as expressly described in this report, of the registrant’s proxy statement for the 2007 Annual Meeting ofthe Stockholders to be held May 3, 2007 are incorporated by reference into Part III, Items 10-14.

TABLE OF CONTENTS
Items Page
PART I1. Business . . . . . . . . . . . . . . . . . . . . . . . . . . . . . . . . . . . . . . . . . . . . . . . . . . . . . . . . . . . . . . . . . . 1
1A. Risk Factors . . . . . . . . . . . . . . . . . . . . . . . . . . . . . . . . . . . . . . . . . . . . . . . . . . . . . . . . . . . . . . . 16
1B. Unresolved Staff Comments . . . . . . . . . . . . . . . . . . . . . . . . . . . . . . . . . . . . . . . . . . . . . . . . . . . . 25
2. Properties . . . . . . . . . . . . . . . . . . . . . . . . . . . . . . . . . . . . . . . . . . . . . . . . . . . . . . . . . . . . . . . . . 25
3. Legal Proceedings . . . . . . . . . . . . . . . . . . . . . . . . . . . . . . . . . . . . . . . . . . . . . . . . . . . . . . . . . . . 25
4. Submission of Matters to a Vote of Security Holders . . . . . . . . . . . . . . . . . . . . . . . . . . . . . . . . . . 25
PART II5. Market for Registrant’s Common Equity, Related Stockholder Matters and Issuer Purchases of
Equity Securities . . . . . . . . . . . . . . . . . . . . . . . . . . . . . . . . . . . . . . . . . . . . . . . . . . . . . . . . . . . . 25
6. Selected Financial Data . . . . . . . . . . . . . . . . . . . . . . . . . . . . . . . . . . . . . . . . . . . . . . . . . . . . . . . 26
7. Management’s Discussion and Analysis of Financial Condition and Results of Operations . . . . . . 28
7A. Quantitative and Qualitative Disclosures About Market Risk . . . . . . . . . . . . . . . . . . . . . . . . . . . . 47
8. Financial Statements and Supplementary Data . . . . . . . . . . . . . . . . . . . . . . . . . . . . . . . . . . . . . . 48
9. Changes in and Disagreements with Accountants on Accounting and Financial Disclosure . . . . . . 48
9A. Controls and Procedures . . . . . . . . . . . . . . . . . . . . . . . . . . . . . . . . . . . . . . . . . . . . . . . . . . . . . . . 48
9B. Other Information . . . . . . . . . . . . . . . . . . . . . . . . . . . . . . . . . . . . . . . . . . . . . . . . . . . . . . . . . . . 49
PART III10. Directors and Executive Officers and Corporate Governance . . . . . . . . . . . . . . . . . . . . . . . . . . . .
11. Executive Compensation . . . . . . . . . . . . . . . . . . . . . . . . . . . . . . . . . . . . . . . . . . . . . . . . . . . . . .
12. Security Ownership of Certain Beneficial Owners and Management and Related StockholderMatters . . . . . . . . . . . . . . . . . . . . . . . . . . . . . . . . . . . . . . . . . . . . . . . . . . . . . . . . . . . . . . . . . . .
13. Certain Relationships and Related Transactions, and Director Independence . . . . . . . . . . . . . . . . .
14. Principal Accountant Fees and Services . . . . . . . . . . . . . . . . . . . . . . . . . . . . . . . . . . . . . . . . . . .
PART IV15. Exhibits and Financial Statement Schedules . . . . . . . . . . . . . . . . . . . . . . . . . . . . . . . . . . . . . . . . 50
i

PART I
Item 1. Business
We are the second largest automotive retailer in the United States as measured by total revenues and have thehighest concentration of revenues from foreign and premium brands among the publicly-traded automotiveretailers. As of February 1, 2007, we owned and operated 169 franchises in the United States and 145 franchisesoutside of the U.S., primarily in the United Kingdom. We offer a full range of vehicle brands, with 93% of our totalrevenue in 2006 generated from the sales of foreign brands such as Audi, BMW, Honda, Lexus, Mercedes andToyota. Sales relating to premium brands, such as Audi, BMW, Cadillac and Porsche, represented 62% of our totalrevenue. In addition to selling new and used vehicles, we offer a full range of maintenance and repair services, andwe facilitate the placement of third-party finance and insurance products, third-party extended service contracts andreplacement and aftermarket automotive products.
We benefit from our diversified revenue stream, which we believe helps to mitigate the historical cyclicalityfound in some other automotive sectors. Revenues from higher margin service and parts sales are typically lesscyclical than retail vehicle sales, and generate the largest part of our gross profit. The following graphic shows thepercentage of our retail revenues by product area and their respective contribution to our overall gross profit in2006:
Revenue Mix Gross Profit Mix
F&I 2%
Used 25%
New 61%
S&P 12%
Used 13%
F&I 15%
S&P 40%
New 32%
Business Strategy
Our strategy is to sell and service outstanding vehicle brands in premium facilities. We believe offering ourcustomers superior customer service in a premium location fosters a long-term relationship, which helps generaterepeat and referral business, particularly in our higher-margin service and parts business. We believe our focus ondeveloping a loyal customer base has helped to increase our profitability and generate additional service and partssales. In addition, our large number of dealerships, geographically concentrated by region, allows us the opportunityto achieve cost savings and implement best practices, while also providing access to a broad base of potentialacquisitions.
Offer Outstanding Brands in Premium Facilities
We have the highest concentration of revenues from foreign and premium brands among the publicly-tradedautomotive retailers. We believe our brand mix has helped us to increase same-store revenue and gross profits, asforeign vehicle brands have gained market share in recent years in the markets where we operate.
1
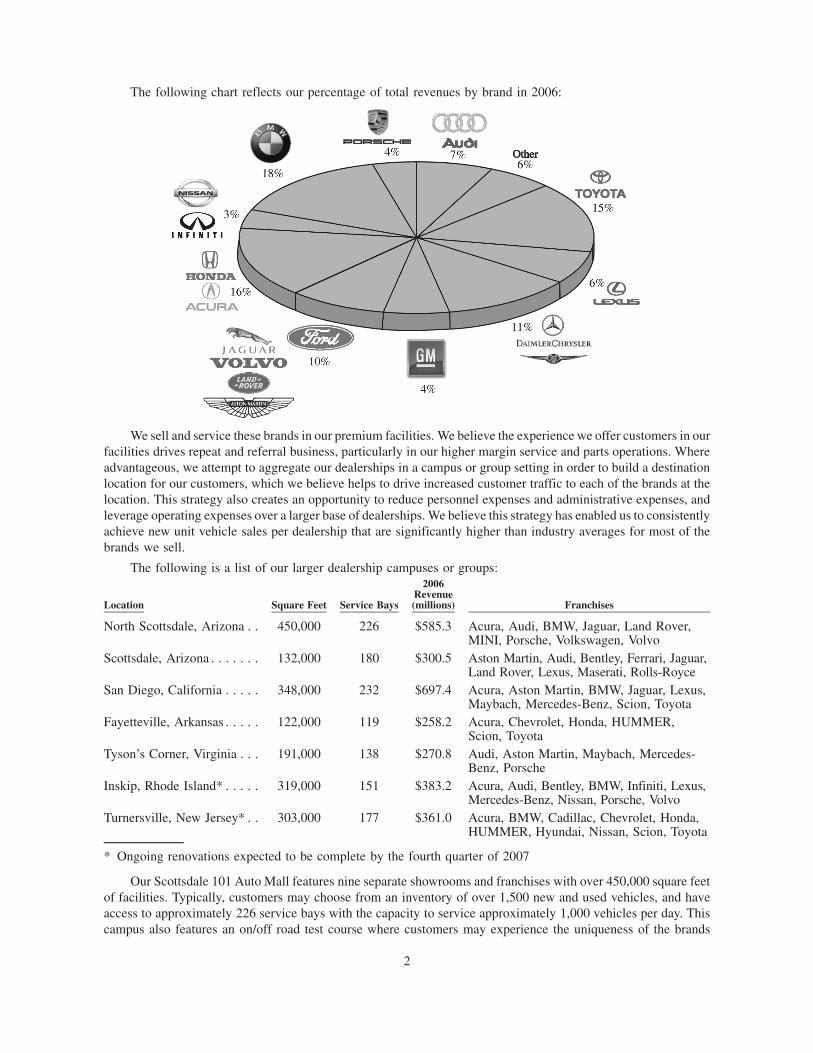
The following chart reflects our percentage of total revenues by brand in 2006:
We sell and service these brands in our premium facilities. We believe the experience we offer customers in ourfacilities drives repeat and referral business, particularly in our higher margin service and parts operations. Whereadvantageous, we attempt to aggregate our dealerships in a campus or group setting in order to build a destinationlocation for our customers, which we believe helps to drive increased customer traffic to each of the brands at thelocation. This strategy also creates an opportunity to reduce personnel expenses and administrative expenses, andleverage operating expenses over a larger base of dealerships. We believe this strategy has enabled us to consistentlyachieve new unit vehicle sales per dealership that are significantly higher than industry averages for most of thebrands we sell.
The following is a list of our larger dealership campuses or groups:
Location Square Feet Service Bays
2006Revenue(millions) Franchises
North Scottsdale, Arizona . . 450,000 226 $585.3 Acura, Audi, BMW, Jaguar, Land Rover,MINI, Porsche, Volkswagen, Volvo
Scottsdale, Arizona . . . . . . . 132,000 180 $300.5 Aston Martin, Audi, Bentley, Ferrari, Jaguar,Land Rover, Lexus, Maserati, Rolls-Royce
San Diego, California . . . . . 348,000 232 $697.4 Acura, Aston Martin, BMW, Jaguar, Lexus,Maybach, Mercedes-Benz, Scion, Toyota
Fayetteville, Arkansas . . . . . 122,000 119 $258.2 Acura, Chevrolet, Honda, HUMMER,Scion, Toyota
Tyson’s Corner, Virginia . . . 191,000 138 $270.8 Audi, Aston Martin, Maybach, Mercedes-Benz, Porsche
Inskip, Rhode Island* . . . . . 319,000 151 $383.2 Acura, Audi, Bentley, BMW, Infiniti, Lexus,Mercedes-Benz, Nissan, Porsche, Volvo
Turnersville, New Jersey* . . 303,000 177 $361.0 Acura, BMW, Cadillac, Chevrolet, Honda,HUMMER, Hyundai, Nissan, Scion, Toyota
* Ongoing renovations expected to be complete by the fourth quarter of 2007
Our Scottsdale 101 Auto Mall features nine separate showrooms and franchises with over 450,000 square feetof facilities. Typically, customers may choose from an inventory of over 1,500 new and used vehicles, and haveaccess to approximately 226 service bays with the capacity to service approximately 1,000 vehicles per day. Thiscampus also features an on/off road test course where customers may experience the uniqueness of the brands
2

offered. We will continue to evaluate other opportunities to aggregate our facilities to reap the benefits of adestination location.
Expand Revenues at Existing Locations and Increase Higher-Margin Businesses
We aim to increase our existing business by generating additional revenue at existing dealerships, with aparticular focus on developing our higher-margin businesses such as finance, insurance and other products andservice, parts and collision repair services.
Increase Same-Store Sales. We believe our emphasis on improving customer service and upgrading ourfacilities should result in continued increases in same-store sales. We have modernized many of our facilities andadded numerous additional service bays in order to better accommodate our customers.
Grow Finance, Insurance and Other Aftermarket Revenues. Each sale of a vehicle provides us the oppor-tunity to assist in financing the sale, selling the customer a third party extended service contract or insuranceproduct, or selling other aftermarket products, such as entertainment systems, security systems, satellite radio andprotective coatings. In order to improve our finance and insurance business, we focus on enhancing andstandardizing our salesperson training programs, increasing our product offerings and standardizing our sellingprocess.
Expand Service and Parts and Collision Repair Revenues. In recent years, we have added numerous servicebays at our dealerships in an effort to expand this higher-margin element of our business. Many of today’s vehiclesare complex and require sophisticated equipment and specially trained technicians to perform certain services.Unlike independent service shops, our dealerships are authorized to perform this work and manufacturer warrantywork. We believe that our premium brand-mix and the complexity of today’s vehicles, together with our focus oncustomer service and superior facilities, contribute to our service and parts revenue increases. We also operate 26collision repair centers. As each of these is operated as an integral part of our dealership operations, the repaircenters benefit from the dealerships’ repeat and referral business.
Continue Growth through Targeted Acquisitions
We believe that attractive acquisition opportunities exist in the United States for well-capitalized dealershipgroups with experience in identifying, acquiring and integrating dealerships. The U.S. automotive retail marketprovides us with significant growth opportunities as the top ten industry participants represented less than 10% ofnew vehicle industry sales in 2006. We seek to acquire dealerships with high growth automotive brands in highlyconcentrated or rapidly growing demographic areas. We focus both on larger dealership operations that will benefitfrom our management assistance, manufacturer relations and scale of operations, as well as individual dealershipsthat can be effectively integrated into our existing operations.
One of the unique attributes of our operations versus our peers is our diversification outside the United States.Approximately 32% of our consolidated revenue for 2006 was generated from operations located outside the UnitedStates and Puerto Rico, predominately in the United Kingdom. In 2006, we acquired and integrated 40 additionalfranchises in the United Kingdom. According to industry data, in 2005 the United Kingdom represented the secondlargest automotive market in Western Europe with approximately 2.5 million new car registrations and revenuesexceeding $250 billion in aggregate annual new vehicle, used vehicle and service and parts sales. Althoughdealerships in the United Kingdom are typically smaller than those in the United States, they offer similar servicesto customers. Our brand mix in the United Kingdom is largely premium. As of December 31, 2006, we believe wewere the largest volume Audi, BMW, Lexus, Mercedes Benz and Toyota dealer in this market. Additionally, weoperate a number of dealerships in Germany, some in the form of joint ventures with strong local partners, whichsell and service Aston Martin, Audi, BMW, Ferrari, Lexus, MINI, Toyota, Volkswagen and other premium brands.We believe attractive acquisition opportunities exist in the United Kingdom and Germany, similar to those availablein the United States.
3

Strengthen Customer Loyalty
Our ability to generate and maintain repeat and referral business depends on our ability to deliver superiorcustomer service. We believe that customer loyalty contributes directly to increases in same-store sales. By offeringoutstanding brands in premium facilities, “one-stop” shopping convenience, competitive pricing and a well-trainedand knowledgeable sales staff, we aim to establish lasting relationships with our customers, which enhances ourreputation in the community and creates the opportunity for significant repeat and referral business. We believe ourlow and steadily decreasing employee turnover has been critical to furthering our customer relationships.Additionally, we monitor customer satisfaction data accumulated by manufacturers to track the performance ofdealership operations and use it as a factor in determining the compensation of general managers and sales andservice personnel in our dealerships.
Maintain Diversified Revenue Stream and Variable Cost Structure
We believe that our diversified revenue mix may mitigate the historical cyclicality found in some automotivesectors, and that demand for our higher-margin service and parts business is less affected by economic cycles thandemand for new vehicles as consumers are likely to service their vehicles in spite of difficult economic times. Ourdealership operations are also diversified both in terms of the brands of vehicles they offer and geographic location,as we operate 169 dealerships in nineteen states in the U.S. and 145 dealerships outside the U.S., predominately inthe United Kingdom, which generated approximately 31% of our revenue in 2006. In addition, a significantpercentage of our operating expenses are variable, including sales compensation, floor plan interest expense(inventory-secured financing) and advertising, which we believe we can adjust over time to reflect economic trends.
Leverage Scale and Implement “Best Practices”
As the nation’s second largest automotive retailer, we aim to build scale in many of the markets where we havedealership operations. Our desire is to reduce or eliminate redundant operating costs such as accounting,information technology systems and general administrative costs. In addition, we seek to leverage our industryknowledge and experience to foster communication and cooperation between like brand dealerships throughout ourorganization. Senior management and dealership management meet regularly to review the operating performanceof our dealerships, examine industry trends and, where appropriate, implement specific operating improvements.Key financial information is discussed and compared to other dealerships across all markets. This frequentinteraction facilitates implementation of successful strategies throughout the organization so that each of ourdealerships can benefit from the successes of our other dealerships and the knowledge and experience of our seniormanagement.
smart Distributorship
In 2006, we were named by smart GmbH, an affiliate of Mercedes Benz, as the exclusive distributor of thesmart for two vehicles in United States and Puerto Rico. Smart GmbH has sold over 770,000 for two vehiclesoutside the United States. We expect the first vehicles to be available for U.S. distribution in the first quarter of 2008.As distributor, we are responsible for qualifying and awarding potential dealers and developing and maintaining asmart vehicle dealership network throughout the United States and Puerto Rico.
Industry Overview
With revenues of approximately $1 trillion per year, the automotive retail industry is the largest retail tradesector in the United States. The majority of automotive retail sales in 2005 were generated by the approximately21,500 U.S. franchised dealerships, producing revenues of approximately $700 billion. The industry is highlyfragmented and largely privately held, with the publicly held automotive retail groups accounting for less than 10%of the total industry revenue.
Of the close to $700 billion in U.S. franchised dealer aggregate annual sales in 2005, new vehicle salesrepresent approximately 60% and used vehicle sales represent approximately 28%. In addition to new and usedvehicles, dealerships offer a wide range of higher-margin products and services, including service and repair work,
4

replacement parts, extended service contracts, and financing and credit insurance, which collectively represent theremaining 12% of total industry revenues.
According to industry data, the number of U.S. franchised dealerships has declined from approximately 24,000in 1990 to approximately 21,500 today. Although significant consolidation has already taken place, the industrytoday remains highly fragmented, with more than 90% of the U.S. industry’s market share remaining in the hands ofsmaller regional and independent players. We believe that further consolidation in the industry is likely due toincreased capital requirements of dealerships, the limited number of viable alternative exit strategies for dealershipowners, and the desire of certain manufacturers to strengthen their brand identity by consolidating their franchiseddealerships. According to industry data, in 2005 the United Kingdom represented the second largest automotivemarket in Western Europe with approximately 2.5 million new car registrations and revenues exceeding $250 billionin aggregate annual new vehicle, used vehicle and service and parts sales.
New vehicle unit sales are cyclical and, historically, fluctuations have been influenced by factors such asmanufacturer incentives, interest rates, fuel prices, unemployment, inflation, weather, the level of personaldiscretionary spending, credit availability and consumer confidence. However, from a profitability perspective,automotive retailers have historically been less vulnerable than automobile manufacturers to declines in newvehicle sales. We believe this may be due to the retailers’ more flexible expense structure (a significant portion ofthe automotive retail industry’s costs are variable, relating to sales personnel, advertising and inventory financecost) and more diversified revenue stream. In addition, automobile manufacturers may increase dealer incentiveswhen sales are slow, in part to meet production quotas, which further increases the volatility in profitability forautomobile manufacturers and may help to decrease volatility for automotive retailers.
Acquisitions
We have completed a number of dealership acquisitions since January 2004. Our financial statements includethe results of operations of acquired dealerships from the date of acquisition. The following table sets forthinformation with respect to our current dealerships acquired or opened since January 2004:
DealershipDate Openedor Acquired Location Franchises
U.S.Penske Cadillac South Bay . . . . . . . . . . . 1/04 Torrance, CA CadillacPenske HUMMER South Bay . . . . . . . . . 4/04 Torrance, CA HUMMERFerrari Maserati of Central New Jersey . . 7/04 Edison, NJ Ferrari, MaseratiMercedes-Benz of Chandler . . . . . . . . . . . 7/04 Chandler, AZ Mercedes-BenzCapitol Honda. . . . . . . . . . . . . . . . . . . . . 8/04 San Jose, CA HondaHonda North . . . . . . . . . . . . . . . . . . . . . . 8/04 Clovis, CA HondaMarin Honda . . . . . . . . . . . . . . . . . . . . . 8/04 Corte Madera, CA HondaLos Gatos Acura . . . . . . . . . . . . . . . . . . . 8/04 Los Gatos, CA AcuraMaserati of Cleveland . . . . . . . . . . . . . . . 8/04 Bedford, OH MaseratiHonda Mall of Georgia . . . . . . . . . . . . . . 1/05 Buford, GA HondaJaguar of Tulsa . . . . . . . . . . . . . . . . . . . . 1/05 Tulsa, OK JaguarUnited Ford North. . . . . . . . . . . . . . . . . . 1/05 Tulsa, OK FordUnited Ford South. . . . . . . . . . . . . . . . . . 1/05 Tulsa, OK FordHUMMER of Turnersville . . . . . . . . . . . . 5/05 Turnersville, NJ HUMMERInskip Nissan . . . . . . . . . . . . . . . . . . . . . 7/05 Warwick, RI NissanStevens Creek Porsche Audi . . . . . . . . . . 10/05 San Jose, CA Audi PorscheAcura of Escondido. . . . . . . . . . . . . . . . . 1/06 Escondido, CA AcuraAston Martin San Diego . . . . . . . . . . . . . 1/06 San Diego, CA Aston MartinAudi of Escondido . . . . . . . . . . . . . . . . . 1/06 Escondido, CA AudiHonda Mission Valley . . . . . . . . . . . . . . . 1/06 San Diego, CA HondaHonda of Escondido . . . . . . . . . . . . . . . . 1/06 Escondido, CA Honda
5

DealershipDate Openedor Acquired Location Franchises
Jaguar Kearny Mesa . . . . . . . . . . . . . . . . 1/06 San Diego, CA JaguarKearny Mesa Acura . . . . . . . . . . . . . . . . 1/06 San Diego, CA AcuraMazda of Escondido . . . . . . . . . . . . . . . . 1/06 Escondido, CA MazdaUnited HUMMER of Tulsa . . . . . . . . . . . 1/06 Tulsa, OK HUMMERMotorwerks BMW/MINI . . . . . . . . . . . . . 5/06 Minneapolis, MN BMW/MINIWest Palm Subaru . . . . . . . . . . . . . . . . . . 7/06 West Palm Beach, FL SubaruTriangle Nissan del Oeste . . . . . . . . . . . . 7/06 Puerto Rico NissanCadillac of Turnersville . . . . . . . . . . . . . . 11/06 Turnersville, NJ Cadillac
Outside the U.S.Kings Cheltenham & Gloucester . . . . . . . 5/04 Gloucester, England Chrysler JeepBentley Edinburgh . . . . . . . . . . . . . . . . . 7/04 Lothian, Scotland BentleyGraypaul Edinburgh . . . . . . . . . . . . . . . . 7/04 Lothian, Scotland Ferrari, MaseratiGuildford Audi . . . . . . . . . . . . . . . . . . . . 7/04 Surrey, England AudiPorsche Centre Edinburgh . . . . . . . . . . . . 7/04 Lothian, Scotland PorschePorsche Centre Glasgow . . . . . . . . . . . . . 7/04 Strathclyde, Scotland PorscheReading Audi . . . . . . . . . . . . . . . . . . . . . 7/04 Berkshire, England AudiSlough Audi . . . . . . . . . . . . . . . . . . . . . . 7/04 Berkshire, England AudiTamsen GmbH (Bremen) . . . . . . . . . . . . . 7/04 Bremen/Hamburg, Germany Aston Martin, Bentley,
Ferrari, Lamborghini,Maserati, Rolls Royce
West London Audi . . . . . . . . . . . . . . . . . 7/04 Middlesex, England AudiHarrogate Audi . . . . . . . . . . . . . . . . . . . . 10/04 Harrogate, England AudiToyota World Tamworth . . . . . . . . . . . . . 10/04 Staffordshire, England ToyotaKings Swindon . . . . . . . . . . . . . . . . . . . . 4/05 Swindon, England Chrysler, Jeep, DodgeLexus of Milton Keynes . . . . . . . . . . . . . 11/05 Milton Keynes, England LexusBMW/ Mini Sunningdale . . . . . . . . . . . . 1/06 Berkshire, England BMW, MINIGuy Salmon Jaguar Ascot . . . . . . . . . . . . 1/06 Berks, England JaguarGuy Salmon Jaguar Gatwick . . . . . . . . . . 1/06 West Sussex, England JaguarGuy Salmon Jaguar Medway . . . . . . . . . . 1/06 Kent, England JaguarGuy Salmon Land Rover Ascot . . . . . . . . 1/06 Berks, England Land RoverGuy Salmon Land Rover Gatwick . . . . . . 1/06 West Sussex, England Land RoverGuy Salmon Land Rover Medway . . . . . . 1/06 Kent, England Land RoverGuy Salmon Land Rover Wessex . . . . . . . 1/06 Portsmouth, England Land RoverHonda Redhill. . . . . . . . . . . . . . . . . . . . . 1/06 Surrey, England HondaKings Bristol Chrysler Jeep Dodge . . . . . 1/06 Bristol, England Chrysler, Jeep, DodgeRolls Royce Sunningdale. . . . . . . . . . . . . 1/06 Berkshire, England Rolls RoyceSytner Coventry . . . . . . . . . . . . . . . . . . . 1/06 West Midlands, England BMW, MINILamborghini Birmingham . . . . . . . . . . . . 6/06 Birmingham, England LamborghiniLamborghini Edinburgh. . . . . . . . . . . . . . 6/06 Edinburgh, Scotland LamborghiniAutohaus Augsburg . . . . . . . . . . . . . . . . . 8/06 Augsburg, Germany BMW(4), MINIKings Chrysler Jeep Dodge Newcastle . . . 8/06 Cleveland, England Chrysler, Jeep, DodgeKings Chrysler Jeep Dodge Stockton . . . . 8/06 Stockton-on-Tees, England Chrysler, Jeep, DodgeMercedes-Benz of Carlisle. . . . . . . . . . . . 8/06 Cumbria, England Mercedes-BenzMercedes-Benz of Newcastle . . . . . . . . . . 8/06 Cleveland, England Mercedes-BenzMercedes-Benz of Stockton . . . . . . . . . . . 8/06 Stockton-on-Tees, England Mercedes-BenzMercedes-Benz of Sunderland . . . . . . . . . 8/06 Sunderland, England Mercedes-BenzRydale BMW/MINI Cardiff . . . . . . . . . . . 8/06 South Glamorgan, Wales BMW/MINI
6

DealershipDate Openedor Acquired Location Franchises
Rydale BMW/MINI Central . . . . . . . . . . 8/06 West Midlands, England BMW/MINIRydale BMW/MINI Newport . . . . . . . . . 8/06 Newport, South Wales BMW/MINIRydale BMW/MINI Sutton . . . . . . . . . . . 8/06 West Midlands, England BMW/MINIRydale BMW/MINI Warley . . . . . . . . . . . 8/06 West Midlands, England BMW/MINI
In 2005 and 2006, we disposed of 22 and 23 dealerships, respectively, that we believe were not integral to ourstrategy or operations. We expect to continue to pursue acquisitions, selected dispositions and related transactions inthe future.
Dealership Operations
Franchises. The following charts reflect our franchises by location and our dealership mix by franchise as ofFebruary 1, 2007:
Location Franchises Franchises U.S. Non-U.S. Total
Arizona . . . . . . . . . . . . . . . . . . . . . . 20 Daimler Chrysler . . . . . . . . . 22 39 61
Arkansas. . . . . . . . . . . . . . . . . . . . . . 14 Toyota/Lexus . . . . . . . . . . . . 34 13 47
California . . . . . . . . . . . . . . . . . . . . . 26 Ford/PAG . . . . . . . . . . . . . . 21 24 45
Connecticut . . . . . . . . . . . . . . . . . . . 4 BMW/MINI. . . . . . . . . . . . . 10 35 45
Florida . . . . . . . . . . . . . . . . . . . . . . . 10 General Motors . . . . . . . . . . 18 — 18
Georgia . . . . . . . . . . . . . . . . . . . . . . 4 Honda/Acura . . . . . . . . . . . . 26 1 27
Indiana . . . . . . . . . . . . . . . . . . . . . . . 2 Nissan/Infiniti . . . . . . . . . . . 9 — 9
Michigan . . . . . . . . . . . . . . . . . . . . . 8 Audi . . . . . . . . . . . . . . . . . . 7 8 15
Minnesota . . . . . . . . . . . . . . . . . . . . . 2 Porsche . . . . . . . . . . . . . . . . 5 4 9Mississippi . . . . . . . . . . . . . . . . . . . . 2 Others . . . . . . . . . . . . . . . . . 17 21 38
Nevada . . . . . . . . . . . . . . . . . . . . . . . 2 Total . . . . . . . . . . . . . . . . 169 145 314
New Jersey . . . . . . . . . . . . . . . . . . . . 19
New York . . . . . . . . . . . . . . . . . . . . . 4
Ohio . . . . . . . . . . . . . . . . . . . . . . . . . 7Oklahoma . . . . . . . . . . . . . . . . . . . . . 9
Puerto Rico. . . . . . . . . . . . . . . . . . . . 15
Rhode Island. . . . . . . . . . . . . . . . . . . 10
Tennessee . . . . . . . . . . . . . . . . . . . . . 3
Texas . . . . . . . . . . . . . . . . . . . . . . . . 3
Virginia . . . . . . . . . . . . . . . . . . . . . . 5
Total Domestic . . . . . . . . . . . . . . . 169
United Kingdom . . . . . . . . . . . . . . . . 130
Germany . . . . . . . . . . . . . . . . . . . . . . 15
Total Foreign. . . . . . . . . . . . . . . . . 145
Total Worldwide . . . . . . . . . . . . . . 314
Management. Each dealership or group of dealerships has independent operational and financial manage-ment responsible for day-to-day operations. We believe experienced local managers are better qualified to makeday-to-day decisions concerning the successful operation of a dealership and can be more responsive to ourcustomers’ needs. We seek local dealership management that not only has experience in the automotive industry,but also is familiar with the local dealership’s market. We also have regional management that oversees operationsat the individual dealerships and supports the dealerships operationally and administratively.
7

New Vehicle Retail Sales. In 2006, we sold 183,370 new vehicles which generated 60.8% of our retailrevenue and 32.3% of our retail gross profit. We sell over forty brands of domestic and import family, sports andpremium cars, light trucks and sport utility vehicles through 314 franchises in nineteen U.S. states, Puerto Rico, theU.K. and Germany. As of February 1, 2007, we sold the following brands: Acura, Alpina, Aston Martin, Audi,BMW, Buick, Cadillac, Chevrolet, Chrysler, Dodge, Ferrari, Ford, GMC Truck, Honda, HUMMER, Hyundai,Infiniti, Jaguar, Jeep, Lamborghini, Land Rover, Lexus, Lincoln-Mercury, Lotus, Maybach, Mazda, Maserati,Mercedes Benz, MINI, Nissan, Pontiac, Porsche, Rolls Royce, Bentley, SAAB, Scion, smart, Subaru, Suzuki,Toyota, Volvo and Volkswagen.
Our customers finance their purchases of new and used vehicles through both traditional financing sources andconsumer automobile leasing companies. Lease transactions are typically provided to consumers by short termfinancing sources. We believe leases also provide the opportunity to obtain repeat business from customers on amore regular basis than traditional purchase transactions because leases are typically of a short duration.
Our new vehicles are typically acquired by our dealerships directly from the manufacturer. We strive tomaintain good relations with the automotive manufacturers, which we believe is supported by our long-termpresence in the automotive retail market, the reputation of our management team and our consistent high salesvolume from our dealerships. Our dealerships finance the purchase of new vehicles from the manufacturers throughfloor plan financing provided by various manufacturers’ captive finance companies.
Used Vehicle Retail Sales. In 2006, we sold 88,723 used vehicles, which generated 24.7% of our retailrevenue and 12.7% of our retail gross profit. We generally acquire used vehicles from various sources including,auctions open only to authorized new vehicle dealers, public auctions, trade-ins in connection with new purchasesand lease expirations or terminations. Leased vehicles returned at the end of the lease provide us with low mileage,late model vehicles for our used vehicle sales operations. We clean, repair and recondition, as necessary, all usedvehicles we acquire for resale generally at our own service facilities.
We believe growth opportunities relating to used vehicle sales exist in part because of the availability of high-quality, low-mileage, late model used vehicles, along with the proliferation of manufacturer certification processesfor these vehicles. To improve customer confidence in our used vehicle inventory, each of our dealershipsparticipates in all available manufacturer certification processes for used vehicles. If certification is obtained,the used vehicle owner is typically provided benefits and warranties similar to those offered to new vehicle ownersby the applicable manufacturer. Since warranty work can only be performed at franchised dealerships, we believewe may benefit from the opportunity to retain these customers as service and parts customers. In addition, we offerfor sale third-party extended service contracts on all of our used vehicles.
Some vehicles acquired through trade-ins or originally intended for sale in our used vehicle operations areinstead sold via auction. Through our scale in many markets, we have implemented closed-bid auctions that allowus to bring a large number of vehicles from different franchises to a central market for other dealers or wholesalersto purchase. We believe this strategy has resulted in greater operating efficiency and helped to reduce costsassociated with maintaining optimal inventories.
Vehicle Finance, Extended Service and Insurance Sales. Finance and insurance sales represented 2.4% ofour retail revenue and 14.7% of our retail gross profit in 2006. At our customers’ option, our dealerships can arrangethird-party financing for our customers’ vehicle purchases. As compensation we receive a portion of the cost offinancing paid by the customer for each financed sale. While these services are generally non-recourse to us, we aresubject to chargebacks in certain circumstances such as default under a financing arrangement or other circum-stances. We provide training to our finance and insurance personnel to help assure compliance with internal policiesand procedures, as well as applicable state regulations. We also impose limits on the amount of revenue pertransaction we may receive from certain finance products as part of our compliance efforts. We also offer for saleother aftermarket products, such as Sirius Satellite Radio, cellular phones, security systems and protective coatings.
We offer our customers various vehicle warranty and extended protection products, including extendedwarranties, maintenance programs, guaranteed auto protection (known as “GAP,” this protection covers theshortfall between a customer’s loan balance and insurance payoff in the event of a casualty), lease “wear andtear” insurance and theft protection products at competitive prices. The vehicle warranty and extended protection
8

products that our dealerships currently offer to customers are underwritten by independent third parties, includingthe vehicle manufacturers’ captive finance subsidiaries. We also are subject to chargebacks in connection with thesale of certain of these products.
Service and Parts Sales. Service and parts sales represented 12.1% of our retail revenue and 40.3% of ourretail gross profit in 2006. We generate service and parts sales for warranty and non-warranty work at each of ourdealerships, primarily relating to the vehicle models sold at that dealership. Our service and parts revenues haveincreased each year, we believe in large part due to our increased service capacity, coupled with the increasinglycomplex technology used in vehicles, which makes it difficult for independent repair facilities to maintain andrepair today’s automobiles. As part of our agreements with our manufacturers, we obtain all the necessaryequipment required by the manufacturer to service and maintain each make of vehicle sold at each of ourdealerships.
A goal of each of our dealerships is to make each vehicle purchaser a customer of our service and partsdepartment. Our dealerships keep detailed records of our customers’ maintenance and service histories, and manydealerships send reminders to customers when vehicles are due for periodic maintenance or service. Many of ourdealerships have extended evening and weekend service hours for the convenience for our customers. We alsooperate 26 collision repair centers, each of which is operated as an integral part of our dealership operations.
Internet Presence. According to industry analysts, the majority of car buyers nationwide will consult theInternet for new and pre-owned automotive information. In order to attract customers and enhance our customerservice, each of our dealerships maintains its own website. Our corporate website, www.unitedauto.com, provides alink to each of our dealership websites allowing consumers to source information and communicate directly withour dealerships locally.
In the U.S., all of our dealership websites are presented in common formats (except where otherwise requiredby manufacturers) which helps to minimize costs and provide a consistent image across dealerships. In addition,many automotive manufacturers’ websites provide links to our dealership websites.
The Internet is generating better-informed consumers and improving the efficiency of the sales process. Usingour dealership websites, consumers can review our inventory for vehicles that meet their model and featurerequirements and price range. Our websites provide detailed information for the purchase process, including photos,prices, promotions, specifications, reviews, tools to schedule service appointments and financial applications. Webelieve these features make it easier for consumers to meet all of their automotive research needs. Customers cancontact dedicated Internet sales consultants on line via www.unitedauto.com or the dealership websites.
We have also partnered with CarsDirect.com, a leading online car buying service that provides consumers witha full menu of research features. Consumers can also use CarsDirect.com to either buy a vehicle online or be sent toa network of dealerships in their market, including most of our dealerships. Research features include detailedsafety ratings and reviews, financing, extended warranties, insurance quotes, anti-theft products and trade-inappraisals.
Outside the U.S. Sytner Group, our U.K. subsidiary, is one of the leading retailers of premium vehicles in theU.K. As of February 1, 2007, Sytner operated 130 franchises, including: Alpina, Audi, Bentley, BMW, Chrysler,Dodge, Ferrari, Honda, Jaguar, Jeep, Lamborghini, Land Rover, Lexus, Maserati, Mercedes-Benz, MINI, Porsche,Rolls Royce, Saab, smart, Toyota, and Volvo. Revenues attributable to Sytner Group for the years endedDecember 31, 2006, 2005 and 2004 were $3.4 billion, $2.8 billion and $2.4 billion, respectively. Our otheroperations outside the U.S. consist of fifteen wholly-owned franchises in Germany, as well as joint ventureinvestments in Germany and Mexico which operate 25 franchises representing Audi, BMW, Lexus, MINI, Toyota,and Volkswagen.
9

The following is a list of all of our dealerships as of February 1, 2007:
U.S. DEALERSHIPS
ARIZONAAcura North ScottsdaleAudi North ScottsdaleBMW North ScottsdaleJaguar North ScottsdaleJaguar ScottsdaleLand Rover North ScottsdaleLand Rover ScottsdaleLexus of ChandlerMercedes-Benz of ChandlerMINI North ScottsdalePorsche North ScottsdaleRolls-Royce ScottsdaleScottsdale Aston MartinScottsdale AudiScottsdale BentleyScottsdale Ferrari MaseratiScottsdale LexusTempe HondaVolkswagen North ScottsdaleVolvo North Scottsdale
ARKANSASAcura of FayettevilleChevrolet/HUMMER of FayettevilleHonda of FayettevilleLanders Chevrolet HUMMERLanders Chrysler Jeep DodgeLanders Ford Lincoln MercuryToyota-Scion of Fayetteville
CALIFORNIAAcura of EscondidoAston Martin of San DiegoAudi EscondidoAudi Stevens CreekBMW of San DiegoCapitol HondaCerritos Buick Pontiac HUMMERGMCHonda Mission ValleyHonda NorthHonda of EscondidoJaguar Kearny MesaKearny Mesa AcuraKearny Mesa Toyota-ScionLexus Kearny MesaLos Gatos AcuraMarin HondaMazda of EscondidoMercedes-Benz of San Diego(& Maybach)Penske Cadillac HUMMER South BayPorsche of Stevens Creek
CONNECTICUTAudi of FairfieldHonda of DanburyMercedes-Benz of FairfieldPorsche of Fairfield
FLORIDACentral Florida Toyota-ScionCitrus Chrysler Jeep DodgePalm Beach MazdaPalm Beach SubaruPalm Beach Toyota-ScionWest Palm Nissan
GEORGIAAtlanta Toyota-ScionHonda Mall of GeorgiaUnited BMW of GwinnettUnited BMW of Roswell
INDIANAPenske ChevroletPenske Honda
MICHIGANHonda BloomfieldRinke CadillacRinke Pontiac GMC TruckRinke Toyota-ScionToyota-Scion of Waterford
MINNESOTAMotorwerks BMW/MINI
MISSISSIPPILanders DodgeLanders Nissan
NEW JERSEYAcura of TurnersvilleBMW of TurnersvilleChevrolet HUMMER Cadillac ofTurnersvilleDiFeo BMWFerrari Maserati of Central New JerseyGateway Toyota-ScionHonda of TurnersvilleHudson NissanHudson Toyota-ScionHyundai of TurnersvilleLexus of BridgewaterNissan of TurnersvilleToyota-Scion of Turnersville
NEW YORKHonda of NanuetMercedes-Benz of NanuetWestbury Toyota-Scion
NEVADAPenske Wynn Ferrari Maserati
OHIOHonda of MentorInfiniti of BedfordMaserati of ClevelandMercedes-Benz of BedfordNissan of North OlmstedToyota-Scion of Bedford
OKLAHOMAJaguar of TulsaLincoln Mercury of Tulsa (4111 SMemorial)Lincoln Mercury of Tulsa (9607 SMemorial)United Ford NorthUnited Ford SouthUnited HUMMER of TulsaVolvo of Tulsa
RHODE ISLANDInskip AcuraInskip AudiInskip Autocenter (Mercedes-Benz)Inskip Bentley ProvidenceInskip BMWInskip InfinitiInskip LexusInskip NissanInskip PorscheInskip Volvo
TENNESSEELanders Ford of MemphisWolfchase Toyota-Scion
TEXASBMW of AustinGoodson Honda NorthGoodson Honda West
VIRGINIAAston Martin of Tysons CornerAudi of Tysons CornerMercedes-Benz of Tysons Corner(& Maybach)Porsche of Tysons Corner
10

NON-U.S. DEALERSHIPS
UNITED KINGDOMBentley Lamborghini BirminghamBentley Lamborghini EdinburghBentley ManchesterBradford AudiGraypaul Edinburgh (Ferrari/Maserati)Graypaul Nottingham(Ferrari/Maserati)Guildford AudiGuy Salmon Jaguar AscotGuy Salmon Jaguar CoventryGuy Salmon Jaguar GatwickGuy Salmon Jaguar MaidstoneGuy Salmon Jaguar NorthamptonGuy Salmon Jaguar OxfordGuy Salmon Jaguar Stratford(After Sales)Guy Salmon Jaguar Thames DittonGuy Salmon Land Rover AscotGuy Salmon Land Rover CoventryGuy Salmon Land Rover GatwickGuy Salmon Land Rover KnutsfordGuy Salmon Land Rover LeedsGuy Salmon Land Rover MaidstoneGuy Salmon Land Rover PortsmouthGuy Salmon Land Rover SheffieldGuy Salmon Land Rover StockportGuy Salmon Land Rover Stratford-upon-AvonGuy Salmon Land Rover ThamesDittonGuy Salmon Land Rover WakefieldHarrogate AudiKings Bristol Chrysler Jeep DodgeKings Cheltenham & Gloucester(Chrysler, Jeep, Dodge)Kings Manchester (Chrysler, Jeep,Dodge)Kings Swindon (Chrysler, Jeep,Dodge)Leeds AudiLexus BirminghamLexus BristolLexus CardiffLexus LeicesterLexus Milton Keynes
Lexus OxfordMayfair AudiMercedes-Benz of BathMercedes-Benz of BedfordMercedes-Benz of CarlisleMercedes-Benz of Cheltenham andGloucesterMercedes-Benz of Cribbs CausewayMercedes-Benz of KetteringMercedes-Benz of Milton KeynesMercedes-Benz of NewburyMercedes-Benz of NorthamptonMercedes-Benz of SunderlandMercedes-Benz of TeessideMercedes-Benz of Weston-Super-MareMercedes-Benz/smart of BristolMercedes-Benz/smart of New CastleMercedes-Benz/smart of SwindonOxford SaabPorsche Centre EdinburghPorsche Centre GlasgowPorsche Centre Mid-SussexPorsche Centre SilverstoneReading AudiRedhill HondaRolls-Royce Motor Cars SunningdaleRydale BMW/MINI CardiffRydale BMW/MINI CentralRydale BMW/MINI NewportRydale BMW/MINI SuttonRydale BMW/MINI WarleyRyfield Chrysler Jeep Dodge NewCastleRyfield Chrysler Jeep Dodge StocktonSlough Audismart North East Stocktonsmart of Milton KeynesSytner Canary Wharf (BMW/MINI)Sytner Chigwell (BMW/MINI)Sytner Coventry (BMW/MINI)
Sytner Harold Wood (BMW/MINI)Sytner High Wycombe (BMW)Sytner Leicester (BMW/MINI)Sytner Nottingham (BMW/MINI,Alpina)Sytner Rolls-Royce Motor CarsSytner Sheffield (BMW/MINI)Sytner Solihull (BMW/MINI)Sytner Sunningdale (BMW/MINI)Tollbar Coventry (Volvo)Tollbar Twickenham (Volvo)Tollbar Warwick (Volvo)Toyota World BirminghamToyota World (Bridgend)Toyota World (Bristol North)Toyota World (Bristol South)Toyota World (Cardiff)Toyota World (Newport)Toyota World (Tamworth)Victoria Audi (After Sales)Wakefield AudiWest London Audi
GERMANYAutohaus Augsburg (BMW(4)/MINI)Tamsen, Bremen (Aston Martin,Bentley, Ferrari, Maserati, Rolls-Royce)Tamsen, Hamburg (Aston Martin,Ferrari, Lamborghini, Maserati, Rolls-Royce)
PUERTO RICOLexus de San JuanTriangle Chrysler, Dodge, Jeep,Honda del OesteTriangle Chrysler, Dodge, Jeep dePonceTriangle Honda 65 de InfanteriaTriangle Honda-Suzuki de PonceTriangle Mazda de PonceTriangle Nissan del OesteTriangle Toyota-Scion de San Juan
We also own approximately 50% of the following dealerships:
GERMANYAix Automobile (Toyota, Lexus)Audi Zentrum AachenAutohaus Krings (Volkswagon)Autohaus Nix (Frankfurt) (Toyota, Lexus)Autohaus Nix (Offenbach) (Toyota, Lexus)Autohaus Nix (Wachtersbach) (Toyota, Lexus)Autohaus Piper (Volkswagen)Autohaus Reisacher (Krunback) (BMW)Autohaus Reisacher (Memmingen) (BMW, MINI)Autohaus Reisacher (Ulm) (BMW, MINI)Autohaus Reisacher (Vohringen) (BMW)J-S Auto Park Stolberg (Volkswagen)TCD (Toyota)Volkswagen Zentrum AachenWolff & Meir (Volkswagen)
MEXICOToyota de AguascalientesToyota de LindavistaToyota de Monterrey
11

Management Information Systems
We consolidate financial, accounting and operational data received from our U.S. dealers through an exclusiveprivate communications network. Dealership data is gathered and processed through individual dealer systemsutilizing The Reynolds and Reynolds Company dealer management systems. Each dealership is allowed to tailor theoperational capabilities of that system locally, but we require that they follow our standardized accountingprocedures. Our U.S. network allows us to extract and aggregate information from the system in a consistent formatto generate consolidating financial and operational data. The system also allows us to access detailed informationfor each dealership in the U.S. individually, as a group, or on a consolidated basis. Information we can accessincludes, among other things, inventory, cash, unit sales, the mix of new and used vehicle sales and sales ofaftermarket products and services. Our ability to access this data allows us to continually analyze these dealerships’operating results and financial position so as to identify areas for improvement. Our technology also enables us toquickly integrate dealerships or dealership groups we acquire in the U.S.
Our foreign dealership financial, accounting and operational data is processed through dealer managementsystems provided by a number of local software providers. Financial and operational information is aggregatedfollowing U.S. policies and accounting requirements, and is reported in our U.S. reporting format to ensureconsistency of results among our worldwide operations.
Marketing
We believe that our marketing programs have contributed to our sales growth. Our advertising and marketingefforts are focused at the local market level, with the aim of building our retail vehicle business, as well as repeatsales and service business. We utilize many different media for our marketing activities, including newspapers,direct mail, magazines, television, radio and the Internet. We also assist our local management in running specialmarketing events to generate sales such as tent sales or local product placement. Automobile manufacturerssupplement our local and regional advertising efforts by producing large advertising campaigns to support theirbrands, promote attractive financing packages and draw traffic to local area dealerships. We believe that our scalehas enabled us to obtain favorable terms from suppliers and advertising media, and should enable us to realizecontinued cost savings in marketing. In an effort to realize increased efficiencies, we are focusing on commonmarketing metrics and business practices across our dealerships, as well as negotiating enterprise arrangements formany marketing resources.
Agreements with Vehicle Manufacturers
Each of our dealerships operates under separate franchise agreements with the manufacturers of each brand ofvehicle sold at that dealership. These agreements contain provisions and standards governing almost every aspect ofthe dealership, including ownership, management, personnel, training, maintenance of minimum working capitaland in some cases net worth, maintenance of minimum lines of credit, advertising and marketing, facilities, signs,products and services, acquisitions of other dealerships (including restrictions on how many dealerships can beacquired or operated in any given market), maintenance of minimum amounts of insurance, achievement ofminimum customer service standards and monthly financial reporting. Typically, the dealership principal and/or theowner of a dealership may not be changed without the manufacturer’s consent.
In exchange for complying with these provisions and standards, we are granted the non-exclusive right to sellthe manufacturer’s brand of vehicles and related parts and services at our dealerships. The agreements also grant usa non-exclusive license to use each manufacturer’s trademarks, service marks and designs in connection with oursales and service of its brands at our dealerships. Some of our franchise agreements expire after a specified period oftime, ranging from one to five years. The agreements also permit the manufacturer to terminate or not renew theagreement for a variety of causes, including failure to adequately operate the dealership, insolvency or bankruptcy,impairment of the dealer’s reputation or financial standing, changes in the dealership’s management, owners orlocation without consent, sales of the dealership’s assets without consent, failure to maintain adequate workingcapital or floor plan financing, changes in the dealership’s financial or other condition, failure to submit requiredinformation to the manufacturer on a timely basis, failure to have any permit or license necessary to operate thedealership, and material breaches of other provisions of the agreement. These termination rights are subject to
12

applicable state franchise laws that limit a manufacturer’s right to terminate a franchise. Many agreements grant themanufacturer a security interest in the vehicles and/or parts sold by the manufacturer to the dealership.
Our agreements with manufacturers usually give the manufacturers the right, in some circumstances(including upon a merger, sale, or change of control of the company, or in some cases a material change inour business or capital structure), to acquire from us, at fair market value, the dealerships that sell the manufac-turers’ brands. In particular, our agreement with General Motors Corporation provides that, upon a proposed sale of20% or more of our voting stock to any other person or entity (other than for passive investment) or anothermanufacturer, an extraordinary corporate transaction (such as a merger, reorganization or sale of a material amountof assets) or a change of control of our board of directors, General Motors has the right to acquire at fair marketvalue, all assets, properties and business of any General Motors dealership owned by us. In addition, General Motorshas a right of first refusal if we propose to sell any of our General Motors dealerships to a third party. Some of ouragreements with other major manufacturers contain provisions similar to the General Motors provisions. Some ofthe agreements also prohibit us from pledging, or impose significant limitations on our ability to pledge, the capitalstock of some of our subsidiaries to lenders.
Competition
For new vehicle sales, we compete primarily with other franchised dealers in each of our marketing areas. Wedo not have any cost advantage in purchasing new vehicles from manufacturers, and typically we rely on our world-class facilities, advertising and merchandising, management experience, sales expertise, service reputation and thelocation of our dealerships to sell new vehicles. Each of our markets may include a number of well-capitalizedcompetitors that also have extensive automobile dealership managerial experience and strong retail locations andfacilities.
We compete with dealers that sell the same brands of new vehicles that we sell and with dealers that sell otherbrands of new vehicles that we do not represent in a particular market. Our new vehicle dealership competitors havefranchise agreements with the various vehicle manufacturers and, as such, generally have access to new vehicles onthe same terms as us. In recent years, automotive dealers have also faced increased competition in the sale of newvehicles from on-line purchasing services and warehouse clubs. Due to lower overhead and sales costs, thesecompanies may be willing to offer products at lower prices than franchised dealers.
For used vehicle sales, we compete with other franchised dealers, independent used vehicle dealers, auto-mobile rental agencies, on-line purchasing services, private parties and used vehicle “superstores” for theprocurement and resale of used vehicles.
We believe that the principal competitive factors in vehicle sales are the marketing campaigns conducted bymanufacturers, the ability of dealerships to offer a wide selection of the most popular vehicles, the location ofdealerships and the quality of customer service. Other competitive factors include customer preference forparticular brands of automobiles, pricing (including manufacturer rebates and other special offers) and warranties.We believe that our dealerships are competitive in all of these areas.
We compete with other franchised dealers to perform warranty repairs and with other automotive dealers,franchised and non-franchised service center chains, and independent garages for non-warranty repair and routinemaintenance business. We compete with other automotive dealers, service stores and auto parts retailers in our partsoperations. We believe that the principal competitive factors in parts and service sales are price, the use of factory-approved replacement parts, facility location, the familiarity with a manufacturer’s brands and models and thequality of customer service. A number of regional or national chains offer selected parts and services at prices thatmay be lower than our prices.
According to various industry sources, the automotive retail industry is currently served by approximately21,500 franchised automotive dealerships, over 50,000 independent used vehicle dealerships and individualconsumers who sell used vehicles in private transactions. Several other companies have established national orregional automotive retail chains. Additionally, vehicle manufacturers have historically engaged in the retail saleand service of vehicles, either independently or in conjunction with their franchised dealerships, and may do so on
13
an expanded basis in the future, subject to various state laws that restrict or prohibit manufacturer ownership ofdealerships.
We believe that a growing number of consumers are utilizing the Internet, to differing degrees, in connectionwith the purchase of vehicles. Accordingly, we may face increased pressure from on-line automotive websites,including those developed by automobile manufacturers and other dealership groups. Consumers use the Internet tocompare prices for vehicles and related services, which may result in reduced margins for new vehicles, usedvehicles and related services.
Employees and Labor Relations
As of December 31, 2006, we employed approximately 15,800 people, approximately 465 of whom werecovered by collective bargaining agreements with labor unions. We consider our relations with our employees to besatisfactory. Our policy is to motivate our key managers through, among other things, variable compensationprograms tied principally to dealership profitability and our equity incentive compensation plans. Due to ourreliance on vehicle manufacturers, we may be adversely affected by labor strikes or work stoppages at themanufacturers’ facilities.
Regulation
We operate in a highly regulated industry. A number of regulations affect our business of marketing, selling,financing and servicing automobiles. We actively make efforts to assure compliance with these regulations. Underthe laws of the jurisdictions in which we currently operate or into which we may expand, we typically must obtain alicense in order to establish, operate or relocate a dealership or operate an automotive repair service, includingdealer, sales, finance and insurance-related licenses issued by relevant authorities. These laws also regulate ourconduct of business, including our advertising, operating, financing, employment and sales practices. Other lawsand regulations include franchise laws and regulations, extensive laws and regulations applicable to new and usedmotor vehicle dealers, as well as wage-hour, anti-discrimination and other employment practices laws.
Our operations may also be subject to consumer protection laws known in the U.S. as “Lemon Laws”. Theselaws typically require a manufacturer or dealer to replace a new vehicle or accept it for a full refund within a periodof time after initial purchase if the vehicle does not conform to the manufacturer’s express warranties and the dealeror manufacturer, after a reasonable number of attempts, is unable to correct or repair the defect. Various laws requirevarious written disclosures to be provided on new vehicles, including mileage and pricing information. Importedautomobiles may be subject to customs duties and, in the ordinary course of our business, we may, from time totime, be subject to claims for duties, penalties, liquidated damages, or other charges.
Our financing activities with customers are subject to federal truth-in-lending, consumer leasing equal creditopportunity and similar regulations as well as motor vehicle finance laws, installment finance laws, insurance laws,usury laws and other installment sales laws. Some jurisdictions regulate finance fees that may be paid as a result ofvehicle sales. In recent years, private plaintiffs and state attorneys general in the U.S. have increased their scrutinyof advertising, sales, and finance and insurance activities in the sale and leasing of motor vehicles.
In the U.S., we also benefit from the protection of numerous state dealer laws that generally provide that amanufacturer may not terminate or refuse to renew a franchise agreement unless it has first provided the dealer withwritten notice setting forth good cause and stating the grounds for termination or non-renewal. Some state dealerlaws allow dealers to file protests or petitions or to attempt to comply with the manufacturer’s criteria within thenotice period to avoid the termination or non-renewal. Europe generally does not have these laws and, as a result,our European dealerships operate without these protections.
Environmental Matters
We are subject to a wide range of environmental laws and regulations, including those governing dischargesinto the air and water, the operation and removal of aboveground and underground storage tanks, the use, handling,storage and disposal of hazardous substances and other materials and the investigation and remediation ofcontamination. As with automotive dealerships generally, and service, parts and body shop operations in particular,
14

our business involves the generation, use, handling and contracting for recycling or disposal of hazardous or toxicsubstances or wastes, including environmentally sensitive materials such as motor oil, waste motor oil and filters,transmission fluid, antifreeze, refrigerant, waste paint and lacquer thinner, batteries, solvents, lubricants, degreasingagents, gasoline and diesel fuels. Similar to many of our competitors, we have incurred and will continue to incur,capital and operating expenditures and other costs in complying with such laws and regulations.
Our operations involving the management of hazardous and other environmentally sensitive materials aresubject to numerous requirements. Our business also involves the operation of storage tanks containing suchmaterials. Storage tanks are subject to periodic testing, containment, upgrading and removal under applicable law.Furthermore, investigation or remediation may be necessary in the event of leaks or other discharges from current orformer underground or aboveground storage tanks. In addition, water quality protection programs govern certaindischarges from some of our operations. Similarly, certain air emissions from our operations, such as auto bodypainting, may be subject to relevant laws. Various health and safety standards also apply to our operations.
We may also have liability in connection with materials that were sent to third-party recycling, treatment,and/or disposal facilities under the U.S. Comprehensive Environmental Response, Compensation and Liability Act,or CERCLA, and comparable statutes. These statutes impose liability for investigation and remediation ofcontamination without regard to fault or the legality of the conduct that contributed to the contamination.Responsible parties under these statutes may include the owner or operator of the site where the contaminationoccurred and companies that disposed or arranged for the disposal of the hazardous substances released at thesesites.
We believe that we do not have any material environmental liabilities and that compliance with environmentallaws and regulations will not, individually or in the aggregate, have a material adverse effect on our results ofoperations, financial condition or cash flows. However, soil and groundwater contamination is known to exist atcertain of our current or former properties. Further, environmental laws and regulations are complex and subject tochange. In addition, in connection with our acquisitions, it is possible that we will assume or become subject to newor unforeseen environmental costs or liabilities, some of which may be material. Compliance with current,amended, new or more stringent laws or regulations, stricter interpretations of existing laws or the future discoveryof environmental conditions could require additional expenditures by us, and such expenditures could be material.
Insurance
Due to the nature of the automotive retail industry, automotive retail dealerships generally require significantlevels of insurance covering a broad variety of risks. The business is subject to substantial risk of property loss due tothe significant concentration of property values at dealership locations, including vehicles and parts. Other potentialliabilities arising out of our operations involve claims by employees, customers or third parties for personal injury orproperty damage and potential fines and penalties in connection with alleged violations of regulatory requirements.
As a result, we purchase insurance subject to specified deductibles and significant loss retentions, includingumbrella and excess insurance policies. The level of risk we retain may change in the future as insurance marketconditions or other factors affecting the economics of purchasing insurance change. Based on the coverage of ourexisting policies, we could be exposed to uninsured or underinsured losses, including as a result of our deductiblesand significant loss retentions, that could have a material adverse effect on our results of operations, financialcondition or cash flows. We and Penske Corporation, which is our largest stockholder, have entered into a jointinsurance agreement which provides that, with respect to our joint insurance policies (which includes our propertypolicy), available coverage with respect to a loss shall be paid to each party as stipulated in the policies. In the eventof losses by us and Penske Corporation in excess of the limit of any policy during a policy period, the total policyproceeds will be allocated based on the ratio of premiums paid. For information regarding our relationship withPenske Corporation, see Part II — Item 7 — “Management’s Discussion and Analysis of Financial Condition andResults of Operations-Related Party Transactions.”
Seasonality
Our business is modestly seasonal overall. Our U.S. operations generally experience higher volumes of vehiclesales in the second and third quarters of each year due in part to consumer buying trends and the introduction of new
15

vehicle models. Also, demand for cars and light trucks is generally lower during the winter months than in otherseasons, particularly in regions of the United States where dealerships may be subject to severe winters. The greatestU.S. seasonality exists at the dealerships we operate in northeastern and upper mid-western states, for which thesecond and third quarters are the strongest with respect to vehicle-related sales. Our U.K. operations generallyexperience higher volumes of vehicle sales in the first and third quarters of each year, due primarily to vehicleregistration practices in the U.K. The service and parts business at all dealerships experience relatively modestseasonal fluctuations.
Available Information
For selected financial information concerning our U.S. and non-U.S. sales and assets, see the notes to ourconsolidated financial statements included in Item 8 of this report. Our Internet website address iswww.unitedauto.com. Our annual reports on Form 10-K, quarterly reports on Form 10-Q, current reports onForm 8-K, and amendments to those reports filed or furnished pursuant to section 13(a) or 15(d) of the ExchangeAct are available free of charge through our website under the tab “Investor Relations” as soon as reasonablypracticable after they are electronically filed with, or furnished to, the Securities and Exchange Commission. Wealso make available on our website copies of materials regarding our corporate governance policies and practices,including our Corporate Governance Guidelines; our Code of Business Ethics; and the charters relating to thecommittees of our Board of Directors. You also may obtain a printed copy of the foregoing materials by sending awritten request to: Investor Relations, United Auto Group, Inc., 2555 Telegraph Road, Bloomfield Hills, MI 48302.The information on or linked to our website is not part of this document. We plan to disclose waivers, if any, for ourexecutive officers or directors from our code of conduct on our website, www.unitedauto.com. We are incorporatedin the state of Delaware and began dealership operations in October 1992. We submitted to the New York StockExchange its required annual CEO certification in 2006 without qualification and have filed all required certi-fications under section 302 of the Sarbanes-Oxley Act as exhibits to this annual report on Form 10-K relating to2006.
Item 1A. Risk Factors
Risks Relating to Automotive Manufacturers
Automotive manufacturers exercise significant control over our operations and we depend on them inorder to operate our business.
Each of our dealerships operates under franchise agreements with automotive manufacturers or relateddistributors. We are dependent on automotive manufacturers because, without a franchise agreement, we cannotoperate a new vehicle franchise or perform manufacturer authorized service.
Manufacturers exercise a great degree of control over the operations of our dealerships. For example,manufacturers can require our dealerships to meet specified standards of appearance, require individual dealershipsto meet specified financial criteria such as maintenance of minimum net working capital and, in some cases,minimum net worth, impose minimum customer service and satisfaction standards, set standards regarding themaintenance of vehicle and parts inventories, restrict the use of manufacturers’ names and trademarks and, in manycases, must consent to the replacement of the dealership principal.
Our franchise agreements may be terminated or not renewed by automotive manufacturers for a variety ofreasons, including unapproved changes of ownership or management and other material breaches of the franchiseagreements. We have, from time to time, not been compliant with various provisions of some of our franchiseagreements. Although we believe that we will be able to renew at expiration all of our existing franchise agreements,if any of our significant existing franchise agreements or a large number of franchise agreements are not renewed orthe terms of any such renewal are materially unfavorable to us, our results of operations, financial condition or cashflows could be materially adversely affected. In addition, actions taken by manufacturers to exploit their bargainingposition in negotiating the terms of renewals of franchise agreements or otherwise could also materially adverselyaffect our results of operations, financial condition or cash flows.
16
While U.S. franchise laws give us limited protection in selling a manufacturer’s product within a givengeographic area, our franchise agreements do not give us the exclusive right to sell vehicles within a given area andthe location of a significant number of new dealerships near our existing dealerships could materially adverselyaffect our results of operations, financial condition or cash flows.
We depend on manufacturers to provide us with a desirable mix of popular new vehicles, which tends toproduce the highest profit margins. Manufacturers generally allocate their vehicles among dealerships based on thesales history of each dealership. Our inability to obtain sufficient quantities of the most popular models, whetherdue to sales declines at our dealerships or otherwise, could materially adversely affect our results of operations,financial condition or cash flows.
Our volumes and profitability may be adversely affected if automotive manufacturers reduce or discon-tinue their incentive programs.
Our dealerships depend on the manufacturers for sales incentives, warranties and other programs that promoteand support vehicle sales at our dealerships. Some of these programs include customer rebates, dealer incentives,special financing or leasing terms and warranties. Manufacturers frequently change their incentive programs. Ifmanufacturers reduce or discontinue incentive programs, our results of operations, financial condition or cash flowscould be materially adversely affected.
Adverse conditions affecting one or more automotive manufacturers may negatively impact our revenuesand profitability.
Our success depends on the overall success of the line of vehicles that each of our dealerships sells. As a result,our success depends to a great extent on the automotive manufacturers’ financial condition, marketing, vehicledesign, production and distribution capabilities, reputation, management and labor relations. For 2006, Toyota/Lexus brands, BMW/MINI, Honda/Acura, DaimlerChrysler brands and Ford/Premier Auto Group accounted for21%, 18%, 16%, 11% and 10%, respectively, of our total revenues. A significant decline in the sale of new vehiclesmanufactured by these manufacturers, or the loss or deterioration of our relationships with one or more of thesemanufacturers, could materially adversely affect our results of operations, financial condition or cash flows. Noother manufacturer accounted for more than 10% of our total revenues for 2006.
Events such as labor strikes that may adversely affect a manufacturer may also materially adversely affect us,especially if these events were to interrupt the supply of vehicles or parts to us. Similarly, the delivery of vehiclesfrom manufacturers at a time later than scheduled, which may occur particularly during periods of new productintroductions, has led, and in the future could lead, to reduced sales during those periods. In addition, any event thatcauses adverse publicity involving one or more automotive manufacturers or their vehicles may materiallyadversely affect our results of operations, financial condition or cash flows.
Our failure to meet manufacturers’ consumer satisfaction requirements may adversely affect us.
Many manufacturers measure customers’ satisfaction with their sales and warranty service experiencesthrough systems that are generally known as customer satisfaction indices, or CSI. Manufacturers sometimes use adealership’s CSI scores as a factor in evaluating applications for additional dealership acquisitions. Certain of ourdealerships have had difficulty from time to time in meeting their manufacturers’ CSI standards. We may be unableto meet these standards in the future. A manufacturer may refuse to consent to a franchise acquisition by us if ourdealerships do not meet their CSI standards. This could materially adversely affect our acquisition strategy. Inaddition, because we receive payments from the manufacturers based in part on CSI scores, future payments couldbe materially reduced or eliminated if our CSI scores decline.
Automotive manufacturers impose limits on our ability to issue additional equity and on the ownership ofour common stock by third parties, which may hamper our ability to meet our financing needs.
A number of manufacturers impose restrictions on the sale and transfer of our common stock. The mostprohibitive restrictions provide that, under specified circumstances, we may be forced to sell or surrender franchises(1) if a competing automotive manufacturer acquires a 5% or greater ownership interest in us or (2) if an individual
17

or entity that has a criminal record in connection with business dealings with any automotive manufacturer,distributor or dealer or who has been convicted of a felony acquires a 5% or greater ownership interest in us. Further,several manufacturers have the right to approve the acquisition by a third party of 20% or more of our commonstock, and a number of manufacturers continue to prohibit changes in ownership that may affect control of ourcompany.
Actions by our stockholders or prospective stockholders that would violate any of the above restrictions aregenerally outside our control. If we are unable to obtain a waiver or relief from these restrictions, we may be forcedto terminate or sell one or more franchises, which could materially adversely affect our results of operations,financial condition or cash flows. These restrictions also may prevent or deter prospective acquirers from acquiringcontrol of us and, therefore, may adversely impact the value of our common stock. These restrictions also mayimpede our ability to raise required capital or our ability to acquire dealership groups using our common stock mayalso be inhibited.
Risks Relating to our Acquisition Strategy
Growth in our revenues and earnings depends substantially on our ability to acquire and successfullyoperate new dealerships.
While we expect to acquire new dealerships, we cannot guarantee that we will be able to identify and acquireadditional dealerships in the future. Moreover, acquisitions involve a number of risks, including:
• integrating the operations and personnel of the acquired dealerships;
• operating in new markets with which we are not familiar;
• incurring unforeseen liabilities at acquired dealerships;
• disruption to our existing businesses;
• failure to retain key personnel of the acquired dealerships;
• impairment of relationships with employees, manufacturers and customers; and
• incorrectly valuing acquired entities.
In addition, integrating acquired dealerships into our existing mix of dealerships may result in substantialcosts, diversion of our management resources or other operational or financial problems. Unforeseen expenses,difficulties and delays frequently encountered in connection with the integration of acquired entities and the rapidexpansion of operations could inhibit our growth, result in our failure to achieve acquisition synergies and require usto focus resources on integration rather than other more profitable areas.
Acquired entities may subject us to unforeseen liabilities that we are unable to detect prior to completing theacquisition, or liabilities that turn out to be greater than those we had expected. These liabilities may includeliabilities that arise from non-compliance with environmental laws by prior owners for which we, as a successorowner, will be responsible. Until we assume operating control of acquired entities, we may not be able to ascertainthe actual value of the acquired entity.
We may be unable to identify acquisition candidates that would result in the most successful combinations, orcomplete acquisitions on acceptable terms on a timely basis. The magnitude, timing, pricing and nature of futureacquisitions will depend upon various factors, including the availability of suitable acquisition candidates, thenegotiation of acceptable terms, our financial capabilities, the availability of skilled employees to manage theacquired companies and general economic and business conditions. Further, covenants contained in our debtinstruments impose limitations on our ability to acquire additional dealerships and future debt instruments mayimpose additional restrictions. Furthermore, we have sold and may in the future sell dealerships based on numerousfactors, which may impact our future revenues and earnings, particularly if we do not make acquisitions to replacesuch revenues and earnings.
18

Manufacturers’ restrictions on acquisitions may limit our future growth.
Our future growth via acquisition of automotive dealerships will depend on our ability to obtain the requisitemanufacturer approvals. The relevant manufacturer must consent to any franchise acquisition and it may notconsent in a timely fashion or at all. In addition, under many franchise agreements or under local law, amanufacturer may have a right of first refusal to acquire a dealership that we seek to acquire.
Certain manufacturers limit the total number of their dealerships that we may own in a particular geographicarea and, in some cases, the total number of their vehicles that we may sell as a percentage of that manufacturer’soverall sales. Manufacturers may also limit the ownership of stores in contiguous markets and the dueling of afranchise with another brand. To date, we have only reached these ceilings with two manufacturers. If additionalmanufacturers impose or expand these types of restrictions, our acquisition strategy and results of operations,financial condition or cash flows could be materially adversely affected.
Other Business Risks
Our business is susceptible to adverse economic conditions, including changes in consumer confidence,fuel prices and credit availability.
We believe that the automotive retail industry is influenced by general economic conditions and particularly byconsumer confidence, the level of personal discretionary spending, interest rates, fuel prices, weather conditions,unemployment rates and credit availability. Historically, unit sales of motor vehicles, particularly new vehicles,have been cyclical, fluctuating with general economic cycles. During economic downturns, new vehicle retail salestend to experience periods of decline characterized by oversupply and weak demand. The automotive retail industrymay experience sustained periods of decline in vehicle sales in the future. Any decline or change of this type couldmaterially adversely affect our results of operations, financial condition or cash flows.
Some of our operations are regionally concentrated such as those in Arizona, California, the NortheasternUnited States and the United Kingdom. Adverse regional economic and competitive conditions in these areas couldmaterially adversely affect our results of operations, financial condition or cash flows.
Substantial competition in automotive sales and services may adversely affect our profitability.
The automotive retail industry is highly competitive. Depending on the geographic market, we compete with:
• franchised automotive dealerships in our markets that sell the same or similar makes of new and usedvehicles that we offer;
• private market buyers and sellers of used vehicles;
• Internet-based vehicle brokers that sell vehicles obtained from franchised dealers directly to consumers;
• vehicle rental companies that sell their used rental vehicles;
• service center chain stores; and
• independent service and repair shops.
In addition, automotive manufacturers may directly enter the retail market in the future, which couldmaterially adversely affect our results of operations, financial condition or cash flows. Some of our competitorsmay have greater financial, marketing and personnel resources and lower overhead and sales costs than us. We donot have any cost advantage over other franchised automotive dealerships in purchasing new vehicles from theautomotive manufacturers.
In addition to competition for vehicle sales, our dealerships compete with franchised dealerships to performwarranty repairs and with other automotive dealers, independent service center chains, independent garages andothers, for non-warranty repair, routine maintenance and parts business. A number of regional or national chainsoffer selected parts and services at prices that may be lower than our dealerships’ prices. We also compete with abroad range of financial institutions in arranging financing for our customers’ vehicle purchases.
19

The Internet is a significant part of the sales process in our industry. We believe that customers are using theInternet as part of the sales process to compare pricing for cars and related finance and insurance services, whichmay reduce gross profit margins for new and used cars and profits generated from the sale of finance and insuranceproducts. Some websites offer vehicles for sale over the Internet without the benefit of having a dealershipfranchise, although they must currently source their vehicles from a franchised dealer. If Internet new vehicle salesare allowed to be conducted without the involvement of franchised dealers, or if dealerships are able to effectivelyuse the Internet to sell outside of their markets, our business could be materially adversely affected. We could alsobe materially adversely affected to the extent that Internet companies acquire dealerships or ally themselves withour competitors’ dealerships.
Our capital costs and our results of operations may be adversely affected by a rising interest rateenvironment.
We finance our purchases of new and, to a lesser extent, used vehicle inventory using floor plan financingarrangements under which we are charged interest at floating rates. In addition, we obtain capital for generalcorporate purposes, dealership acquisitions and real estate purchases and improvements under predominantlyfloating interest rate credit facilities. Therefore, excluding the potential mitigating effects from interest rate hedgingtechniques, our interest expenses will rise with increases in interest rates. Rising interest rates may also have theaffect of depressing demand in the interest rate sensitive aspects of our business, particularly new and used vehiclessales, because many of our customers finance their vehicle purchases. As a result, rising interest rates may have theaffect of simultaneously increasing our costs and reducing our revenues, which could materially adversely affectour results of operations, financial condition or cash flows.
Our substantial indebtedness may limit our ability to obtain financing for acquisitions and may requirethat a significant portion of our cash flow be used for debt service.
We have a substantial amount of indebtedness. As of December 31, 2006, we had approximately $1.2 billion oftotal non-floor plan debt outstanding and $1.2 billion of floor plan notes payable outstanding. In addition, we haveadditional debt capacity under our credit facilities.
Our substantial debt could have important consequences. For example, it could:
• make it more difficult for us to obtain additional financing in the future for our acquisitions and operations,working capital requirements, capital expenditures, debt service or other general corporate requirements;
• require us to dedicate a substantial portion of our cash flows from operations to repay debt and relatedinterest rather than other areas of our business;
• limit our operating flexibility due to financial and other restrictive covenants, including restrictions onincurring additional debt, creating liens on our properties, making acquisitions or paying dividends;
• place us at a competitive disadvantage compared to our competitors that have less debt; and
• make us more vulnerable in the event of adverse economic or industry conditions or a downturn in ourbusiness.
Our ability to meet our debt service obligations depends on our future performance, which will be impacted bygeneral economic conditions and by financial, business and other competitive factors, many of which are beyondour control. These factors could include operating difficulties, increased operating costs, the actions of competitors,regulatory developments and delays in implementing our growth strategies. Our ability to meet our debt service andother obligations may depend on our success in implementing our business strategy. We may not be able toimplement our business strategies and the anticipated results of our strategies may not be realized.
If our business does not generate sufficient cash flow from operations or future sufficient borrowings are notavailable to us, we might not be able to service our debt or to fund our other liquidity needs. If we are unable toservice our debt, we may have to delay or cancel acquisitions, sell equity securities, sell assets or restructure orrefinance our debt. If we are unable to service our debt, we may not be able to pursue these options on a timely basis
20

or on satisfactory terms or at all. In addition, the terms of our existing or future franchise agreements, agreementswith manufacturers or debt agreements may prohibit us from adopting any of these alternatives.
Our inability to raise capital, if needed, could adversely affect us.
We require substantial capital in order to acquire and renovate automotive dealerships. This capital might beraised through public or private financing, including through the issuance of debt or equity securities, sale-leaseback transactions and other sources. Availability under our credit agreements may be limited by the covenantsand conditions of those facilities. We may not be able to raise additional funds. If we raise additional funds byissuing equity securities, dilution to then existing stockholders may result.
If adequate funds are not available, we may be required to significantly curtail our acquisition and renovationprograms, which could materially and adversely affect our growth strategy.
We depend to a significant extent on our ability to finance the purchase of inventory in the form of floor planfinancing. Floor plan financing is financing from a vehicle manufacturer secured by the vehicles we sell. Ourdealerships borrow money to buy a particular vehicle from the manufacturer and pay off the floor plan financingwhen they sell the particular vehicle, paying interest during the interim period. Our floor plan financing is securedby substantially all of the assets of our automotive dealership subsidiaries. Our remaining assets are pledged tosecure our credit facilities. This may impede our ability to borrow from other sources. Most of our floor plan lendersare associated with manufacturers with whom we have franchise agreements. Consequently, the deterioration of ourrelationship with a manufacturer could adversely affect our relationship with the affiliated floor plan lender and viceversa. Any inability to obtain floor plan financing on customary terms, or the termination of our floor plan financingarrangements by our floor plan lenders, could materially adversely affect our results of operations, financialcondition or cash flows.
Shares eligible for future sale may cause the market price of our common stock to drop significantly,even if our business is doing well.
The potential for sales of substantial amounts of our common stock in the public market may have a materialadverse effect on our stock price. In addition, the amount of equity securities that we issue in connection withacquisitions and renovations could be significant resulting in dilution to you or adversely affecting our stock price.The majority of our outstanding shares are held by two shareholders, each of whom has registration rights that couldresult in a substantial number of shares being sold in the market. Moreover, these shares could be resold at any timesubject to the volume limitations under Rule 144. In addition, we also have reserved for issuance a significantnumber of shares relating to our 3.5% convertible senior subordinated notes which, if issued, may result insubstantial dilution to you or adversely effect our stock price. Finally, we have a significant amount of authorizedbut unissued shares that, if issued, could materially adversely effect our stock price.
Property loss, business interruptions or other liabilities at some of our dealerships could impact our oper-ating results.
The automotive retail business is subject to substantial risk of property loss due to the significant concentrationof property values at dealership locations, including vehicles and parts. We have historically experienced businessinterruptions at several of our dealerships due to adverse weather conditions or other extraordinary events, such aswild fires in California or hurricanes in Florida. Other potential liabilities arising out of our operations involveclaims by employees, customers or third parties for personal injury or property damage and potential fines andpenalties in connection with alleged violations of regulatory requirements. To the extent we experience futuresimilar events, our results of operations, financial condition or cash flows may be materially adversely impacted.
If we lose key personnel or are unable to attract additional qualified personnel, our business could beadversely affected.
We believe that our success depends to a significant extent upon the efforts and abilities of our executivemanagement and key employees, including, in particular, Roger S. Penske, our Chairman and Chief ExecutiveOfficer. Additionally, our business is dependent upon our ability to continue to attract and retain qualified
21

personnel, such as managers, as well as retaining dealership management in connection with acquisitions. Wegenerally have not entered into employment agreements with our key personnel. The loss of the services of one ormore members of our senior management team, including, in particular, Roger S. Penske, could have a materialadverse effect on us and materially impair the efficiency and productivity of our operations. We do not have key maninsurance for any of our executive officers or key personnel. The loss of any of our key employees or the failure toattract qualified managers could have a material adverse effect on our business.
Our quarterly operating results may fluctuate due to seasonality and other factors.
The automotive industry typically experiences seasonal variations in vehicle revenues. Demand for automo-biles is generally lower during the winter months than in other seasons, particularly in regions of the United Statesthat may have severe winters. In the United States, a higher number of vehicle sales generally occurs in the secondand third quarters of each year, due in part to consumer buying trends and the introduction of new vehicle models.Therefore, if conditions exist in the second or third quarters that depress or affect automotive sales, such as high fuelcosts, depressed economic conditions or similar adverse conditions, our revenues for the year may be dispropor-tionately adversely affected.
In addition, the U.K. retail automotive industry typically experiences peak sales activity during March andSeptember of each year. This seasonality results from the perception in the United Kingdom that the resale value ofa vehicle may be determined by the date that the vehicle is registered. Because new vehicle registration periodsbegin on March 1 and September 1 each year, vehicles with comparable mileage that were registered in March mayhave an equivalent used vehicle value to vehicles registered in August of the same year.
Our business may be adversely affected by import product restrictions and foreign trade risks that mayimpair our ability to sell foreign vehicles profitably.
A significant portion of our new vehicle business involves the sale of vehicles, vehicle parts or vehiclescomposed of parts that are manufactured outside the region in which they are sold. As a result, our operations aresubject to customary risks associated with imported merchandise, including fluctuations in the relative value ofcurrencies, import duties, exchange controls, differing tax structures, trade restrictions, transportation costs, workstoppages and general political and economic conditions in foreign countries.
The locations in which we operate may, from time to time, impose new quotas, duties, tariffs or otherrestrictions, or adjust presently prevailing quotas, duties or tariffs on imported merchandise. Any of thoseimpositions or adjustments could materially affect our operations and our ability to purchase imported vehiclesand parts at reasonable prices, which could materially adversely affect our business.
Our automotive dealerships are subject to substantial regulation and related claims and proceedings, anyof which could adversely affect our profitability.
A number of regulations affect our business of marketing, selling, financing and servicing automobiles. Underthe laws of states in U.S. locations in which we currently operate, we typically must obtain a license in order toestablish, operate or relocate a dealership or operate an automotive repair service, including dealer, sales, financeand insurance-related licenses. These laws also regulate our conduct of business, including our advertising,operating, financing, employment and sales practices. In addition, our foreign operations are subject to regulationsin their respective jurisdictions.
Our financing activities with customers are subject to truth-in-lending, consumer leasing, equal creditopportunity and similar regulations as well as motor vehicle finance laws, installment finance laws, insurancelaws, usury laws and other installment sales laws. Some jurisdictions regulate finance fees that may be paid as aresult of vehicle sales. In recent years, private plaintiffs and state attorneys general in the U.S. have increased theirscrutiny of advertising, sales, and finance and insurance activities in the sale and leasing of motor vehicles. Theseactivities have led many lenders to limit the amounts that may be charged to customers as fee income for theseactivities. If these or similar activities were significantly to restrict our ability to generate revenue from arrangingfinancing for our customers, we could be adversely affected.
22

We could also be susceptible to claims or related actions if we fail to operate our business in accordance withthese laws. Claims arising out of actual or alleged violations of law may be asserted against us or any of our dealersby individuals, either individually or through class actions, or by governmental entities in civil or criminalinvestigations and proceedings. Such actions may expose us to substantial monetary damages and legal defensecosts, injunctive relief and criminal and civil fines and penalties, including suspension or revocation of our licensesand franchises to conduct dealership operations.
We will generally continue to be involved in legal proceedings in the ordinary course of business. A significantjudgment against us, the loss of a significant license or permit or the imposition of a significant fine could have amaterial adverse effect on our business, financial condition and future prospects.
If state dealer laws in the United States are repealed or weakened, our dealership franchise agreementswill be more susceptible to termination, non-renewal or renegotiation.
State dealer laws in the United States generally provide that an automotive manufacturer may not terminate orrefuse to renew a franchise agreement unless it has first provided the dealer with written notice setting forth goodcause and stating the grounds for termination or non-renewal. Some state dealer laws allow dealers to file protests orpetitions or to attempt to comply with the manufacturer’s criteria within the notice period to avoid the termination ornon-renewal. Though unsuccessful to date, manufacturers’ lobbying efforts may lead to the repeal or revision ofstate dealer laws. If dealer laws are repealed in the states in which we operate, manufacturers may be able toterminate our franchises without providing advance notice, an opportunity to cure, or a showing of good cause.Without the protection of state dealer laws, it may also be more difficult for our dealerships to renew their franchiseagreements upon expiration. Jurisdictions outside the United States generally do not have these laws and, as a result,operate without these protections.
Our dealerships are subject to environmental regulations that may result in claims and liabilities whichcould be material.
We are subject to a wide range of environmental laws and regulations, including those governing dischargesinto the air and water, the operation and removal of storage tanks and the use, storage and disposal of hazardoussubstances. Our dealerships and service, parts and body shop operations in particular use, store and contract forrecycling or disposal of hazardous materials. Any non-compliance with these regulations could result in significantfines and penalties which could adversely affect our results of operations, financial condition or cash flows. Further,investigation or remediation may be necessary in the event of leaks or other discharges from current or formerunderground or aboveground storage tanks.
In the U.S., we may also have liability in connection with materials that were sent to third-party recycling,treatment, and/or disposal facilities under federal and state statutes, which impose liability for investigation andremediation of contamination without regard to fault or the legality of the conduct that contributed to thecontamination. Similar to many of our competitors, we have incurred and will continue to incur, capital andoperating expenditures and other costs in complying with such laws and regulations.
Soil and groundwater contamination is known to exist at some of our current or former properties. Inconnection with our acquisitions, it is possible that we will assume or become subject to new or unforeseenenvironmental costs or liabilities, some of which may be material. In connection with dispositions of businesses, ordispositions previously made by companies we acquire, we may retain exposure for environmental costs andliabilities, some of which may be material. Environmental laws and regulations are complex and subject to change.Compliance with new or more stringent laws or regulations, stricter interpretations of existing laws or the futurediscovery of environmental conditions could require additional expenditures by us which could materiallyadversely affect our results of operations, financial condition or cash flows.
Our principal stockholders have substantial influence over us and may make decisions with which youdisagree.
Penske Corporation through various affiliates beneficially owns 39% of our outstanding common stock. Inaddition, Penske Corporation and its affiliates have entered into a stockholders agreement with our second largest
23

stockholder, Mitsui & Co., Ltd. and one of its affiliates, pursuant to which they have agreed to vote together as to theelection of our directors. Collectively, these two groups beneficially own 56% of our outstanding stock. As a result,these persons have the ability to control the composition of our board of directors and therefore they may be able tocontrol the direction of our affairs and business.
This concentration of ownership, as well as various provisions contained in our agreements with manufac-turers, our certificate of incorporation and bylaws and the Delaware General Corporation Law, could have the affectof discouraging, delaying or preventing a change in control of us or unsolicited acquisition proposals. Theseprovisions include the stock ownership limits imposed by various manufacturers and our ability to issue “blankcheck” preferred stock and the “interested stockholder” provisions of Section 203 of the Delaware GeneralCorporation Law.
Some of our directors and officers may have conflicts of interest with respect to certain related partytransactions and other business interests.
Some of our executive officers also hold executive positions at other companies affiliated with our largeststockholder. Roger S. Penske, our Chairman and Chief Executive Officer, is also Chairman and Chief ExecutiveOfficer of Penske Corporation, a diversified transportation services company. Robert H. Kurnick, Jr., our ViceChairman and a director, is also President of Penske Corporation, and Paul F. Walters, our Executive VicePresident — Human Resources and Hiroshi Ishikawa, our Executive Vice President — International BusinessDevelopment, serve in similar capacities for Penske Corporation. Much of the compensation of these officers is paidby Penske Corporation and not by us, and while these officers have historically devoted a substantial amount of theirtime to our matters, these officers are not required to spend any specific amount of time on our matters. In addition,one of our directors, Richard J. Peters and our President, Roger Penske, Jr., each serves as a director of PenskeCorporation. In addition, Penske Corporation owns Penske Automotive Group, a privately held automotivedealership company with operations in southern California. Finally, we are a tenant under a number of non-cancelable leases with Automotive Group Realty, LLC (AGR), a wholly owned subsidiary of Penske Corporation,and have sold substantial amounts of real property and improvements to AGR, which we have then leased. Due totheir relationships with these related entities, Messrs. Ishikawa, Kurnick, Penske, Penske, Jr., Peters and Waltersmay have a conflict of interest in making any decision related to transactions between their related entities and us, orwith respect to allocations of corporate opportunities.
Our operations outside the United States subject us to foreign currency translation risk and exposure tochanges in exchange rates.
In recent years, between 25% and 35% of our revenues have been generated outside the U.S., predominately inthe United Kingdom. As a result, we are exposed to the risks involved in foreign operations, including:
• changes in international tax laws and treaties, including increases of withholding and other taxes onremittances and other payments by subsidiaries;
• currency and exchange risks;
• tariffs, trade barriers, and restrictions on the transfer of funds between nations;
• changes in international governmental regulations;
• the impact of local economic and political conditions;
• the impact of European Commission regulation and the relationship between the United Kingdom andcontinental Europe; and
• increased competition and the impact from limited franchise protection in the United Kingdom.
If our operations outside the U.S. fail to perform as expected, we will be adversely impacted. In addition, ourresults of operations and financial position are reported in local currency and are then translated into U.S. dollars atthe applicable foreign currency exchange rate for inclusion in our consolidated financial statements. As exchange
24

rates fluctuate, particularly between the U.S. and U.K., the translation effect of such fluctuations may have amaterial effect on our results of operations or financial position as reported in U.S. dollars.
Item 1B. Unresolved Staff Comments
Not Applicable.
Item 2. Properties
We seek to structure our operations so as to minimize our ownership of real property. As a result, we lease orsublease substantially all of our dealerships and other facilities. These leases are generally for a period of betweenfive and 20 years, and are typically structured to include renewal options for an additional five to ten years at ourelection. We lease office space in Bloomfield Hills, Michigan, Secaucus, New Jersey, Leicester, England andStuttgart, Germany for our administrative headquarters and other corporate related activities. We believe that ourfacilities are sufficient for our needs and are in good repair.
Item 3. Legal Proceedings
We are involved in litigation which may involve issues with customers, employment related matters, classaction claims, purported class action claims and claims brought by governmental authorities. We are not a party toany legal proceedings, including class action lawsuits to which we are a party that, individually or in the aggregate,are reasonably expected to have a material adverse effect on our results of operations, financial condition or cashflows. However, the results of these matters cannot be predicted with certainty, and an unfavorable resolution of oneor more of these matters could have a material adverse effect on our results of operations, financial condition or cashflows.
Item 4. Submission of Matters to a Vote of Security-Holders
No matter was submitted to a vote of our security holders during the fourth quarter of the year endedDecember 31, 2006.
PART II
Item 5. Market for Registrant’s Common Equity, Related Stockholder Matters and Issuer Purchase ofEquity Securities
Our common stock is traded on the New York Stock Exchange under the symbol “UAG”. As of February 19,2007, there were 281 holders of record of our common stock.
The following table shows the high and low per share sales prices of our common stock as reported on the NewYork Stock Exchange Composite Tape for each quarter of 2006 and 2005, as well as the per share dividends paid ineach quarter.
High Low Dividend
2005:
First Quarter . . . . . . . . . . . . . . . . . . . . . . . . . . . . . . . . . . . . . . . . . $14.61 $13.54 $0.055
Second Quarter . . . . . . . . . . . . . . . . . . . . . . . . . . . . . . . . . . . . . . . 16.26 12.87 0.055
Third Quarter . . . . . . . . . . . . . . . . . . . . . . . . . . . . . . . . . . . . . . . . . 18.17 14.65 0.055
Fourth Quarter . . . . . . . . . . . . . . . . . . . . . . . . . . . . . . . . . . . . . . . . 19.75 15.36 0.06
2006:
First Quarter . . . . . . . . . . . . . . . . . . . . . . . . . . . . . . . . . . . . . . . . . $22.61 $18.63 $ 0.06
Second Quarter . . . . . . . . . . . . . . . . . . . . . . . . . . . . . . . . . . . . . . . 22.33 19.77 0.07
Third Quarter . . . . . . . . . . . . . . . . . . . . . . . . . . . . . . . . . . . . . . . . . 23.90 19.73 0.07
Fourth Quarter . . . . . . . . . . . . . . . . . . . . . . . . . . . . . . . . . . . . . . . . 24.46 22.27 0.07
25

Dividends. Future quarterly or other cash dividends will depend upon our earnings, capital requirements,financial condition, restrictions in any existing indebtedness and other factors considered relevant by the Board ofDirectors. Our U.S. credit agreement and the indentures governing our outstanding notes each contain certainlimitations on our ability to pay dividends. See Item 7. “Management’s Discussion and Analysis of FinancialCondition and Results of Operations — Liquidity and Capital Resources.” We are a holding company whose assetsconsist primarily of the direct or indirect ownership of the capital stock of our operating subsidiaries. Consequently,our ability to pay dividends is dependent upon the earnings of our subsidiaries and their ability to distribute earningsand other advances and payments to us. In addition, pursuant to the automobile franchise agreements to which ourdealerships are subject, all dealerships are required to maintain a certain amount of working capital or net worth,which could limit our subsidiaries’ ability to pay us dividends.
SHARE INVESTMENT PERFORMANCE
The following graph compares the cumulative total stockholder returns on our common stock based on aninvestment of $100 on December 31, 2001 and the close of the market on December 31 of each year thereafteragainst (i) the Standard & Poor’s Index and (ii) an industry/peer group consisting of Asbury Automotive Group,Inc., AutoNation, Inc., Group 1 Automotive, Inc., Lithia Motors Inc. and Sonic Automotive Inc. The graph alsoassumes the reinvestment of all dividends.
0
50
100
150
200
250
12/0612/0512/0412/0312/0212/01
United Auto Group, Inc.
S&P 500
Peer Goup
12/01 12/02 12/03 12/04 12/05 12/06
Cumulative Total Return
United Auto Group, Inc. 100.00 48.31 121.75 116.80 152.91 190.80
S&P 500 100.00 77.90 100.24 111.15 116.61 135.03
Peer Group 100.00 94.23 142.91 144.59 159.64 175.97
Item 6. Selected Financial Data
The following table sets forth our selected historical consolidated financial and other data as of and for each ofthe five years in the period ended December 31, 2006, which has been derived from our audited consolidatedfinancial statements. During the periods presented, we made a number of acquisitions, each of which has beenaccounted for using the purchase method of accounting. Accordingly, our financial statements include the results ofoperations of acquired dealerships from the date of acquisition. As a result of the acquisitions, our period to periodresults of operations vary depending on the dates of the acquisitions. Accordingly, this selected financial data is notnecessarily indicative of our future results. During the periods presented, we also sold certain dealerships whichhave been treated as discontinued operations in accordance with Statement of Financial Accounting Standards(“SFAS”) No. 144, Accounting for the Impairment or Disposal of Long-Lived Assets. You should read this selected
26

consolidated financial data in conjunction with our audited consolidated financial statements and related footnotesincluded elsewhere in this report.
2006 2005(1) 2004(2) 2003(3) 2002(4)As of and for the Years Ended December 31,
(In millions, except per share data)
Consolidated Statement of Income Data:
Total revenues . . . . . . . . . . . . . . . . . . . . . . . . . . . $11,242.3 $9,661.4 $8,388.0 $6,935.8 $5,524.1
Gross profit . . . . . . . . . . . . . . . . . . . . . . . . . . . . . $ 1,704.5 $1,473.5 $1,255.3 $1,022.6 $ 821.4
Income from continuing operations beforecumulative effect of accounting change . . . . . . $ 130.6 $ 119.1 $ 109.1 $ 73.4 $ 47.2
Net income . . . . . . . . . . . . . . . . . . . . . . . . . . . . . $ 124.7 $ 119.0 $ 111.7 $ 82.9 $ 62.2
Diluted earnings per share from continuingoperations . . . . . . . . . . . . . . . . . . . . . . . . . . . . $ 1.39 $ 1.27 $ 1.20 $ 0.89 $ 0.57
Diluted earnings per share . . . . . . . . . . . . . . . . . . $ 1.32 $ 1.27 $ 1.22 $ 1.00 $ 0.76
Shares used in computing diluted share data. . . . . 94.2 93.9 91.2 82.9 82.3
Balance Sheet Data:
Total assets . . . . . . . . . . . . . . . . . . . . . . . . . . . . . $ 4,469.8 $3,594.2 $3,532.8 $3,144.2 $2,690.3Floor plan notes payable . . . . . . . . . . . . . . . . . . . $ 1,172.3 $1,103.3 $1,031.8 $ 882.6 $ 652.1
Total debt (excluding floor plan notes payable) . . $ 1,182.1 $ 580.2 $ 586.3 $ 651.6 $ 665.6
Total stockholders’ equity . . . . . . . . . . . . . . . . . . $ 1,295.7 $1,145.7 $1,075.0 $ 828.4 $ 704.4
Cash dividends per share . . . . . . . . . . . . . . . . . . . $ 0.27 $ 0.23 $ 0.21 $ 0.05 $ —
(1) Includes $8.2 million ($5.2 million after-tax), or $0.06 per share, of earnings attributable to the sale of all theremaining variable profits relating to the pool of extended service contracts sold at our dealerships from 2001through 2005.
(2) Includes an $11.5 million ($7.2 million after tax), or $0.08 per share, gain resulting from the sale of aninvestment and an $8.4 million ($5.3 million after tax), or $0.06 per share, gain resulting from a refund of U.K.consumption taxes. These gains were offset in part by non-cash charges of $7.8 million ($4.9 million after tax),or $0.05 per share, principally in connection with the planned relocation of certain U.K. franchises as part of ourongoing facility enhancement program.
(3) Includes a $5.1 million charge ($3.1 million after tax), or $0.04 per share, from the cumulative effect of anaccounting change relating to the adoption of Emerging Issues Task Force (“EITF”) Issue No. 02-16,Accounting by a Customer (Including a Reseller) for Cash Consideration Received from a Vendor.
(4) Includes a $22.8 million charge ($13.6 million after tax), or $0.17 per share, which includes the estimated cashcosts to be paid relating to employment contracts of certain employees terminated in connection with thestreamlining of our dealership operations in the western region of the U.S. and the cost of a non-competeagreement with a former member of management that we determined no longer had a continuing economicbenefit.
27

Item 7. Management’s Discussion and Analysis of Financial Condition and Results of Operations
This Management’s Discussion and Analysis of Financial Condition and Results of Operations containsforward-looking statements that involve risks and uncertainties. Our actual results may differ materially from thosediscussed in the forward-looking statements as a result of various factors, including those discussed in “Item 1A. —Risk Factors.” We have acquired a number of dealerships each year since our inception. Our financial statementsinclude the results of operations of acquired dealerships from the date of acquisition. This Management’sDiscussion and Analysis of Financial Condition and Results of Operations has been updated for entities thathave been treated as discontinued operations through December 31, 2006 in accordance with Statement ofFinancial Accounting Standards (“SFAS”) No. 144, Accounting for the Impairment or Disposal of Long-LivedAssets, and to reflect our June 1, 2006 two-for-one split of our voting common stock in the form of a stock dividend.
Overview
We are the second largest automotive retailer in the United States as measured by total revenues. As ofDecember 31, 2006, we owned and operated 167 franchises in the United States and 145 franchises outside of theU.S., primarily in the United Kingdom. We offer a full range of vehicle brands. In addition to selling new and usedvehicles, we generate higher-margin revenue at each of our dealerships through maintenance and repair services andthe placement of higher-margin products, such as third-party finance and insurance products, third-party extendedservice contracts and replacement and aftermarket automotive products.
On June 1, 2006 we effected a two-for-one split of our voting common stock in the form of a stock dividend.Shareholders of record as of May 11, 2006 received one additional share for each share owned.
New and used vehicle revenues include sales to retail customers and to leasing companies providing consumerautomobile leasing. We generate finance and insurance revenues from third-party extended service contracts, otherthird-party insurance policies, finance and lease contracts and certain other products. Service and parts revenuesinclude fees paid for repair, maintenance and collision services, the sale of replacement parts and the sale ofaftermarket accessories.
We and Sirius Satellite Radio Inc. (“Sirius”) have agreed to jointly promote Sirius Satellite Radio service.Pursuant to the terms of our arrangement with Sirius, our dealerships in the U.S. endeavor to order a significantpercentage of eligible vehicles with a factory installed Sirius radio. We and Sirius have also agreed to jointly marketthe Sirius service under a best efforts arrangement through January 4, 2009. Our costs relating to such marketinginitiatives are expensed as incurred. As compensation for our efforts, we received warrants to purchase ten millionshares of Sirius common stock at $2.392 per share in 2004 that are being earned ratably on an annual basis throughJanuary 2009. We earned warrants to purchase two million shares in each of 2004, 2005 and 2006. We exercised thewarrants and sold the underlying stock we received in connection with the vesting of shares in 2004 and 2005. Wemeasure the fair value of the warrants we earn ratably on the date they are earned as there are no significantdisincentives for non-performance. Since we can reasonably estimate the number of warrants being earned pursuantto the ratable schedule, the estimated fair value (based on current fair value) of these warrants is being recognizedratably during each annual period.
We also have received the right to earn additional warrants to purchase Sirius common stock at $2.392 pershare based upon the sale of certain units of specified vehicle brands through December 31, 2007. We earnedwarrants for 1,269,700 shares in 2006 and 522,400 shares in 2005. We exercised the warrants and sold theunderlying stock we earned in 2005. Since we cannot reasonably estimate the number of warrants that will be earnedsubject to the sale of units, the fair value of these warrants is being recognized when they are earned.
The value of Sirius stock has been and is expected to be subject to significant fluctuations, which may result invariability in the amount we earn under this arrangement. The warrants may be cancelled upon the termination ofour arrangement in January 2009 and we may not be able to achieve the performance targets outlined in thewarrants.
Our gross profit tends to vary with the mix of revenues we derive from the sale of new vehicles, used vehicles,finance and insurance products, and service and parts transactions. Our gross profit generally varies across productlines, with vehicle sales usually resulting in lower gross profit margins and our other revenues resulting in higher
28

gross profit margins. Factors such as seasonality, weather, cyclicality and manufacturers’ advertising and incentivesmay impact the mix of our revenues, and therefore influence our gross profit margin.
Our selling expenses consist of advertising and compensation for sales personnel, including commissions andrelated bonuses. General and administrative expenses include compensation for administration, finance, legal andgeneral management personnel, rent, insurance, utilities and other outside services. A significant portion of ourselling expenses are variable, and we believe a significant portion of our general and administrative expenses aresubject to our control, allowing us to adjust them over time to reflect economic trends.
Floor plan interest expense relates to obligations incurred in connection with the acquisition of new and usedvehicle inventories. Other interest expense consists of interest charges on all of our interest-bearing debt, other thanthe interest relating to floor plan financing.
The future success of our business will likely be dependent on, among other things, our ability to consummateand integrate acquisitions, our ability to increase sales of higher-margin products and services, especially serviceand parts transactions, and our ability to realize returns on our significant capital investment in new and upgradeddealerships. See “Item 1A. — Risk Factors.”
Critical Accounting Policies and Estimates
The preparation of financial statements in accordance with accounting principles generally accepted in theUnited States of America requires the application of accounting policies that often involve making estimates andemploying judgments. Such judgments influence the assets, liabilities, revenues and expenses recognized in ourfinancial statements. Management, on an ongoing basis, reviews these estimates and assumptions. Managementmay determine that modifications in assumptions and estimates are required, which may result in a material changein our results of operations or financial position.
The following are the accounting policies applied in the preparation of our financial statements thatmanagement believes are most dependent upon the use of estimates and assumptions.
Revenue Recognition
Vehicle, Parts and Service Sales
We record revenue when vehicles are delivered and title has passed to the customer, when vehicle service orrepair work is performed and when parts are delivered to our customers. Sales promotions that we offer to customersare accounted for as a reduction of sales at the time of sale. Rebates and other incentives offered directly to us bymanufacturers are recognized as earned.
Finance and Insurance Sales
Subsequent to the sale of the vehicle to a customer, we sell our credit contracts to various financial institutionson a non-recourse basis to mitigate the risk of default. We receive a commission from the lender equal to either thedifference between the interest rates charged to customers and the interest rates set by the financing institution or aflat fee. We also receive commissions for facilitating the sale of various third-party insurance products to customers,including credit and life insurance policies and extended service contracts. These commissions are recorded asrevenue at the time the customer enters into the contract. In the case of finance contracts, a customer may prepay orfail to pay their contract, thereby terminating the contract. Customers may also terminate extended service contractsand other insurance products, which are fully paid at purchase, and become eligible for refunds of unusedpremiums. In these circumstances, a portion of the commissions we received may be charged back to us based onthe terms of the contracts. The revenue we record relating to these transactions is net of an estimate of the amount ofchargebacks we will be required to pay. Our estimate is based upon our historical experience with similar contracts,including the impact of refinance and default rates on retail finance contracts and cancellation rates on extendedservice contracts and other insurance products.
29
Sales Tax
We exclude sales tax collected from customers and paid to taxing authorities from revenues.
Intangible Assets
Our principal intangible assets relate to our franchise agreements with vehicle manufacturers, which representthe estimated value of franchises acquired in business combinations, and goodwill, which represents the excess ofcost over the fair value of tangible and identified intangible assets acquired in connection with business combi-nations. We believe the franchise value of our dealerships has an indefinite useful life based on the following facts:
• Automotive retailing is a mature industry and is based on franchise agreements with the vehiclemanufacturers;
• There are no known changes or events that would alter the automotive retailing franchise environment;
• Certain franchise agreement terms are indefinite;
• Franchise agreements that have limited terms have historically been renewed without substantial cost; and
• Our history shows that manufacturers have not terminated our franchise agreements.
Impairment Testing
Franchise value impairment is assessed at least annually through a comparison of the carrying amounts of ourfranchises with their estimated fair values. An indicator of impairment exists if the carrying value of a franchiseexceeds its estimated fair value and an impairment loss may be recognized equal to that excess. We also evaluate ourfranchises in connection with the annual impairment testing to determine whether events and circumstancescontinue to support our assessment that the franchise has an indefinite life.
Goodwill impairment is assessed at least annually at the reporting unit level. An indicator of impairment existsif the carrying amount of the reporting unit including goodwill is determined to exceed its estimated fair value. If anindication of impairment exists, the impairment is measured by comparing the implied fair value of the reportingunit goodwill with the carrying amount of that goodwill and an impairment loss may be recognized equal to thatexcess.
The fair values of franchise value and goodwill are determined using a discounted cash flow approach, whichincludes assumptions that include revenue and profitability growth, franchise profit margins, residual values and ourcost of capital. If future events and circumstances cause significant changes in the assumptions underlying ouranalysis which results in a reduction of our estimates of fair value, we may incur an impairment charge.
Investments
Investments include marketable securities and investments in businesses accounted for under the equitymethod and the cost method. Marketable securities include investments in debt and equity securities. Marketablesecurities held by us are typically classified as available for sale and are stated at fair value on our balance sheet withunrealized gains and losses included in other comprehensive income (loss), a separate component of stockholders’equity. Declines in investment values that are deemed to be other than temporary would be an indicator ofimpairment and may result in an impairment charge reducing the investments’ carrying value to fair value. Amajority of our investments are in joint venture relationships that are more fully described in “Joint VentureRelationships” below. Such joint venture relationships are accounted for under the equity method, pursuant to whichwe record our proportionate share of the joint venture’s income each period.
Self-Insurance
We retain risk relating to certain of our general liability insurance, workers’ compensation insurance, autophysical damage insurance, property insurance and employee medical benefits in the United States. As a result, weare likely to be responsible for a majority of the claims and losses incurred under these programs. The amount of riskwe retain varies by program, and, for certain exposures, we have pre-determined maximum exposure limits for
30

certain individual claims and/or insurance periods. Losses, if any, above the pre-determined exposure limits are paidby third-party insurance carriers. Our estimate of future losses is prepared by management using our historical lossexperience and industry-based development factors.
Income Taxes
Tax regulations may require items to be included in our tax return at different times than such items arereflected in our financial statements. Some of these differences are permanent, such as expenses that are notdeductible on our tax return, and some are timing differences, such as the timing of depreciation expense. Timingdifferences create deferred tax assets and liabilities. Deferred tax assets generally represent items that can be used asa tax deduction or credit in our tax return in future years which we have already recorded in our financial statements.Deferred tax liabilities generally represent deductions taken on our tax return that have not yet been recognized asan expense in our financial statements. We establish valuation allowances for our deferred tax assets if it is morelikely than not that the amount of expected future taxable income will not be sufficient to allow the use of thededuction or credit.
Classification of Franchises in Continuing and Discontinued Operations
We classify the results from operations of our continuing and discontinued operations in our consolidatedfinancial statements based on the provisions of SFAS No. 144. Many of these provisions involve judgment indetermining whether a franchise will be reported as continuing or discontinued operations. Such judgments includewhether a franchise will be sold or terminated, the period required to complete the disposition, and the likelihood ofchanges to a plan for sale. If in future periods we determine that a franchise should be either reclassified fromcontinuing operations to discontinued operations or from discontinued operations to continuing operations, ourconsolidated statements of income for prior periods may be reclassified in order to reflect such reclassification.
New Accounting Pronouncements
FASB Interpretation (“FIN”) No. 48, “Accounting for Uncertainty in Income Taxes,” prescribes a recognitionthreshold and measurement attribute for the financial statement recognition and measurement of tax positions takenor expected to be taken in tax returns. The benefits of tax positions are recognized if it is more likely than not that theposition will be sustained upon examination by the taxing authorities, who it is presumed have full knowledge of allrelevant information. The amount recognized will be the largest amount of benefit that is greater than fifty percentlikely of being realized upon ultimate settlement. Companies will generally record the change in net assets thatresult from the application of FIN No. 48 as an adjustment to retained earnings. FIN No. 48 became effective for uson January 1, 2007. We estimate that the adoption of FIN No. 48 will decrease retained earnings as of January 1,2007 by between $3.0 million and $7.0 million.
SFAS No. 157, “Fair Value Measurements” defines fair value, establishes a framework for measuring fairvalue in generally accepted accounting principles, and expands disclosure requirements relating to fair valuemeasurements. SFAS No. 157 will be effective for us on January 1, 2008. We are currently evaluating the impact ofthis pronouncement.
SFAS No. 159, “The Fair Value Option for Financial Assets and Financial Liabilities” permits entities tochoose to measure many financial instruments and certain other items at fair value and consequently reportunrealized gains and losses on such items in earnings. SFAS No. 159 will be effective for us on January 1, 2008. Weare currently evaluating the impact of this pronouncement.
Results of Operations
The following tables present comparative financial data relating to our operating performance in the aggregateand on a “same store” basis. Dealership results are included in same store comparisons when we have consolidatedthe acquired entity during the entirety of both periods being compared. As an example, if a dealership was acquiredon January 15, 2005, the results of the acquired entity would be included in annual same store comparisons
31

beginning with the year ended December 31, 2007 and in quarterly same store comparisons beginning with thequarter ended June 30, 2006.
2006 compared to 2005 and 2005 compared to 2004 (in millions, except unit and per unit amounts)
Our results for the year ended December 31, 2005 include $8.2 million ($5.2 million after-tax), or $0.06 pershare, of earnings attributable to the sale of all the remaining variable profits relating to the pool of extended servicecontracts sold at our dealerships from 2001 through 2005. In addition, 2004 results include an $11.5 million($7.2 million after tax), or $0.08 per share, gain resulting from the sale of an investment and an $8.4 million($5.3 million after tax), or $0.06 per share, gain resulting from a refund of U.K. consumption taxes. These gainswere offset in part by non-cash charges of $7.8 million ($4.9 million after tax), or $0.05 per share, principally inconnection with the planned relocation of certain U.K. franchises as part of our ongoing facility enhancementprogram.
Total Retail Data 2006 2005 Change % Change 2005 2004 Change % Change
2006 vs. 2005 2005 vs. 2004
Total retail unit sales . . . . . . . . . . . . . . . . . . . 272,093 243,304 28,789 11.8% 243,304 219,253 24,051 11.0%
Total same store retail unit sales. . . . . . . . . . . . 238,854 235,920 2,934 1.2% 213,780 208,779 5,001 2.4%
Total retail sales revenue . . . . . . . . . . . . . . . . $10,317.8 $ 8,900.2 $1,417.6 15.9% $ 8,900.2 $ 7,763.7 $1,136.5 14.6%
Total same store retail sales revenue . . . . . . . . . $ 9,067.2 $ 8,692.0 $ 375.2 4.3% $ 7,786.6 $ 7,360.1 $ 426.5 5.8%
Total retail gross profit . . . . . . . . . . . . . . . . . . $ 1,700.7 $ 1,473.1 $ 227.6 15.5% $ 1,473.1 $ 1,254.0 $ 219.1 17.5%
Total same store retail gross profit . . . . . . . . . . $ 1,504.0 $ 1,440.2 $ 63.8 4.4% $ 1,294.8 $ 1,184.2 $ 110.6 9.3%
Total retail gross margin . . . . . . . . . . . . . . . . . 16.5% 16.6% (0.1)% (0.6)% 16.6% 16.2% 0.4% 2.5%
Total same store retail gross margin . . . . . . . . . 16.6% 16.6% 0.0% 0.0% 16.6% 16.1% 0.5% 3.1%
Units
Retail data includes retail new vehicle, retail used vehicle, finance and insurance and service and partstransactions. Retail unit sales of vehicles increased by 28,789, or 11.8%, from 2005 to 2006 and increased by24,051, or 11.0%, from 2004 to 2005. The increase from 2005 to 2006 is due to a 25,855 unit increase from netdealership acquisitions during the year, coupled with a 2,934, or 1.2%, increase in same store retail unit sales. Theincrease from 2004 to 2005 is due to a 19,050 unit increase from net dealership acquisitions during the year, coupledwith a 5,001, or 2.4%, increase in same store retail unit sales. The same store increase from 2005 to 2006 was drivenby increases in our premium and volume foreign brands in the U.S., offset somewhat by decreases in domesticbrands in the U.S. and decreases in premium and volume foreign brands in the U.K. We believe the decreases in theU.K. are due in part to a general slowdown in vehicle sales in 2006, caused in part by rising interest rates. The samestore increase from 2004 to 2005 was driven by an increase in our premium brands in the U.K. and an increase in ourvolume foreign brands in the U.S., offset somewhat by a decrease in volume foreign brands in the U.K. anddecreases in domestic brands in the U.S. and U.K.
Revenues
Retail sales revenue increased $1.4 billion, or 15.9%, from 2005 to 2006 and increased $1.1 billion, or 14.6%,from 2004 to 2005. The increase from 2005 to 2006 is due to a $375.2 million, or 4.3%, increase in same storerevenues, coupled with a $1.0 billion increase from net dealership acquisitions during the year. The same storerevenue increase is due to: (1) a $741, or 2.2%, increase in average new vehicle revenue per unit, which increasedrevenue by $121.0 million, (2) a $1,350, or 5.0%, increase in average used vehicle revenue per unit, which increasedrevenue by $98.1 million, (3) a $70.6 million, or 6.9%, increase in service and parts revenues, and (4) the 1.2%increase in retail unit sales, which increased revenue by $86.4 million, offset by a $4, or 0.4%, decrease in averagefinance and insurance revenue per unit, which decreased revenue by $0.9 million. The increase from 2004 to 2005 isdue to a $426.5 million, or 5.8%, increase in same store revenues coupled with a $710.0 million increase from netdealership acquisitions during the year. The same store revenue increase is due to: (1) an $848, or 2.6%, increase inaverage new vehicle revenue per unit, which increased revenue by $121.6 million, (2) a $919, or 3.5% increase inaverage used vehicle revenue per unit, which increased revenue by $60.1 million, (3) a $66, or 7.1%, increase inaverage finance and insurance revenue per unit, which increased revenue by $13.8 million, (4) a $63.5 million, or
32

7.6%, increase in service and parts revenues, and (5) the 2.4% increase in retail unit sales, which increased revenueby $167.5 million.
Gross Profit
Retail gross profit increased $227.6 million, or 15.5%, from 2005 to 2006 and increased $219.1 million, or17.5%, from 2004 to 2005. The increase from 2005 to 2006 is due to a $63.8 million, or 4.4%, increase in same storegross profit, coupled with a $163.8 million increase from net dealership acquisitions during the year. The same storegross profit increase is due to: (1) a $21, or 0.7%, increase in average gross profit per new vehicle retailed, whichincreased gross profit by $3.4 million, (2) a $70, or 2.9%, increase in average gross profit per used vehicle retailed,which increased gross profit by $5.1 million, (3) a $46.2 million, or 8.3%, increase in service and parts gross profit,and (4) the 1.2% increase in retail unit sales, which increased gross profit by $10.0 million, offset by the $4, or 0.4%,decrease in average finance and insurance revenue per unit, which decreased gross profit by $0.9 million. Theincrease in retail gross profit from 2004 to 2005 is due to a $110.6 million, or 9.3%, increase in same store grossprofit, coupled with a $108.5 million increase from net dealership acquisitions during the year. The same store grossprofit increase is due to: (1) a $138, or 5.0%, increase in average gross profit per new vehicle retailed, whichincreased gross profit by $19.8 million, (2) a $198, or 9.0%, increase in average gross profit per used vehicleretailed, which increased gross profit by $12.9 million, (3) a $66, or 7.1%, increase in average finance and insurancerevenue per unit, which increased gross profit by $13.8 million, (4) a $44.8 million, or 9.9%, increase in service andparts gross profit, and (5) the 2.4%, increase in retail unit sales, which increased gross profit by $19.3 million.
New Vehicle Data 2006 2005 Change % Change 2005 2004 Change % Change
2006 vs. 2005 2005 vs. 2004
New retail unit sales . . . . . . . . . . . . . . . . . . . . . 183,370 167,956 15,414 9.2% 167,956 150,258 17,698 11.8%
Same store new retail unit sales. . . . . . . . . . . . . . 163,253 163,233 20 0.0% 147,898 143,416 4,482 3.1%
New retail sales revenue . . . . . . . . . . . . . . . . . . $ 6,275.9 $ 5,601.2 $ 674.7 12.0% $ 5,601.2 $ 4,879.1 $ 722.1 14.8%
Same store new retail sales revenue . . . . . . . . . . . $ 5,594.2 $ 5,472.6 $ 121.6 2.2% $ 4,904.6 $ 4,634.3 $ 270.3 5.8%
New retail sales revenue per unit . . . . . . . . . . . . . $ 34,225 $ 33,349 $ 876 2.6% $ 33,349 $ 32,471 $ 878 2.7%
Same store new retail sales revenue per unit . . . . . $ 34,267 $ 33,526 $ 741 2.2% $ 33,162 $ 32,314 $ 848 2.6%
Gross profit — new . . . . . . . . . . . . . . . . . . . . . . $ 548.8 $ 494.3 $ 54.5 11.0% $ 494.3 $ 424.3 $ 70.0 16.5%
Same store gross profit — new . . . . . . . . . . . . . . $ 487.6 $ 484.1 $ 3.5 0.7% $ 428.9 $ 396.1 $ 32.8 8.3%
Average gross profit per new vehicle retailed . . . . . $ 2,993 $ 2,943 $ 50 1.7% $ 2,943 $ 2,824 $ 119 4.2%
Same store average gross profit per new vehicleretailed . . . . . . . . . . . . . . . . . . . . . . . . . . . . $ 2,987 $ 2,966 $ 21 0.7% $ 2,900 $ 2,762 $ 138 5.0%
Gross margin % — new . . . . . . . . . . . . . . . . . . . 8.7% 8.8% (0.1)% (1.1)% 8.8% 8.7% 0.1% 1.1%
Same store gross margin % — new . . . . . . . . . . . 8.7% 8.8% (0.1)% (1.1)% 8.7% 8.5% 0.2% 2.4%
Units
Retail unit sales of new vehicles increased 15,414 units, or 9.2%, from 2005 to 2006, and increased17,698 units, or 11.8%, from 2004 to 2005. The increase from 2005 to 2006 is due to a 15,394 unit increasefrom net dealership acquisitions during the year as same store unit sales were flat. The increase from 2004 to 2005 isdue to a 4,482 unit, or 3.1%, increase in same store retail unit sales, coupled with a 13,216 unit increase from netdealership acquisitions during the year. This was a result of increases in premium and volume foreign brands in theU.S., offset by a decrease in our domestic brands in the U.S. and in premium brands in the U.K. We believe thedecreases in the U.K. are due in part to a general slowdown in vehicle sales in 2006, caused in part by rising interestrates. The same store increase from 2004 to 2005 was driven by increases in our premium brands in the U.S. and theU.K. and an increase in our volume foreign brands in the U.S., offset somewhat by a decrease in volume foreignbrands in the U.K. and decreases in domestic brands in the U.S. and U.K.
Revenues
New vehicle retail sales revenue increased $674.7 million, or 12.0%, from 2005 to 2006 and increased$722.1 million, or 14.8%, from 2004 to 2005. The increase from 2005 to 2006 is due to a $121.6 million, or 2.2%,increase in same store revenues, coupled with a $553.1 million increase from net dealership acquisitions during the
33

year. The same store revenue increase is due primarily to a $741, or 2.2%, increase in comparative average sellingprice per unit. The increase from 2004 to 2005 is due to a $270.3 million, or 5.8%, increase in same store revenues,coupled with a $451.8 million increase from net dealership acquisitions during the year. The same store revenueincrease is due to the 3.1% increase in retail unit sales, which increased revenue by $148.7 million, coupled with an$848, or 2.6%, increase in comparative average selling price per unit, which increased revenue by $121.6 million.
Gross Profit
Retail gross profit from new vehicle sales increased $54.5 million, or 11.0%, from 2005 to 2006, and increased$70.0 million, or 16.5%, from 2004 to 2005. The increase from 2005 to 2006 is due to a $3.5 million, or 0.7%,increase in same store gross profit, coupled with a $51.0 million increase from net dealership acquisitions during theyear. The same store retail gross profit increase is due primarily to a $21, or 0.7%, increase in average gross profitper new vehicle retailed. The increase in retail gross profit from 2004 to 2005 is due to a $32.8 million, or 8.3%,increase in same store gross profit, coupled with a $37.2 million increase from net dealership acquisitions during theyear. The same store retail gross profit increase is due to the 3.1% increase in new retail unit sales, which increasedgross profit by $13.0 million, coupled with a $138, or 5.0%, increase in average gross profit per new vehicle retailed,which increased gross profit by $19.8 million.
Used Vehicle Data 2006 2005 Change % Change 2005 2004 Change % Change
2006 vs. 2005 2005 vs. 2004
Used retail unit sales . . . . . . . . . . . . . . 88,723 75,348 13,375 17.8% 75,348 68,995 6,353 9.2%
Same store used retail unit sales . . . . . . . 75,601 72,687 2,914 4.0% 65,882 65,363 519 0.8%
Used retail sales revenue . . . . . . . . . . . $2,546.0 $2,025.5 $ 520.5 25.7% $2,025.5 $1,798.8 $226.7 12.6%
Same store used retail sales revenue . . . . $2,155.0 $1,973.8 $ 181.2 9.2% $1,767.5 $1,693.5 $ 74.0 4.4%
Used retail sales revenue per unit . . . . . . $ 28,696 $ 26,882 $ 1,814 6.7% $ 26,882 $ 26,072 $ 810 3.1%
Same store used retail sales revenue perunit . . . . . . . . . . . . . . . . . . . . . . . . $ 28,505 $ 27,155 $ 1,350 5.0% $ 26,828 $ 25,909 $ 919 3.5%
Gross profit — used . . . . . . . . . . . . . . . $ 215.3 $ 179.9 $ 35.4 19.7% $ 179.9 $ 151.9 $ 28.0 18.4%
Same store gross profit — used . . . . . . . $ 187.1 $ 174.7 $ 12.4 7.1% $ 158.4 $ 144.2 $ 14.2 9.8%
Average gross profit per used vehicleretailed . . . . . . . . . . . . . . . . . . . . . $ 2,427 $ 2,388 $ 39 1.6% $ 2,388 $ 2,202 $ 186 8.4%
Same store average gross profit per usedvehicle retailed . . . . . . . . . . . . . . . . $ 2,474 $ 2,404 $ 70 2.9% $ 2,404 $ 2,206 $ 198 9.0%
Gross margin % — used . . . . . . . . . . . . 8.5% 8.9% (0.4)% (4.5)% 8.9% 8.4% 0.5% 6.0%
Same store gross margin % — used . . . . 8.7% 8.9% (0.2)% (2.2)% 9.0% 8.5% 0.5% 5.9%
Units
Retail unit sales of used vehicles increased 13,375 units, or 17.8%, from 2005 to 2006 and increased6,353 units, or 9.2%, from 2004 to 2005. The increase from 2005 to 2006 is due to a 2,914 unit, or 4.0%, increase insame store used retail unit sales, coupled with a 10,461 unit increase from net dealership acquisitions during theyear. The increase from 2004 to 2005 is due to a 519 unit, or 0.8%, increase in same store used retail unit salescoupled with a 5,834 unit increase from net dealership acquisitions during the year. Same store increases in 2006versus 2005 and 2005 versus 2004 were driven primarily by increases in our premium brands in the U.S. and U.K.,offset somewhat by decreases in our domestic brands in the U.S. and U.K.
Revenues
Used vehicle retail sales revenue increased $520.5 million, or 25.7%, from 2005 to 2006 and increased$226.7 million, or 12.6%, from 2004 to 2005. The increase from 2005 to 2006 is due to a $181.2 million, or 9.2%,increase in same store revenues, coupled with a $339.3 million increase from net dealership acquisitions during theyear. The same store revenue increase is due primarily to a $1,350, or 5.0%, increase in comparative average sellingprice per vehicle, which increased revenue by $98.1 million, coupled with the 4.0% increase in retail unit sales,which increased revenue by $83.1 million. The increase from 2004 to 2005 is due to a $74.0 million, or 4.4%,increase in same store revenues, coupled with a $152.7 million increase from net dealership acquisitions during theyear. The same store revenue increase is due to a $919, or 3.5%, increase in comparative average selling price per
34

unit, which increased revenue by $60.1 million, coupled with the 0.8% increase in retail unit sales, which increasedrevenue by $13.9 million.
Gross Profit
Retail gross profit from used vehicle sales increased $35.4 million, or 19.7%, from 2005 to 2006 and increased$28.0 million, or 18.4%, from 2004 to 2005. The increase from 2005 to 2006 is due to a $12.4 million, or 7.1%,increase in same store gross profit, coupled with a $23.0 million increase from net dealership acquisitions during theyear. The same store gross profit increase from 2005 to 2006 is due to a $70, or 2.9%, increase in average gross profitper used vehicle retailed, which increased gross profit by $5.1 million, coupled with the 4.0% increase in used retailunit sales, which increased gross profit by $7.3 million. The increase in gross margin from 2005 to 2006 includedincreases in our U.S. and U.K. premium brands, offset by decreases in our U.S. and U.K. domestic brands. The samestore increase in retail gross profit from 2004 to 2005 is due to a $14.2 million, or 9.8%, increase in same store grossprofit, coupled with a $13.8 million increase from net dealership acquisitions during the year. The same store grossprofit increase is due to a $198, or 9.0%, increase in average gross profit per used vehicle retailed, which increasedgross profit by $12.9 million, coupled with the 0.8% increase in used retail unit sales, which increased gross profitby $1.3 million. The increase in gross margin from 2004 to 2005 included increases in our U.S. and U.K. premiumbrands, offset somewhat by decreases in our U.S. and U.K. domestic brands.
Finance and Insurance Data
Finance and Insurance Data 2006 2005 Change % Change 2005 2004 Change % Change
2006 vs. 2005 2005 vs. 2004
Total retail unit sales . . . . . . . . . . . . 272,093 243,304 28,789 11.8% 243,304 219,253 24,051 11.0%
Total same store retail unit sales . . . . 238,854 235,920 2,934 1.2% 213,780 208,779 5,001 2.4%
Finance and insurance revenue . . . . . $ 249.6 $ 229.6 $ 20.0 8.7% $ 229.6 $ 200.5 $ 29.1 14.5%
Same store finance and insurancerevenue . . . . . . . . . . . . . . . . . . . $ 226.4 $ 224.6 $ 1.8 0.8% $ 212.1 $ 193.3 $ 18.8 9.7%
Finance and insurance revenue perunit . . . . . . . . . . . . . . . . . . . . . $ 917 $ 944 $ (27) (2.9)% $ 944 $ 915 $ 29 3.2%
Same store finance and insurancerevenue per unit . . . . . . . . . . . . . $ 948 $ 952 $ (4) (0.4)% $ 992 $ 926 $ 66 7.1%
Finance and insurance revenue increased $20.0 million, or 8.7%, from 2005 to 2006 and increased $29.1 mil-lion, or 14.5%, from 2004 to 2005. The increase from 2005 to 2006 is due to a $1.8 million, or 0.8%, increase insame store revenues, coupled with an $18.2 million increase from net dealership acquisitions during the year. Thesame store revenue increase is due to the 1.2% increase in retail unit sales, which increased revenue by $2.7 million,offset by the $4, or 0.4%, decrease in comparative average finance and insurance revenue per unit, which decreasedrevenue by $0.9 million. The $4 decrease in comparative average finance and insurance revenue per unit is due to a$27 reduction in average finance and insurance revenue per unit from our Sirius Satellite Radio promotionarrangement and the $33 per unit included in 2005 relating to the sale of all the remaining variable profits relating toa pool of extended service contracts sold at the company’s dealerships from 2001 through 2005, offset somewhat bya $56 per unit increase in finance and insurance revenue due primarily to increased sales penetration of certainproducts, including in the U.K.
The increase from 2004 to 2005 is due to an $18.8 million, or 9.7%, increase in same store revenues, coupledwith a $10.3 million increase from net dealership acquisitions during the year. The same store revenue increase isdue to a $66, or 7.1%, increase in comparative average finance and insurance revenue per unit, which increasedrevenue by $13.8 million, coupled with the 2.4% increase in retail unit sales, which increased revenue by$5.0 million. Approximately $33 of the $66 per unit increase in comparative average finance and insurance revenueper unit in 2005 was attributable to the sale of all the remaining variable profits relating to the pool of extendedservice contracts discussed above.
35

Service and Parts Data
Service and Parts Data 2006 2005 Change % Change 2005 2004 Change % Change
2006 vs. 2005 2005 vs. 2004
Service and parts revenue . . . . . . . . . . . . . $1,246.3 $1,043.9 $202.4 19.4% $1,043.9 $885.3 $158.6 17.9%
Same store service and parts revenue . . . . . $1,091.6 $1,021.0 $ 70.6 6.9% $ 902.4 $838.9 $ 63.5 7.6%
Gross profit . . . . . . . . . . . . . . . . . . . . . . $ 687.0 $ 569.3 $117.7 20.7% $ 569.3 $477.3 $ 92.0 19.3%
Same store gross profit . . . . . . . . . . . . . . $ 603.0 $ 556.8 $ 46.2 8.3% $ 495.4 $450.6 $ 44.8 9.9%
Gross margin . . . . . . . . . . . . . . . . . . . . . 55.1% 54.5% 0.6% 1.1% 54.5% 53.9% 0.6% 1.1%
Same store gross margin . . . . . . . . . . . . . 55.2% 54.5% 0.7% 1.3% 54.9% 53.7% 1.2% 2.2%
Revenues
Service and parts revenue increased $202.4 million, or 19.4%, from 2005 to 2006 and increased $158.6 million,or 17.9%, from 2004 to 2005. The increase from 2005 to 2006 is due to a $70.6 million, or 6.9%, increase in samestore revenues, coupled with a $131.8 million increase from net dealership acquisitions during the year. Theincrease from 2004 to 2005 is due to a $63.5 million, or 7.6%, increase in same store revenues, coupled with a$95.1 million increase from net dealership acquisitions during the year.
We believe that our service and parts business is being positively impacted by the growth in total retail unitsales at our dealerships in recent years and capacity increases in our service and parts operations resulting from ourfacility improvement and expansion programs.
Gross Profit
Service and parts gross profit increased $117.7 million, or 20.7%, from 2005 to 2006 and increased$92.0 million, or 19.3%, from 2004 to 2005. The increase from 2005 to 2006 is due to a $46.2 million, or8.3%, increase in same store gross profit, coupled with a $71.5 million increase from net dealership acquisitionsduring the year. The same store gross profit increase is due to the $70.6 million, or 6.9%, increase in revenues, whichincreased gross profit by $39.0 million, and a 1.3% increase in gross margin percentage, which increased grossprofit by $7.2 million. The increase from 2004 to 2005 is due to a $44.8 million, or 9.9%, increase in same storegross profit, coupled with a $47.2 million increase from net dealership acquisitions during the year. The same storegross profit increase is due to the $63.5 million, or 7.6%, increase in revenues, which increased gross profit by$34.8 million, and a 2.2% increase in gross margin percentage, which increased gross profit by $10.0 million.
Selling, General and Administrative
Selling, general and administrative or “SG&A” expenses increased $202.3 million, or 17.5%, from 2005 to2006 and increased $178.8 million, or 18.3%, from 2004 to 2005. The aggregate increase from 2005 to 2006 is dueto a $66.2 million, or 5.9%, increase in same store SG&A expenses, coupled with a $136.1 million increase from netdealership acquisitions during the year. The aggregate increase in SG&A expenses from 2004 to 2005 is due to an$87.6 million, or 9.5%, increase in same store SG&A expenses, coupled with a $91.2 million increase from netdealership acquisitions during the year. The increase in same store SG&A expenses is due in large part to(1) increased variable selling expenses, including increases in variable compensation, as a result of the 4.4% and9.3% increase in retail gross profit over the prior year in 2006 and 2005, respectively, (2) increased rent and relatedcosts in both years due in part to our facility improvement and expansion program and (3) increased advertising andpromotion caused by the overall competitiveness of the retail vehicle market. Such increases were offset, in part, in2004 by an $8.4 million refund of U.K. consumption taxes. SG&A expenses as a percentage of total revenue were12.1%, 11.9% and 11.6% in 2006, 2005 and 2004, respectively, and as a percentage of gross profit were 79.6%,78.3% and 77.7% in 2006, 2005 and 2004, respectively.
Depreciation and Amortization
Depreciation and amortization increased $7.3 million, or 19.5%, from 2005 to 2006 and increased $1.2 million,or 3.3%, from 2004 to 2005. The increase from 2005 to 2006 is due to a $3.9 million, or 10.5%, increase in samestore depreciation and amortization, coupled with a $3.4 million increase from net dealership acquisitions during
36

the year. The same store increase is due in large part to our facility improvement and expansion program. Theincrease from 2004 to 2005 is due to a $2.6 million increase from net dealership acquisitions during the year, offsetby a $1.4 million, or 4.0%, decrease in same store depreciation and amortization. The same store decrease is dueprimarily to the effect of costs recognized in 2004 related to the relocation of certain U.K. franchises, offset byincreases due in large part to our facility improvement and expansion program.
Floor Plan Interest Expense
Floor plan interest expense increased $14.5 million, or 30.6%, from 2005 to 2006 and increased $6.2 million,or 15.3%, from 2004 to 2005. The increase from 2005 to 2006 is due to an $8.8 million, or 19.3%, increase in samestore floor plan interest expense, coupled with a $5.7 million increase from net dealership acquisitions during theyear. The increase from 2004 to 2005 is due to a $1.7 million, or 4.4%, increase in same store floor plan interestexpense, coupled with a $4.5 million increase from net dealership acquisitions during the year. Floor plan interestexpense was negatively impacted in both 2006 and 2005 by increases in our weighted average borrowing rate dueprimarily to increases in the underlying variable rates of our revolving floor plan arrangements.
Other Interest Expense
Other interest expense increased $0.2 million, or 0.3%, from 2005 to 2006 and increased $6.1 million, or14.2%, from 2004 to 2005. The increase from 2005 to 2006 is due to an increase in average total outstandingindebtedness in 2006 compared to 2005, offset by a decrease in our weighted average borrowing rate, partially offsetby an increase in the interest on our variable rate indebtedness. The decrease in our weighted average borrowing ratewas due primarily to the issuance of $375.0 million of 3.5% Convertible Senior Subordinated Notes on January 31,2006 which was used to repay higher-rate debt under our credit agreements. The increase from 2004 to 2005 is dueprimarily to an increase in our weighted average borrowing rate during 2005 compared to 2004.
Income Taxes
Income taxes decreased $1.1 million, or 1.5%, from 2005 to 2006 and increased $3.1 million, or 4.6%, from2004 to 2005. The decrease from 2005 to 2006 is due primarily to an increase in pre-tax income being more thanoffset by a reduction in our effective income tax rate due to an increase in the relative proportion of our U.K.operations, which are taxed at a lower rate and tax savings from certain tax planning initiatives. The increase from2004 to 2005 is due primarily to an increase in pre-tax income versus the prior year, offset in part by a reduction inour effective state income tax rate.
Liquidity and Capital Resources
Our cash requirements are primarily for working capital, inventory financing, the acquisition of newdealerships, the improvement and expansion of existing facilities, the construction of new facilities, and dividends.Historically, these cash requirements have been met through cash flow from operations, borrowings under our creditagreements and floor plan arrangements, the issuance of debt securities, sale-leaseback transactions or the issuanceof equity securities. As of December 31, 2006, we had working capital of $533.7 million, including $13.1 million ofcash, available to fund our operations and capital commitments. In addition, we had $600.0 million and£54.8 million ($107.4 million) available for borrowing under our U.S. credit agreement and our U.K. creditagreement, respectively, each of which is discussed below. Effective February 13, 2007, we permanently reducedthe credit availability under the U.S. credit agreement from $600.0 million to $250.0 million and the letter of creditavailability from $50.0 million to $10.0 million. The reduction in capacity under the U.S. credit agreement willenable us to avoid certain credit availability fees specified in the agreement. Giving effect to the reduction, as ofDecember 31, 2006 we would have had approximately $367.0 million available for borrowing under our creditagreements.
On January 26, 2007 we provided notice to the Bank of New York Trust Company, N.A., the trustee of our9.625% Notes, of our intention to redeem the 9.625% Notes on March 15, 2007 at a price of 104.813% for all notesoutstanding. We estimate the aggregate redemption price will be approximately $314.4 million, resulting in a pre-tax charge of approximately $19.0 million.
37

We paid the following dividends in 2005 and 2006:
Per Share Dividends
2005: First Quarter $0.055 2006: First Quarter $0.06
Second Quarter 0.055 Second Quarter 0.07
Third Quarter 0.055 Third Quarter 0.07
Fourth Quarter 0.06 Fourth Quarter 0.07
We have also declared a cash dividend on our common stock of $0.07 cents per share payable on March 1, 2007to shareholders of record on February 12, 2007. Future quarterly or other cash dividends will depend upon ourearnings, capital requirements, financial condition, restrictions on any then existing indebtedness and other factorsconsidered relevant by our Board of Directors.
We have grown primarily through the acquisition of automotive dealerships. We believe that cash flow fromoperations and our existing capital resources, including the liquidity provided by our credit agreements and floorplan financing arrangements, will be sufficient to fund our operations and commitments for at least the next twelvemonths. To the extent we pursue additional significant acquisitions or refinance existing debt, we may need to raiseadditional capital either through the public or private issuance of equity or debt securities or through additionalborrowings. We may not have sufficient availability under our credit agreements to finance significant additionalacquisitions or refinance existing debt. In certain circumstances, a public equity offering could require the priorapproval of certain automobile manufacturers. In connection with any potential significant acquisitions orrefinancings, we may be unable to access the capital markets or increase our borrowing capacity on termsacceptable to us, if at all.
Inventory Financing
We finance substantially all of our new and a portion of our used vehicle inventories under revolving floor planarrangements with various lenders. In the U.S., the floor plan arrangements are due on demand; however, we aregenerally not required to make loan principal repayments prior to the sale of the vehicles that have been financed.We typically make monthly interest payments on the amount financed. Outside of the U.S., substantially all of ourfloor plan arrangements are payable on demand or have an original maturity of 90 days or less and we are generallyrequired to repay floor plan advances at the earlier of the sale of the vehicles that have been financed or the statedmaturity. All of our floor plan agreements grant a security interest in substantially all of the assets of our dealershipsubsidiaries. Interest rates under the floor plan arrangements are variable and increase or decrease based on changesin the prime rate, defined London Interbank Offered Rate (“LIBOR”) or Euro Interbank Offer Rate. We receive non-refundable credits from certain of our vehicle manufacturers, which are treated as a reduction of cost of sales asvehicles are sold.
U.S. Credit Agreement
As of December 31, 2006, our credit agreement with DaimlerChrysler Financial Services Americas LLC andToyota Motor Credit Corporation, as amended, provided for up to $600.0 million in revolving loans for workingcapital, acquisitions, capital expenditures, investments and for other general corporate purposes, and for anadditional $50.0 million of availability for letters of credit, through September 30, 2009. The revolving loans bearinterest between defined LIBOR plus 2.50% and defined LIBOR plus 3.50%. Effective February 13, 2007, wepermanently reduced the credit availability under the U.S. credit agreement from $600.0 million to $250.0 millionand the letter of credit availability from $50.0 million to $10.0 million. The reduction in capacity under theU.S. credit agreement will enable us to avoid certain credit availability fees specified in the agreement.
The U.S. credit agreement is fully and unconditionally guaranteed on a joint and several basis by our domesticsubsidiaries and contains a number of significant covenants that, among other things, restrict our ability to dispose
38
of assets, incur additional indebtedness, repay other indebtedness, pay dividends, create liens on assets, makeinvestments or acquisitions and engage in mergers or consolidations. We are also required to comply with specifiedfinancial and other tests and ratios, each as defined in the U.S. credit agreement, including: a ratio of current assetsto current liabilities, a fixed charge coverage ratio, a ratio of debt to stockholders’ equity, a ratio of debt to earningsbefore income taxes, depreciation and amortization, (“EBITDA”), a ratio of domestic debt to domestic EBITDA,and a measurement of stockholders’ equity. A breach of these requirements would give rise to certain remediesunder the agreement, the most severe of which is the termination of the agreement and acceleration of the amountsowed. As of December 31, 2006 we were in compliance with all covenants under the U.S. credit agreement, and webelieve we will remain in compliance with such covenants for the foreseeable future. In making such determination,we have considered our current margin of compliance with the covenants and our expected future results ofoperations, working capital requirements, acquisitions, capital expenditures and investments. See “ForwardLooking Statements.”
The U.S. credit agreement also contains typical events of default, including change of control, non-payment ofobligations and cross-defaults to our other material indebtedness. Substantially all of our domestic assets notpledged as security under floor plan arrangements are subject to security interests granted to lenders under theU.S. credit agreement. As of December 31, 2006, we had no outstanding borrowings under the U.S. creditagreement. Outstanding letters of credit under the U.S. credit agreement amounted to $12.4 million.
U.K. Credit Agreement
Our agreement with the Royal Bank of Scotland plc, as agent for National Westminster Bank plc (“RBS”),provides a five year multi-option credit agreement, a fixed rate credit agreement and a seasonally adjusted overdraftline of credit (collectively, the “U.K. credit agreement”) to be used to finance acquisitions, working capital, andgeneral corporate purposes. The U.K. credit agreement provides for (1) up to £70.0 million in revolving loansthrough August 31, 2011, which have an original maturity of 90 days or less and bear interest between definedLIBOR plus 0.65% and defined LIBOR plus 1.25%, (2) a £30.0 million funded term loan which bears interestbetween 5.94% and 6.54% and is payable ratably in quarterly intervals commencing on June 30, 2007 throughJune 30, 2011, and (3) a seasonally adjusted overdraft line of credit for up to £30.0 million that bears interest at theBank of England Base Rate plus 1.00% and matures on August 31, 2011.
The U.K. credit agreement is fully and unconditionally guaranteed on a joint and several basis by ourU.K. subsidiaries, and contains a number of significant covenants that, among other things, restrict the ability of ourU.K. subsidiaries to pay dividends, dispose of assets, incur additional indebtedness, repay other indebtedness, paydividends, create liens on assets, make investments or acquisitions and engage in mergers or consolidations. Inaddition, our U.K. subsidiaries are required to comply with specified ratios and tests, each as defined in theU.K. credit agreement, including: a ratio of earnings before interest and taxes plus rental payments to interest plusrental payments (as defined), a measurement of maximum capital expenditures, and a debt to EBITDA ratio (asdefined). A breach of these requirements would give rise to certain remedies under the agreement, the most severeof which is the termination of the agreement and acceleration of the amounts owed. As of December 31, 2006, wewere in compliance with all covenants under the U.K. credit agreement, and we believe that we will remain incompliance with such covenants for the foreseeable future. In making such determination, we considered thecurrent margin of compliance with the covenants and our expected future results of operations, working capitalrequirements, acquisitions, capital expenditures and investments in the U.K.
The U.K. credit agreement also contains typical events of default, including change of control and non-payment of obligations and cross-defaults to other material indebtedness of the U.K. Subsidiaries. Substantially allof our U.K. Subsidiaries’ assets not pledged as security under floor plan arrangements are subject to securityinterests granted to lenders under the U.K. credit agreement. As of December 31, 2006, outstanding loans under theU.K. credit agreement amounted to £60.0 million ($117.5 million).
9.625% Senior Subordinated Notes
We have outstanding $300.0 million aggregate principal amount of 9.625% Senior Subordinated Notes due2012 (the “9.625% Notes”). On January 26, 2007 we provided notice to the Bank of New York Trust Company,
39
N.A., the trustee of the 9.625% Notes, of our intention to redeem the 9.625% Notes on March 15, 2007 at a price of104.813% for all notes outstanding. We estimate the aggregate redemption price will be approximately $314.4 mil-lion, resulting in a pre-tax charge of approximately $19.0 million. The 9.625% Notes are unsecured seniorsubordinated notes and are subordinate to all existing and future senior debt, including debt under our creditagreements and floor plan indebtedness. The 9.625% Notes are guaranteed by substantially all domestic subsid-iaries on a senior subordinated basis. Upon a change of control, each holder of 9.625% Notes would be able torequire us to repurchase all or some of the Notes at a redemption price of 101% of their principal amount. The9.625% Notes also contain customary negative covenants and events of default. As of December 31, 2006, we werein compliance with all negative covenants and there were no events of default.
7.75% Senior Subordinated Notes
On December 4, 2006 we issued $375.0 million aggregate principle amount of 7.75% Senior SubordinatedNotes due 2016 (the “7.75% Notes”). The 7.75% Notes are unsecured senior subordinated notes and are subordinateto all existing and future senior debt, including debt under our credit agreements and floor plan indebtedness. The7.75% Notes are guaranteed by substantially all wholly owned domestic subsidiaries on a senior subordinated basis.We can redeem all or some of the 7.75% Notes at our option beginning in December 2011 at specified redemptionprices, or prior to December 2011 at 100% of the principal amount of the notes plus an applicable “make-whole”premium, as defined. In addition, we may redeem up to 40% of the 7.75% Notes at specified redemption pricesusing the proceeds of certain equity offerings before December 15, 2009. Upon certain sales of assets or specifickinds of changes of control we are required to make an offer to purchase the 7.75% Notes. The 7.75% Notes alsocontain customary negative covenants and events of default. As of December 31, 2006, we were in compliance withall negative covenants and there were no events of default.
We entered into a registration rights agreement with the initial purchasers of the 7.75% Notes under which weagreed to file with the Securities and Exchange Commission a registration statement to allow holders to exchangethe 7.75% Notes for registered notes having substantially the same terms. We will use our commercially reasonableefforts to cause such registration statement to become effective and to complete the exchange offer within 240 daysafter the original issuance of the 7.75% Notes. We will be required to pay additional interest, subject to somelimitations, to the holders of the 7.75% Notes if we fail to comply with these obligations or the registrationstatement ceases to be effective or fails to be usable for certain periods of time, in each case subject to certainexceptions outlined in the registration rights agreement.
3.5% Senior Subordinated Convertible Notes
We have outstanding $375.0 million aggregate principle amount of 3.50% Senior Subordinated ConvertibleNotes due 2026 (the “Convertible Notes”).The Convertible Notes mature on April 1, 2026, unless earlier converted,redeemed or purchased by us. The Convertible Notes are our unsecured senior subordinated obligations and areguaranteed on an unsecured senior subordinated basis by substantially all of our wholly owned domesticsubsidiaries. The Convertible Notes also contain customary negative covenants and events of default. As ofDecember 31, 2006 we were in compliance with all negative covenants and there were no events of default.
Holders may convert based on a conversion rate of 42.2052 shares of our common stock per $1,000 principalamount of the Convertible Notes (which is equal to a conversion price of approximately $23.69 per share), subject toadjustment, only under the following circumstances: (1) in any quarterly period commencing after March 31, 2006,if the closing price of our common stock for twenty of the last thirty trading days in the prior quarter exceeds $28.43(subject to adjustment), (2) for specified periods, if the trading price of the Convertible Notes falls below specificthresholds, (3) if the Convertible Notes are called for redemption, (4) if specified distributions to holders of ourcommon stock are made or specified corporate transactions occur, (5) if a fundamental change (as defined) occurs,or (6) during the ten trading days prior to, but excluding, the maturity date.
Upon conversion of the Convertible Notes, for each $1,000 principal amount of the Convertible Notes, a holderwill receive an amount in cash, in lieu of shares of our common stock, equal to the lesser of (i) $1,000 or (ii) theconversion value, determined in the manner set forth in the indenture for the Convertible Notes, of the number ofshares of our common stock equal to the conversion rate. If the conversion value exceeds $1,000, we will also
40

deliver, at our election, cash, common stock or a combination of cash and common stock with respect to theremaining value deliverable upon conversion.
If a holder elects to convert its Convertible Notes in connection with certain events that constitute a change ofcontrol on or before April 6, 2011, we will pay, to the extent described in the related indenture, a make-wholepremium by increasing the conversion rate applicable to such Convertible Notes. In addition, we will pay contingentinterest in cash, commencing with any six-month period beginning on April 1, 2011, if the average trading price of aConvertible Note for the five trading days ending on the third trading day immediately preceding the first day of thatsix-month period equals 120% or more of the principal amount of the Convertible Note.
On or after April 6, 2011, we may redeem the Convertible Notes, in whole at any time or in part from time totime, for cash at a redemption price of 100% of the principal amount of the Convertible Notes to be redeemed, plusany accrued and unpaid interest to the applicable redemption date. Holders of the Convertible Notes may require usto purchase all or a portion of their Convertible Notes for cash on each of April 1, 2011, April 1, 2016 and April 1,2021 at a purchase price equal to 100% of the principal amount of the Convertible Notes to be purchased, plusaccrued and unpaid interest, if any, to the applicable purchase date.
Share Repurchase
In connection with the issuance of the Convertible Notes discussed above, we repurchased one million sharesof our outstanding common stock on January 26, 2006 for $18.96 million, or $18.955 per share.
Interest Rate Swaps
We are party to an interest rate swap agreement through January 2008, pursuant to which a notional$200.0 million of our U.S. floating rate debt was exchanged for fixed rate debt. The swap was designated as acash flow hedge of future interest payments of LIBOR-based U.S. floor plan borrowings. As of December 31, 2006,we expected approximately $0.8 million associated with the swap to be recognized as a reduction of interestexpense over the next twelve months.
Other Financing Arrangements
We expect to enter into sale-leaseback transactions to finance certain property acquisitions and capitalexpenditures, pursuant to which we sell property and/or leasehold improvements to a third-party and agree to leasethose assets back for a certain period of time. Such sales generate proceeds which vary from period to period.
Off-Balance Sheet Arrangements — 3.5% Convertible Senior Subordinated Notes due 2026
The Convertible Notes are convertible into shares of our common stock, at the option of the holder, based oncertain conditions described above. Certain of these conditions are linked to the market value of our common stock.This type of financing arrangement was selected by us in order to achieve a more favorable interest rate (as opposedto other forms of available financing). Since we or the holders of the Convertible Notes can redeem these notes on orafter April, 2011, a conversion or a redemption of these notes is likely to occur in 2011. The repayment will includecash for the principal amount of the Convertible Notes then outstanding plus an amount payable in either cash orstock, at our option, depending on the trading price of our common stock.
Cash Flows
Cash and cash equivalents increased by $4.2 and $5.2 million during the years ended December 31, 2006 and2004, respectively, and decreased by $14.6 million during the year ended December 31, 2005. The majorcomponents of these changes are discussed below.
Cash Flows from Continuing Operating Activities
Cash provided by operating activities was $120.3 million, $169.4 million and $266.6 million during the yearsended December 31, 2006, 2005 and 2004, respectively. Cash flows from operating activities include net incomeadjusted for non-cash items and the effects of changes in working capital.
41

We finance substantially all of our new and a portion of our used vehicle inventories under revolving floor plannotes payable with various lenders. In accordance with the guidance under SFAS No. 95, “Statement of CashFlows”, we report all cash flows arising in connection with floor plan notes payable to the manufacturer of aparticular new vehicle as an operating activity in our statement of cash flows and all cash flows arising in connectionwith floor plan notes payable to a party other than the manufacturer of a particular new vehicle and all floor plannotes payable relating to pre-owned vehicles as a financing activity in our statement of cash flows. However, webelieve that changes in aggregate floor plan liabilities are typically linked to changes in vehicle inventory and,therefore, are an integral part of understanding changes in our working capital and operating cash flow. Conse-quently, following is a reconciliation of cash flow from operating activities as reported in our condensedconsolidated statement of cash flows as if all changes in vehicle floor plan were classified as an operating activity:
2006 2005 2004
Year Ended December 31,
Net cash from operating activities as reported . . . . . . . . . . . . . . . . . . . . . $120,281 $169,373 $266,592
Floor plan notes payable — non-trade as reported . . . . . . . . . . . . . . . . . . (71,140) 18,445 (58,841)
Net cash from operating activities including all floor plan notespayable . . . . . . . . . . . . . . . . . . . . . . . . . . . . . . . . . . . . . . . . . . . . . . . . $ 49,141 $187,818 $207,751
Cash Flows from Continuing Investing Activities
Cash used in investing activities was $487.9 million, $228.9 million and $273.0 million during the years endedDecember 31, 2006, 2005 and 2004, respectively. Cash flows from investing activities consist primarily of cash usedfor capital expenditures, proceeds from sale-leaseback transactions and net expenditures for dealership acquisi-tions. Capital expenditures were $225.1 million, $220.5 million and $225.6 million during the years endedDecember 31, 2006, 2005 and 2004, respectively. Capital expenditures relate primarily to improvements to ourexisting dealership facilities and the construction of new facilities. Proceeds from sale-leaseback transactions were$106.2 million, $118.5 million and $149.1 million during the years ended December 31, 2006, 2005 and 2004,respectively. Cash used in business acquisitions, net of cash acquired, was $369.1 million, $126.9 million and$210.1 million during the years ended December 31, 2006, 2005 and 2004, respectively and included repayments ofseller’s floor plan notes payable of $113.2 million, $46.0 million and $40.8 million, respectively. Cash flows frominvesting activities include $13.6 million of proceeds received from the sale of an investment during the year endedDecember 31, 2004.
Cash Flows from Continuing Financing Activities
Cash provided by financing activities was $424.5 million and $4.7 million during the years ended Decem-ber 31, 2006 and 2005, respectively, and cash used in financing activities was $22.1 million during the year endedDecember 31, 2004. Cash flows from financing activities include borrowings and repayments of long-term debt, netborrowings or repayments of floor plan notes payable non-trade, proceeds from the issuance of common stock,including proceeds from the exercise of stock options, repurchases of common stock and dividends. During the yearended December 31, 2006 we issued $750.0 million of subordinated debt and we paid $17.2 million of financingcosts. Proceeds of the $750.0 million of subordinated debt issuance were used to repurchase one million shares ofour common stock and to repay debt. This activity, combined with borrowing to fund acquisition and other liquidityrequirements, resulted in net repayments of long-term debt of $211.1 million during the year ended December 31,2006. We had net borrowings of long-term debt of $2.4 million and net repayments of long-term debt of$74.3 million, during the years ended December 31, 2005 and 2004, respectively. We had net repayments offloor plan notes payable non-trade of $71.1 million and $58.8 million during the years ended December 31, 2006and 2004, respectively, and net borrowings of floor plan notes payable non-trade of $18.4 million during the yearended December 31, 2005. During the years ended December 31, 2006, 2005 and 2004, we received proceeds of$18.1 million, $4.7 million and $9.9 million, respectively, from exercises of common stock and during the yearended December 31, 2004 we received proceeds of $119.4 million from the issuance of common stock. During theyears ended December 31, 2006, 2005 and 2004, we paid $25.2 million, $20.8 million and $18.4 million,respectively, of cash dividends to our stockholders.
42

Cash Flows from Discontinued Operations
Cash flows relating to discontinued operations are not currently considered, nor are they expected to beconsidered material to our liquidity or our capital resources. Management does not believe that there is anysignificant past, present or upcoming cash impact as a result of our discontinued operations.
Contractual Payment Obligations
The table below sets forth our best estimates as to the amounts and timing of future payments relating to ourmost significant contractual obligations as of December 31, 2006. The information in the table reflects futureunconditional payments and is based upon, among other things, the terms of any relevant agreements. Future events,including acquisitions, divestitures, entering into new operating lease agreements, the amount of borrowings orrepayments under our credit agreements and floor plan arrangements and purchases or refinancing of our securities,could cause actual payments to differ significantly from these amounts. See “Section 1A — Risk Factors.”
Total 2007 2008 2009 2010 2011 Thereafter
Payments due in
(in millions)
Floorplan Notes Payable(A) . . . . . . . . . . . . . $1,172.3 $1,172.3 $ — $ — $ — $ — $ —
U.S. Credit Agreement(B) . . . . . . . . . . . . . . — — — — — — —
U.K. Credit Agreement . . . . . . . . . . . . . . . . 117.5 10.3 13.8 13.8 13.7 65.9 —
9.625% Senior Subordinated Notes(C) . . . . . . 300.0 — — — — — 300.0
7.75% Senior Subordinated Notes . . . . . . . . . 375.0 — — — — — 375.0
3.5% Convertible Senior Subordinated
Notes(D) . . . . . . . . . . . . . . . . . . . . . . . . . . 375.0 — — — — — 375.0
Other Debt . . . . . . . . . . . . . . . . . . . . . . . . . 14.5 3.1 10.7 0.2 0.5 — —
Mandatory Minority Interest Repurchase . . . . 4.0 — 4.0 — — — —
Scheduled Interest Payments(E) . . . . . . . . . . 706.6 71.3 71.9 71.1 71.2 71.0 350.1
Operating Lease Commitments . . . . . . . . . . . 3,970.1 164.4 160.7 158.2 157.2 155.9 3,173.7
$7,035.0 $1,421.4 $261.1 $243.3 $242.6 $292.8 $4,573.8
(A) Floor plan notes payable are revolving financing arrangements. Payments are generally made as requiredpursuant to the floor plan borrowing agreements.
(B) Effective February 13, 2007, we permanently reduced the credit availability under the U.S. Credit Agreementfrom $600.0 million to $250.0 million and the letter of credit availability from $50.0 million to $10.0 million.No amounts were outstanding under this facility as of December 31, 2006.
(C) We have announced our intention to redeem the aggregate principal amount of our 9.625% senior subordinatednotes on March 15, 2007 at a cost of approximately $314.4 million.
(D) Interest and principal repayments payments under our $375.0 million of 3.5% senior subordinated notes due2026 are reflected in the table above, however, at our option, certain of these amounts may be settled by inshares of common stock. While these notes are not due until 2026, in 2011 the holders may require us topurchase all or a portion of their notes for cash. This acceleration of ultimate repayment is not reflected in thetable above, nor is any optional redemption on our part.
(E) Estimates of future variable rate interest payments under floorplan notes payable and our credit agreements areexcluded. See “Inventory Financing,” “U.S. Credit Agreement”, and “U.K. Credit Agreement” above for adiscussion of such variable rates.
We expect that the amounts above will be funded through cash flow from operations. In the case of balloonpayments at the end of the terms of our debt instruments, we expect to be able to refinance such instruments in thenormal course of business.
43

Commitments
We are party to a joint venture agreement with respect to one of the Company’s franchises pursuant to whichwe are required to repurchase our partner’s interest in July 2008. We expect this payment to be approximately$4.0 million.
Related Party Transactions
Stockholders Agreement
Roger S. Penske, our Chairman of the Board and Chief Executive Officer, is also Chairman of the Board andChief Executive Officer of Penske Corporation, and through entities affiliated with Penske Corporation, our largeststockholder owning approximately 40% of our outstanding common stock. Mitsui & Co., Ltd. and Mitsui & Co.(USA), Inc. (collectively, “Mitsui”) own approximately 16% of our outstanding common stock. Mitsui, PenskeCorporation and certain other affiliates of Penske Corporation are parties to a stockholders agreement pursuant towhich the Penske affiliated companies agreed to vote their shares for one director who is a representative of Mitsui.In turn, Mitsui agreed to vote their shares for up to fourteen directors voted for by the Penske affiliated companies.This agreement terminates in March 2014, upon the mutual consent of the parties, or when either party no longerowns any of our common stock.
Other Related Party Interests and Transactions
Several of our directors and officers are affiliated with Penske Corporation or related entities. Roger S. Penskeis also a managing member of Penske Capital Partners and Transportation Resource Partners, organizations thatundertake investments in transportation-related industries. Richard J. Peters, one of our directors, is a managingdirector of Transportation Resource Partners. Mr. Peters and Roger S. Penske, Jr., our President, are each directorsof Penske Corporation. Eustace W. Mita and Lucio A. Noto (two of our directors) are investors in TransportationResource Partners. One of our directors, Hiroshi Ishikawa, serves as our Executive Vice President — InternationalBusiness Development and serves in a similar capacity for Penske Corporation. Robert H. Kurnick, Jr., our ViceChairman, is also the President and a director of Penske Corporation and Paul F. Walters, our Executive VicePresident — Human Resources serves in a similar human resources capacity for Penske Corporation.
We are currently a tenant under a number of non-cancelable lease agreements with Automotive Group Realty,LLC and its subsidiaries (together “AGR”), which are subsidiaries of Penske Corporation. From time to time, wemay sell AGR real property and improvements that are subsequently leased by AGR to us. In addition, we maypurchase real property or improvements from AGR which, in some instances, occur via the purchase of the equityinterest of a corporate entity. Each of these transactions is valued at a price that is independently confirmed. Wesometimes pay to and/or receive fees from Penske Corporation and its affiliates for services rendered in the normalcourse of business, or to reimburse payments made to third parties on each others’ behalf. These transactions andthose relating to AGR mentioned above, are reviewed periodically by our Audit Committee and reflect theprovider’s cost or an amount mutually agreed upon by both parties.
We and Penske Corporation have entered into a joint insurance agreement which provides that, with respect toour joint insurance policies (which includes our property policy), available coverage with respect to a loss shall bepaid to each party as stipulated in the policies. In the event of losses by us and Penske Corporation in excess of thelimit of any policy during a policy period, the total policy proceeds shall be allocated based on the ratio of premiumspaid.
We have entered into joint ventures with certain related parties as more fully discussed below.
Joint Venture Relationships
From time to time, we enter into joint venture relationships in the ordinary course of business, through whichwe acquire dealerships together with other investors. We may provide these dealerships with working capital and
44

other debt financing at costs that are based on our incremental borrowing rate. As of December 31, 2006, our jointventure relationships were as follows:
Location DealershipsOwnership
Interest
Fairfield, Connecticut. . . . . . . . . . . . . . . . . . Audi, Mercedes-Benz, Porsche 91.70%(A)(B)
Edison, New Jersey . . . . . . . . . . . . . . . . . . . Ferrari, Maserati 70.00%(B)
Tysons Corner, Virginia . . . . . . . . . . . . . . . . Aston Martin, Audi, Maybach, 90.00%(B)(C)
Mercedes-Benz, Porsche
Las Vegas, Nevada. . . . . . . . . . . . . . . . . . . . Ferrari, Maserati 50.00%(D)Mentor, Ohio . . . . . . . . . . . . . . . . . . . . . . . . Honda 75.00%(B)
Munich, Germany . . . . . . . . . . . . . . . . . . . . BMW, MINI 50.00%(D)
Frankfurt, Germany . . . . . . . . . . . . . . . . . . . Lexus, Toyota 50.00%(D)
Aachen, Germany . . . . . . . . . . . . . . . . . . . . Audi, Lexus, Toyota, Volkswagen 50.00%(D)
Mexico . . . . . . . . . . . . . . . . . . . . . . . . . . . . Toyota 48.70%(D)
Mexico . . . . . . . . . . . . . . . . . . . . . . . . . . . . Toyota 45.00%(D)
(A) An entity controlled by one of our directors, Lucio A. Noto (the “Investor”), owns an 8.3% interest in this jointventure, which entitles the Investor to 20% of the operating profits of the dealerships owned by the jointventure. In addition, the Investor has an option to purchase up to a 20% interest in the joint venture for specifiedamounts.
(B) Entity is consolidated in our financial statements.
(C) Roger S. Penske, Jr. owns a 10% interest in this joint venture.
(D) Entity is accounted for using the equity method of accounting.
Cyclicality
Unit sales of motor vehicles, particularly new vehicles, historically have been cyclical, fluctuating with generaleconomic cycles. During economic downturns, the automotive retailing industry tends to experience periods ofdecline and recession similar to those experienced by the general economy. We believe that the industry isinfluenced by general economic conditions and particularly by consumer confidence, the level of personaldiscretionary spending, fuel prices, interest rates and credit availability.
Seasonality
Our business is modestly seasonal overall. Our U.S. operations generally experience higher volumes of vehiclesales in the second and third quarters of each year due in part to consumer buying trends and the introduction of newvehicle models. Also, demand for cars and light trucks is generally lower during the winter months than in otherseasons, particularly in regions of the United States where dealerships may be subject to severe winters. The greatestU.S. seasonality exists at the dealerships we operate in northeastern and upper mid-western states, for which thesecond and third quarters are the strongest with respect to vehicle-related sales. Our U.K. operations generallyexperience higher volumes of vehicle sales in the first and third quarters of each year, due primarily to vehicleregistration practices in the U.K. The service and parts business at all dealerships experiences relatively modestseasonal fluctuations.
Effects of Inflation
We believe that inflation rates over the last few years have not had a significant impact on revenues orprofitability. We do not expect inflation to have any near-term material effects on the sale of our products andservices, however, we cannot be sure there will be no such effect in the future.
45

We finance substantially all of our inventory through various revolving floor plan arrangements with interestrates that vary based on the prime rate, LIBOR or Euro Interbank Offer Rate. Such rates have historically increasedduring periods of increasing inflation.
Forward-Looking Statements
This annual report on Form 10-K contains “forward-looking statements” within the meaning of Section 27A ofthe Securities Act of 1933, as amended, and Section 21E of the Securities Exchange Act of 1934, as amended.Forward-looking statements generally can be identified by the use of terms such as “may,” “will,” “should,”“expect,” “anticipate,” “believe,” “intend,” “plan,” “estimate,” “predict,” “potential,” “forecast,” “continue” orvariations of such terms, or the use of these terms in the negative. Forward-looking statements include statementsregarding our current plans, forecasts, estimates, beliefs or expectations, including, without limitation, statementswith respect to:
• our future financial performance;
• future acquisitions;
• future capital expenditures;
• our ability to obtain cost savings and synergies;
• our ability to respond to economic cycles;
• trends in the automotive retail industry and in the general economy in the various countries in which weoperate dealerships;
• our ability to access the remaining availability under our credit agreements;
• our liquidity;
• interest rates;
• trends affecting our future financial condition or results of operations; and
• our business strategy.
Forward-looking statements involve known and unknown risks and uncertainties and are not assurances offuture performance. Actual results may differ materially from anticipated results due to a variety of factors,including the factors identified under “Item 1A. — Risk Factors”. Important factors that could cause actual resultsto differ materially from our expectations include those mentioned in “Item 1A. — Risk Factors” such as thefollowing:
• the ability of automobile manufacturers to exercise significant control over our operations, since we dependon them in order to operate our business;
• because we depend on the success and popularity of the brands we sell, adverse conditions affecting one ormore automobile manufacturers may negatively impact our revenues and profitability;
• we may not be able to satisfy our capital requirements for acquisitions, dealership renovation projects orfinancing the purchase of our inventory;
• our failure to meet a manufacturer’s consumer satisfaction requirements may adversely affect our ability toacquire new dealerships, our ability to obtain incentive payments from manufacturers and our profitability;
• automobile manufacturers may impose limits on our ability to issue additional equity and on the ownershipof our common stock by third parties, which may hamper our ability to meet our financing needs;
• our business and the automotive retail industry in general are susceptible to adverse economic conditions,including changes in interest rates, consumer confidence, fuel prices and credit availability;
• substantial competition in automotive sales and services may adversely affect our profitability;
46

• if we lose key personnel, especially our Chief Executive Officer, or are unable to attract additional qualifiedpersonnel, our business could be adversely affected;
• our quarterly operating results may fluctuate due to seasonality in the automotive retail business and otherfactors;
• because most customers finance the cost of purchasing a vehicle, higher interest rates may adversely affectour vehicle sales;
• our business may be adversely affected by import product restrictions and foreign trade risks that may impairour ability to sell foreign vehicles profitably;
• our automobile dealerships are subject to substantial regulations which may adversely affect ourprofitability;
• if state dealer laws in the United States are repealed or weakened, our automotive dealerships may be subjectto increased competition and may be more susceptible to termination, non-renewal or renegotiation of theirfranchise agreements;
• our U.K. dealerships are not afforded the same legal franchise protections as those in the U.S. so we could besubject to additional competition from other local dealerships in the U.K.;
• our automotive dealerships are subject to environmental regulations that may result in claims and liabilities;
• our dealership operations may be affected by severe weather or other periodic business interruptions;
• our principal stockholders have substantial influence over us and may make decisions with which otherstockholders may disagree;
• some of our directors and officers may have conflicts of interest with respect to certain related partytransactions and other business interests;
• our level of indebtedness may limit our ability to obtain financing for acquisitions and may require that asignificant portion of our cash flow be used for debt service;
• we may be involved in legal proceedings that could have a material adverse effect on our business;
• our operations outside of the United States subject our profitability to fluctuations relating to changes inforeign currency valuations;
• we are a holding company and, as a result, must rely on the receipt of payments from our subsidiaries, whichare subject to limitations, in order to meet our cash needs and service our indebtedness;
• the price of our common stock is subject to substantial fluctuation, which may be unrelated to ourperformance; and
• shares eligible for future sale, or issuable under the terms of our convertible notes, may cause the marketprice of our common stock to drop significantly, even if our business is doing well.
We urge you to carefully consider these risk factors in evaluating all forward-looking statements regarding ourbusiness. Readers of this report are cautioned not to place undue reliance on the forward-looking statementscontained in this report. All forward-looking statements attributable to us are qualified in their entirety by thiscautionary statement. Except to the extent required by the federal securities laws and SEC rules and regulations, wehave no intention or obligation to update publicly any forward-looking statements whether as a result of newinformation, future events or otherwise.
Item 7A. Quantitative and Qualitative Disclosures About Market Risk
Interest Rates. We are exposed to market risk from changes in the interest rates on a significant portion of ouroutstanding indebtedness. Certain balances under our credit agreements bear interest at variable rates based on amargin over defined benchmarks. Based on the amount outstanding as of December 31, 2006, a 100 basis pointchange in interest rates would result in an approximate $0.7 million change to our annual interest expense.
47

Similarly, amounts outstanding under floor plan financing arrangements bear interest at a variable rate based on amargin over defined benchmarks. We continually evaluate our exposure to interest rate fluctuations and followestablished policies and procedures to implement strategies designed to manage the amount of variable rateindebtedness outstanding at any point in time in an effort to mitigate the effect of interest rate fluctuations on ourearnings and cash flows. We are currently party to a swap agreement pursuant to which a notional $200.0 million ofour floating rate floor plan debt was exchanged for fixed rate debt through January 2008. Based on an average of theaggregate amounts outstanding under our floor plan financing arrangements subject to variable interest paymentsduring the year ended December 31, 2006, a 100 basis point change in interest rates would result in an approximate$10.0 million change to our annual interest expense.
Interest rate fluctuations affect the fair market value of our swaps and fixed rate debt, including the9.625% Notes, the 7.75% Notes, the Convertible Notes and certain seller financed promissory notes, but, withrespect to such fixed rate debt instruments, do not impact our earnings or cash flows.
Foreign Currency Exchange Rates. As of December 31, 2006, we had dealership operations in the U.K. andGermany. In each of these markets, the local currency is the functional currency. Due to our intent to remainpermanently invested in these foreign markets, we do not hedge against foreign currency fluctuations. In the eventwe change our intent with respect to the investment in any of our international operations, we would expect toimplement strategies designed to manage those risks in an effort to mitigate the effect of foreign currencyfluctuations on our earnings and cash flows. A ten percent change in average exchange rates versus the U.S. Dollarwould have resulted in an approximate $360.1 million change to our revenues for the year ended December 31,2006.
In common with other automotive retailers, we purchase certain of our new vehicle and parts inventories fromforeign manufacturers. Although we purchase the majority of our inventories in the local functional currency, ourbusiness is subject to certain risks, including, but not limited to, differing economic conditions, changes in politicalclimate, differing tax structures, other regulations and restrictions and foreign exchange rate volatility which mayinfluence such manufacturers’ ability to provide their products at competitive prices in the local jurisdictions. Ourfuture results could be materially and adversely impacted by changes in these or other factors.
Item 8. Financial Statements and Supplementary Data
The consolidated financial statements listed in the accompanying Index to Consolidated Financial Statementsare incorporated by reference into this Item 8.
Item 9. Changes In and Disagreements With Accountants on Accounting and Financial Disclosure
None.
Item 9A. Controls and Procedures
Under the supervision and with the participation of our management, including the principal executive andfinancial officers, we conducted an evaluation of the effectiveness of our disclosure controls and procedures (assuch term is defined in Rules 13a-15(e) and 15d-15(e) under the Securities Exchange Act of 1934, as amended (the“Exchange Act”)), as of December 31, 2006. Our disclosure controls and procedures are designed to ensure thatinformation required to be disclosed by us in the reports we file under the Exchange Act is recorded, processed,summarized and reported within the time periods specified in the SEC’s rules and forms, and that such informationis accumulated and communicated to management, including our principal executive and financial officers, to allowtimely discussions regarding required disclosure.
Based upon this evaluation, the Company’s principal executive and financial officers concluded that ourdisclosure controls and procedures were effective as of December 31, 2006. In addition, we maintain internalcontrols designed to provide us with the information required for accounting and financial reporting purposes.There were no changes in our internal control over financial reporting that occurred during our fourth quarter of2006 that materially affected, or are reasonably likely to materially affect, our internal control over financialreporting.
48

Item 9B. Other Information
Not applicable.
PART III
The information required by Items 10 through 14 is included in the Company’s definitive proxy statementunder the captions “Election of Directors,” “Executive Officers,” “Compensation Discussion and Analysis,”“Executive and Directors Compensation”, “Security Ownership of Certain Beneficial Owners and Management,”“Independent Registered Public Accounting Firms,” “Related Party Transactions,” “Other Matters” and “OurCorporate Governance.” Such information is incorporated herein by reference.
49
PART IV
Item 15. Exhibits and Financial Statement Schedules
(1) Financial Statements
The consolidated financial statements listed in the accompanying Index to Consolidated Financial Statementsare filed as part of this Annual Report on Form 10-K.
(2) Financial Statement Schedules — Schedule II — Valuation and Qualifying Accounts.
(3) Exhibits — See the Index of Exhibits following this item.
50

SIGNATURES
Pursuant to the requirements of Section 13 or 15(d) of the Securities Exchange Act of 1934, the registrant hasduly caused this report to be signed on its behalf by the undersigned, thereunto duly authorized on February 28,2007.
UNITED AUTO GROUP, INC.
By: /s/ ROGER S. PENSKE
Roger S. PenskeChairman of the Board and
Chief Executive Officer
Pursuant to the requirements of the Securities Exchange Act of 1934, this report has been signed below byfollowing persons on behalf of the registrant and in the capacities and on the date indicated.
Signature Title Date
/s/ ROGER S. PENSKE
Roger S. Penske
Chairman of the Board andChief Executive Officer
(Principal Executive Officer)
February 28, 2007
/s/ ROBERT T. O’SHAUGHNESSY
Robert T. O’Shaughnessy
Executive Vice President — Financeand Chief Financial Officer
(Principal Financial and AccountingOfficer)
February 28, 2007
/s/ JOHN D. BARR
John D. Barr
Director February 28, 2007
/s/ MICHAEL R. EISENSON
Michael R. EisensonDirector February 28, 2007
/s/ HIROSHI ISHIKAWA
Hiroshi Ishikawa
Director February 28, 2007
/s/ ROBERT H. KURNICK, JR.
Robert H. Kurnick, Jr.
Director February 28, 2007
/s/ WILLIAM J. LOVEJOY
William J. Lovejoy
Director February 28, 2007
/s/ KIMBERLY J. MCWATERS
Kimberly J. McWaters
Director February 28, 2007
/s/ EUSTACE W. MITA
Eustace W. Mita
Director February 28, 2007
/s/ LUCIO A. NOTO
Lucio A. Noto
Director February 28, 2007
51
Signature Title Date
/s/ RICHARD J. PETERS
Richard J. PetersDirector February 28, 2007
/s/ RONALD G. STEINHART
Ronald G. Steinhart
Director February 28, 2007
/s/ H. BRIAN THOMPSON
H. Brian Thompson
Director February 28, 2007
52

INDEX OF EXHIBITS
Each management contract or compensatory plan or arrangement is identified with an asterisk.
3.1 Certificate of Incorporation (incorporated by reference to exhibit 3.2 to our Form 10-Q filed on May 10,2006).
3.2 Bylaws (incorporated by reference to exhibit 3.2 to our Form 8-K filed on March 13, 2006).
4.1.1 Indenture regarding our 95⁄8% senior subordinated notes due 2012 dated as of March 18, 2002 among us,as Issuer, and certain of our domestic subsidiaries, as Guarantors, and The Bank of New York TrustCompany, N.A., as Trustee (incorporated by reference to exhibit 4.3 to our registration statement onForm S-4, registration no. 333-87452, filed May 2, 2002).
4.1.2 Amended and Restated Supplemental Indenture dated as of May 5, 2006 among us, as Issuer, and certainof our domestic subsidiaries, as Guarantors, and The Bank of New York Trust Company, N.A., asTrustee (incorporated by reference to exhibit 4.2 to our Form 10-Q filed May 10, 2006).
4.2.1 Indenture regarding our 3.5% senior subordinated convertible notes due 2026, dated January 31, 2006,by and among us, as Issuer, the subsidiary guarantors named therein and The Bank of New York TrustCompany, N.A., as trustee (incorporated by reference to exhibit 4.1 to our Form 8-K filed February 2,2006).
4.2.2 Supplemental Indenture regarding our 3.5% senior subordinated convertible notes due 2026 dated as ofMay 5, 2006, among us, as Issuer, and certain of our domestic subsidiaries, as Guarantors, and The Bankof New York Trust Company, N.A., as trustee. (incorporated by reference to exhibit 4.2 to our Form 10-Qfiled May 10, 2006).
4.3.1 Indenture regarding our 7.75% senior subordinated notes due 2016 dated December 7, 2006, by andamong us as Issuer, the subsidiary guarantors named therein and The Bank of New York Trust Company,N.A., as trustee (incorporated by reference to exhibit 4.1 to our current report on Form 8-K filed onDecember 12, 2006).
4.3.2 Registration Rights Agreement, dated December 7, 2006, by and among us, the subsidiary guarantorsnamed therein, J.P. Morgan Securities Inc., Banc of America Securities LLC, Merrill Lynch, Pierce,Fenner & Smith Incorporated and Wachovia Capital Markets, LLC, relating to the 7.75% seniorsubordinated notes due 2016 (incorporated by reference to exhibit 4.3 to our current report on Form 8-Kfiled on December 12, 2006).
4.4.1 Second Amended and Restated Credit Agreement, dated as of September 8, 2004, among us,DaimlerChrysler Financial Services Americas LLC and Toyota Motor Credit Corporation(incorporated by reference to our September 8, 2004 Form 8-K).
4.4.2 Second Amended and Restated Security Agreement dated as of September 8, 2004 among us,DaimlerChrysler Financial Services Americas LLC and Toyota Motor Credit Corporation(incorporated by reference to Exhibit 10.2 to our September 8, 2004 Form 8-K).
4.4.3 Extension Notice dated September 26, 2006 relating to Second Amended and Restated CreditAgreement, dated as of September 8, 2004, among us, DaimlerChrysler Financial ServicesAmericas LLC and Toyota Motor Credit Corporation (incorporated by reference to exhibit 4.1 toour Form 8-K filed on September 27, 2006).
4.4.4 First amendment dated April 18, 2006 to the Second Amended and Restated Credit Agreement datedSeptember 8, 2004 by and among us, DaimlerChrysler Financial Services Americas LLC and ToyotaMotor Credit Corporation (incorporated by reference from exhibit 4.1 to our 8-K filed April 18, 2006).
4.4.5 Second amendment dated May 9, 2006 to the Second Amended and Restated Credit Agreement datedSeptember 8, 2004 by and among us, DaimlerChrysler Financial Services Americas LLC and ToyotaMotor Credit Corporation (incorporated by reference from exhibit 4.4 to our 10-Q filed May 10, 2006).
4.4.6 Third amendment dated August 8, 2006 to the Second Amended and Restated Credit Agreement datedSeptember 8, 2004 by and among us, DaimlerChrysler Financial Services Americas LLC and ToyotaMotor Credit Corporation (incorporated by reference to exhibit 4.1 to our Form 10-Q filed on August 9,2006).
4.5.1 Multi-Option Credit Agreement dated as of August 31, 2006 between Sytner Group Limited and TheRoyal Bank of Scotland, plc, as agent for National Westminster Bank Plc. (incorporated by reference toexhibit 4.1 to our Form 8-K filed on September 5, 2006).
53

4.5.2 Fixed Rate Credit Agreement dated as of August 31, 2006 between Sytner Group Limited and The RoyalBank of Scotland, plc, as agent for National Westminster Bank Plc. (incorporated by reference toexhibit 4.2 to our Form 8-K filed on September 5, 2006).
4.5.3 Seasonally Adjusted Overdraft Agreement dated as of August 31, 2006 between Sytner Group Limitedand The Royal Bank of Scotland, plc, as agent for National Westminster Bank Plc. (incorporated byreference to exhibit 4.3 to our Form 8-K filed on September 5, 2006).
10.1 Form of Dealer Agreement with Honda Automobile Division, American Honda Motor Co.(incorporated by reference to exhibit 10.2.3 to our 2001 Form 10-K).
10.2 Form of Car Center Agreement with BMW of North America, Inc. (incorporated by reference toexhibit 10.2.5 to our 2001 Form 10-K).
10.3 Form of SAV Center Agreement with BMW of North America, Inc. (incorporated by reference toexhibit 10.2.6 to our 2001 Form 10-K).
10.4 Form of Dealer Agreement with Toyota Motor Company (incorporated by reference to exhibit 10.2.7 toour 2001 Form 10-K).
10.5 Form of Mercedes-Benz USA, Inc. Passenger and Car Retailer Agreement (incorporated by reference toexhibit 10.2.11 to our Form 10-Q for the quarter ended March 31, 2000).
10.6 Form of Mercedes-Benz USA, Inc. Light Truck Retailer Agreement (incorporated by reference toexhibit 10.2.12 to our Form 10-Q for the quarter ended March 31, 2000).
*10.7 United Auto Group, Inc. Amended and Restated Stock Option Plan dated as of December 10, 2003(incorporated by reference to our 2003 10-K filed March 15, 2004).
*10.8 Amended and Restated United Auto Group, Inc. 2002 Equity Compensation Plan (incorporated byreference to our 2003 10-K filed March 15, 2004).
*10.9 Form of Restricted Stock Agreement (incorporated by reference to exhibit 10.3 to our Form 10-Q for thequarter ended June 30, 2003).
*10.10 Amended and Restated United Auto Group, Inc. Non-Employee Director Compensation Plan(incorporated by reference to our 10-Q filed August 9, 2004).
*10.11 United Auto Group, Inc. Management Incentive Plan (effective July 1, 2003) (incorporated by referenceto exhibit 10.1 to our Quarterly Report on Form 10-Q for the quarter ended September 30, 2003).
10.12.1 First Amended and Restated Limited Liability Company Agreement dated April 1, 2003 between UAGConnecticut I, LLC and Noto Holdings, LLC (incorporated by reference to exhibit 10.3 to our Form 10-Qfiled May 15, 2003).
10.12.2 Letter Agreement dated April 1, 2003 among UAG Connecticut I, LLC, Noto Holdings, LLC and theother parties named therein (incorporated by reference to exhibit 10.4 to our Form 10-Q filed May 15,2003.
10.12.3 Letter Agreement dated April 1, 2003 between UAG Connecticut I, LLC and Noto Holdings, LLC(incorporated by reference to exhibit 10.5 to our Form 10-Q filed May 15, 2003).
10.13 Registration Rights Agreement among us and Penske Automotive Holdings Corp. dated as ofDecember 22, 2000 (incorporated by reference to exhibit 10.26.1 to our Form 10-K filed February 6,2002.
10.14 Second Amended and Restated Registration Rights Agreement among us, Mitsui & Co., Ltd. andMitsui & Co. (U.S.A.), Inc. dated as of March 26, 2004 (incorporated by reference to the exhibit 10.2 toour March 26, 2004 Form 8-K).
10.15 Letter Agreement among Penske Corporation, Penske Capital Partners, L.L.C., Penske AutomotiveHoldings Corp., International Motor Cars Group I, L.L.C., Mitsui & Co., Ltd. and Mitsui & Co.(U.S.A.), Inc. dated April 4, 2003 (incorporated by reference to exhibit 5 to the Schedule 13D filed byMitsui on April 10, 2003).
10.16 Purchase Agreement by and between Mitsui & Co., Ltd., Mitsui & Co. (U.S.A.), Inc., InternationalMotor Cars Group I, L.L.C., International Motor Cars Group II, L.L.C., Penske Corporation, PenskeAutomotive Holdings Corp, and United Auto Group, Inc. (incorporated by reference to exhibit 10.1 toour Form 8-K filed on February 17, 2004).
54

10.17 HBL, LLC Limited Liability Company Agreement dated December 31, 2001, between H.B.L.Holdings, Inc. and Roger S. Penske, Jr. (incorporated by reference to exhibit 10.28.1 to registrationstatement no. 333-82264 filed February 6, 2002).
10.18 Stockholders Agreement among International Motor Cars Group II, L.L.C., Penske AutomotiveHoldings Corp., Penske Corporation and Mitsui & Co., Ltd. and Mitsui & Co. (USA), Inc. dated asof March 26, 2004 (incorporated by reference to exhibit 10.1 to our March 26, 2004 Form 8-K).
10.19 VMC Holding Corporation Stockholders’ Agreement dated April 28, 2005 among VMC HoldingCorporation, U.S., Transportation Resource Partners, LP., Penske Truck Leasing Co. LLP., and OpusVentures General Partners Limited (incorporated by reference to exhibit 10.1 to our Form 10-Q filed onMay 5, 2005).
10.20 Management Services Agreement dated April 28, 2005 among VMC Acquisition Corporation,Transportation Resource Advisors LLC., Penske Truck Leasing Co. L.P. and Opus Ventures GeneralPartner Limited (incorporated by reference to exhibit 10.1 to our Form 10-Q filed on May 5, 2005).
10.21 Joint Insurance Agreement dated August 7, 2006 between us and Penske Corporation (incorporated byreference to exhibit 10.1 to our Form 10-Q filed August 9, 2006).
12 Computation of Ratio of Earnings to Fixed Charges.
21 Subsidiary List
23.1 Consent of Deloitte & Touche LLP.
23.2 Consent of KPMG Audit Plc.
31.1 Rule 13(a)-14(a)/15(d)-14(a) Certification.
31.2 Rule 13(a)-14(a)/15(d)-14(a) Certification.
32 Section 1350 Certifications.
55

INDEX TO CONSOLIDATED FINANCIAL STATEMENTS
UNITED AUTO GROUP, INCAs of December 31, 2006 and 2005 and For the Years Ended
December 31, 2006, 2005 and 2004
Management Reports on Internal Control Over Financial Reporting. . . . . . . . . . . . . . . . . . . . . . . . . . . . F-2
Reports of Independent Registered Public Accounting Firms . . . . . . . . . . . . . . . . . . . . . . . . . . . . . . . . . F-3
Consolidated Balance Sheets . . . . . . . . . . . . . . . . . . . . . . . . . . . . . . . . . . . . . . . . . . . . . . . . . . . . . . . . F-8
Consolidated Statements of Income . . . . . . . . . . . . . . . . . . . . . . . . . . . . . . . . . . . . . . . . . . . . . . . . . . . F-9
Consolidated Statements of Stockholders’ Equity and Comprehensive Income (Loss) . . . . . . . . . . . . . . . F-10
Consolidated Statements of Cash Flows . . . . . . . . . . . . . . . . . . . . . . . . . . . . . . . . . . . . . . . . . . . . . . . . F-11
Notes to Consolidated Financial Statements . . . . . . . . . . . . . . . . . . . . . . . . . . . . . . . . . . . . . . . . . . . . . F-12
F-1

MANAGEMENT REPORT ON INTERNAL CONTROL OVER FINANCIAL REPORTING
The management of United Auto Group, Inc. and subsidiaries (the “Company”) is responsible for establishingand maintaining adequate internal control over financial reporting. The Company’s internal control system wasdesigned to provide reasonable assurance to the Company’s management and board of directors that the Company’sinternal control over financial reporting provides reasonable assurance regarding the reliability of financialreporting and the preparation and presentation of financial statements for external purposes in accordance withaccounting principles generally accepted in the United States of America.
All internal control systems, no matter how well designed, have inherent limitations. Therefore, even thosesystems determined to be effective can provide only reasonable assurance with respect to financial statementpreparation and presentation.
Management assessed the effectiveness of the Company’s internal control over financial reporting as ofDecember 31, 2006. In making this assessment, it used the criteria set forth by the Committee of SponsoringOrganizations of the Treadway Commission in Internal Control — Integrated Framework. Based on our assessmentwe believe that, as of December 31, 2006, the Company’s internal control over financial reporting is effective basedon those criteria.
The Company’s independent registered public accounting firm that audited the consolidated financialstatements included in the Company’s Annual Report on Form 10-K has issued an audit report on our assessmentof the Company’s internal control over financial reporting. This report appears on page F-3.
United Auto Group, Inc.February 28, 2007
MANAGEMENT REPORT ON INTERNAL CONTROL OVER FINANCIAL REPORTING
The management of UAG UK Holdings Limited and subsidiaries (the “Company”) is responsible forestablishing and maintaining adequate internal control over financial reporting. The Company’s internal controlsystem was designed to provide reasonable assurance to the Company’s management and board of directors that theCompany’s internal control over financial reporting provides reasonable assurance regarding the reliability offinancial reporting and the preparation and presentation of financial statements for external purposes in accordancewith accounting principles generally accepted in the United States of America.
All internal control systems, no matter how well designed, have inherent limitations. Therefore, even thosesystems determined to be effective can provide only reasonable assurance with respect to financial statementpreparation and presentation.
Management assessed the effectiveness of the Company’s internal control over financial reporting as ofDecember 31, 2006. In making this assessment, it used the criteria set forth by the Committee of SponsoringOrganizations of the Treadway Commission in Internal Control — Integrated Framework. Based on our assessmentwe believe that, as of December 31, 2006, the Company’s internal control over financial reporting is effective basedon those criteria.
The Company’s independent registered public accounting firm that audited the consolidated financialstatements of UAG UK Holdings Limited has issued an audit report on our assessment of the Company’s internalcontrol over financial reporting. This report appears on page F-5.
UAG UK Holdings LimitedFebruary 28, 2007
F-2

REPORT OF INDEPENDENT REGISTERED PUBLIC ACCOUNTING FIRM
To the Board of Directors and Stockholders of United Auto Group, Inc.Bloomfield Hills, Michigan
We have audited management’s assessment, included in the accompanying Management Report on InternalControl Over Financial Reporting, that United Auto Group, Inc. and subsidiaries (the “Company”) maintainedeffective internal control over financial reporting as of December 31, 2006, based on criteria established in InternalControl — Integrated Framework issued by the Committee of Sponsoring Organizations of the Treadway Com-mission. The Company’s management is responsible for maintaining effective internal control over financialreporting and for its assessment of the effectiveness of internal control over financial reporting. Our responsibility isto express an opinion on management’s assessment and an opinion on the effectiveness of the Company’s internalcontrol over financial reporting based on our audit. We did not examine the effectiveness of internal control overfinancial reporting of UAG UK Holdings Limited and subsidiaries, (a consolidated subsidiary) whose financialstatements reflect total assets, revenues and income from continuing operations constituting 32%, 31% and35% percent, respectively, of the related consolidated financial statement amounts as of and for the year endedDecember 31, 2006. The effectiveness of UAG UK Holdings Limited and subsidiaries’ internal control overfinancial reporting was audited by other auditors whose report has been furnished to us, and our opinions, insofar asthey relate to the effectiveness of UAG UK Holdings Limited and subsidiaries’ internal control over financialreporting, are based solely on the report of other auditors.
We conducted our audit in accordance with the standards of the Public Company Accounting Oversight Board(United States). Those standards require that we plan and perform the audit to obtain reasonable assurance aboutwhether effective internal control over financial reporting was maintained in all material respects. Our auditincluded obtaining an understanding of internal control over financial reporting, evaluating management’sassessment, testing and evaluating the design and operating effectiveness of internal control, and performingsuch other procedures as we considered necessary in the circumstances. We believe that our audit and the report ofthe other auditors provide a reasonable basis for our opinions.
A company’s internal control over financial reporting is a process designed by, or under the supervision of, thecompany’s principal executive and principal financial officers, or persons performing similar functions, andeffected by the company’s board of directors, management, and other personnel to provide reasonable assuranceregarding the reliability of financial reporting and the preparation of financial statements for external purposes inaccordance with generally accepted accounting principles. A company’s internal control over financial reportingincludes those policies and procedures that (1) pertain to the maintenance of records that, in reasonable detail,accurately and fairly reflect the transactions and dispositions of the assets of the company; (2) provide reasonableassurance that transactions are recorded as necessary to permit preparation of financial statements in accordancewith generally accepted accounting principles, and that receipts and expenditures of the company are being madeonly in accordance with authorizations of management and directors of the company; and (3) provide reasonableassurance regarding prevention or timely detection of unauthorized acquisition, use, or disposition of the company’sassets that could have a material effect on the financial statements.
Because of the inherent limitations of internal control over financial reporting, including the possibility ofcollusion or improper management override of controls, material misstatements due to error or fraud may not beprevented or detected on a timely basis. Also, projections of any evaluation of the effectiveness of the internalcontrol over financial reporting to future periods are subject to the risk that the controls may become inadequatebecause of changes in conditions, or that the degree of compliance with the policies or procedures may deteriorate.
In our opinion, based on our audit and the report of the other auditors, management’s assessment that theCompany maintained effective internal control over financial reporting as of December 31, 2006, is fairly stated, inall material respects, based on the criteria established in Internal Control — Integrated Framework issued by theCommittee of Sponsoring Organizations of the Treadway Commission. Also, in our opinion, based on our audit andthe report of other auditors, the Company maintained, in all material respects, effective internal control overfinancial reporting as of December 31, 2006, based on the criteria established in Internal Control — IntegratedFramework issued by the Committee of Sponsoring Organizations of the Treadway Commission.
F-3

We have also audited, in accordance with the standards of the Public Company Accounting Oversight Board(United States), the consolidated financial statements and financial statement schedule as of and for the year endedDecember 31, 2006. Our report dated February 28, 2007 expressed an unqualified opinion on those consolidatedfinancial statements and financial statement schedule based on our audit and the report of other auditors, andincludes an explanatory paragraph relating to the Company electing application of Staff Accounting BulletinNo. 108, “Considering the Effects of Prior Year Misstatements when Quantifying Misstatements in Current YearFinancial Statements”.
/s/ Deloitte & Touche LLP
Detroit, MichiganFebruary 28, 2007
F-4

REPORT OF INDEPENDENT REGISTERED PUBLIC ACCOUNTING FIRM
The Board of Directors and StockholdersUAG UK Holdings Limited:
We have audited management’s assessment, included in the accompanying Management Report on InternalControl Over Financial Reporting, that UAG UK Holdings Limited and subsidiaries (the “Company”) maintainedeffective internal control over financial reporting as of December 31, 2006, based on criteria established in InternalControl — Integrated Framework issued by the Committee of Sponsoring Organizations of the Treadway Com-mission. The Company’s management is responsible for maintaining effective internal control over financialreporting and for its assessment of the effectiveness of internal control over financial reporting. Our responsibility isto express an opinion on management’s assessment and an opinion on the effectiveness of the Company’s internalcontrol over financial reporting based on our audit.
We conducted our audit in accordance with the standards of the Public Company Accounting Oversight Board(United States). Those standards require that we plan and perform the audit to obtain reasonable assurance aboutwhether effective internal control over financial reporting was maintained in all material respects. Our auditincluded obtaining an understanding of internal control over financial reporting, evaluating management’sassessment, testing and evaluating the design and operating effectiveness of internal control, and performingsuch other procedures as we considered necessary in the circumstances. We believe that our audit provides areasonable basis for our opinion.
A company’s internal control over financial reporting is a process designed to provide reasonable assuranceregarding the reliability of financial reporting and the preparation of financial statements for external purposes inaccordance with generally accepted accounting principles. A company’s internal control over financial reportingincludes those policies and procedures that (1) pertain to the maintenance of records that, in reasonable detail,accurately and fairly reflect the transactions and dispositions of the assets of the company; (2) provide reasonableassurance that transactions are recorded as necessary to permit preparation of financial statements in accordancewith generally accepted accounting principles, and that receipts and expenditures of the company are being madeonly in accordance with authorizations of management and directors of the company; and (3) provide reasonableassurance regarding prevention or timely detection of unauthorized acquisition, use, or disposition of the company’sassets that could have a material effect on the financial statements.
Because of its inherent limitations, internal control over financial reporting may not prevent or detectmisstatements. Also, projections of any evaluation of effectiveness to future periods are subject to the risk thatcontrols may become inadequate because of changes in conditions, or that the degree of compliance with thepolicies or procedures may deteriorate.
In our opinion, management’s assessment that the Company maintained effective internal control overfinancial reporting as of December 31, 2006, is fairly stated, in all material respects, based on criteria established inInternal Control — Integrated Framework issued by the Committee of Sponsoring Organizations of the TreadwayCommission. Also, in our opinion, the Company maintained, in all material respects, effective internal control overfinancial reporting as of December 31, 2006, based on criteria established in Internal Control — IntegratedFramework issued by the Committee of Sponsoring Organizations of the Treadway Commission.
We also have audited, in accordance with the standards of the Public Company Accounting Oversight Board(United States), the consolidated balance sheets of the Company as of December 31, 2006 and 2005, and the relatedconsolidated statements of operations, stockholders’ equity and comprehensive income, and cash flows for each ofthe years in the three-year period ended December 31, 2006, and our report dated February 28, 2007 expressed anunqualified opinion on those consolidated financial statements and includes an explanatory paragraph relating tothe Company electing application of Staff Accounting Bulletin No. 108 “Considering the Effects of Prior YearMisstatements when Quantifying Misstatements in Current Year Financial Statements.”
/s/ KPMG Audit Plc
Birmingham, United KingdomFebruary 28, 2007
F-5

REPORT OF INDEPENDENT REGISTERED PUBLIC ACCOUNTING FIRM
To the Board of Directors and Stockholders of United Auto Group, Inc.Bloomfield Hills, Michigan
We have audited the accompanying consolidated balance sheets of United Auto Group, Inc. and subsidiaries(the “Company”) as of December 31, 2006 and 2005, and the related consolidated statements of income,stockholders’ equity and comprehensive income (loss), and cash flows for each of the three years in the periodended December 31, 2006. Our audits also included the financial statement schedule listed in Item 15. Thesefinancial statements and financial statement schedule are the responsibility of the Company’s management. Ourresponsibility is to express an opinion on the financial statements and financial statement schedule based on ouraudits. We did not audit the financial statements of UAG UK Holdings Limited and subsidiaries (a consolidatedsubsidiary) for the years ended December 31, 2006, 2005 and 2004, which statements reflect total assetsconstituting 32% and 23% of the Company’s consolidated total assets as of December 31, 2006 and 2005, andtotal revenues constituting 31%, 29% and 29% of the Company’s consolidated total revenues and 35%, 30% and33% of income from continuing operations for the years ended December 31, 2006, 2005 and 2004, respectively.Those statements were audited by other auditors whose report has been furnished to us, and our opinion, insofar as itrelates to the amounts included for UAG UK Holdings Limited and subsidiaries is based solely on the report of suchother auditors.
We conducted our audits in accordance with the standards of the Public Company Accounting Oversight Board(United States). Those standards require that we plan and perform the audit to obtain reasonable assurance aboutwhether the financial statements are free of material misstatement. An audit includes examining, on a test basis,evidence supporting the amounts and disclosures in the financial statements. An audit also includes assessing theaccounting principles used and significant estimates made by management, as well as evaluating the overallfinancial statement presentation. We believe that our audits and the report of other auditors provide a reasonablebasis for our opinion.
In our opinion, based on our audits and the report of other auditors, such consolidated financial statementspresent fairly, in all material respects, the financial position of the Company at December 31, 2006 and 2005, andthe results of its operations and its cash flows for each of the three years in the period ended December 31, 2006 inconformity with accounting principles generally accepted in the United States of America. Also, in our opinion,based on our audits and (as to the amounts included for UAG UK Holdings Limited and subsidiaries) the report ofother auditors, such financial statement schedule, when considered in relation to the basic consolidated financialstatements taken as a whole, presents fairly in all material respects the information set forth therein.
As discussed in Note 1 to the consolidated financial statements, effective January 1, 2006, the Companyelected application of Staff Accounting Bulletin No. 108, “Considering the Effects of Prior Year Misstatementswhen Quantifying Misstatements in Current Year Financial Statements”.
We have also audited, in accordance with the standards of the Public Company Accounting Oversight Board(United States), the effectiveness of the Company’s internal control over financial reporting as of December 31,2006, based on the criteria established in Internal Control — Integrated Framework issued by the Committee ofSponsoring Organizations of the Treadway Commission and our report dated February 28, 2007 expressed anunqualified opinion on management’s assessment of the effectiveness of the Company’s internal control overfinancial reporting and an unqualified opinion on the effectiveness of the Company’s internal control over financialreporting based on our audits and the report of other auditors.
/s/ Deloitte & Touche LLP
Detroit, MichiganFebruary 28, 2007
F-6

REPORT OF INDEPENDENT REGISTERED PUBLIC ACCOUNTING FIRM
The Board of Directors and StockholdersUAG UK Holdings Limited:
We have audited the consolidated balance sheets of UAG UK Holdings Limited and subsidiaries (the“Company”) as of December 31, 2006 and 2005, and the related consolidated statements of income, stockholder’sequity and comprehensive income (loss), and cash flows for each of the years in the three-year period endedDecember 31, 2006. These consolidated financial statements are the responsibility of the Company’s management.Our responsibility is to express an opinion on these consolidated financial statements based on our audits.
We conducted our audits in accordance with the standards of the Public Company Accounting Oversight Board(United States). Those standards require that we plan and perform the audit to obtain reasonable assurance aboutwhether the financial statements are free of material misstatement. An audit includes examining, on a test basis,evidence supporting the amounts and disclosures in the financial statements. An audit also includes assessing theaccounting principles used and significant estimates made by management, as well as evaluating the overallfinancial statement presentation. We believe that our audits provide a reasonable basis for our opinion.
In our opinion, the consolidated financial statements referred to above present fairly, in all material respects,the financial position of the Company and subsidiaries as of December 31, 2006 and 2005, and the results of theiroperations and their cash flows for each of the years in the three-year period ended December 31, 2006, inconformity with U.S. generally accepted accounting principles.
As discussed in Note 1 to the consolidated financial statements, the Company elected application of StaffAccounting Bulletin No. 108 “Considering the Effects of Prior Year Misstatements when Quantifying Misstate-ments in Current Year Financial Statements.” We also have audited, in accordance with the standards of the PublicCompany Accounting Oversight Board (United States), the effectiveness of UAG UK Holdings Limited’s internalcontrol over financial reporting as of December 31, 2006, based on criteria established in Internal Control —Integrated Framework issued by the Committee of Sponsoring Organizations of the Treadway Commission, and ourreport dated February 28, 2007 expressed an unqualified opinion on management’s assessment of, and the effectiveoperation of, internal control over financial reporting.
/s/ KPMG Audit Plc
Birmingham, United KingdomFebruary 28, 2007
F-7

UNITED AUTO GROUP, INC.
CONSOLIDATED BALANCE SHEETS
2006 2005December 31,
(In thousands, exceptper share amounts)
ASSETSCash and cash equivalents . . . . . . . . . . . . . . . . . . . . . . . . . . . . . . . . . . . . . . . . . . $ 13,147 $ 8,957Accounts receivable, net of allowance for doubtful accounts of $2,855 and $3,933,
as of December 31, 2006 and 2005, respectively . . . . . . . . . . . . . . . . . . . . . . . . 469,516 398,127Inventories, net. . . . . . . . . . . . . . . . . . . . . . . . . . . . . . . . . . . . . . . . . . . . . . . . . . . 1,519,506 1,144,584Other current assets . . . . . . . . . . . . . . . . . . . . . . . . . . . . . . . . . . . . . . . . . . . . . . . 71,490 50,209Assets held for sale . . . . . . . . . . . . . . . . . . . . . . . . . . . . . . . . . . . . . . . . . . . . . . . 213,030 310,467
Total current assets . . . . . . . . . . . . . . . . . . . . . . . . . . . . . . . . . . . . . . . . . . . . . . 2,286,689 1,912,344Property and equipment, net . . . . . . . . . . . . . . . . . . . . . . . . . . . . . . . . . . . . . . . . . 582,646 416,099Goodwill . . . . . . . . . . . . . . . . . . . . . . . . . . . . . . . . . . . . . . . . . . . . . . . . . . . . . . . 1,244,171 992,976Franchise value . . . . . . . . . . . . . . . . . . . . . . . . . . . . . . . . . . . . . . . . . . . . . . . . . . 246,596 189,297Other assets . . . . . . . . . . . . . . . . . . . . . . . . . . . . . . . . . . . . . . . . . . . . . . . . . . . . . 109,700 83,457
Total Assets . . . . . . . . . . . . . . . . . . . . . . . . . . . . . . . . . . . . . . . . . . . . . . . . . . . $4,469,802 $3,594,173
LIABILITIES AND STOCKHOLDERS’ EQUITYFloor plan notes payable . . . . . . . . . . . . . . . . . . . . . . . . . . . . . . . . . . . . . . . . . . . . $ 874,326 $ 785,237Floor plan notes payable — non-trade . . . . . . . . . . . . . . . . . . . . . . . . . . . . . . . . . . 297,985 318,034Accounts payable . . . . . . . . . . . . . . . . . . . . . . . . . . . . . . . . . . . . . . . . . . . . . . . . . 300,804 198,268Accrued expenses . . . . . . . . . . . . . . . . . . . . . . . . . . . . . . . . . . . . . . . . . . . . . . . . . 214,307 170,606Current portion of long-term debt . . . . . . . . . . . . . . . . . . . . . . . . . . . . . . . . . . . . . 13,385 3,551Liabilities held for sale . . . . . . . . . . . . . . . . . . . . . . . . . . . . . . . . . . . . . . . . . . . . . 52,150 189,239
Total current liabilities . . . . . . . . . . . . . . . . . . . . . . . . . . . . . . . . . . . . . . . . . . . 1,752,957 1,664,935Long-term debt . . . . . . . . . . . . . . . . . . . . . . . . . . . . . . . . . . . . . . . . . . . . . . . . . . 1,168,666 576,690Other long-term liabilities . . . . . . . . . . . . . . . . . . . . . . . . . . . . . . . . . . . . . . . . . . . 252,526 206,816
Total Liabilities . . . . . . . . . . . . . . . . . . . . . . . . . . . . . . . . . . . . . . . . . . . . . . . . 3,174,149 2,448,441Commitments and contingent liabilitiesStockholders’ EquityPreferred Stock, $0.0001 par value; 100 shares authorized; none issued and
outstanding . . . . . . . . . . . . . . . . . . . . . . . . . . . . . . . . . . . . . . . . . . . . . . . . . . . . — —Common Stock, $0.0001 par value, 240,000 shares authorized; 94,468 shares
issued at December 31, 2006; 93,767 shares issued at December 31, 2005 . . . . . 5 5Non-voting Common Stock, $0.0001 par value, 7,125 shares authorized; none
issued and outstanding . . . . . . . . . . . . . . . . . . . . . . . . . . . . . . . . . . . . . . . . . . . — —Class C Common Stock, $0.0001 par value, 20,000 shares authorized; none issued
and outstanding . . . . . . . . . . . . . . . . . . . . . . . . . . . . . . . . . . . . . . . . . . . . . . . . — —Additional paid-in-capital . . . . . . . . . . . . . . . . . . . . . . . . . . . . . . . . . . . . . . . . . . . 768,798 746,165Retained earnings . . . . . . . . . . . . . . . . . . . . . . . . . . . . . . . . . . . . . . . . . . . . . . . . . 492,704 404,010Accumulated other comprehensive income . . . . . . . . . . . . . . . . . . . . . . . . . . . . . . 79,379 21,830Treasury stock, at cost; 5,306 and 4,306 shares at December 31, 2006 and 2005,
respectively . . . . . . . . . . . . . . . . . . . . . . . . . . . . . . . . . . . . . . . . . . . . . . . . . . . (45,233) (26,278)
Total Stockholders’ Equity . . . . . . . . . . . . . . . . . . . . . . . . . . . . . . . . . . . . . . . . 1,295,653 1,145,732
Total Liabilities and Stockholders’ Equity . . . . . . . . . . . . . . . . . . . . . . . . . . . . . $4,469,802 $3,594,173
See Notes to Consolidated Financial Statements.
F-8

UNITED AUTO GROUP, INC.
CONSOLIDATED STATEMENTS OF INCOME
2006 2005 2004Year Ended December 31,
(In thousands, except per share amounts)
Revenue:New vehicle . . . . . . . . . . . . . . . . . . . . . . . . . . . . . . . . . . . . . . . $ 6,275,916 $5,601,187 $4,879,057Used vehicle . . . . . . . . . . . . . . . . . . . . . . . . . . . . . . . . . . . . . . . 2,546,009 2,025,532 1,798,841Finance and insurance, net . . . . . . . . . . . . . . . . . . . . . . . . . . . . 249,581 229,575 200,468Service and parts. . . . . . . . . . . . . . . . . . . . . . . . . . . . . . . . . . . . 1,246,288 1,043,859 885,339Fleet and wholesale . . . . . . . . . . . . . . . . . . . . . . . . . . . . . . . . . . 924,519 761,240 624,316
Total revenues . . . . . . . . . . . . . . . . . . . . . . . . . . . . . . . . . . 11,242,313 9,661,393 8,388,021
Cost of sales:New vehicle . . . . . . . . . . . . . . . . . . . . . . . . . . . . . . . . . . . . . . . 5,727,135 5,106,889 4,454,724Used vehicle . . . . . . . . . . . . . . . . . . . . . . . . . . . . . . . . . . . . . . . 2,330,694 1,845,587 1,646,946Service and parts. . . . . . . . . . . . . . . . . . . . . . . . . . . . . . . . . . . . 559,305 474,563 408,033Fleet and wholesale . . . . . . . . . . . . . . . . . . . . . . . . . . . . . . . . . . 920,710 760,903 622,990
Total cost of sales . . . . . . . . . . . . . . . . . . . . . . . . . . . . . . . 9,537,844 8,187,942 7,132,693
Gross profit . . . . . . . . . . . . . . . . . . . . . . . . . . . . . . . . . . . . . . . 1,704,469 1,473,451 1,255,328Selling, general and administrative expenses . . . . . . . . . . . . . . . 1,356,452 1,154,220 975,409Depreciation and amortization . . . . . . . . . . . . . . . . . . . . . . . . . . 44,863 37,551 36,365
Operating income . . . . . . . . . . . . . . . . . . . . . . . . . . . . . . . . . . . 303,154 281,680 243,554Floor plan interest expense . . . . . . . . . . . . . . . . . . . . . . . . . . . . . . (61,565) (47,124) (40,883)Other interest expense. . . . . . . . . . . . . . . . . . . . . . . . . . . . . . . . . . (49,173) (49,004) (42,923)Equity in earnings of affiliates . . . . . . . . . . . . . . . . . . . . . . . . . . . 8,201 4,271 5,770Other income . . . . . . . . . . . . . . . . . . . . . . . . . . . . . . . . . . . . . . . . — — 11,469
Income from continuing operations before income taxes andminority interests. . . . . . . . . . . . . . . . . . . . . . . . . . . . . . . . . . 200,617 189,823 176,987
Income taxes . . . . . . . . . . . . . . . . . . . . . . . . . . . . . . . . . . . . . . . . (67,845) (68,870) (65,837)Minority interests . . . . . . . . . . . . . . . . . . . . . . . . . . . . . . . . . . . . . (2,172) (1,814) (2,047)
Income from continuing operations . . . . . . . . . . . . . . . . . . . . . . 130,600 119,139 109,103(Loss) income from discontinued operations, net of tax . . . . . . . . . (5,899) (166) 2,584
Net income . . . . . . . . . . . . . . . . . . . . . . . . . . . . . . . . . . . . . . . . $ 124,701 $ 118,973 $ 111,687
Basic earnings per share:Continuing operations . . . . . . . . . . . . . . . . . . . . . . . . . . . . . . . . $ 1.40 $ 1.28 $ 1.21Discontinued operations . . . . . . . . . . . . . . . . . . . . . . . . . . . . . . (0.06) (0.00) 0.03Net income . . . . . . . . . . . . . . . . . . . . . . . . . . . . . . . . . . . . . . . . $ 1.34 $ 1.28 $ 1.24Shares used in determining basic earnings per share . . . . . . . . . . 93,393 92,832 89,920
Diluted earnings per share:Continuing operations . . . . . . . . . . . . . . . . . . . . . . . . . . . . . . . . $ 1.39 $ 1.27 $ 1.20Discontinued operations . . . . . . . . . . . . . . . . . . . . . . . . . . . . . . (0.06) (0.00) 0.03Net income . . . . . . . . . . . . . . . . . . . . . . . . . . . . . . . . . . . . . . . . $ 1.32 $ 1.27 $ 1.22Shares used in determining diluted earnings per share . . . . . . . . 94,178 93,932 91,226Cash dividends per share . . . . . . . . . . . . . . . . . . . . . . . . . . . . . . $ 0.27 $ 0.23 $ 0.21
See Notes to Consolidated Financial Statements.
F-9
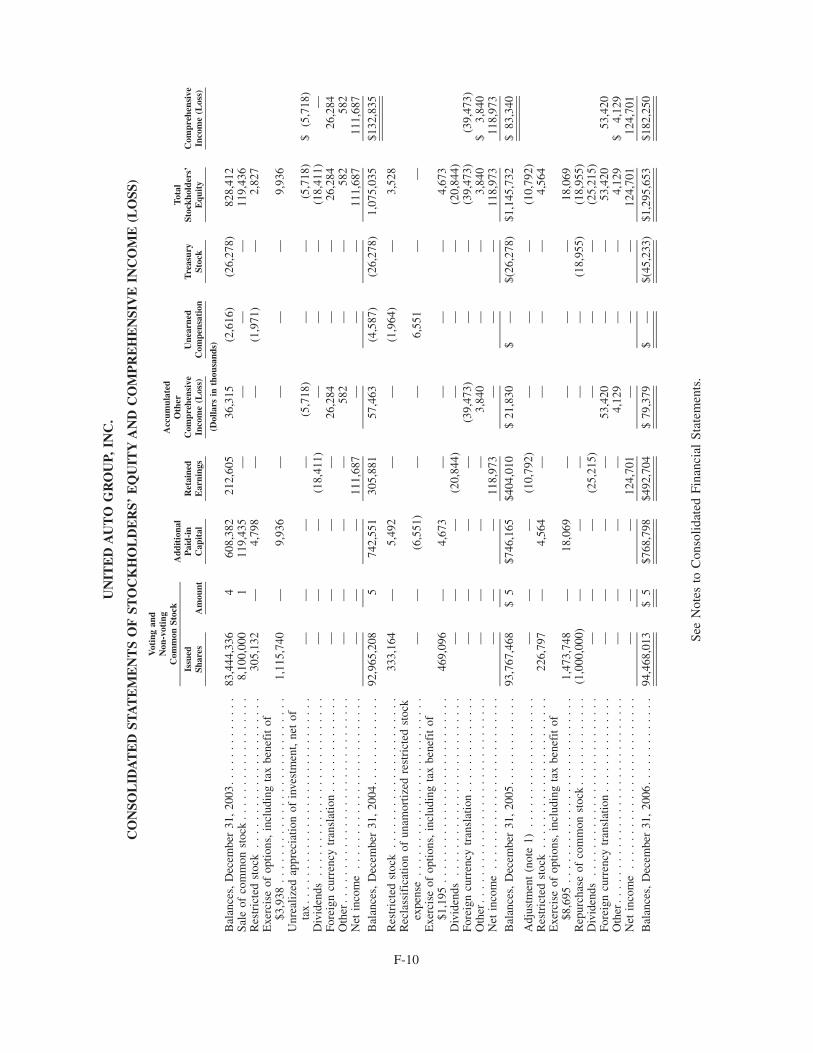
UN
ITE
DA
UT
OG
RO
UP,
INC
.
CO
NSO
LID
AT
ED
STA
TE
ME
NT
SO
FST
OC
KH
OL
DE
RS’
EQ
UIT
YA
ND
CO
MP
RE
HE
NSI
VE
INC
OM
E(L
OSS
)
Issu
edSh
ares
Am
ount
Add
itio
nal
Pai
d-in
Cap
ital
Ret
aine
dE
arni
ngs
Acc
umul
ated
Oth
erC
ompr
ehen
sive
Inco
me
(Los
s)U
near
ned
Com
pens
atio
nT
reas
ury
Stoc
k
Tot
alSt
ockh
olde
rs’
Equ
ity
Com
preh
ensi
veIn
com
e(L
oss)
Vot
ing
and
Non
-vot
ing
Com
mon
Stoc
k
(Dol
lars
inth
ousa
nds)
Bal
ance
s,D
ecem
ber
31,
2003
..
..
..
..
..
..
.83
,444
,336
460
8,38
221
2,60
536
,315
(2,6
16)
(26,
278)
828,
412
Sale
ofco
mm
onst
ock
..
..
..
..
..
..
..
..
..
8,10
0,00
01
119,
435
——
——
119,
436
Res
tric
ted
stoc
k.
..
..
..
..
..
..
..
..
..
..
.30
5,13
2—
4,79
8—
—(1
,971
)—
2,82
7E
xerc
ise
ofop
tions
,in
clud
ing
tax
bene
fit
of$3
,938
..
..
..
..
..
..
..
..
..
..
..
..
..
.1,
115,
740
—9,
936
——
——
9,93
6U
nrea
lized
appr
ecia
tion
ofin
vest
men
t,ne
tof
tax
..
..
..
..
..
..
..
..
..
..
..
..
..
..
..
——
——
(5,7
18)
——
(5,7
18)
$(5
,718
)D
ivid
ends
..
..
..
..
..
..
..
..
..
..
..
..
..
——
—(1
8,41
1)—
——
(18,
411)
—Fo
reig
ncu
rren
cytr
ansl
atio
n.
..
..
..
..
..
..
.—
——
—26
,284
——
26,2
8426
,284
Oth
er.
..
..
..
..
..
..
..
..
..
..
..
..
..
...
——
——
582
——
582
582
Net
inco
me
..
..
..
..
..
..
..
..
..
..
..
..
.—
——
111,
687
——
—11
1,68
711
1,68
7B
alan
ces,
Dec
embe
r31
,20
04.
..
..
..
..
..
..
92,9
65,2
085
742,
551
305,
881
57,4
63(4
,587
)(2
6,27
8)1,
075,
035
$132
,835
Res
tric
ted
stoc
k.
..
..
..
..
..
..
..
..
..
..
.33
3,16
4—
5,49
2—
—(1
,964
)—
3,52
8R
ecla
ssif
icat
ion
ofun
amor
tized
rest
rict
edst
ock
expe
nse
..
..
..
..
..
..
..
..
..
..
..
..
..
——
(6,5
51)
——
6,55
1—
—E
xerc
ise
ofop
tions
,in
clud
ing
tax
bene
fit
of$1
,195
..
..
..
..
..
..
..
..
..
..
..
..
..
.46
9,09
6—
4,67
3—
——
—4,
673
Div
iden
ds.
..
..
..
..
..
..
..
..
..
..
..
..
.—
——
(20,
844)
——
—(2
0,84
4)Fo
reig
ncu
rren
cytr
ansl
atio
n.
..
..
..
..
..
..
.—
——
—(3
9,47
3)—
—(3
9,47
3)(3
9,47
3)O
ther
..
..
..
..
..
..
..
..
..
..
..
..
..
...
.—
——
—3,
840
——
3,84
0$
3,84
0N
etin
com
e.
..
..
..
..
..
..
..
..
..
..
..
..
——
—11
8,97
3—
——
118,
973
118,
973
Bal
ance
s,D
ecem
ber
31,
2005
..
..
..
..
..
..
.93
,767
,468
$5
$746
,165
$404
,010
$21
,830
$—
$(26
,278
)$1
,145
,732
$83
,340
Adj
ustm
ent
(not
e1)
..
..
..
..
..
..
..
..
..
.—
——
(10,
792)
——
—(1
0,79
2)R
estr
icte
dst
ock
..
..
..
..
..
..
..
..
..
..
..
226,
797
—4,
564
——
——
4,56
4E
xerc
ise
ofop
tions
,in
clud
ing
tax
bene
fit
of$8
,695
..
..
..
..
..
..
..
..
..
..
..
..
..
.1,
473,
748
—18
,069
——
——
18,0
69R
epur
chas
eof
com
mon
stoc
k.
..
..
..
..
..
..
(1,0
00,0
00)
——
——
—(1
8,95
5)(1
8,95
5)D
ivid
ends
..
..
..
..
..
..
..
..
..
..
..
..
..
——
—(2
5,21
5)—
——
(25,
215)
Fore
ign
curr
ency
tran
slat
ion
..
..
..
..
..
..
..
——
——
53,4
20—
—53
,420
53,4
20O
ther
..
..
..
..
..
..
..
..
..
..
..
..
..
...
.—
——
—4,
129
——
4,12
9$
4,12
9N
etin
com
e.
..
..
..
..
..
..
..
..
..
..
..
..
——
—12
4,70
1—
——
124,
701
124,
701
Bal
ance
s,D
ecem
ber
31,
2006
..
..
..
..
..
..
.94
,468
,013
$5
$768
,798
$492
,704
$79
,379
$—
$(45
,233
)$1
,295
,653
$182
,250
See
Not
esto
Con
solid
ated
Fina
ncia
lSt
atem
ents
.
F-10

UNITED AUTO GROUP, INC.
CONSOLIDATED STATEMENTS OF CASH FLOWS
2006 2005 2004
Year Ended December 31,
(In thousands)
Operating Activities:Net income . . . . . . . . . . . . . . . . . . . . . . . . . . . . . . . . . . . . . . . . . . . . . . . . . . . $ 124,701 $ 118,973 $ 111,687Adjustments to reconcile net income to net cash from continuing operating
activities:Depreciation and amortization . . . . . . . . . . . . . . . . . . . . . . . . . . . . . . . . . . . . 44,863 37,551 36,365Undistributed earnings of equity method investments . . . . . . . . . . . . . . . . . . . . (7,951) (4,271) (4,449)(Income) loss from discontinued operations, net of tax . . . . . . . . . . . . . . . . . . . 5,899 166 (2,584)Gain on sale of investment . . . . . . . . . . . . . . . . . . . . . . . . . . . . . . . . . . . . . . — — (11,469)Deferred income taxes . . . . . . . . . . . . . . . . . . . . . . . . . . . . . . . . . . . . . . . . . 29,947 17,381 27,368Minority interests . . . . . . . . . . . . . . . . . . . . . . . . . . . . . . . . . . . . . . . . . . . . . 2,172 1,814 2,047Changes in operating assets and liabilities:Accounts receivable . . . . . . . . . . . . . . . . . . . . . . . . . . . . . . . . . . . . . . . . . . . (45,263) (61,216) (32,093)Inventories . . . . . . . . . . . . . . . . . . . . . . . . . . . . . . . . . . . . . . . . . . . . . . . . . (209,418) 7,477 (98,242)Floor plan notes payable . . . . . . . . . . . . . . . . . . . . . . . . . . . . . . . . . . . . . . . . 140,180 42,463 208,049Accounts payable and accrued expenses . . . . . . . . . . . . . . . . . . . . . . . . . . . . . 51,273 (18,902) 48,522Other . . . . . . . . . . . . . . . . . . . . . . . . . . . . . . . . . . . . . . . . . . . . . . . . . . . . . (16,122) 27,937 (18,609)
Net cash from continuing operating activities . . . . . . . . . . . . . . . . . . . . . . . . . . . 120,281 169,373 266,592
Investing Activities:Purchase of equipment and improvements . . . . . . . . . . . . . . . . . . . . . . . . . . . . . (225,058) (220,457) (225,555)Proceeds from sale-leaseback transactions . . . . . . . . . . . . . . . . . . . . . . . . . . . . . 106,167 118,470 149,076Dealership acquisitions, net, including repayment of sellers floor plan notes
payable of $113,229, $46,045 and $40,751, respectively . . . . . . . . . . . . . . . . . . (369,055) (126,879) (210,084)Proceeds from sale of investment . . . . . . . . . . . . . . . . . . . . . . . . . . . . . . . . . . . — — 13,566
Net cash from continuing investing activities . . . . . . . . . . . . . . . . . . . . . . . . . . . (487,946) (228,866) (272,997)
Financing Activities:Proceeds from borrowings under U.S. Credit Agreement . . . . . . . . . . . . . . . . . . . 441,500 195,000 303,800Repayments under U.S. Credit Agreement . . . . . . . . . . . . . . . . . . . . . . . . . . . . . (713,500) (177,800) (361,000)Issuance of subordinated debt . . . . . . . . . . . . . . . . . . . . . . . . . . . . . . . . . . . . . . 750,000 — —Net borrowings (repayments) of other long-term debt . . . . . . . . . . . . . . . . . . . . . 60,928 (14,812) (17,057)Net borrowings (repayments) of floor plan notes payable — non-trade . . . . . . . . . . (71,140) 18,445 (58,841)Payment of deferred financing costs. . . . . . . . . . . . . . . . . . . . . . . . . . . . . . . . . . (17,210) — —Proceeds from the issuance of common stock . . . . . . . . . . . . . . . . . . . . . . . . . . . — — 119,435Proceeds from exercises of common stock including excess tax benefit . . . . . . . . . 18,069 4,673 9,936Repurchase of common stock . . . . . . . . . . . . . . . . . . . . . . . . . . . . . . . . . . . . . . (18,955) — —Dividends . . . . . . . . . . . . . . . . . . . . . . . . . . . . . . . . . . . . . . . . . . . . . . . . . . . . (25,215) (20,844) (18,411)
Net cash from continuing financing activities . . . . . . . . . . . . . . . . . . . . . . . . . . . 424,477 4,662 (22,138)
Discontinued operations:Net cash from discontinued operating activities . . . . . . . . . . . . . . . . . . . . . . . . (62,431) (19,017) 41,525Net cash from discontinued investing activities . . . . . . . . . . . . . . . . . . . . . . . . 53,252 76,215 (5,406)Net cash from discontinued financing activities . . . . . . . . . . . . . . . . . . . . . . . . (43,443) (16,957) (2,338)
Net cash from discontinued operations . . . . . . . . . . . . . . . . . . . . . . . . . . . . . . . . (52,622) 40,241 33,781
Net change in cash and cash equivalents . . . . . . . . . . . . . . . . . . . . . . . . . . . . . . 4,190 (14,590) 5,238Cash and cash equivalents, beginning of period . . . . . . . . . . . . . . . . . . . . . . . . . . 8,957 23,547 18,309
Cash and cash equivalents, end of period . . . . . . . . . . . . . . . . . . . . . . . . . . . . . . $ 13,147 $ 8,957 $ 23,547
Supplemental disclosures of cash flow information:Cash paid for:
Interest . . . . . . . . . . . . . . . . . . . . . . . . . . . . . . . . . . . . . . . . . . . . . . . . . . . . $ 105,787 $ 98,815 $ 92,469Income taxes . . . . . . . . . . . . . . . . . . . . . . . . . . . . . . . . . . . . . . . . . . . . . . . . 35,230 37,461 20,133
Seller financed/assumed debt . . . . . . . . . . . . . . . . . . . . . . . . . . . . . . . . . . . . . . 64,168 5,300 5,790
See Notes to Consolidated Financial Statements.
F-11

UNITED AUTO GROUP, INC.
NOTES TO CONSOLIDATED FINANCIAL STATEMENTS(In thousands, except per share amounts)
1. Organization and Summary of Significant Accounting Policies
Business Overview and Concentrations
United Auto Group, Inc. (the “Company”) is engaged in the sale of new and used motor vehicles and relatedproducts and services, including vehicle service, parts, collision repair, finance and lease contracts, third-partyinsurance products and other aftermarket products. The Company operates dealerships under franchise agreementswith a number of automotive manufacturers. In accordance with individual franchise agreements, each dealership issubject to certain rights and restrictions typical of the industry. The ability of the manufacturers to influence theoperations of the dealerships, or the loss of a franchise agreement, could have a material impact on the Company’soperating results, financial position or cash flows. For the year ended December 31, 2006, Toyota/Lexus brandsaccounted for 21% of the Company’s total revenues; BMW/MINI accounted for 18%, Honda/Acura accounted for16%, DaimlerChrysler brands accounted for 11% and Ford brands accounted for 10%. No other manufactureraccounted for more than 10% of our total revenue. At December 31, 2006 and 2005, the Company had receivablesfrom manufacturers of $89,520 and $78,456, respectively. In addition, a large portion of the Company’s contracts intransit are due from manufacturers’ captive finance subsidiaries.
Basis of Presentation
The consolidated financial statements include all majority-owned subsidiaries. Investments in affiliatedcompanies, typically representing an ownership interest in the voting stock of the affiliate of between 20% and 50%,are stated at cost of acquisition plus the Company’s equity in undistributed net income since acquisition.Investments representing less than a 20% ownership interest in the voting stock of a company are stated at cost.All significant intercompany accounts and transactions have been eliminated in consolidation.
The consolidated financial statements have been updated for entities that have been treated as discontinuedoperations through December 31, 2006 in accordance with Statement of Financial Accounting Standards (“SFAS”)No. 144, Accounting for the Impairment or Disposal of Long-Lived Assets.
On June 1, 2006, the Company effected a two-for-one split of its voting common stock in the form of a stockdividend. Shareholders of record as of May 11, 2006 received one additional share for each share owned. All shareand per share information herein reflects the stock split.
In September 2006, the SEC released Staff Accounting Bulletin No. 108, “Considering the Effects of PriorYear Misstatements When Quantifying Misstatements in Current Year Financial Statements” (“SAB 108”), whichpermits the Company to adjust for the cumulative effect of prior period immaterial errors in the carrying amount ofassets and liabilities as of the beginning of the current fiscal year, with an offsetting adjustment to the openingbalance of retained earnings in the year of adoption. SAB 108 requires the adjustment of any prior quarterlyfinancial statements within the fiscal year of adoption for the effects of such errors on the quarters when theinformation is next presented. Such adjustments do not require previously filed reports with the SEC to be amended.SAB 108 was effective for the Company for the fiscal year ending December 31, 2006. As a result, the Company hasadjusted its opening retained earnings for fiscal 2006 and its financial results for the first three quarters of fiscal2006 to correct errors related to operating leases with scheduled rent increases which were not accounted for on astraight line basis over the rental period and were previously considered not to be material errors in each individualperiod. A summary of the amounts of the errors follows:
2006
Cumulative effect on stockholders’ equity as of January 1, . . . . . . . . . . . . . . . . . . . . . . . . $(10,792)Effect on:
Net income for the three months ended March 31, . . . . . . . . . . . . . . . . . . . . . . . . . . . . $ (138)Net income for the three months ended June 30, . . . . . . . . . . . . . . . . . . . . . . . . . . . . . $ (143)Net income for the three months ended September 30, . . . . . . . . . . . . . . . . . . . . . . . . . $ (143)
F-12

Results for the year ended December 31, 2005 include $8,163 ($5,200 after-tax) of earnings attributable to thesale of all the remaining variable profits relating to the pool of extended service contracts sold at the Company’sdealerships from 2001 through 2005. In addition, 2004 results include an $11,469 ($7,203 after tax) gain resultingfrom the sale of an investment and an $8,426 ($5,292 after tax) gain resulting from a refund of U.K. consumptiontaxes. These gains were offset in part by non-cash charges of $7,834 ($4,920 after tax) principally in connectionwith the planned relocation of certain U.K. franchises as part of the Company’s ongoing facility enhancementprogram.
Estimates
The preparation of financial statements in conformity with accounting principles generally accepted in theUnited States of America requires management to make estimates and assumptions that affect the reported amountsof assets and liabilities, the disclosure of contingent assets and liabilities at the date of the financial statements, andthe reported amounts of revenues and expenses during the reporting period. Actual results could differ from thoseestimates. The accounts requiring the use of significant estimates include accounts receivable, inventories, incometaxes, intangible assets and certain reserves.
Cash and Cash Equivalents
Cash and cash equivalents include all highly-liquid investments that have an original maturity of three monthsor less at the date of purchase.
Contracts in Transit
Contracts in transit represent customer finance contracts evidencing loan agreements or lease agreementsbetween the Company, as creditor, and the customer, as borrower, to acquire or lease a vehicle whereby a third-partyfinance source has given the Company initial, non-binding approval to assume the Company’s position as creditor.Funding and final approval from the finance source is provided upon the finance source’s review of the loan or leaseagreement and related documentation executed by the customer at the dealership. These finance contracts aretypically funded within ten days of the initial approval of the finance transaction by the third-party finance source.Further, the finance source is not contractually obligated to make the loan or lease to the customer until it gives itsfinal approval and funds the transaction. Until such final approval is given, contracts in transit represent amountsdue from the customer to the Company. Contracts in transit, included in accounts receivable, net in the Company’sconsolidated balance sheets, amounted to $182,773 and $158,935 as of December 31, 2006 and 2005, respectively.
Inventory Valuation
Inventories are stated at the lower of cost or market. Cost for new and used vehicle inventories is determinedusing the specific identification method. Cost for parts, accessories and other inventories are based on factory listprices.
Property and Equipment
Property and equipment are recorded at cost and depreciated over estimated useful lives using the straight-linemethod. Useful lives for purposes of computing depreciation for assets, other than equipment under capital leaseand leasehold improvements, are between 3 and 15 years. Leasehold improvements and equipment under capitallease are depreciated over the shorter of the term of the lease or the estimated useful life of the asset.
Expenditures relating to recurring repair and maintenance are expensed as incurred. Expenditures thatincrease the useful life or substantially increase the serviceability of an existing asset are capitalized. When
F-13
UNITED AUTO GROUP, INC.
NOTES TO CONSOLIDATED FINANCIAL STATEMENTS(In thousands, except per share amounts) — (Continued)

equipment is sold or otherwise disposed of, the cost and related accumulated depreciation are removed from thebalance sheet, with any resulting gain or loss being reflected in income.
Income Taxes
Tax regulations may require items to be included in the tax return at different times than such items arereflected in the financial statements. Some of these differences are permanent, such as expenses which are notdeductible on the tax return, and some are timing differences, such as the timing of depreciation expense. Timingdifferences create deferred tax assets and liabilities. Deferred tax assets generally represent items that can be used asa tax deduction or credit in the tax return in future years for which the Company has already recorded the tax effectin its financial statements. Deferred tax liabilities generally represent deductions taken on the tax return that havenot yet been recognized as an expense in the Company’s financial statements. The Company establishes valuationallowances for deferred tax assets if it is more likely than not that the amount of expected future taxable income willnot be sufficient to allow the use of the deduction or credit.
Intangible Assets
The Company’s principal intangible assets relate to its franchise agreements with vehicle manufacturers,which represent the estimated value of franchises acquired in business combinations, and goodwill, whichrepresents the excess of cost over the fair value of tangible and identified intangible assets acquired in connectionwith business combinations. The Company believes the franchise value of its dealerships has an indefinite usefullife based on the following facts:
• Automotive retailing is a mature industry and is based on franchise agreements with the vehiclemanufacturers;
• There are no known changes or events that would alter the automotive retailing franchise environment;
• Certain franchise agreement terms are indefinite;
• Franchise agreements that have limited terms have historically been renewed without substantialcost; and
• The Company’s history shows that manufacturers have not terminated it’s franchise agreements.
The following is a summary of the changes in the carrying amount of goodwill and franchise value during theyears ended December 31, 2006 and 2005:
GoodwillFranchise
Value
Balance — December 31, 2004 . . . . . . . . . . . . . . . . . . . . . . . . . . . . . . . . . $ 994,754 $178,092
Additions during 2005 . . . . . . . . . . . . . . . . . . . . . . . . . . . . . . . . . . . . . . . 21,175 19,277
Deletions during 2005 . . . . . . . . . . . . . . . . . . . . . . . . . . . . . . . . . . . . . . . (1,081) (590)
Foreign currency translation . . . . . . . . . . . . . . . . . . . . . . . . . . . . . . . . . . . (21,872) (7,482)
Balance — December 31, 2005 . . . . . . . . . . . . . . . . . . . . . . . . . . . . . . . . . $ 992,976 $189,297
Additions during 2006 . . . . . . . . . . . . . . . . . . . . . . . . . . . . . . . . . . . . . . . 217,249 47,832
Foreign currency translation . . . . . . . . . . . . . . . . . . . . . . . . . . . . . . . . . . . 33,946 9,467
Balance — December 31, 2006 . . . . . . . . . . . . . . . . . . . . . . . . . . . . . . . . . $1,244,171 $246,596
F-14
UNITED AUTO GROUP, INC.
NOTES TO CONSOLIDATED FINANCIAL STATEMENTS(In thousands, except per share amounts) — (Continued)

As of December 31, 2006 and 2005, approximately $673,146 and $575,054, respectively, of the Company’sgoodwill is deductible for tax purposes. The Company has established deferred tax liabilities related to thetemporary differences arising from such tax deductible goodwill.
Impairment Testing
Franchise value impairment is assessed at least annually through a comparison of the carrying amounts of ourfranchises with their estimated fair values. An indicator of impairment exists if the carrying value of a franchiseexceeds its estimated fair value and an impairment loss may be recognized equal to that excess. The Company alsoevaluates franchises in connection with the annual impairment testing to determine whether events and circum-stances continue to support management’s assessment that the franchise has an indefinite life.
Goodwill impairment is assessed at least annually at the reporting unit level. An indicator of impairment existsif the carrying amount of the reporting unit, including goodwill, is determined to exceed its estimated fair value. Ifan indication of impairment exists, the impairment is measured by comparing the implied fair value of the reportingunit goodwill with the carrying amount of that goodwill and an impairment loss may be recognized equal to thatexcess.
The fair values of franchise value and goodwill are determined using a discounted cash flow approach, whichincludes assumptions that include revenue and profitability growth, franchise profit margins, residual values andour cost of capital. If future events and circumstances cause significant changes in the assumptions underlying theCompany’s analysis which results in a reduction of the Company’s estimates of fair value, the Company may incuran impairment charge.
Investments
Investments include marketable securities and investments in businesses accounted for under the equitymethod and the cost method. Marketable securities include investments in debt and equity securities. Marketablesecurities held by the Company are typically classified as available for sale and are stated at fair value in the balancesheet with unrealized gains and losses included in other comprehensive income (loss), a separate component ofstockholders’ equity. Declines in investment values that are deemed to be other than temporary would be anindicator of impairment and may result in an impairment charge reducing the investments’ carrying value to fairvalue. A majority of the Company’s investments are in joint venture relationships. Such joint ventures relationshipsare accounted for under the equity method, pursuant to which the Company records its proportionate share of thejoint venture’s income each period. As of December 31, 2006 and 2005, the Company had $13,100 and $7,600,respectively, of investments accounted for under the cost method.
The Company and Sirius Satellite Radio Inc. (“Sirius”) have agreed to jointly promote Sirius Satellite Radioservice. Pursuant to the terms of the arrangement with Sirius. The Company’s dealerships in the U.S. endeavor toorder a significant percentage of eligible vehicles with a factory installed Sirius radio. The Company and Siriushave also agreed to jointly market the Sirius service under a best efforts arrangement through January 4, 2009. TheCompany’s costs relating to such marketing initiatives are expensed as incurred. As compensation for its efforts, theCompany received warrants to purchase shares of Sirius common stock in 2004 that are being earned ratably on anannual basis through January 2009. The Company measures the fair value of the warrants earned ratably on the datethey are earned as there are no significant disincentives for non-performance. Since the Company can reasonablyestimate the number of warrants being earned pursuant to the ratable schedule, the estimated fair value (based oncurrent fair value) of these warrants is being recognized ratably during each annual period.
The Company also has received the right to earn additional warrants to purchase Sirius common stock basedupon the sale of certain units of specified vehicle brands through December 31, 2007. Since the Company cannot
F-15
UNITED AUTO GROUP, INC.
NOTES TO CONSOLIDATED FINANCIAL STATEMENTS(In thousands, except per share amounts) — (Continued)

reasonably estimate the number of warrants that will be earned subject to the sale of units, the fair value of thesewarrants is being recognized when they are earned.
As of December 31, 2006, The Company had $4,082 of investments in Sirius common stock and warrants topurchase common stock that were classified as trading securities for which unrealized gains and losses have beenincluded in earnings. The value of Sirius stock has been and is expected to be subject to significant fluctuations,which may result in variability in the amount the Company earns under this arrangement. The warrants may becancelled upon the termination of the arrangement in January 2009 and the Company may not be able to achieve theperformance targets outlined in the warrants.
Foreign Currency Translation
For all foreign operations, the functional currency is the local currency. The revenue and expense accounts ofthe Company’s foreign operations are translated into U.S. dollars using the average exchange rates that prevailedduring the period. Assets and liabilities of foreign operations are translated into U.S. dollars using period endexchange rates. Cumulative translation adjustments relating to foreign functional currency assets and liabilities arerecorded in accumulated other comprehensive income (loss), a separate component of stockholders’ equity.
Fair Value of Financial Instruments
Financial instruments consist of cash and cash equivalents, accounts receivable, accounts payable, debt, floorplan notes payable, and interest rate swaps used to hedge future cash flows. Other than our subordinated notes andinterest rate swaps, the carrying amount of all significant financial instruments approximates fair value due either tolength of maturity or the existence of variable interest rates that approximate prevailing market rates. A summary ofthe fair value of the subordinated notes and interest rate swap, based on quoted market data, follows:
December 31,2006
December 31,2005
$300,000, 9.625% Senior Subordinated Notes due 2012 . . . . . . . . . . . . $316,050 $314,413
$375,000, 7.75% Senior Subordinated Notes due 2016 . . . . . . . . . . . . . 375,468 —
$375,000, 3.5% Senior Subordinated Convertible Notes due 2026 . . . . . 433,125 —
Interest rate swap. . . . . . . . . . . . . . . . . . . . . . . . . . . . . . . . . . . . . . . . . 1,369 4,660
Revenue Recognition
Vehicle, Parts and Service Sales
The Company records revenue when vehicles are delivered and title has passed to the customer, when vehicleservice or repair work is performed and when parts are delivered to the Company’s customers. Sales promotionsthat the Company offers to customers are accounted for as a reduction of revenue at the time of sale. Rebates andother incentives offered directly to the Company by manufacturers are recognized as earned.
Finance and Insurance Sales
Subsequent to the sale of the vehicle to a customer, the Company sells its credit contracts to various financialinstitutions on a non-recourse basis to mitigate the risk of default. The Company receives a commission equal toeither the difference between the interest rates charged to customers and the interest rates set by the financinginstitution or a flat fee. The Company also receives commissions for facilitating the sale of various third-partyinsurance products to customers, including credit and life insurance policies and extended service contracts. Thesecommissions are recorded as revenue at the time the customer enters into the contract. In the case of financecontracts, a customer may prepay or fail to pay their contract, thereby terminating the contract. Customers may alsoterminate extended service contracts and other insurance products, which are fully paid at purchase, and become
F-16
UNITED AUTO GROUP, INC.
NOTES TO CONSOLIDATED FINANCIAL STATEMENTS(In thousands, except per share amounts) — (Continued)

eligible for refunds of unused premiums. In these circumstances, a portion of the commissions the Companyreceived may be charged back based on the terms of the contracts. The revenue the Company records relating tothese transactions is net of an estimate of the amount of chargebacks the Company will be required to pay. Thisestimate is based upon the Company’s historical experience with similar contracts, including the impact ofrefinance and default rates on retail finance contracts and cancellation rates on extended service contracts and otherinsurance products.
Sales Tax
The Company excludes sales tax collected from customers and paid to taxing authorities from revenue.
Defined Contribution Plans
The Company sponsors a number of defined contribution plans covering a significant majority of theCompany’s employees. Company contributions to such plans are discretionary and are based on the level ofcompensation and contributions by plan participants. The Company incurred expense of $9,596, $8,315 and $7,484relating to such plans during the years ended December 31, 2006, 2005 and 2004, respectively.
Advertising
Advertising costs are expensed as incurred or when such advertising takes place. The Company incurred netadvertising costs of $86,734, $74,272 and $69,487 during the years ended December 31, 2006, 2005 and 2004,respectively. Qualified advertising expenditures reimbursed by manufacturers, which are treated as a reduction ofadvertising expense, were $8,123, $8,240 and $7,978 during the years ended December 31, 2006, 2005 and 2004,respectively.
Self Insurance
The Company retains risk relating to certain of its general liability insurance, workers’ compensationinsurance, a physical damage insurance, property insurance and employee medical benefits in the United States.As a result, the Company is likely to be responsible for a majority of the claims and losses incurred under theseprograms. The amount of risk retained varies by program, and, for certain exposures, the Company has pre-determined maximum exposure limits for certain individual claims and/or insurance periods. Losses, if any, abovethe pre-determined exposure limits are paid by third-party insurance carriers. The Company’s estimate of futurelosses is prepared by management using the Company’s historical loss experience and industry-based developmentfactors.
Earnings Per Share
Basic earnings per share is computed using income and the weighted average shares of voting common stockoutstanding. Diluted earnings per share is computed using income and the weighted average shares of votingcommon stock outstanding, adjusted for the dilutive effect of stock options and restricted stock. A reconciliation of
F-17
UNITED AUTO GROUP, INC.
NOTES TO CONSOLIDATED FINANCIAL STATEMENTS(In thousands, except per share amounts) — (Continued)

the number of shares used in the calculation of basic and diluted earnings per share for the years endedDecember 31, 2006, 2005 and 2004 follows:
2006 2005 2004Year Ended December 31,
Weighted average number of common shares outstanding. . . . . . . . . . . 93,393 92,832 89,920
Effect of stock options . . . . . . . . . . . . . . . . . . . . . . . . . . . . . . . . . . . . 425 820 890
Effect of restricted stock . . . . . . . . . . . . . . . . . . . . . . . . . . . . . . . . . . . 360 280 416
Weighted average number of common shares outstanding, includingeffect of dilutive securities. . . . . . . . . . . . . . . . . . . . . . . . . . . . . . . . 94,178 93,932 91,226
In addition, the Company has senior subordinated convertible notes outstanding which, under certaincircumstances discussed in Note 7, may be converted to voting common stock. As of December 31, 2006, novoting common shares were included in the calculation of diluted earnings per share because the effect of suchsecurities was not dilutive.
Hedging
SFAS No. 133, Accounting for Derivative Instruments and Hedging Activities, as amended and interpreted,establishes accounting and reporting standards for derivative instruments, including certain derivative instrumentsembedded in other contracts, and for hedging activities. Under SFAS No. 133, all derivatives, whether designated inhedging relationships or not, are required to be recorded on the balance sheet at fair value. SFAS No. 133 definesrequirements for designation and documentation of hedging relationships, as well as ongoing effectivenessassessments, which must be met in order to qualify for hedge accounting. For a derivative that does not qualifyas a hedge, changes in fair value are recorded in earnings immediately. If the derivative is designated in a fair-valuehedge, the changes in the fair value of the derivative and the hedged item are recorded in earnings. If the derivative isdesignated in a cash-flow hedge, effective changes in the fair value of the derivative are recorded in othercomprehensive income (loss) and recorded in the income statement when the hedged item affects earnings.Changes in the fair value of the derivative attributable to hedge ineffectiveness are recorded in earningsimmediately.
Stock-Based Compensation
The Company elected to adopt SFAS No. 123(R), “Share-Based Payment,” as amended and interpreted,effective July 1, 2005. The Company utilized the modified prospective method approach, pursuant to which theCompany has recorded compensation expense for all awards granted after July 1, 2005 based on their fair value.The Company’s share-based payments have generally been in the form of “non-vested shares”, the fair value ofwhich are measured as if they were vested and issued on the grant date.
Prior to July 1, 2005, the Company accounted for stock-based compensation using the intrinsic value methodpursuant to Accounting Principles Board (“APB”) Opinion No. 25, “Accounting for Stock Issued to Employees.”During that time, the Company followed the disclosure only provisions of SFAS No. 123, “Accounting for StockBased Compensation,” as interpreted and amended. As a result, no compensation expense was recorded withrespect to option grants. Had the Company elected to recognize compensation expense for option grants using thefair value method prior to July 1, 2005, the effect on net income and basic and diluted earnings per share would nothave been material for the years ended December 31, 2005 and 2004. See footnote 12 for a detailed description ofthe Company’s stock compensation plans.
F-18
UNITED AUTO GROUP, INC.
NOTES TO CONSOLIDATED FINANCIAL STATEMENTS(In thousands, except per share amounts) — (Continued)

New Accounting Pronouncements
FASB Interpretation (“FIN”) No. 48, “Accounting for Uncertainty in Income Taxes,” prescribes a recognitionthreshold and measurement attribute for the financial statement recognition and measurement of tax positions takenor expected to be taken in tax returns. The benefits of tax positions are recognized if it is more likely than not that theposition will be sustained upon examination by the taxing authorities, who it is presumed have full knowledge of allrelevant information. The amount recognized will be the largest amount of benefit that is greater than fifty percentlikely of being realized upon ultimate settlement. Companies will generally record the change in net assets thatresult from the application of FIN No. 48 as an adjustment to retained earnings. FIN No. 48 became effective for theCompany on January 1, 2007. The Company estimates that the adoption of FIN No. 48 will decrease retainedearnings as of January 1, 2007 by between $3.0 million and $7.0 million.
SFAS No. 157, “Fair Value Measurements” defines fair value, establishes a framework for measuring fairvalue in generally accepted accounting principles, and expands disclosure requirements relating to fair valuemeasurements. SFAS No. 157 will be effective for the Company on January 1, 2008. The Company is currentlyevaluating the impact of this pronouncement.
SFAS No. 159, “The Fair Value Option for Financial Assets and Financial Liabilities” permits entities tochoose to measure many financial instruments and certain other items at fair value and consequently reportunrealized gains and losses on such items in earnings. SFAS No. 159 will be effective for the Company on January 1,2008. The Company is currently evaluating the impact of this pronouncement.
2. Business Combinations
The Company acquired fifty four and eleven franchises during 2006 and 2005, respectively. The Company’sfinancial statements include the results of operations of the acquired dealerships from the date of acquisition.Purchase price allocations may be subject to final adjustment. Of the total amount allocated to intangible assets,approximately $98,000 and $31,000 is deductible for tax purposes as of December 31, 2006 and 2005, respectively.A summary of the aggregate purchase price allocations in each year follows:
2006 2005December 31,
Accounts receivable . . . . . . . . . . . . . . . . . . . . . . . . . . . . . . . . . . . . . . . . . . $ 24,171 $ 11,552
Inventory . . . . . . . . . . . . . . . . . . . . . . . . . . . . . . . . . . . . . . . . . . . . . . . . . . 165,504 66,970
Other current assets. . . . . . . . . . . . . . . . . . . . . . . . . . . . . . . . . . . . . . . . . . . 20,197 129
Property and equipment . . . . . . . . . . . . . . . . . . . . . . . . . . . . . . . . . . . . . . . 70,983 7,640
Goodwill . . . . . . . . . . . . . . . . . . . . . . . . . . . . . . . . . . . . . . . . . . . . . . . . . . 214,749 21,175
Franchise value . . . . . . . . . . . . . . . . . . . . . . . . . . . . . . . . . . . . . . . . . . . . . . 47,832 19,277
Other assets . . . . . . . . . . . . . . . . . . . . . . . . . . . . . . . . . . . . . . . . . . . . . . . . 12,637 12,646
Current liabilities . . . . . . . . . . . . . . . . . . . . . . . . . . . . . . . . . . . . . . . . . . . . (99,060) (7,210)
Non-current liabilities . . . . . . . . . . . . . . . . . . . . . . . . . . . . . . . . . . . . . . . . . (23,790) —
Total purchase price . . . . . . . . . . . . . . . . . . . . . . . . . . . . . . . . . . . . . . . . . . 433,223 132,179
Seller financed/assumed debt . . . . . . . . . . . . . . . . . . . . . . . . . . . . . . . . . . . . (64,168) (5,300)
Cash used in dealership acquisitions . . . . . . . . . . . . . . . . . . . . . . . . . . . . . . $369,055 $126,879
The following unaudited consolidated pro forma results of operations of the Company for the years endedDecember 31, 2006 and 2005 give effect to acquisitions consummated during 2006 and 2005 as if they had occurredon January 1, 2005.
F-19
UNITED AUTO GROUP, INC.
NOTES TO CONSOLIDATED FINANCIAL STATEMENTS(In thousands, except per share amounts) — (Continued)
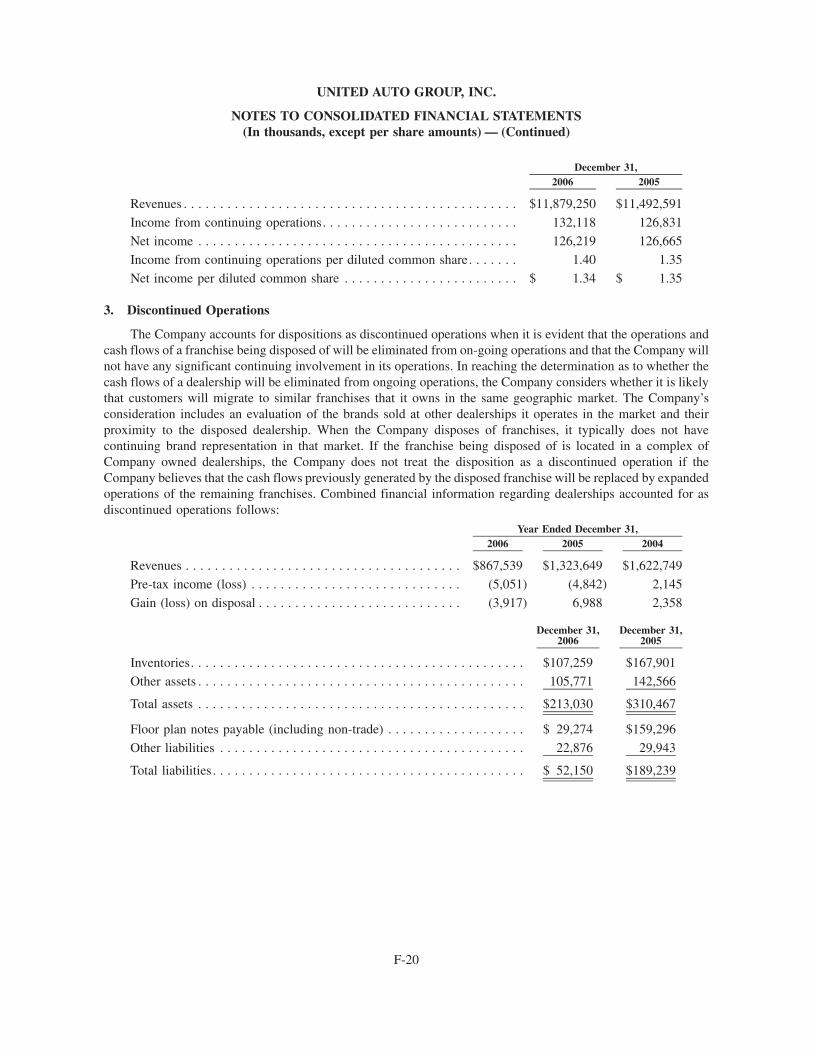
2006 2005December 31,
Revenues . . . . . . . . . . . . . . . . . . . . . . . . . . . . . . . . . . . . . . . . . . . . . . $11,879,250 $11,492,591
Income from continuing operations. . . . . . . . . . . . . . . . . . . . . . . . . . . 132,118 126,831
Net income . . . . . . . . . . . . . . . . . . . . . . . . . . . . . . . . . . . . . . . . . . . . 126,219 126,665
Income from continuing operations per diluted common share. . . . . . . 1.40 1.35
Net income per diluted common share . . . . . . . . . . . . . . . . . . . . . . . . $ 1.34 $ 1.35
3. Discontinued Operations
The Company accounts for dispositions as discontinued operations when it is evident that the operations andcash flows of a franchise being disposed of will be eliminated from on-going operations and that the Company willnot have any significant continuing involvement in its operations. In reaching the determination as to whether thecash flows of a dealership will be eliminated from ongoing operations, the Company considers whether it is likelythat customers will migrate to similar franchises that it owns in the same geographic market. The Company’sconsideration includes an evaluation of the brands sold at other dealerships it operates in the market and theirproximity to the disposed dealership. When the Company disposes of franchises, it typically does not havecontinuing brand representation in that market. If the franchise being disposed of is located in a complex ofCompany owned dealerships, the Company does not treat the disposition as a discontinued operation if theCompany believes that the cash flows previously generated by the disposed franchise will be replaced by expandedoperations of the remaining franchises. Combined financial information regarding dealerships accounted for asdiscontinued operations follows:
2006 2005 2004Year Ended December 31,
Revenues . . . . . . . . . . . . . . . . . . . . . . . . . . . . . . . . . . . . . . $867,539 $1,323,649 $1,622,749
Pre-tax income (loss) . . . . . . . . . . . . . . . . . . . . . . . . . . . . . (5,051) (4,842) 2,145
Gain (loss) on disposal . . . . . . . . . . . . . . . . . . . . . . . . . . . . (3,917) 6,988 2,358
December 31,2006
December 31,2005
Inventories. . . . . . . . . . . . . . . . . . . . . . . . . . . . . . . . . . . . . . . . . . . . . . $107,259 $167,901
Other assets . . . . . . . . . . . . . . . . . . . . . . . . . . . . . . . . . . . . . . . . . . . . . 105,771 142,566
Total assets . . . . . . . . . . . . . . . . . . . . . . . . . . . . . . . . . . . . . . . . . . . . . $213,030 $310,467
Floor plan notes payable (including non-trade) . . . . . . . . . . . . . . . . . . . $ 29,274 $159,296
Other liabilities . . . . . . . . . . . . . . . . . . . . . . . . . . . . . . . . . . . . . . . . . . 22,876 29,943
Total liabilities . . . . . . . . . . . . . . . . . . . . . . . . . . . . . . . . . . . . . . . . . . . $ 52,150 $189,239
F-20
UNITED AUTO GROUP, INC.
NOTES TO CONSOLIDATED FINANCIAL STATEMENTS(In thousands, except per share amounts) — (Continued)
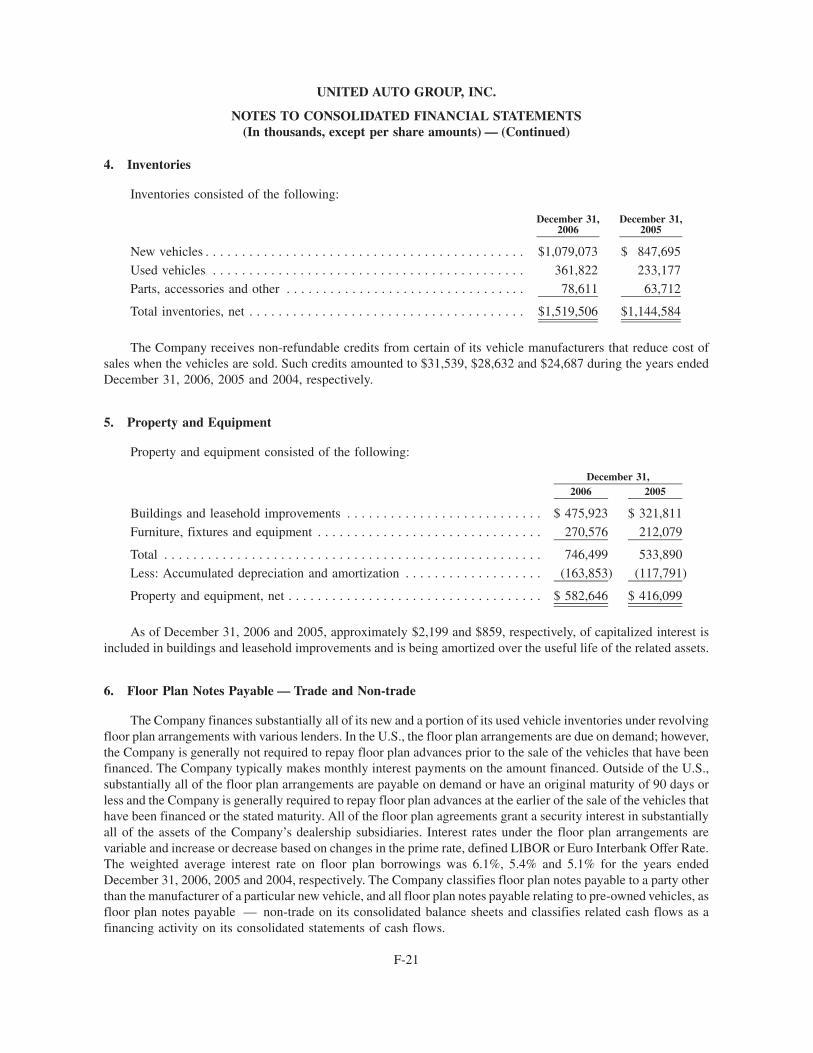
4. Inventories
Inventories consisted of the following:
December 31,2006
December 31,2005
New vehicles . . . . . . . . . . . . . . . . . . . . . . . . . . . . . . . . . . . . . . . . . . . . $1,079,073 $ 847,695
Used vehicles . . . . . . . . . . . . . . . . . . . . . . . . . . . . . . . . . . . . . . . . . . . 361,822 233,177Parts, accessories and other . . . . . . . . . . . . . . . . . . . . . . . . . . . . . . . . . 78,611 63,712
Total inventories, net . . . . . . . . . . . . . . . . . . . . . . . . . . . . . . . . . . . . . . $1,519,506 $1,144,584
The Company receives non-refundable credits from certain of its vehicle manufacturers that reduce cost ofsales when the vehicles are sold. Such credits amounted to $31,539, $28,632 and $24,687 during the years endedDecember 31, 2006, 2005 and 2004, respectively.
5. Property and Equipment
Property and equipment consisted of the following:
2006 2005December 31,
Buildings and leasehold improvements . . . . . . . . . . . . . . . . . . . . . . . . . . . $ 475,923 $ 321,811
Furniture, fixtures and equipment . . . . . . . . . . . . . . . . . . . . . . . . . . . . . . . 270,576 212,079
Total . . . . . . . . . . . . . . . . . . . . . . . . . . . . . . . . . . . . . . . . . . . . . . . . . . . . 746,499 533,890
Less: Accumulated depreciation and amortization . . . . . . . . . . . . . . . . . . . (163,853) (117,791)
Property and equipment, net . . . . . . . . . . . . . . . . . . . . . . . . . . . . . . . . . . . $ 582,646 $ 416,099
As of December 31, 2006 and 2005, approximately $2,199 and $859, respectively, of capitalized interest isincluded in buildings and leasehold improvements and is being amortized over the useful life of the related assets.
6. Floor Plan Notes Payable — Trade and Non-trade
The Company finances substantially all of its new and a portion of its used vehicle inventories under revolvingfloor plan arrangements with various lenders. In the U.S., the floor plan arrangements are due on demand; however,the Company is generally not required to repay floor plan advances prior to the sale of the vehicles that have beenfinanced. The Company typically makes monthly interest payments on the amount financed. Outside of the U.S.,substantially all of the floor plan arrangements are payable on demand or have an original maturity of 90 days orless and the Company is generally required to repay floor plan advances at the earlier of the sale of the vehicles thathave been financed or the stated maturity. All of the floor plan agreements grant a security interest in substantiallyall of the assets of the Company’s dealership subsidiaries. Interest rates under the floor plan arrangements arevariable and increase or decrease based on changes in the prime rate, defined LIBOR or Euro Interbank Offer Rate.The weighted average interest rate on floor plan borrowings was 6.1%, 5.4% and 5.1% for the years endedDecember 31, 2006, 2005 and 2004, respectively. The Company classifies floor plan notes payable to a party otherthan the manufacturer of a particular new vehicle, and all floor plan notes payable relating to pre-owned vehicles, asfloor plan notes payable — non-trade on its consolidated balance sheets and classifies related cash flows as afinancing activity on its consolidated statements of cash flows.
F-21
UNITED AUTO GROUP, INC.
NOTES TO CONSOLIDATED FINANCIAL STATEMENTS(In thousands, except per share amounts) — (Continued)

7. Long-Term Debt
Long-term debt consisted of the following:
December 31,2006
December 31,2005
U.S. Credit Agreement . . . . . . . . . . . . . . . . . . . . . . . . . . . . . . . . . . . . . $ — $272,000
U.K. Credit Agreement . . . . . . . . . . . . . . . . . . . . . . . . . . . . . . . . . . . . 117,544 —
9.625% Senior Subordinated Notes due 2012 . . . . . . . . . . . . . . . . . . . . 300,000 300,000
7.75% Senior Subordinated Notes due 2016 . . . . . . . . . . . . . . . . . . . . . 375,000 —
3.5% Senior Subordinated Convertible Notes due 2026 . . . . . . . . . . . . . 375,000 —
Other . . . . . . . . . . . . . . . . . . . . . . . . . . . . . . . . . . . . . . . . . . . . . . . . . . 14,507 8,241
Total long-term debt . . . . . . . . . . . . . . . . . . . . . . . . . . . . . . . . . . . . . 1,182,051 580,241
Less: current portion. . . . . . . . . . . . . . . . . . . . . . . . . . . . . . . . . . . (13,385) (3,551)
Net long-term debt . . . . . . . . . . . . . . . . . . . . . . . . . . . . . . . . . . . . . . $1,168,666 $576,690
Scheduled maturities of long-term debt for each of the next five years and thereafter are as follows:
2007 . . . . . . . . . . . . . . . . . . . . . . . . . . . . . . . . . . . . . . . . . . . . . . . . . . . . . . . . . . . . . . $ 13,385
2008 . . . . . . . . . . . . . . . . . . . . . . . . . . . . . . . . . . . . . . . . . . . . . . . . . . . . . . . . . . . . . . 24,499
2009 . . . . . . . . . . . . . . . . . . . . . . . . . . . . . . . . . . . . . . . . . . . . . . . . . . . . . . . . . . . . . . 13,971
2010 . . . . . . . . . . . . . . . . . . . . . . . . . . . . . . . . . . . . . . . . . . . . . . . . . . . . . . . . . . . . . . 14,290
2011 . . . . . . . . . . . . . . . . . . . . . . . . . . . . . . . . . . . . . . . . . . . . . . . . . . . . . . . . . . . . . . 65,906
2012 and thereafter . . . . . . . . . . . . . . . . . . . . . . . . . . . . . . . . . . . . . . . . . . . . . . . . . . . 1,050,000
Total long-term debt . . . . . . . . . . . . . . . . . . . . . . . . . . . . . . . . . . . . . . . . . . . . . . . . $1,182,051
U.S. Credit Agreement
As of December 31, 2006, the Company is party to a credit agreement with DaimlerChrysler FinancialServices Americas LLC and Toyota Motor Credit Corporation, as amended (the “U.S. Credit Agreement”), whichprovided for up to $600,000 in revolving loans for working capital, acquisitions, capital expenditures, investmentsand for other general corporate purposes, and for an additional $50,000 of availability for letters of credit, throughSeptember 30, 2009. The revolving loans bear interest between defined LIBOR plus 2.50% and defined LIBORplus 3.50%.
The U.S. Credit Agreement is fully and unconditionally guaranteed on a joint and several basis by theCompany’s domestic subsidiaries and contains a number of significant covenants that, among other things, restrictthe Company’s ability to dispose of assets, incur additional indebtedness, repay other indebtedness, pay dividends,create liens on assets, make investments or acquisitions and engage in mergers or consolidations. The Company isalso required to comply with specified financial and other tests and ratios, each as defined in the U.S. CreditAgreement, including: a ratio of current assets to current liabilities, a fixed charge coverage ratio, a ratio of debt tostockholders’ equity, a ratio of debt to earnings before interest, taxes, depreciation and amortization (“EBITDA”), aratio of domestic debt to domestic EBITDA, and a measurement of stockholders’ equity. A breach of theserequirements would give rise to certain remedies under the agreement, the most severe of which is the terminationof the agreement and acceleration of the amounts owed. As of December 31, 2006, the Company was in compliancewith all covenants under the U.S. Credit Agreement.
F-22
UNITED AUTO GROUP, INC.
NOTES TO CONSOLIDATED FINANCIAL STATEMENTS(In thousands, except per share amounts) — (Continued)
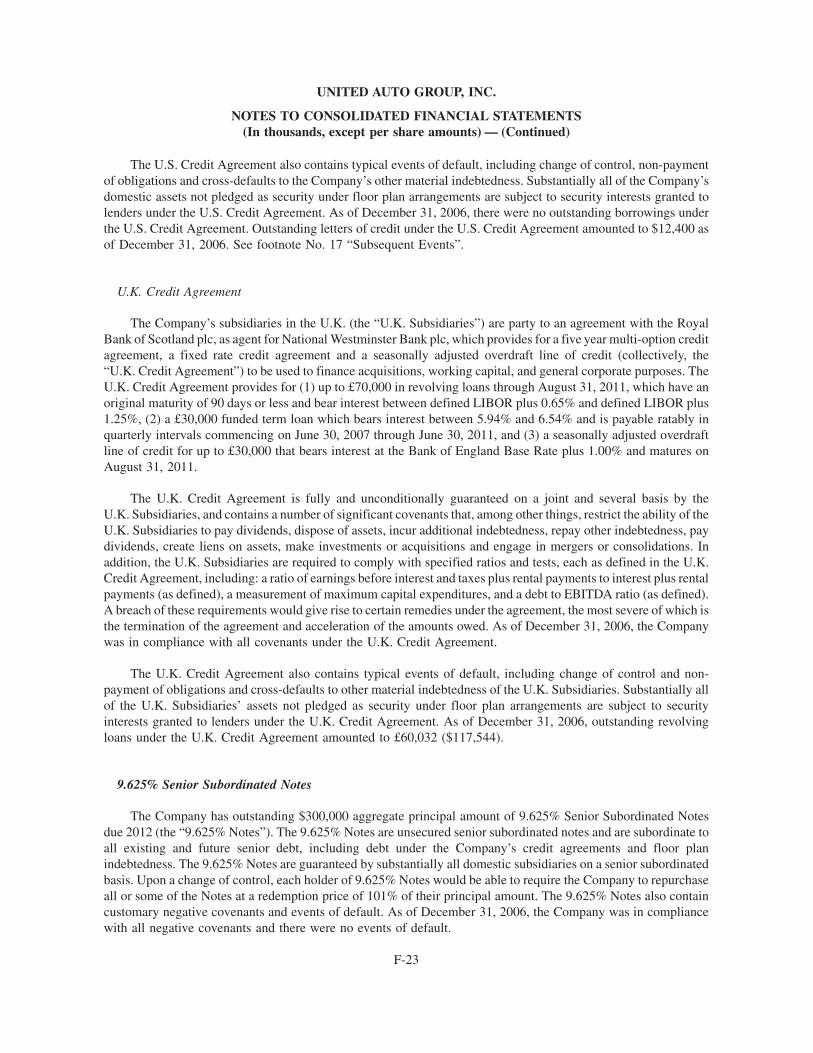
The U.S. Credit Agreement also contains typical events of default, including change of control, non-paymentof obligations and cross-defaults to the Company’s other material indebtedness. Substantially all of the Company’sdomestic assets not pledged as security under floor plan arrangements are subject to security interests granted tolenders under the U.S. Credit Agreement. As of December 31, 2006, there were no outstanding borrowings underthe U.S. Credit Agreement. Outstanding letters of credit under the U.S. Credit Agreement amounted to $12,400 asof December 31, 2006. See footnote No. 17 “Subsequent Events”.
U.K. Credit Agreement
The Company’s subsidiaries in the U.K. (the “U.K. Subsidiaries”) are party to an agreement with the RoyalBank of Scotland plc, as agent for National Westminster Bank plc, which provides for a five year multi-option creditagreement, a fixed rate credit agreement and a seasonally adjusted overdraft line of credit (collectively, the“U.K. Credit Agreement”) to be used to finance acquisitions, working capital, and general corporate purposes. TheU.K. Credit Agreement provides for (1) up to £70,000 in revolving loans through August 31, 2011, which have anoriginal maturity of 90 days or less and bear interest between defined LIBOR plus 0.65% and defined LIBOR plus1.25%, (2) a £30,000 funded term loan which bears interest between 5.94% and 6.54% and is payable ratably inquarterly intervals commencing on June 30, 2007 through June 30, 2011, and (3) a seasonally adjusted overdraftline of credit for up to £30,000 that bears interest at the Bank of England Base Rate plus 1.00% and matures onAugust 31, 2011.
The U.K. Credit Agreement is fully and unconditionally guaranteed on a joint and several basis by theU.K. Subsidiaries, and contains a number of significant covenants that, among other things, restrict the ability of theU.K. Subsidiaries to pay dividends, dispose of assets, incur additional indebtedness, repay other indebtedness, paydividends, create liens on assets, make investments or acquisitions and engage in mergers or consolidations. Inaddition, the U.K. Subsidiaries are required to comply with specified ratios and tests, each as defined in the U.K.Credit Agreement, including: a ratio of earnings before interest and taxes plus rental payments to interest plus rentalpayments (as defined), a measurement of maximum capital expenditures, and a debt to EBITDA ratio (as defined).A breach of these requirements would give rise to certain remedies under the agreement, the most severe of which isthe termination of the agreement and acceleration of the amounts owed. As of December 31, 2006, the Companywas in compliance with all covenants under the U.K. Credit Agreement.
The U.K. Credit Agreement also contains typical events of default, including change of control and non-payment of obligations and cross-defaults to other material indebtedness of the U.K. Subsidiaries. Substantially allof the U.K. Subsidiaries’ assets not pledged as security under floor plan arrangements are subject to securityinterests granted to lenders under the U.K. Credit Agreement. As of December 31, 2006, outstanding revolvingloans under the U.K. Credit Agreement amounted to £60,032 ($117,544).
9.625% Senior Subordinated Notes
The Company has outstanding $300,000 aggregate principal amount of 9.625% Senior Subordinated Notesdue 2012 (the “9.625% Notes”). The 9.625% Notes are unsecured senior subordinated notes and are subordinate toall existing and future senior debt, including debt under the Company’s credit agreements and floor planindebtedness. The 9.625% Notes are guaranteed by substantially all domestic subsidiaries on a senior subordinatedbasis. Upon a change of control, each holder of 9.625% Notes would be able to require the Company to repurchaseall or some of the Notes at a redemption price of 101% of their principal amount. The 9.625% Notes also containcustomary negative covenants and events of default. As of December 31, 2006, the Company was in compliancewith all negative covenants and there were no events of default.
F-23
UNITED AUTO GROUP, INC.
NOTES TO CONSOLIDATED FINANCIAL STATEMENTS(In thousands, except per share amounts) — (Continued)
7.75% Senior Subordinated Notes
On December 4, 2006 the Company issued $375,000 aggregate principle amount of 7.75% Senior Subor-dinated Notes (the “7.75% Notes”) due 2016. The 7.75% Notes are unsecured senior subordinated notes and aresubordinate to all existing and future senior debt, including debt under the Company’s credit agreements and floorplan indebtedness. The 7.75% Notes are guaranteed by substantially all domestic subsidiaries on a seniorsubordinated basis. The Company can redeem all or some of the 7.75% Notes at its option beginning in December2011 at specified redemption prices, or prior to December 2011 at 100% of the principal amount of the notes plus anapplicable “make-whole” premium, as defined. In addition, the Company may redeem up to 40% of the7.75% Notes at specified redemption prices using the proceeds of certain equity offerings before December 15,2009. Upon certain sales of assets or specific kinds of changes of control the Company is required to make an offerto purchase the 7.75% Notes. The 7.75% Notes also contain customary negative covenants and events of default. Asof December 31, 2006, the Company was in compliance with all negative covenants and there were no events ofdefault.
The Company entered into a registration rights agreement with the initial purchasers of the 7.75% Notes underwhich the Company agreed to file with the Securities and Exchange Commission a registration statement to allowholders to exchange the 7.75% Notes for registered notes having substantially the same terms. The Company willuse its commercially reasonable efforts to cause such registration statement to become effective and to complete theexchange offer within 240 days after the original issuance of the 7.75% Notes. The Company will be required to payadditional interest, subject to some limitations, to the holders of the 7.75% Notes if it fails to comply with theseobligations or the registration statement ceases to be effective or fails to be usable for certain periods of time, ineach case subject to certain exceptions outlined in the registration rights agreement.
Senior Subordinated Convertible Notes
On January 31, 2006, the Company issued $375,000 aggregate principle amount of 3.50% senior subordinatedconvertible notes due 2026 (the “Convertible Notes”). The Convertible Notes mature on April 1, 2026, unlessearlier converted, redeemed or purchased by the Company. The Convertible Notes are unsecured senior subor-dinated obligations and are guaranteed on an unsecured senior subordinated basis by substantially all of theCompany’s wholly owned domestic subsidiaries. The Convertible Notes also contain customary negative covenantsand events of default. As of December 31, 2006, the Company was in compliance with all negative covenants andthere were no events of default.
Holders may convert based on a conversion rate of 42.2052 shares of the Company’s common stock per $1,000principal amount of the Convertible Notes (which is equal to a conversion price of approximately $23.69 per share),subject to adjustment, only under the following circumstances: (1) for any quarterly period, the closing price of theCompany’s common stock for twenty of the last thirty trading days in the prior quarter exceeded $28.43 (subject toadjustment), (2) for specified periods, the trading price of the Convertible Notes falls below specific thresholds,(3) if the Convertible Notes are called for redemption, (4) if specified distributions to holders of the Company’scommon stock are made or specified corporate transactions occur, (5) if a fundamental change (as defined) occurs,or (6) during the ten trading days prior to, but excluding, the maturity date.
Upon conversion of the Convertible Notes, for each $1,000 principal amount of the Convertible Notes, a holderwill receive an amount in cash, in lieu of shares of the Company’s common stock, equal to the lesser of (i) $1,000 or(ii) the conversion value, determined in the manner set forth in the indenture covering the Convertible Notes, of thenumber of shares of the Company’s common stock equal to the conversion rate. If the conversion value exceeds$1,000, we will also deliver, at our election, cash, common stock or a combination of cash and common stock withrespect to the remaining value deliverable upon conversion.
F-24
UNITED AUTO GROUP, INC.
NOTES TO CONSOLIDATED FINANCIAL STATEMENTS(In thousands, except per share amounts) — (Continued)

If a holder elects to convert its Convertible Notes in connection with certain events that constitute a change ofcontrol on or before April 6, 2011, the Company will pay, to the extent described in the related indenture, a make-whole premium by increasing the conversion rate applicable to such Convertible Notes. In addition, the Companywill pay contingent interest in cash, commencing with any six-month period beginning on April 1, 2011, if theaverage trading price of a Convertible Note for the five trading days ending on the third trading day immediatelypreceding the first day of that six-month period equals 120% or more of the principal amount of the ConvertibleNote.
On or after April 6, 2011, the Company may redeem the Convertible Notes, in whole at any time or in part fromtime to time, for cash at a redemption price of 100% of the principal amount of the Convertible Notes to beredeemed, plus any accrued and unpaid interest to the applicable redemption date. Holders of the Convertible Notesmay require the Company to purchase all or a portion of their Convertible Notes for cash on each of April 1, 2011,April 1, 2016 and April 1, 2021 at a purchase price equal to 100% of the principal amount of the Convertible Notesto be purchased, plus accrued and unpaid interest, if any, to the applicable purchase date.
8. Interest Rate Swaps
The Company is party to an interest rate swap agreement through January 2008, pursuant to which a notional$200,000 of its U.S. floating rate debt was exchanged for fixed rate debt. The swap was designated as a cash flowhedge of future interest payments of the LIBOR based U.S. floor plan borrowings. As of December 31, 2006, theCompany expects approximately $783 associated with the swap to be recognized as a reduction of interest expenseover the next twelve months.
9. Off-Balance Sheet Arrangements
The Convertible Notes are convertible into shares of the Company’s common stock, at the option of the holder,based on certain conditions described above. Certain of these conditions are linked to the market value of thecommon stock. This type of financing arrangement was selected in order to achieve a more favorable interest rate(as opposed to other forms of available financing). Since the Company or the holders of the Convertible Notes canredeem these notes on or after April, 2011, a conversion or a redemption of these notes is likely to occur in 2011.The repayment will include cash for the principal amount of the Convertible Notes then outstanding plus an amountpayable in either cash or stock, at the Company’s option, depending on the trading price of the common stock.
10. Commitments and Contingent Liabilities
The Company is involved in litigation which may relate to issues with customers, employment related matters,class action claims, purported class action claims, and claims brought by governmental authorities. As ofDecember 31, 2006, the Company is not party to any legal proceedings, including class action lawsuits to whichit is a party, that, individually or in the aggregate, are reasonably expected to have a material adverse effect on theCompany’s results of operations, financial condition or cash flows. However, the results of these matters cannot bepredicted with certainty, and an unfavorable resolution of one or more of these matters could have a materialadverse effect on the Company’s results of operations, financial condition or cash flows.
The Company is party to a joint venture agreement with respect to one of the Company’s franchises pursuant towhich the Company is required to repurchase its partner’s interest in July 2008. The Company expects this paymentto be approximately $4.0 million.
The Company typically leases its dealership facilities and corporate offices under non-cancelable operatinglease agreements with expiration dates through 2062, including all option periods available to the Company. TheCompany’s lease arrangements typically allow for a base term with options for extension in the Company’s favorand include escalation clauses tied to the Consumer Price Index.
F-25
UNITED AUTO GROUP, INC.
NOTES TO CONSOLIDATED FINANCIAL STATEMENTS(In thousands, except per share amounts) — (Continued)

Minimum future rental payments required under non-cancelable operating leases in effect as of December 31,2006 are as follows:
2007 . . . . . . . . . . . . . . . . . . . . . . . . . . . . . . . . . . . . . . . . . . . . . . . . . . . . . . . . . . . . . . $ 164,358
2008 . . . . . . . . . . . . . . . . . . . . . . . . . . . . . . . . . . . . . . . . . . . . . . . . . . . . . . . . . . . . . . 160,670
2009 . . . . . . . . . . . . . . . . . . . . . . . . . . . . . . . . . . . . . . . . . . . . . . . . . . . . . . . . . . . . . . 158,226
2010 . . . . . . . . . . . . . . . . . . . . . . . . . . . . . . . . . . . . . . . . . . . . . . . . . . . . . . . . . . . . . . 157,236
2011 . . . . . . . . . . . . . . . . . . . . . . . . . . . . . . . . . . . . . . . . . . . . . . . . . . . . . . . . . . . . . . 155,903
2012 and thereafter . . . . . . . . . . . . . . . . . . . . . . . . . . . . . . . . . . . . . . . . . . . . . . . . . . . 3,173,664
$3,970,057
Rent expense for the years ended December 31, 2006, 2005 and 2004 amounted to $135,253, $109,715 and$85,471, respectively. A number of the dealership leases are with former owners who continue to operate thedealerships as employees of the Company or with other affiliated entities. Of the total rental payments, $9,856,$10,206 and $10,739, respectively, were made to related parties during 2006, 2005, and 2004, respectively (SeeNote 11).
11. Related Party Transactions
The Company currently is a tenant under a number of non-cancelable lease agreements with AutomotiveGroup Realty, LLC and its subsidiaries (together “AGR”), which are subsidiaries of Penske Corporation. During theyears ended December 31, 2006, 2005 and 2004, the Company paid $4,160, $4,700 and $5,590, respectively, toAGR under these lease agreements. From time to time, we may sell AGR real property and improvements that aresubsequently leased by AGR to us. In addition, we may purchase real property or improvements from AGR which,in some instances, occur via the purchase of the equity interest of a corporate entity. Each of these transactions isvalued at a price that is independently confirmed. During the years ended December 31, 2006, 2005 and 2004, theCompany sold AGR real property and/or improvements for $132, $43,874 and $30,800, respectively, which weresubsequently leased by AGR to the Company. There were no gains or losses associated with such sales. During theyear ended December 31, 2006, the Company purchased $25,630 of real property and improvements from AGR.
The Company sometimes pays to and/or receives fees from Penske Corporation and its affiliates for servicesrendered in the normal course of business, or to reimburse payments made to third parties on each others’ behalf.These transactions and those relating to AGR mentioned above, reflect the provider’s cost or an amount mutuallyagreed upon by both parties. During the years ended December 31, 2006, 2005 and 2004, Penske Corporation andits affiliates billed the Company $5,396, $6,108 and $5,784, respectively, and the Company billed PenskeCorporation and its affiliates $223, $96 and $77, respectively, for such services. As of December 31, 2006 and2005, the Company had $10 and $23 of receivables from and $824 and $167 of payables to Penske Corporation andits subsidiaries, respectively.
The Company and Penske Corporation have entered into a joint insurance agreement which provides that, withrespect to joint insurance policies (which includes the Company’s property policy), available coverage with respectto a loss shall be paid to each party as stipulated in the policies. In the event of losses by the Company and PenskeCorporation in excess of the limit of any policy during a policy period, the total policy proceeds shall be allocatedbased on the ratio of premiums paid.
The Company is also currently a tenant under a number of non-cancelable lease agreements with formerowners who continue to operate the dealerships as employees of the Company or with other affiliated entities. Anumber of the lease agreements are with Samuel X. DiFeo and members of his family. Mr. DiFeo served as theCompany’s President and Chief Operating Officer until March 8, 2006. In each of the years ended December 31,
F-26
UNITED AUTO GROUP, INC.
NOTES TO CONSOLIDATED FINANCIAL STATEMENTS(In thousands, except per share amounts) — (Continued)

2006, 2005 and 2004, the Company paid approximately $5,700, $5,500 and $5,500 to Mr. DiFeo and his familyunder these lease agreements.
From time to time the Company enters into joint venture relationships in the ordinary course of business,pursuant to which it acquires dealerships together with other investors. The Company may also provide theseventures with working capital and other debt financing at costs that are based on the Company’s incrementalborrowing rate. As of December 31, 2006, the Company’s joint venture relationships are as follows:
Location DealershipsOwnership
Interest
Fairfield, Connecticut . . . . . . . . . . . . . . . . . . . . Mercedes-Benz, Audi, Porsche 91.70%(A)(B)
Edison, New Jersey . . . . . . . . . . . . . . . . . . . . . . Ferrari, Maserati 70.00%(B)
Tysons Corner, Virginia . . . . . . . . . . . . . . . . . . Aston Martin, Audi, Maybach, 90.00%(B)(C)
Mercedes-Benz, Porsche
Las Vegas, Nevada . . . . . . . . . . . . . . . . . . . . . . Ferrari, Maserati 50.00%(D)
Mentor, Ohio . . . . . . . . . . . . . . . . . . . . . . . . . . Honda 75.00%(B)
Munich, Germany . . . . . . . . . . . . . . . . . . . . . . . BMW, MINI 50.00%(D)
Frankfurt, Germany . . . . . . . . . . . . . . . . . . . . . . Lexus, Toyota 50.00%(D)
Achen, Germany . . . . . . . . . . . . . . . . . . . . . . . . Audi, Lexus, Toyota, Volkswagen 50.00%(D)
Mexico . . . . . . . . . . . . . . . . . . . . . . . . . . . . . . . Toyota 48.70%(D)
Mexico . . . . . . . . . . . . . . . . . . . . . . . . . . . . . . . Toyota 45.00%(D)
(A) An entity controlled by one of the Company’s directors (the “Investor”), owns an 8.3% interest in this jointventure which entitles the Investor to 20% of the operating profits of the joint venture. In addition, the Investorhas an option to purchase up to a 20% interest in the joint venture for specified amounts.
(B) Entity is consolidated in the Company’s financial statements.
(C) Roger S. Penske, Jr. owns a 10% interest in this joint venture.
(D) Entity is accounted for using the equity method of accounting.
12. Stock-Based Compensation
Key employees, outside directors, consultants and advisors of the Company are eligible to receive stock-basedcompensation pursuant to the terms of the Company’s 2002 Equity Compensation Plan (the “Plan”). The Planoriginally allowed for the issuance of 4,200 shares for stock options, stock appreciation rights, restricted stock,restricted stock units, performance shares and other awards. As of December 31, 2006, 2,983 shares of commonstock were available for grant under the Plan. The compensation cost related to the Plan was $3,610, $3,217, and$2,813 during the years ended December 31, 2006, 2005 and 2004, respectively.
Restricted Stock
During 2006, 2005 and 2004, the Company granted 245, 362 and 306 shares, respectively, of restrictedcommon stock at no cost to participants under the Plan. The restricted stock entitles the participants to vote theirrespective shares and receive dividends. The shares are subject to forfeiture and are non-transferable, whichrestrictions lapse over a four year period from the grant date. The grant date quoted market price of the underlyingcommon stock is amortized to expense over the restriction period. As of December 31, 2006, there was $8,113 oftotal unrecognized compensation cost related to the restricted stock. That cost is expected to be recognized over thenext 3.5 years.
F-27
UNITED AUTO GROUP, INC.
NOTES TO CONSOLIDATED FINANCIAL STATEMENTS(In thousands, except per share amounts) — (Continued)

Presented below is a summary of the status of the Company’s restricted stock as of December 31, 2005 andchanges during the year ended December 31, 2006:
SharesWeighted Average
Grant-Date Fair Value Intrinsic Value
January 1, 2006. . . . . . . . . . . . . . . . . . . . . . . . . . . . . 793 $14.39 $15,200
Granted . . . . . . . . . . . . . . . . . . . . . . . . . . . . . . . . . . 245 21.67
Vested . . . . . . . . . . . . . . . . . . . . . . . . . . . . . . . . . . . (346) 13.63
Forfeited . . . . . . . . . . . . . . . . . . . . . . . . . . . . . . . . . . (18) 16.00
December 31, 2006 . . . . . . . . . . . . . . . . . . . . . . . . . . 674 $17.38 $15,900
Stock Options
The Company granted options to purchase 30 and 11 shares of common stock to participants under the Planduring 2005 and 2004, respectively. The options generally vested over a three year period and had a maximum termof ten years. The Company did not grant any options to purchase shares of common stock during 2006. The fairvalue of each grant was calculated with the following weighted average assumptions:
2005 2004
Expected dividend yield. . . . . . . . . . . . . . . . . . . . . . . . . . . . . . . . . . . . . . . . 1.3% 1.6%
Risk free interest rates . . . . . . . . . . . . . . . . . . . . . . . . . . . . . . . . . . . . . . . . . 4.00% 3.50%
Expected life . . . . . . . . . . . . . . . . . . . . . . . . . . . . . . . . . . . . . . . . . . . . . . . . 5.0 years 5.0 years
Expected volatility . . . . . . . . . . . . . . . . . . . . . . . . . . . . . . . . . . . . . . . . . . . . 33.00% 24.00%
The weighted average fair value of options granted was $9.35 and $5.67 per share, for the years endedDecember 31, 2005 and 2004, respectively.
Presented below is a summary of the status of stock options held by eligible employees during 2006, 2005 and2004:
Stock Options Shares
WeightedAverageExercise
Price Shares
WeightedAverageExercise
Price Shares
WeightedAverageExercise
Price
2006 2005 2004
Options outstanding at beginning of year . . . . . . . 1,406 $8.20 1,884 $ 8.17 3,012 $ 7.15
Granted . . . . . . . . . . . . . . . . . . . . . . . . . . . . . . . — — 30 14.86 11 12.35
Exercised . . . . . . . . . . . . . . . . . . . . . . . . . . . . . . 673 7.98 469 8.56 1,116 5.40
Forfeited . . . . . . . . . . . . . . . . . . . . . . . . . . . . . . — — 39 8.14 23 7.09
Options outstanding at end of year . . . . . . . . . . . 733 $8.40 1,406 $ 8.20 1,884 $ 8.17
F-28
UNITED AUTO GROUP, INC.
NOTES TO CONSOLIDATED FINANCIAL STATEMENTS(In thousands, except per share amounts) — (Continued)

The following table summarizes the status of stock options outstanding and exercisable for the year endedDecember 31, 2006:
Range of Exercise Prices
StockOptions
Outstanding
WeightedAverage
RemainingContractual Life
WeightedAverageExercise
Price
StockOptions
Exercisable
WeightedAverageExercise
Price
$3 to $6. . . . . . . . . . . . . . . . . . . . . . . . . . . 248 3.8 $ 4.80 248 $ 4.80
6 to 16 . . . . . . . . . . . . . . . . . . . . . . . . . . . 485 4.5 10.24 485 10.24
733 733
During 2006, 800 options to purchase common stock with an exercise price of $5.00 per share were exercisedthat were issued outside of the Plan in 1999. As of December 31, 2006, no options issued outside of the Plan wereoutstanding.
13. Stockholders’ Equity
Accumulated Other Comprehensive Income (Loss)
The components of accumulated other comprehensive income (loss), net of tax, follow:
CurrencyTranslation
UnrealizedAppreciationof Investment Other
AccumulatedOther
ComprehensiveIncome (Loss)
Balance at December 31, 2003 . . . . . . . . . . . $ 38,065 $ 5,718 $(7,468) $ 36,315
Change . . . . . . . . . . . . . . . . . . . . . . . . . . . 26,284 (5,718) 582 21,148
Balance at December 31, 2004 . . . . . . . . . . . 64,349 — (6,886) 57,463
Change . . . . . . . . . . . . . . . . . . . . . . . . . . . (39,473) — 3,840 (35,633)
Balance at December 31, 2005 . . . . . . . . . . . 24,876 — (3,046) 21,830
Change . . . . . . . . . . . . . . . . . . . . . . . . . . . 53,420 — 4,129 57,549
Balance at December 31, 2006 . . . . . . . . . . . $ 78,296 $ — $ 1,083 $ 79,379
Other Transactions
On March 26, 2004, the Company sold an aggregate of 8,100 shares of common stock to Mitsui & Co., Ltd.and Mitsui & Co. (U.S.A.), Inc. for $119,435, or $14.75 per share. The proceeds of the sale were used for generalcorporate purposes, which included reducing outstanding indebtedness under the Company’s credit agreements.
On January 26, 2006, the Company repurchased 1,000 shares of our outstanding common stock for $18,960, or$18.96 per share.
F-29
UNITED AUTO GROUP, INC.
NOTES TO CONSOLIDATED FINANCIAL STATEMENTS(In thousands, except per share amounts) — (Continued)

14. Income Taxes
The income tax provision relating to income from continuing operations consisted of the following:
2006 2005 2004Year Ended December 31,
Current:
Federal . . . . . . . . . . . . . . . . . . . . . . . . . . . . . . . . . . . . . . . . . . . $14,884 $22,770 $17,144
State and local . . . . . . . . . . . . . . . . . . . . . . . . . . . . . . . . . . . . . . 3,959 4,531 4,601
Foreign . . . . . . . . . . . . . . . . . . . . . . . . . . . . . . . . . . . . . . . . . . . 19,055 24,188 16,724
Total current . . . . . . . . . . . . . . . . . . . . . . . . . . . . . . . . . . . . . 37,898 51,489 38,469
Deferred:
Federal . . . . . . . . . . . . . . . . . . . . . . . . . . . . . . . . . . . . . . . . . . . 22,617 17,321 19,273
State and local . . . . . . . . . . . . . . . . . . . . . . . . . . . . . . . . . . . . . . 2,903 3,283 4,764
Foreign . . . . . . . . . . . . . . . . . . . . . . . . . . . . . . . . . . . . . . . . . . . 4,427 (3,223) 3,331
Total deferred . . . . . . . . . . . . . . . . . . . . . . . . . . . . . . . . . . . . 29,947 17,381 27,368
Income tax provision relating to continuing operations . . . . . . . . . . $67,845 $68,870 $65,837
The income tax provision relating to income from continuing operations varied from the U.S. federal statutoryincome tax rate due to the following:
2006 2005 2004Year Ended December 31,
Income tax provision relating to continuing operations at federalstatutory rate of 35% . . . . . . . . . . . . . . . . . . . . . . . . . . . . . . . . . $70,215 $66,438 $61,945
State and local income taxes, net of federal benefit . . . . . . . . . . . . 3,740 4,944 6,259
Foreign . . . . . . . . . . . . . . . . . . . . . . . . . . . . . . . . . . . . . . . . . . . . . (6,671) (3,961) (2,480)
Other . . . . . . . . . . . . . . . . . . . . . . . . . . . . . . . . . . . . . . . . . . . . . . 561 1,449 113
Income tax provision relating to continuing operations . . . . . . . . . . $67,845 $68,870 $65,837
F-30
UNITED AUTO GROUP, INC.
NOTES TO CONSOLIDATED FINANCIAL STATEMENTS(In thousands, except per share amounts) — (Continued)

The components of deferred tax assets and liabilities at December 31, 2006 and 2005 were as follows:
2006 2005
Deferred Tax AssetsAccrued liabilities . . . . . . . . . . . . . . . . . . . . . . . . . . . . . . . . . . . . . . . . . . $ 34,603 $ 18,182
Net operating loss carryforwards . . . . . . . . . . . . . . . . . . . . . . . . . . . . . . . . 8,615 6,433
Interest rate swap . . . . . . . . . . . . . . . . . . . . . . . . . . . . . . . . . . . . . . . . . . . 1,929 3,673
Other . . . . . . . . . . . . . . . . . . . . . . . . . . . . . . . . . . . . . . . . . . . . . . . . . . . . 6,209 3,619
Total deferred tax assets . . . . . . . . . . . . . . . . . . . . . . . . . . . . . . . . . . . . . . 51,356 31,907
Valuation allowance . . . . . . . . . . . . . . . . . . . . . . . . . . . . . . . . . . . . . . . . . (3,943) (4,119)
Net deferred tax assets . . . . . . . . . . . . . . . . . . . . . . . . . . . . . . . . . . . 47,413 27,788
Deferred Tax LiabilitiesDepreciation and amortization. . . . . . . . . . . . . . . . . . . . . . . . . . . . . . . . . . (135,411) (115,060)
Partnership investments. . . . . . . . . . . . . . . . . . . . . . . . . . . . . . . . . . . . . . . (16,379) (16,644)
Other . . . . . . . . . . . . . . . . . . . . . . . . . . . . . . . . . . . . . . . . . . . . . . . . . . . . (7,484) (4,079)
Total deferred tax liabilities . . . . . . . . . . . . . . . . . . . . . . . . . . . . . . . . . . (159,274) (135,783)
Net deferred tax liabilities . . . . . . . . . . . . . . . . . . . . . . . . . . . . . . . . . . . $(111,861) $(107,995)
The Company does not provide for federal income taxes or tax benefits relating to the undistributed earnings orlosses of its foreign subsidiaries. Income from continuing operations before income taxes of foreign subsidiaries(which subsidiaries are predominately in the United Kingdom) was $84,635, $70,468 and $65,997 during the yearsended December 31, 2006, 2005 and 2004, respectively. It is the Company’s belief that such earnings will beindefinitely reinvested in the companies that produced them. At December 31, 2006, the Company had not providedfederal income taxes on a total of $269,911 of earnings of individual foreign subsidiaries. If these earnings wereremitted as dividends, the Company would be subject to U.S. income taxes and certain foreign withholding taxes.
At December 31, 2006, the Company has $113,101 of United States state net operating loss carryforwards thatexpire at various dates through 2026, United States state credit carryforwards of $1,373 that will not expire, aUnited Kingdom net operating loss carryforward of $2,559 that will not expire, and a United Kingdom capital lossof $4,070 that will not expire. During 2006, a German net operating loss of $1,865 was fully utilized.
A valuation allowance of $3,914 has been recorded against the United States state net operating losscarryforwards and a valuation allowance of $29 has been recorded against the United States state creditcarryforwards. A valuation allowance of $692 was removed due to the utilization of a German net operating loss.
The Company has classified its tax reserves as a long term obligation on the basis that management does notexpect to make any payments relating to those reserves within the next twelve months.
15. Segment Information
The Company operates in one reportable segment. The Company’s operations (i) have similar economiccharacteristics (all are automobile dealerships), (ii) offer similar products and services (all sell new and usedvehicles, service, parts and third-party finance and insurance products), (iii) have similar target markets andcustomers (generally individuals) and (iv) have similar distribution and marketing practices (all distribute products
F-31
UNITED AUTO GROUP, INC.
NOTES TO CONSOLIDATED FINANCIAL STATEMENTS(In thousands, except per share amounts) — (Continued)
and services through dealership facilities that market to customers in similar fashions). The following table presentscertain data by geographic area:
2006 2005 2004Year Ended December 31,
Sales to external customers:
United States . . . . . . . . . . . . . . . . . . . . . . . . . . . . . . . . . $ 7,641,709 $6,812,219 $5,960,582
Foreign . . . . . . . . . . . . . . . . . . . . . . . . . . . . . . . . . . . . . 3,600,604 2,849,174 2,427,439
Total sales to external customers . . . . . . . . . . . . . . . . . . $11,242,313 $9,661,393 $8,388,021
Long-lived assets, net:
United States . . . . . . . . . . . . . . . . . . . . . . . . . . . . . . . . . $ 456,169 $ 354,872
Foreign . . . . . . . . . . . . . . . . . . . . . . . . . . . . . . . . . . . . . 236,177 144,684
Total long-lived assets . . . . . . . . . . . . . . . . . . . . . . . . . . $ 692,346 $ 499,556
The Company’s foreign operations are predominantly based in the United Kingdom.
16. Summary of Quarterly Financial Data (Unaudited)First
QuarterSecondQuarter
ThirdQuarter
FourthQuarter
2006(1)(2)(3)Total revenues . . . . . . . . . . . . . . . . . . . . . . . . . . . $2,552,139 $2,831,862 $2,977,295 $2,881,017
Gross profit . . . . . . . . . . . . . . . . . . . . . . . . . . . . . 398,656 428,688 444,328 432,797Net income. . . . . . . . . . . . . . . . . . . . . . . . . . . . . . 23,955 36,693 33,730 30,323
Diluted earnings per share. . . . . . . . . . . . . . . . . . . $ 0.26 $ 0.39 $ 0.36 $ 0.32
FirstQuarter
SecondQuarter
ThirdQuarter
FourthQuarter
2005(1)(2)Total revenues . . . . . . . . . . . . . . . . . . . . . . . . . . . $2,262,177 $2,494,143 $2,558,743 $2,346,330Gross profit . . . . . . . . . . . . . . . . . . . . . . . . . . . . . 347,315 375,408 382,067 368,661
Net income. . . . . . . . . . . . . . . . . . . . . . . . . . . . . . 22,892 33,196 32,764 30,121
Diluted earnings per share. . . . . . . . . . . . . . . . . . . $ 0.25 $ 0.36 $ 0.35 $ 0.32
(1) As discussed in Note 3, the Company has treated the operations of certain entities as discontinued operations.The results for all periods have been restated to reflect such treatment.
(2) Per share amounts are calculated independently for each of the quarters presented. The sum of the quarters maynot equal the full year per share amounts due to rounding.
(3) As discussed in Note 1, the Company has adjusted its financial results for the first three quarters of fiscal 2006in accordance with SAB 108.
17. Subsequent Events
On January 26, 2007, the Company provided notice to the Bank of New York Trust Company, N.A., the trusteeof the 9.625% Notes, of its intention to redeem the 9.625% Notes on March 15, 2007 at a price of 104.813 for allnotes outstanding. The aggregate redemption price is estimated to be approximately $314,400, resulting in a pre-taxcharge of approximately $19,000.
F-32
UNITED AUTO GROUP, INC.
NOTES TO CONSOLIDATED FINANCIAL STATEMENTS(In thousands, except per share amounts) — (Continued)
Effective February 13, 2007, the Company permanently reduced the credit availability under the U.S. CreditAgreement from $600,000 to $250,000 and the letter of credit availability from $50,000 to $10,000. The reductionin capacity under the U.S. Credit Agreement will enable the Company to avoid certain credit availability fees.
18. Condensed Consolidating Financial Information
The following tables include condensed consolidating financial information as of December 31, 2006 and2005 and for the years ended December 31, 2006, 2005, and 2004 for United Auto Group, Inc.’s (as the issuer of the9.625% Notes), wholly-owned subsidiary guarantors, non-wholly owned subsidiaries, and non-guarantor subsid-iaries (primarily representing foreign entities). The condensed consolidating financial information includes certainallocations of balance sheet, income statement and cash flow items which are not necessarily indicative of thefinancial position, results of operations or cash flows of these entities on a stand-alone basis.
F-33
UNITED AUTO GROUP, INC.
NOTES TO CONSOLIDATED FINANCIAL STATEMENTS(In thousands, except per share amounts) — (Continued)

CONDENSED CONSOLIDATING BALANCE SHEETDecember 31, 2006
TotalCompany Eliminations
United AutoGroup, Inc.
GuarantorSubsidiaries
HBLLLC
UAGConnecticut I,
LLC
UAG MentorAcquisition
LLC
UAGCentral NJ,
LLC
Non-Guarantor
Subsidiaries
Non-Wholly Owned Guarantor Subsidiaries
(In Thousands)
Cash and cash equivalents . . . . . $ 13,147 $ — $ 333 $ — $ — $ 687 $ — $ 2,536 $ 9,591
Accounts receivable, net . . . . . . 469,516 (200,621) 200,621 295,887 16,338 8,525 2,983 1,248 144,535
Inventories, net . . . . . . . . . . . . 1,519,506 — — 782,140 33,250 20,057 5,429 3,663 674,967
Other current assets . . . . . . . . . 71,490 — 9,426 23,452 490 25 — 10 38,087
Assets held for sale . . . . . . . . . 213,030 — — 200,945 — — — — 12,085
Total current assets . . . . . . . . 2,286,689 (200,621) 210,380 1,302,424 50,078 29,294 8,412 7,457 879,265
Property and equipment, net . . . . 582,646 — 3,824 318,766 5,287 4,369 1,746 3,427 245,227
Intangible assets. . . . . . . . . . . . 1,490,767 — — 926,842 68,281 20,738 3,722 — 471,184
Other assets . . . . . . . . . . . . . . 109,700 (1,068,787) 1,084,214 38,307 17 1 1 — 55,947
Total assets . . . . . . . . . . . . . $4,469,802 $(1,269,408) $1,298,418 $2,586,339 $123,663 $54,402 $13,881 $10,884 $1,651,623
Floor plan notes payable . . . . . . $ 874,326 $ — $ — $ 408,647 $ 2,362 $ 2,311 $ 4,792 $ — $ 456,214
Floor plan notes payable —non-trade. . . . . . . . . . . . . . . 297,985 (35,000) — 146,636 28,271 17,039 — 3,117 137,922
Accounts payable . . . . . . . . . . . 300,804 — 2,738 99,652 8,154 2,051 737 3,827 183,645
Accrued expenses . . . . . . . . . . . 214,307 (165,621) 27 63,524 36,109 16,601 2,286 1,332 260,049
Current portion of long-termdebt . . . . . . . . . . . . . . . . . . 13,385 — — 3,057 — — — — 10,328
Liabilities held for sale . . . . . . . 52,150 — — 37,113 — — — — 15,037
Total current liabilities . . . . . . 1,752,957 (200,621) 2,765 758,629 74,896 38,002 7,815 8,276 1,063,195
Long-term debt . . . . . . . . . . . . 1,168,666 — — 790,759 63,151 21,361 3,842 3,047 286,506
Other long-term liabilities . . . . . 252,526 — — 237,167 10,329 279 4,160 (109) 700
Total liabilities . . . . . . . . . . . . 3,174,149 (200,621) 2,765 1,786,555 148,376 59,642 15,817 11,214 1,350,401
Total stockholders’ equity . . . . . 1,295,653 (1,068,787) 1,295,653 799,784 (24,713) (5,240) (1,936) (330) 301,222
Total liabilities and stockholders’equity . . . . . . . . . . . . . . . . . $4,469,802 $(1,269,408) $1,298,418 $2,586,339 $123,663 $54,402 $13,881 $10,884 $1,651,623
F-34
UNITED AUTO GROUP, INC.
NOTES TO CONSOLIDATED FINANCIAL STATEMENTS(In thousands, except per share amounts) — (Continued)

CONDENSED CONSOLIDATING BALANCE SHEETDecember 31, 2005
TotalCompany Eliminations
United AutoGroup, Inc.
GuarantorSubsidiaries
HBLLLC
UAGConnecticut I,
LLC
UAG MentorAcquisition
LLC
UAGCentral NJ,
LLC
Non-Guarantor
Subsidiaries
Non-Wholly Owned Guarantor Subsidiaries
(In Thousands)
Cash and cash equivalents . . . . . $ 8,957 $ — $ 2,210 $ — $ — $ 1,127 $ 394 $2,540 $ 2,686
Accounts receivable, net . . . . . . 398,127 (125,107) 125,107 267,559 11,489 7,117 2,852 1,032 108,078
Inventories, net . . . . . . . . . . . . 1,144,584 — — 684,151 33,029 19,941 6,272 2,184 399,007
Other current assets . . . . . . . . . 50,209 — 5,118 21,448 467 42 6 — 23,128
Assets held for sale . . . . . . . . . 310,467 — — 289,460 — — — — 21,007
Total current assets . . . . . . . . . . 1,912,344 (125,107) 132,435 1,262,618 44,985 28,227 9,524 5,756 553,906
Property and equipment, net . . . . 416,099 — 4,297 242,938 5,929 2,932 1,859 3,660 154,484
Intangible assets. . . . . . . . . . . . 1,182,273 — — 830,639 68,281 20,738 3,722 — 258,893
Other assets . . . . . . . . . . . . . . 83,457 (986,211) 1,013,380 11,514 83 1 — — 44,690
Total assets . . . . . . . . . . . . . . . $3,594,173 $(1,111,318) $1,150,112 $2,347,709 $119,278 $51,898 $15,105 $9,416 $1,011,973
Floor plan notes payable . . . . . . $ 785,237 $ — $ — $ 482,963 $ 14,045 $ 6,725 $ 6,156 $ — $ 275,348
Floor plan notes payable —non-trade. . . . . . . . . . . . . . . 318,034 — — 220,216 15,154 12,000 — 2,486 68,178
Accounts payable . . . . . . . . . . . 198,268 — 3,874 80,180 6,941 1,393 676 2,532 102,672
Accrued expenses . . . . . . . . . . . 170,606 (125,107) 506 81,088 29,933 13,952 2,040 715 167,479
Current portion of long-termdebt . . . . . . . . . . . . . . . . . . 3,551 — — 3,551 — — — — —
Liabilities held for sale . . . . . . . 189,239 — — 168,379 — — — — 20,860
Total current liabilities . . . . . . . 1,664,935 (125,107) 4,380 1,036,377 66,073 34,070 8,872 5,733 634,537
Long-term debt . . . . . . . . . . . . 576,690 — — 333,215 63,151 21,361 3,842 3,096 152,025
Other long-term liabilities . . . . . 206,816 — — 190,862 10,638 548 4,059 176 533
Total liabilities . . . . . . . . . . . . 2,448,441 (125,107) 4,380 1,560,454 139,862 55,979 16,773 9,005 787,095
Total stockholders’ equity . . . . . 1,145,732 (986,211) 1,145,732 787,255 (20,584) (4,081) (1,668) 411 224,878
Total liabilities and stockholders’equity . . . . . . . . . . . . . . . . . $3,594,173 $(1,111,318) $1,150,112 $2,347,709 $119,278 $51,898 $15,105 $9,416 $1,011,973
F-35
UNITED AUTO GROUP, INC.
NOTES TO CONSOLIDATED FINANCIAL STATEMENTS(In thousands, except per share amounts) — (Continued)

CONDENSED CONSOLIDATING STATEMENT OF INCOMEYear Ended December 31, 2006
TotalCompany Eliminations
United AutoGroup, Inc.
GuarantorSubsidiaries
HBLLLC
UAGConnecticut I,
LLC
UAG MentorAcquisition
LLC
UAGCentral NJ,
LLC
Non-Guarantor
Subsidiaries
Non-Wholly Owned Guarantor Subsidiaries
(In Thousands)
Revenues . . . . . . . . . . . . . . . $11,242,313 $ — $ — $6,785,990 $270,825 $181,222 $54,081 $40,702 $3,909,493
Cost of sales . . . . . . . . . . . . . 9,537,844 — — 5,731,002 218,845 151,857 47,146 34,994 3,354,000
Gross profit . . . . . . . . . . . . . . 1,704,469 — — 1,054,988 51,980 29,365 6,935 5,708 555,493
Selling, general, andadministrative expenses. . . . . 1,356,452 — 15,153 832,129 40,550 23,035 5,975 3,795 435,815
Depreciation and amortization . . 44,863 — 1,427 25,326 972 603 211 278 16,046
Operating income (loss) . . . . . . 303,154 — (16,580) 197,533 10,458 5,727 749 1,635 103,632
Floor plan interest expense . . . . (61,565) — — (40,803) (1,740) (1,114) (290) (126) (17,492)
Other interest expense . . . . . . . (49,173) — — (29,617) (4,793) (1,621) (552) (487) (12,103)
Equity in earnings of affiliates . . 8,201 — — 1,413 — — — — 6,788
Equity in earnings ofsubsidiaries . . . . . . . . . . . . — (211,743) 211,743 — — — — — —
Income (loss) from continuingoperations before incometaxes and minority interests . . 200,617 (211,743) 195,163 128,526 3,925 2,992 (93) 1,022 80,825
Income taxes . . . . . . . . . . . . . (67,845) 79,037 (73,032) (45,789) (1,384) (1,062) 43 (333) (25,325)
Minority interests . . . . . . . . . . (2,172) — — (1,324) (254) (386) — (208) —
Income (loss) from continuingoperations . . . . . . . . . . . . . 130,600 (132,706) 122,131 81,413 2,287 1,544 (50) 481 55,500
Income (loss) from discontinuedoperations, net of tax . . . . . . (5,899) — — (4,634) — — — — (1,265)
Net income (loss) . . . . . . . . . . $ 124,701 $(132,706) $122,131 $ 76,779 $ 2,287 $ 1,544 $ (50) $ 481 $ 54,235
F-36
UNITED AUTO GROUP, INC.
NOTES TO CONSOLIDATED FINANCIAL STATEMENTS(In thousands, except per share amounts) — (Continued)

CONDENSED CONSOLIDATING STATEMENT OF INCOMEYear Ended December 31, 2005
TotalCompany Eliminations
United AutoGroup, Inc.
GuarantorSubsidiaries
HBLLLC
UAGConnecticut I,
LLC
UAG MentorAcquisition
LLC
UAGCentral NJ,
LLC
Non-Guarantor
Subsidiaries
Non-Wholly Owned Guarantor Subsidiaries
(In Thousands)
Revenues . . . . . . . . . . . . . . . . $9,661,393 $ — $ — $5,993,300 $258,010 $157,184 $54,397 $36,949 $3,161,553
Cost of sales . . . . . . . . . . . . . . 8,187,942 — — 5,060,536 208,392 130,543 47,479 32,195 2,708,797
Gross profit . . . . . . . . . . . . . . . 1,473,451 — — 932,764 49,618 26,641 6,918 4,754 452,756
Selling, general, andadministrative expenses . . . . . 1,154,220 — 14,128 716,905 39,271 21,323 5,648 3,302 353,643
Depreciation and amortization . . . 37,551 — 1,438 21,336 934 483 204 273 12,883
Operating income (loss) . . . . . . . 281,680 — (15,566) 194,523 9,413 4,835 1,066 1,179 86,230
Floor plan interest expense . . . . . (47,124) — — (30,529) (1,120) (1,111) (227) (97) (14,040)
Other interest expense . . . . . . . . (49,004) — — (30,549) (3,967) (1,331) (1,139) (461) (11,557)
Equity in earnings of affiliates . . 4,271 — — 691 — — — — 3,580
Equity in earnings ofsubsidiaries . . . . . . . . . . . . . — (219,007) 219,007 — — — — — —
Income (loss) from continuingoperations before incometaxes and minority interests . . . 189,823 (219,007) 203,441 134,136 4,326 2,393 (300) 621 64,213
Income taxes . . . . . . . . . . . . . . (68,870) 87,491 (81,340) (52,088) (1,658) (935) 113 (227) (20,226)
Minority interests . . . . . . . . . . . (1,814) — — (1,137) (267) (292) — (118) —
Income (loss) from continuingoperations . . . . . . . . . . . . . . 119,139 (131,516) 122,101 80,911 2,401 1,166 (187) 276 43,987
Income (loss) from discontinuedoperations, net of tax . . . . . . . (166) — — 535 — — — — (701)
Net income (loss) . . . . . . . . . . . $ 118,973 $(131,516) $122,101 $ 81,446 $ 2,401 $ 1,166 $ (187) $ 276 $ 43,286
F-37
UNITED AUTO GROUP, INC.
NOTES TO CONSOLIDATED FINANCIAL STATEMENTS(In thousands, except per share amounts) — (Continued)

CONDENSED CONSOLIDATING STATEMENT OF INCOMEYear Ended December 31, 2004
TotalCompany Eliminations
United AutoGroup, Inc.
GuarantorSubsidiaries
HBLLLC
UAGConnecticut I,
LLC
UAG MentorAcquisition
LLC
UAGCentral NJ,
LLC
Non-Guarantor
Subsidiaries
Non-Wholly Owned Guarantor Subsidiaries
(In Thousands)
Revenues . . . . . . . . . . . . . . . . $8,388,021 $ — $ — $5,185,518 $252,646 $158,725 $51,926 $14,017 $2,725,189
Cost of sales . . . . . . . . . . . . . . 7,132,693 — — 4,398,218 208,882 134,072 45,566 12,173 2,333,782
Gross profit . . . . . . . . . . . . . . . 1,255,328 — — 787,300 43,764 24,653 6,360 1,844 391,407
Selling, general, andadministrative expenses . . . . . 975,409 — 12,640 608,675 34,270 19,163 5,373 1,423 293,865
Depreciation and amortization . . . 36,365 — 818 18,780 1,740 483 203 86 14,255
Operating income (loss) . . . . . . . 243,554 — (13,458) 159,845 7,754 5,007 784 335 83,287
Floor plan interest expense . . . . . (40,883) — — (28,561) (699) (734) (159) (24) (10,706)
Other interest expense . . . . . . . . (42,923) — — (26,967) (3,997) (768) (1,039) (164) (9,988)
Equity in earnings of affiliates . . 5,770 — — 3,319 — — — — 2,451
Other income . . . . . . . . . . . . . 11,469 — — — — — — — 11,469
Equity in earnings ofsubsidiaries . . . . . . . . . . . . . — (202,177) 202,177 — — — — — —
Income (loss) from continuingoperations before incometaxes and minority interests . . . 176,987 (202,177) 188,719 107,636 3,058 3,505 (414) 147 76,513
Income taxes . . . . . . . . . . . . . . (65,837) 84,202 (78,500) (44,061) (1,322) (1,490) 146 (55) (24,757)
Minority interests . . . . . . . . . . . (2,047) — — (942) (174) (403) — (28) (500)
Income (loss) from continuingoperations . . . . . . . . . . . . . . 109,103 (117,975) 110,219 62,633 1,562 1,612 (268) 64 51,256
Income (loss) from discontinuedoperations, net of tax . . . . . . . 2,584 — — 2,801 — — — — (217)
Net income (loss) . . . . . . . . . . . $ 111,687 $(117,975) $110,219 $ 65,434 $ 1,562 $ 1,612 $ (268) $ 64 $ 51,039
F-38
UNITED AUTO GROUP, INC.
NOTES TO CONSOLIDATED FINANCIAL STATEMENTS(In thousands, except per share amounts) — (Continued)

CONDENSED CONSOLIDATING STATEMENT OF CASH FLOWSYear Ended December 31, 2006
TotalCompany
United AutoGroup, Inc.
GuarantorSubsidiaries
HBLLLC
UAGConnecticut I,
LLC
UAG MentorAcquisition
LLC
UAGCentral NJ,
LLC
Non-Guarantor
Subsidiaries
Non-Wholly Owned Guarantor Subsidiaries
(In Thousands)
Net cash from continuing operating activities. . . . $ 120,281 $ (923) $ 120,019 $ (6,351) $ (677) $ (75) $ 684 $ 7,604
Investing Activities:
Purchase of property and equipment . . . . . . . . . (225,058) (954) (55,263) (330) (3,613) (98) (45) (164,755)
Proceeds from sale — leaseback transactions . . . . 106,167 — 26,447 — 1,573 — — 78,147
Dealership acquisitions, net . . . . . . . . . . . . . . . (369,055) — (134,984) — — — — (234,071)
Net cash from continuing investing activities . . . . (487,946) (954) (163,800) (330) (2,040) (98) (45) (320,679)
Financing Activities:
Net borrowings (repayments) of long-term debt . . (211,072) 43,311 (411,671) — — — (49) 157,337
Issuance of subordinated debt . . . . . . . . . . . . . . 750,000 — 750,000 — — — — —
Floor plan notes payable — non-trade . . . . . . . . (71,140) — (243,085) 13,117 5,039 — 631 153,158
Payments of deferred financing fees . . . . . . . . . (17,210) (17,210) — — — — — —
Proceeds from exercise of common stockincluding excess tax benefit . . . . . . . . . . . . . 18,069 18,069 — — — — — —
Repurchase of common stock . . . . . . . . . . . . . . (18,955) (18,955) — — — — — —
Distributions from (to) parent . . . . . . . . . . . . . . — — 5,144 (6,436) (2,762) (221) (1,225) 5,500
Dividends. . . . . . . . . . . . . . . . . . . . . . . . . . . (25,215) (25,215) — — — — — —
Net cash from continuing financing activities. . . . 424,477 — 100,388 6,681 2,277 (221) (643) 315,995
Net cash from discontinued operations . . . . . . . . (52,622) — (56,607) — — — — 3,985
Net change in cash and cash equivalents . . . . . . . 4,190 (1,877) — — (440) (394) (4) 6,905
Cash and cash equivalents, beginning of period . . 8,957 2,210 — — 1,127 394 2,540 2,686
Cash and cash equivalents, end of period . . . . . . $ 13,147 $ 333 $ — $ — $ 687 $ — $ 2,536 $ 9,591
F-39
UNITED AUTO GROUP, INC.
NOTES TO CONSOLIDATED FINANCIAL STATEMENTS(In thousands, except per share amounts) — (Continued)

CONDENSED CONSOLIDATING STATEMENT OF CASH FLOWSYear Ended December 31, 2005
TotalCompany
United AutoGroup, Inc.
GuarantorSubsidiaries
HBLLLC
UAGConnecticut I,
LLC
UAG MentorAcquisition
LLC
UAGCentral NJ,
LLC
Non-Guarantor
Subsidiaries
Non-Wholly Owned Guarantor Subsidiaries
(In thousands)
Net cash from continuing operating activities . . . . $ 169,373 $(15,179) $ 130,365 $ 4,542 $ 5,680 $1,004 $2,594 $ 40,367
Investing Activities:
Purchase of property and equipment . . . . . . . . . . (220,457) (1,947) (136,497) (822) (5,801) (248) (120) (75,022)
Proceeds from sale — leaseback transactions . . . . 118,470 — 65,620 — 4,803 — — 48,047
Dealership acquisitions, net . . . . . . . . . . . . . . . (126,879) — (107,084) — — — — (19,795)
Net cash from continuing investing activities . . . . (228,866) (1,947) (177,961) (822) (998) (248) (120) (46,770)
Financing Activities:
Net borrowings (repayments) of long-term debt . . 2,388 16,171 (33) — — — 75 (13,825)
Floor plan notes payable — non-trade . . . . . . . . . 18,445 — 15,194 2,693 (1,816) — (9) 2,383
Proceeds from exercise of common stockincluding excess tax benefit . . . . . . . . . . . . . . 4,673 4,673 — — — — — —
Distributions from (to) parent . . . . . . . . . . . . . . — — (3,718) (6,413) (3,163) (487) — 13,781
Dividends . . . . . . . . . . . . . . . . . . . . . . . . . . . (20,844) (20,844) — — — — — —
Net cash from continuing financing activities . . . . 4,662 — 11,443 (3,720) (4,979) (487) 66 2,339
Net cash from discontinued operations . . . . . . . . 40,241 — 36,153 — — — — 4,088
Net change in cash and cash equivalents . . . . . . . (14,590) (17,126) — — (297) 269 2,540 24
Cash and cash equivalents, beginning of period . . 23,547 19,336 — — 1,424 125 — 2,662
Cash and cash equivalents, end of period. . . . . . . $ 8,957 $ 2,210 $ — $ — $ 1,127 $ 394 $2,540 $ 2,686
F-40
UNITED AUTO GROUP, INC.
NOTES TO CONSOLIDATED FINANCIAL STATEMENTS(In thousands, except per share amounts) — (Continued)

CONDENSED CONSOLIDATING STATEMENT OF CASH FLOWSYear Ended December 31, 2004
TotalCompany
United AutoGroup, Inc.
GuarantorSubsidiaries
HBLLLC
UAGConnecticut I,
LLC
UAG MentorAcquisition
LLC
UAGCentral NJ,
LLC
Non-Guarantor
Subsidiaries
Non-Wholly Owned Guarantor Subsidiaries
(In Thousands)
Net cash from continuing operating activities . . . $ 266,592 $ 11,442 $ 161,936 $ 12,500 $ 1,311 $ 6,247 $(1,687) $ 74,843
Investing Activities:
Purchase of property and equipment . . . . . . . . . (225,555) (371) (95,627) (21,009) (2,280) (92) (3,899) (102,277)
Proceeds from sale — leaseback transactions . . . 149,076 — 65,893 37,154 2,967 — — 43,062
Dealership acquisitions, net . . . . . . . . . . . . . . . (210,084) — (152,834) — — — — (57,250)
Proceeds from sale of investment . . . . . . . . . . . 13,566 — — — — — — 13,566
Net cash from continuing investing activities . . . (272,997) (371) (182,568) 16,145 687 (92) (3,899) (102,899)
Financing Activities:
Net borrowings (repayments) of long-term debt. . (74,257) (110,960) 74,942 (12,731) — — 3,021 (28,529)
Floor plan notes payable — non-trade . . . . . . . . (58,841) — (49,427) (6,679) 1,452 (5,926) 2,495 (756)
Proceeds from issuance of common stock . . . . . 119,435 119,435 — — — — — —
Proceeds from exercise of common stockincluding excess tax benefit . . . . . . . . . . . . . 9,936 9,936 — — — — — —
Distributions from (to) parent . . . . . . . . . . . . . — — (43,776) (10,481) (2,670) (189) 70 57,046
Dividends . . . . . . . . . . . . . . . . . . . . . . . . . . (18,411) (18,411) — — — — — —
Net cash from continuing financing activities . . . (22,138) — (18,261) (29,891) (1,218) (6,115) 5,586 27,761
Net cash from discontinued operations . . . . . . . 33,781 — 35,925 — — — — (2,144)
Net change in cash and cash equivalents . . . . . . 5,238 11,071 (2,968) (1,246) 780 40 — (2,439)
Cash and cash equivalents, beginning of period . . 18,309 8,265 2,968 1,246 644 85 — 5,101
Cash and cash equivalents, end of period . . . . . . $ 23,547 $ 19,336 $ — $ — $ 1,424 $ 125 $ — $ 2,662
F-41
UNITED AUTO GROUP, INC.
NOTES TO CONSOLIDATED FINANCIAL STATEMENTS(In thousands, except per share amounts) — (Continued)

The following tables include condensed consolidating financial information as of December 31, 2006 and2005 and for the years ended December 31, 2006, 2005, and 2004 for United Auto Group, Inc.’s (as the issuer of theConvertible Notes and the 7.75% Notes), guarantor subsidiaries and non-guarantor subsidiaries (primarilyrepresenting foreign entities). The condensed consolidating financial information includes certain allocationsof balance sheet, income statement and cash flow items which are not necessarily indicative of the financialposition, results of operations or cash flows of these entities on a stand-alone basis.
CONDENSED CONSOLIDATING BALANCE SHEETDecember 31, 2006
TotalCompany Eliminations
United AutoGroup, Inc.
GuarantorSubsidiaries
Non-Guarantor
Subsidiaries(In Thousands)
Cash and cash equivalents . . . . . . . . . . . . . . . . . . . . . . $ 13,147 $ — $ 333 $ — $ 12,814
Accounts receivable, net . . . . . . . . . . . . . . . . . . . . . . . 469,516 (200,621) 200,621 295,887 173,629
Inventories, net . . . . . . . . . . . . . . . . . . . . . . . . . . . . . 1,519,506 — — 782,140 737,366
Other current assets . . . . . . . . . . . . . . . . . . . . . . . . . . 71,490 — 9,426 23,452 38,612
Assets held for sale . . . . . . . . . . . . . . . . . . . . . . . . . . 213,030 — — 200,945 12,085
Total current assets . . . . . . . . . . . . . . . . . . . . . . . . . . 2,286,689 (200,621) 210,380 1,302,424 974,506
Property and equipment, net . . . . . . . . . . . . . . . . . . . . 582,646 — 3,824 318,766 260,056
Intangible assets . . . . . . . . . . . . . . . . . . . . . . . . . . . . 1,490,767 — — 926,842 563,925
Other assets . . . . . . . . . . . . . . . . . . . . . . . . . . . . . . . 109,700 (1,068,787) 1,084,214 38,307 55,966
Total assets . . . . . . . . . . . . . . . . . . . . . . . . . . . . . . . $4,469,802 $(1,269,408) $1,298,418 $2,586,339 $1,854,453
Floor plan notes payable . . . . . . . . . . . . . . . . . . . . . . . $ 874,326 $ — $ — $ 408,647 $ 465,679
Floor plan notes payable — non-trade . . . . . . . . . . . . . . 297,985 (35,000) — 146,636 186,349
Accounts payable . . . . . . . . . . . . . . . . . . . . . . . . . . . 300,804 — 2,738 99,652 198,414
Accrued expenses . . . . . . . . . . . . . . . . . . . . . . . . . . . 214,307 (165,621) 27 63,524 316,377
Current portion of long-term debt . . . . . . . . . . . . . . . . . 13,385 — — 3,057 10,328
Liabilities held for sale. . . . . . . . . . . . . . . . . . . . . . . . 52,150 — — 37,113 15,037
Total current liabilities . . . . . . . . . . . . . . . . . . . . . . . . 1,752,957 (200,621) 2,765 758,629 1,192,184
Long-term debt . . . . . . . . . . . . . . . . . . . . . . . . . . . . . 1,168,666 — — 790,759 377,907
Other long-term liabilities . . . . . . . . . . . . . . . . . . . . . . 252,526 — — 237,167 15,359
Total liabilities . . . . . . . . . . . . . . . . . . . . . . . . . . . . . 3,174,149 (200,621) 2,765 1,786,555 1,585,450
Total stockholders’ equity . . . . . . . . . . . . . . . . . . . . . . 1,295,653 (1,068,787) 1,295,653 799,784 269,003
Total liabilities and stockholders’ equity . . . . . . . . . . . . . $4,469,802 $(1,269,408) $1,298,418 $2,586,339 $1,854,453
F-42
UNITED AUTO GROUP, INC.
NOTES TO CONSOLIDATED FINANCIAL STATEMENTS(In thousands, except per share amounts) — (Continued)

CONDENSED CONSOLIDATING BALANCE SHEETDecember 31, 2005
TotalCompany Eliminations
United AutoGroup, Inc.
GuarantorSubsidiaries
Non-Guarantor
Subsidiaries(In Thousands)
Cash and cash equivalents . . . . . . . . . . . . . . . . . . . . . . $ 8,957 $ — $ 2,210 $ — $ 6,747
Accounts receivable, net . . . . . . . . . . . . . . . . . . . . . . . 398,127 (125,107) 125,107 267,559 130,568
Inventories, net . . . . . . . . . . . . . . . . . . . . . . . . . . . . . 1,144,584 — — 684,151 460,433
Other current assets . . . . . . . . . . . . . . . . . . . . . . . . . . 50,209 — 5,118 21,448 23,643
Assets held for sale . . . . . . . . . . . . . . . . . . . . . . . . . . 310,467 — — 289,460 21,007
Total current assets . . . . . . . . . . . . . . . . . . . . . . . . . . 1,912,344 (125,107) 132,435 1,262,618 642,398
Property and equipment, net . . . . . . . . . . . . . . . . . . . . 416,099 — 4,297 242,938 168,864
Intangible assets . . . . . . . . . . . . . . . . . . . . . . . . . . . . 1,182,273 — — 830,639 351,634
Other assets . . . . . . . . . . . . . . . . . . . . . . . . . . . . . . . 83,457 (986,211) 1,013,380 11,514 44,774
Total assets . . . . . . . . . . . . . . . . . . . . . . . . . . . . . . . $3,594,173 $(1,111,318) $1,150,112 $2,347,709 $1,207,670
Floor plan notes payable . . . . . . . . . . . . . . . . . . . . . . . $ 785,237 $ — $ — $ 482,963 $ 302,274
Floor plan notes payable — non-trade . . . . . . . . . . . . . . 318,034 — — 220,216 97,818
Accounts payable . . . . . . . . . . . . . . . . . . . . . . . . . . . 198,268 — 3,874 80,180 114,214
Accrued expenses . . . . . . . . . . . . . . . . . . . . . . . . . . . 170,606 (125,107) 506 81,088 214,119
Current portion of long-term debt . . . . . . . . . . . . . . . . . 3,551 — — 3,551 —
Liabilities held for sale. . . . . . . . . . . . . . . . . . . . . . . . 189,239 — — 168,379 20,860
Total current liabilities . . . . . . . . . . . . . . . . . . . . . . . . 1,664,935 (125,107) 4,380 1,036,377 749,285
Long-term debt . . . . . . . . . . . . . . . . . . . . . . . . . . . . . 576,690 — — 333,215 243,475
Other long-term liabilities . . . . . . . . . . . . . . . . . . . . . . 206,816 — — 190,862 15,954
Total liabilities . . . . . . . . . . . . . . . . . . . . . . . . . . . . . 2,448,441 (125,107) 4,380 1,560,454 1,008,714
Total stockholders’ equity . . . . . . . . . . . . . . . . . . . . . . 1,145,732 (986,211) 1,145,732 787,255 198,956
Total liabilities and stockholders’ equity . . . . . . . . . . . . . $3,594,173 $(1,111,318) $1,150,112 $2,347,709 $1,207,670
F-43
UNITED AUTO GROUP, INC.
NOTES TO CONSOLIDATED FINANCIAL STATEMENTS(In thousands, except per share amounts) — (Continued)

CONDENSED CONSOLIDATING STATEMENT OF INCOMEYear Ended December 31, 2006
TotalCompany Eliminations
United AutoGroup, Inc.
GuarantorSubsidiaries
Non-Guarantor
Subsidiaries(In Thousands)
Revenues . . . . . . . . . . . . . . . . . . . . . . . . . . . . . . . . $11,242,313 $ — $ — $6,785,990 $4,456,323
Cost of sales . . . . . . . . . . . . . . . . . . . . . . . . . . . . . . 9,537,844 — — 5,731,002 3,806,842
Gross profit . . . . . . . . . . . . . . . . . . . . . . . . . . . . . . 1,704,469 — — 1,054,988 649,481
Selling, general, and administrative expenses . . . . . . . . . 1,356,452 — 15,153 832,129 509,170
Depreciation and amortization . . . . . . . . . . . . . . . . . . 44,863 — 1,427 25,326 18,110
Operating income (loss) . . . . . . . . . . . . . . . . . . . . . . 303,154 — (16,580) 197,533 122,201
Floor plan interest expense . . . . . . . . . . . . . . . . . . . . (61,565) — — (40,803) (20,762)
Other interest expense . . . . . . . . . . . . . . . . . . . . . . . (49,173) — — (29,617) (19,556)
Equity in earnings of affiliates . . . . . . . . . . . . . . . . . . 8,201 — — 1,413 6,788
Equity in earnings of subsidiaries . . . . . . . . . . . . . . . . — (211,743) 211,743 — —
Income (loss) from continuing operations before incometaxes and minority interests . . . . . . . . . . . . . . . . . . 200,617 (211,743) 195,163 128,526 88,671
Income taxes . . . . . . . . . . . . . . . . . . . . . . . . . . . . . (67,845) 79,037 (73,032) (45,789) (28,061)
Minority interests . . . . . . . . . . . . . . . . . . . . . . . . . . (2,172) — — (1,324) (848)
Income (loss) from continuing operations . . . . . . . . . . . 130,600 (132,706) 122,131 81,413 59,762
Loss from discontinued operations, net of tax . . . . . . . . (5,899) — — (4,634) (1,265)
Net income (loss) . . . . . . . . . . . . . . . . . . . . . . . . . . $ 124,701 $(132,706) $122,131 $ 76,779 $ 58,497
F-44
UNITED AUTO GROUP, INC.
NOTES TO CONSOLIDATED FINANCIAL STATEMENTS(In thousands, except per share amounts) — (Continued)
CONDENSED CONSOLIDATING STATEMENT OF INCOMEYear Ended December 31, 2005
TotalCompany Eliminations
United AutoGroup, Inc.
GuarantorSubsidiaries
Non-Guarantor
Subsidiaries(In Thousands)
Revenues . . . . . . . . . . . . . . . . . . . . . . . . . . . . $9,661,393 $ — $ — $5,993,300 $3,668,093
Cost of sales . . . . . . . . . . . . . . . . . . . . . . . . . . 8,187,942 — — 5,060,536 3,127,406
Gross profit . . . . . . . . . . . . . . . . . . . . . . . . . . 1,473,451 — — 932,764 540,687
Selling, general, and administrative expenses . . . 1,154,220 — 14,128 716,905 423,187
Depreciation and amortization. . . . . . . . . . . . . . 37,551 — 1,438 21,336 14,777
Operating income (loss) . . . . . . . . . . . . . . . . . . 281,680 — (15,566) 194,523 102,723
Floor plan interest expense . . . . . . . . . . . . . . . . (47,124) — — (30,529) (16,595)
Other interest expense . . . . . . . . . . . . . . . . . . . (49,004) — — (30,549) (18,455)
Equity in earnings of affiliates . . . . . . . . . . . . . 4,271 — — 691 3,580
Equity in earnings of subsidiaries . . . . . . . . . . . — (219,007) 219,007 — —
Income (loss) from continuing operations beforeincome taxes and minority interests . . . . . . . . 189,823 (219,007) 203,441 134,136 71,253
Income taxes . . . . . . . . . . . . . . . . . . . . . . . . . (68,870) 87,491 (81,340) (52,088) (22,933)
Minority interests . . . . . . . . . . . . . . . . . . . . . . (1,814) — — (1,137) (677)
Income (loss) from continuing operations . . . . . . 119,139 (131,516) 122,101 80,911 47,643
Loss from discontinued operations, net of tax . . . (166) — — 535 (701)
Net income (loss) . . . . . . . . . . . . . . . . . . . . . . $ 118,973 $(131,516) $122,101 $ 81,446 $ 46,942
F-45
UNITED AUTO GROUP, INC.
NOTES TO CONSOLIDATED FINANCIAL STATEMENTS(In thousands, except per share amounts) — (Continued)

CONDENSED CONSOLIDATING STATEMENT OF INCOMEYear Ended December 31, 2004
TotalCompany Eliminations
United AutoGroup, Inc.
GuarantorSubsidiaries
Non-Guarantor
Subsidiaries(In Thousands)
Revenues . . . . . . . . . . . . . . . . . . . . . . . . . . . . $8,388,021 $ — $ — $5,185,518 $3,202,503
Cost of sales . . . . . . . . . . . . . . . . . . . . . . . . . . 7,132,693 — — 4,398,218 2,734,475
Gross profit . . . . . . . . . . . . . . . . . . . . . . . . . . 1,255,328 — — 787,300 468,028
Selling, general, and administrative expenses . . . 975,409 — 12,640 608,675 354,094
Depreciation and amortization. . . . . . . . . . . . . . 36,365 — 818 18,780 16,767
Operating income (loss) . . . . . . . . . . . . . . . . . . 243,554 — (13,458) 159,845 97,167
Floor plan interest expense . . . . . . . . . . . . . . . . (40,883) — — (28,561) (12,322)
Other interest expense . . . . . . . . . . . . . . . . . . . (42,923) — — (26,967) (15,956)
Equity in earnings of affiliates . . . . . . . . . . . . . 5,770 — — 3,319 2,451
Other income . . . . . . . . . . . . . . . . . . . . . . . . . 11,469 — — — 11,469
Equity in earnings of subsidiaries . . . . . . . . . . . — (202,177) 202,177 — —
Income (loss) from continuing operations beforeincome taxes and minority interests . . . . . . . . 176,987 (202,177) 188,719 107,636 82,809
Income taxes . . . . . . . . . . . . . . . . . . . . . . . . . (65,837) 84,202 (78,500) (44,061) (27,478)
Minority interests . . . . . . . . . . . . . . . . . . . . . . (2,047) — — (942) (1,105)
Income (loss) from continuing operations . . . . . . 109,103 (117,975) 110,219 62,633 54,226
Income (loss) from discontinued operations, netof tax . . . . . . . . . . . . . . . . . . . . . . . . . . . . . 2,584 — — 2,801 (217)
Net income (loss) . . . . . . . . . . . . . . . . . . . . . . $ 111,687 $(117,975) $110,219 $ 65,434 $ 54,009
F-46
UNITED AUTO GROUP, INC.
NOTES TO CONSOLIDATED FINANCIAL STATEMENTS(In thousands, except per share amounts) — (Continued)

CONDENSED CONSOLIDATING STATEMENT OF CASH FLOWSYear Ended December 31, 2006
TotalCompany
United AutoGroup, Inc.
GuarantorSubsidiaries
Non-Guarantor
Subsidiaries(In Thousands)
Net cash from continuing operating activities . . . . . . . . . $ 120,281 $ (923) $ 120,019 $ 1,185
Investing Activities:
Purchase of property and equipment . . . . . . . . . . . . . . . (225,058) (954) (55,263) (168,841)
Proceeds from sale — leaseback transactions . . . . . . . . . 106,167 — 26,447 79,720
Dealership acquisitions, net . . . . . . . . . . . . . . . . . . . . . . (369,055) — (134,984) (234,071)
Net cash from continuing investing activities . . . . . . . . . (487,946) (954) (163,800) (323,192)
Financing Activities:
Net borrowings (repayments) of long-term debt . . . . . . . (211,072) 43,311 (411,671) 157,288Issuance of subordinated debt . . . . . . . . . . . . . . . . . . . . 750,000 — 750,000 —
Floor plan notes payable — non-trade . . . . . . . . . . . . . . (71,140) — (243,085) 171,945
Payments of deferred financing fees . . . . . . . . . . . . . . . . (17,210) (17,210) — —
Proceeds from exercise of common stock includingexcess tax benefit . . . . . . . . . . . . . . . . . . . . . . . . . . . 18,069 18,069 — —
Repurchase of common stock . . . . . . . . . . . . . . . . . . . . (18,955) (18,955) — —
Distributions from (to) parent . . . . . . . . . . . . . . . . . . . . — — 5,144 (5,144)
Dividends . . . . . . . . . . . . . . . . . . . . . . . . . . . . . . . . . . . (25,215) (25,215) — —
Net cash from continuing financing activities . . . . . . . . . 424,477 — 100,388 324,089
Net cash from discontinued operations . . . . . . . . . . . . . . (52,622) — (56,607) 3,985
Net change in cash and cash equivalents . . . . . . . . . . . . 4,190 (1,877) — 6,067
Cash and cash equivalents, beginning of period . . . . . . . 8,957 2,210 — 6,747
Cash and cash equivalents, end of period . . . . . . . . . . . . $ 13,147 $ 333 $ — $ 12,814
F-47
UNITED AUTO GROUP, INC.
NOTES TO CONSOLIDATED FINANCIAL STATEMENTS(In thousands, except per share amounts) — (Continued)

CONDENSED CONSOLIDATING STATEMENT OF CASH FLOWSYear Ended December 31, 2005
TotalCompany
United AutoGroup, Inc.
GuarantorSubsidiaries
Non-Guarantor
Subsidiaries(In Thousands)
Net cash from continuing operating activities . . . . . . . . . $ 169,373 $(15,179) $ 130,365 $ 54,187
Investing Activities:
Purchase of property and equipment . . . . . . . . . . . . . . . (220,457) (1,947) (136,497) (82,013)
Proceeds from sale — leaseback transactions . . . . . . . . . 118,470 — 65,620 52,850
Dealership acquisitions, net . . . . . . . . . . . . . . . . . . . . . . (126,879) — (107,084) (19,795)
Net cash from continuing investing activities . . . . . . . . . (228,866) (1,947) (177,961) (48,958)
Financing Activities:
Net borrowings (repayments) of long-term debt . . . . . . . 2,388 16,171 (33) (13,750)Floor plan notes payable — non-trade . . . . . . . . . . . . . . 18,445 — 15,194 3,251
Proceeds from exercise of common stock includingexcess tax benefit . . . . . . . . . . . . . . . . . . . . . . . . . . . 4,673 4,673 — —
Distributions from (to) parent . . . . . . . . . . . . . . . . . . . . — — (3,718) 3,718
Dividends . . . . . . . . . . . . . . . . . . . . . . . . . . . . . . . . . . . (20,844) (20,844) — —
Net cash from continuing financing activities . . . . . . . . . 4,662 — 11,443 (6,781)
Net cash from discontinued operations . . . . . . . . . . . . . . 40,241 — 36,153 4,088
Net change in cash and cash equivalents . . . . . . . . . . . . (14,590) (17,126) — 2,536
Cash and cash equivalents, beginning of period . . . . . . . 23,547 19,336 — 4,211
Cash and cash equivalents, end of period . . . . . . . . . . . . $ 8,957 $ 2,210 $ — $ 6,747
F-48
UNITED AUTO GROUP, INC.
NOTES TO CONSOLIDATED FINANCIAL STATEMENTS(In thousands, except per share amounts) — (Continued)

CONDENSED CONSOLIDATING STATEMENT OF CASH FLOWSYear Ended December 31, 2004
TotalCompany
United AutoGroup, Inc.
GuarantorSubsidiaries
Non-Guarantor
Subsidiaries(In Thousands)
Net cash from continuing operating activities . . . . . . . . . $ 266,592 $ 11,442 $ 161,936 $ 93,214
Investing Activities:
Purchase of property and equipment . . . . . . . . . . . . . . . (225,555) (371) (95,627) (129,557)
Proceeds from sale — leaseback transactions . . . . . . . . . 149,076 — 65,893 83,183
Dealership acquisitions, net . . . . . . . . . . . . . . . . . . . . . . (210,084) — (152,834) (57,250)
Proceeds from sale of investment . . . . . . . . . . . . . . . . . . 13,566 — — 13,566
Net cash from continuing investing activities . . . . . . . . . (272,997) (371) (182,568) (90,058)
Financing Activities:Net borrowings (repayments) of long-term debt . . . . . . . (74,257) (110,960) 74,942 (38,239)
Floor plan notes payable — non-trade . . . . . . . . . . . . . . (58,841) — (49,427) (9,414)
Proceeds from issuance of common stock . . . . . . . . . . . 119,435 119,435 — —
Proceeds from exercise of common stock includingexcess tax benefit . . . . . . . . . . . . . . . . . . . . . . . . . . . 9,936 9,936 — —
Distributions from (to) parent . . . . . . . . . . . . . . . . . . . . — — (43,776) 43,776
Dividends . . . . . . . . . . . . . . . . . . . . . . . . . . . . . . . . . . . (18,411) (18,411) — —
Net cash from continuing financing activities . . . . . . . . . (22,138) — (18,261) (3,877)
Net cash from discontinued operations . . . . . . . . . . . . . . 33,781 — 35,925 (2,144)
Net change in cash and cash equivalents . . . . . . . . . . . . 5,238 11,071 (2,968) (2,865)
Cash and cash equivalents, beginning of period . . . . . . . 18,309 8,265 2,968 7,076
Cash and cash equivalents, end of period . . . . . . . . . . . . $ 23,547 $ 19,336 $ — $ 4,211
F-49
UNITED AUTO GROUP, INC.
NOTES TO CONSOLIDATED FINANCIAL STATEMENTS(In thousands, except per share amounts) — (Continued)
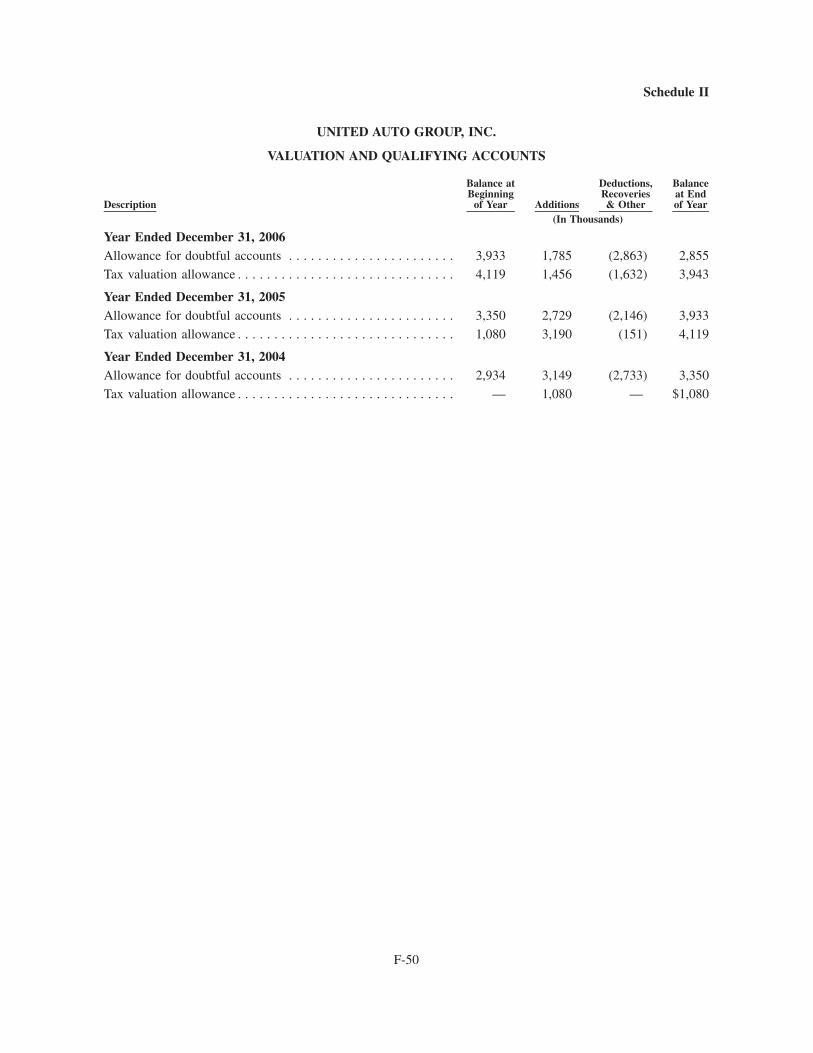
Schedule II
UNITED AUTO GROUP, INC.
VALUATION AND QUALIFYING ACCOUNTS
Description
Balance atBeginning
of Year Additions
Deductions,Recoveries& Other
Balanceat Endof Year
(In Thousands)
Year Ended December 31, 2006Allowance for doubtful accounts . . . . . . . . . . . . . . . . . . . . . . . 3,933 1,785 (2,863) 2,855
Tax valuation allowance . . . . . . . . . . . . . . . . . . . . . . . . . . . . . . 4,119 1,456 (1,632) 3,943
Year Ended December 31, 2005Allowance for doubtful accounts . . . . . . . . . . . . . . . . . . . . . . . 3,350 2,729 (2,146) 3,933
Tax valuation allowance . . . . . . . . . . . . . . . . . . . . . . . . . . . . . . 1,080 3,190 (151) 4,119
Year Ended December 31, 2004Allowance for doubtful accounts . . . . . . . . . . . . . . . . . . . . . . . 2,934 3,149 (2,733) 3,350
Tax valuation allowance . . . . . . . . . . . . . . . . . . . . . . . . . . . . . . — 1,080 — $1,080
F-50

Exhibit 31.1
CERTIFICATION OF PRINCIPAL EXECUTIVE OFFICER
I, Roger S. Penske, certify that:
1. I have reviewed this annual report on Form 10-K of United Auto Group, Inc.;
2. Based on my knowledge, this report does not contain any untrue statement of a material fact or omit to statea material fact necessary to make the statements made, in light of the circumstances under which such statementswere made, not misleading with respect to the period covered by this report;
3. Based on my knowledge, the financial statements, and other financial information included in this report,fairly present in all material respects the financial condition, results of operations and cash flows of the registrant asof, and for, the periods presented in this annual report;
4. The registrant’s other certifying officer(s) and I are responsible for establishing and maintaining disclosurecontrols and procedures (as defined in Exchange Act Rules 13a-15(e) and 15d-15(e)) and internal control overfinancial reporting (as defined in Exchange Act Rules 13a-15(f) and 15d-15(f)) for the registrant and we have:
a) Designed such disclosure controls and procedures, or caused such disclosure controls and proceduresto be designed under our supervision, to ensure that material information relating to the registrant, including itsconsolidated subsidiaries, is made known to us by others within those entities, particularly during the period inwhich this report is being prepared;
b) Designed such internal control over financial reporting, or caused such internal control over financialreporting to be designed under our supervision, to provide reasonable assurance regarding the reliability offinancial reporting and the preparation of financial statements for external purposes in accordance withgenerally accepted accounting principles;
c) Evaluated the effectiveness of the registrant’s disclosure controls and procedures and presented in thisreport our conclusions about the effectiveness of the disclosure controls and procedures, as of the end of theperiod covered by this report based on such evaluation; and
d) Disclosed in this report any change in the registrant’s internal control over financial reporting thatoccurred during the registrant’s most recent fiscal quarter (the registrant’s fourth fiscal quarter in the case of anannual report) that has materially affected, or is reasonably likely to materially affect, the registrant’s internalcontrol over financial reporting;
5. The registrant’s other certifying officer(s) and I have disclosed, based on our most recent evaluation ofinternal control over financial reporting, to the registrant’s auditors and the audit committee of registrant’s board ofdirectors (or persons performing the equivalent functions):
a) All significant deficiencies and material weaknesses in the design or operation of internal control overfinancial reporting which are reasonably likely to adversely affect the registrant’s ability to record, process,summarize and report financial information; and
b) Any fraud, whether or not material, that involves management or other employees who have asignificant role in the registrant’s internal control over financial reporting.
/s/ ROGER S. PENSKE
Roger S. PenskeTitle: Chief Executive Officer
February 28, 2007

Exhibit 31.2
CERTIFICATION OF PRINCIPAL FINANCIAL OFFICER
I, Robert T. O’Shaughnessy, certify that:
1. I have reviewed this annual report on Form 10-K of United Auto Group, Inc.;
2. Based on my knowledge, this report does not contain any untrue statement of a material fact or omit to statea material fact necessary to make the statements made, in light of the circumstances under which such statementswere made, not misleading with respect to the period covered by this annual report;
3. Based on my knowledge, the financial statements, and other financial information included in this report,fairly present in all material respects the financial condition, results of operations and cash flows of the registrant asof, and for, the periods presented in this annual report;
4. The registrant’s other certifying officer(s) and I are responsible for establishing and maintaining disclosurecontrols and procedures (as defined in Exchange Act Rules 13a-15(e) and 15d-15(e)) and internal control overfinancial reporting (as defined in Exchange Act Rules 13a-15(f) and 15d-15(f)) for the registrant and we have:
a) Designed such disclosure controls and procedures, or caused such disclosure controls and proceduresto be designed under our supervision, to ensure that material information relating to the registrant, including itsconsolidated subsidiaries, is made known to us by others within those entities, particularly during the period inwhich this report is being prepared;
b) Designed such internal control over financial reporting, or caused such internal control over financialreporting to be designed under our supervision, to provide reasonable assurance regarding the reliability offinancial reporting and the preparation of financial statements for external purposes in accordance withgenerally accepted accounting principles;
c) Evaluated the effectiveness of the registrant’s disclosure controls and procedures and presented in thisreport our conclusions about the effectiveness of the disclosure controls and procedures, as of the end of theperiod covered by this report based on such evaluation; and
d) Disclosed in this report any change in the registrant’s internal control over financial reporting thatoccurred during the registrant’s most recent fiscal quarter (the registrant’s fourth fiscal quarter in the case of anannual report) that has materially affected, or is reasonably likely to materially affect, the registrant’s internalcontrol over financial reporting;
5. The registrant’s other certifying officer(s) and I have disclosed, based on our most recent evaluation ofinternal control over financial reporting, to the registrant’s auditors and the audit committee of registrant’s board ofdirectors (or persons performing the equivalent functions):
a) All significant deficiencies and material weaknesses in the design or operation of internal control overfinancial reporting which are reasonably likely to adversely affect the registrant’s ability to record, process,summarize and report financial information; and
b) Any fraud, whether or not material, that involves management or other employees who have asignificant role in the registrant’s internal control over financial reporting.
/s/ ROBERT T. O’SHAUGHNESSY
Robert T. O’ShaughnessyChief Financial Officer
February 28, 2007

Exhibit 32
CERTIFICATION PURSUANT TO 18 U.S.C. SECTION 1350, AS ADOPTED PURSUANT TOSECTION 906 OF THE SARBANES-OXLEY ACT OF 2002
In connection with the annual report of United Auto Group, Inc. (the “Company”) on Form 10-K for the yearended December 31, 2006, as filed with the Securities and Exchange Commission on the date hereof (the “Report”),we, Roger S. Penske and Robert T. O’Shaughnessy, Principal Executive Officer and Principal Financial Officer,respectively, of the Company, certify, pursuant to 18 U.S.C. Section 1350, as adopted pursuant to Section 906 of theSarbanes-Oxley Act of 2002, that:
1. The Report fully complies with the requirements of section 13(a) or 15(d) of the Securities ExchangeAct of 1934; and
2. The information contained in the Report fairly presents, in all material respects, the financial conditionand results of operations of the Company.
/s/ ROGER S. PENSKE
Roger S. PenskeChief Executive Officer
February 28, 2007
/s/ ROBERT T. O’SHAUGHNESSY
Robert T. O’ShaughnessyChief Financial Officer
February 28, 2007
A signed original of this written statement required by Section 906 has been provided to United Auto Group,Inc. and will be retained by United Auto Group, Inc. and furnished to the Securities and Exchange Commission orits staff upon request.

To Our Stockholders:
You are invited to attend the annual meeting of stockholdersof United Auto Group, Inc. to be held at 8:00 a.m., Pacific Day-light Time on May 3, 2007, at Wynn Las Vegas, the site of PenskeWynn Ferrari Maserati, one of our premier automotive dealer-ships. Wynn Las Vegas is located at 3131 Las Vegas BoulevardSouth, Las Vegas, Nevada.
The accompanying Notice of Annual Meeting and ProxyStatement describe the specific matters to be voted upon atthe meeting. The annual meeting provides an excellent oppor-tunity for stockholders to become better acquainted with Uni-tedAuto and its directors and officers, and I hope that you willattend.
Whether or not you plan to attend, we ask that you cast yourvote as soon as possible. This will assure your shares are rep-resented at the meeting. Thankyou for yourcontinued support ofUnitedAuto.
Sincerely,
ROGER S. PENSKE
Chairman of the Board andChief Executive Officer
Bloomfield Hills, MichiganMarch 29, 2007

NOTICE OF ANNUAL MEETING OF STOCKHOLDERS
May 3, 2007
We will hold our annual meeting of stockholders at 8:00 a.m., PacificDaylight Time on May 3, 2007, at Wynn Las Vegas, the site of Penske WynnFerrari Maserati, one of our premier automotive dealerships. Wynn Las Vegas islocated at 3131 Las Vegas Boulevard South, Las Vegas, Nevada. The agendaitems for approval at the meeting consist of:
(1) the election of twelve directors to serve until the next annual meet-ing of stockholders, or until their successors are duly elected andqualified;
(2) the amendment of our certificate of incorporation to change ourname from “United Auto Group, Inc.” to “Penske Automotive Group,Inc.”; and
(3) the transaction of such other business as may properly comebefore the meeting.
Stockholders of record as of March 12, 2007 can vote at the annualmeeting and any postponements or adjournments of the annual meeting.We will make available for inspection a list of holders of our common stockas of the record date during business hours from April 17, 2007 through May 3,2007 at our principal executive offices, located at 2555 Telegraph Road,Bloomfield Hills, Michigan 48302. This proxy statement and the enclosed proxycard are first being distributed on or about March 29, 2007.
Your vote is very important. Please complete, date and sign the enclosedproxy card and return it promptly in the enclosed postage prepaid envelope orotherwise cast your vote. Your prompt voting will ensure a quorum. You mayrevoke your proxy and vote personally on all matters brought before the annualmeeting.
By Order of the Board of Directors,
SHANE M. SPRADLIN
Vice President and Secretary
Bloomfield Hills, MichiganMarch 29, 2007

TABLE OF CONTENTS
Page
1 Procedural Questions about the Meeting2 Proposal 1 — Election of Directors5 Proposal 2 — Amendment of Certificate of Incorporation5 Our Corporate Governance9 Executive Officers9 Compensation Committee Report
10 Compensation Discussion and Analysis16 Executive and Director Compensation23 Security Ownership of Certain Beneficial Owners and Management25 Audit Committee Report26 Independent Registered Public Accounting Firms27 Related Party Transactions30 Other Matters

PROCEDURAL QUESTIONS ABOUT THE MEETINGQ. What am I voting on?A. Proposal 1: Election of twelve directors to serve until the next annual meeting of stock-
holders, or until their successors are duly elected and qualified.A. Proposal 2: Amendment of our certificate of incorporation to change our name from
“United Auto Group, Inc.” to “Penske Automotive Group, Inc.”
Q. Who can vote?A. Stockholders of UnitedAuto as of the close of business on the record date, March 12, 2007,
can vote at the annual meeting. Each share of our common stock gets one vote. Votes maynot be cumulated. As of March 12, 2007, there were 94,874,030 shares of our commonstock outstanding.
Q. How do I vote before the meeting?A. By completing, signing and returning the enclosed proxy card.
Q. May I vote at the meeting?A. You may vote at the meeting if you attend in person. If you hold your shares through an
account with a bank or broker, you must obtain a legal proxy from the bank or broker inorder to vote at the meeting. Even if you plan to attend the meeting, we encourage you tovote your shares by proxy.
Q. Can I change my mind after I vote?A. You may change your vote at any time before the polls close at the meeting by (1) signing
another proxy card with a later date and returning it to us prior to the meeting, (2) voting atthe meeting if you are a registered stockholder or have obtained a legal proxy from yourbank or broker or (3) sending a notice to our Corporate Secretary prior to the meetingstating that you are revoking your proxy.
Q. What if I return my proxy card but do not provide voting instructions?A. Proxies that are signed and returned but do not contain instructions will be voted (1) FOR
the election of the twelve nominees for director, (2) FOR amendment of our certificate ofincorporation and (3) in accordance with the best judgment of the named proxies on anyother matters properly brought before the meeting.
Q. Will my shares be voted if I do not provide my proxy instruction form?A. If you are a registered stockholder and do not provide a proxy, you must attend the meeting
in order to vote your shares. If you hold shares through an account with a bank or broker,your shares may be voted even if you do not provide voting instructions on your instructionform. Brokers have the authority under New York Stock Exchange rules to vote shares forwhich their customers do not provide voting instructions on certain “routine” matters. Theelection of directors and the amendment of our certificate of incorporation are consideredroutine matters for which brokers may vote without specific instructions.
Q. May stockholders ask questions at the meeting?A. Yes. Our representatives will answer stockholders’ questions of general interest at the end
of the meeting. In order to give a greater number of stockholders an opportunity to askquestions, individuals or groups may be allowed to ask only one question and repetitive orfollow-up questions may not be permitted.
Q. How many votes must be present to hold the meeting?A. Your shares are counted as present at the meeting if you attend the meeting and vote in
person or if you properly return a proxy. In order for us to conduct our meeting, a majority ofour outstanding shares of common stock as of March 12, 2007 must be present in person orby proxy at the meeting (47,437,016 shares). This is referred to as a quorum. Abstentions andbroker non-votes will be counted for purposes of establishing a quorum at the meeting.
Q. How many votes are needed to approve UnitedAuto’s proposals?A. Regarding proposal 1, the twelve nominees receiving the highest number of “For” votes will
be elected as directors. This number is called a plurality. Shares not voted, whether bymarking “Abstain” on the proxy card or otherwise, will have no impact on the election ofdirectors. Regarding proposal 2, the affirmative vote of holders of a majority of the out-standing shares of common stock (47,437,016 shares) will be required for approval of theamendment to our certificate of incorporation and abstentions and broker non-votes willhave the effect of voting against the proposal.
1

PROPOSAL 1 — ELECTION OF DIRECTORSProposal 1 to be voted on at the annual meeting is the election of the following twelve
director nominees, each of whom is recommended by our Nominating and Corporate Gov-ernance Committee and Board of Directors. If elected, each of these nominees will serve aone-year term and will be subject to re-election at next year’s annual meeting. Pursuant to astockholders agreement, certain of our stockholders affiliated with Roger S. Penske andMitsui & Co., Ltd. have agreed to vote together to elect members of our Board of Directors.See “Related Party Transactions” for a description of this stockholders agreement.
Our Board of Directors Recommends a Vote “FOR” Each of The Following Nominees:
John D. Barr —CEO, Papa Murphy’sInternational, Inc.
Mr. Barr, 59, has served as a director since December 2002.Mr. Barr has been the Chief Executive Officer of Papa Murphy’sInternational, Inc., a take-and-bake pizza chain, since April2005 and its Vice Chairman since July 2004. From 1999 untilApril 2004, Mr. Barr served as President and Chief ExecutiveOfficer of Automotive Performance Industries, a vehicle trans-portation service provider. Prior thereto, Mr. Barr was Presidentand Chief Operating Officer, as well as a member of the Boardof Directors, of the Quaker State Corporation from June 1995to 1999. Prior to joining Quaker State, Mr. Barr spent 25 yearswith The Valvoline Company, a subsidiary of Ashland, Inc.,where he was President and Chief Executive Officer from1987 to 1995. Mr. Barr is a director of Clean Harbors, Inc.,James Hardie Industries, NV and UST, Inc.
Michael R. Eisenson —Managing Director andCEO of CharlesbankCapital Partners, L.L.C
Mr. Eisenson, 51, has served as a director since December1993. He is a Managing Director and CEO of CharlesbankCapital Partners LLC, a private investment firm and the succes-sor to Harvard Private Capital Group, Inc., which he joined in1986. Mr. Eisenson is also a director of Animal Health Interna-tional, Inc., Caliper Life Sciences, Inc., Catlin Group Limited andPlaytex Products, Inc., as well as a number of privatecompanies.
Hiroshi Ishikawa —Executive Vice President —International BusinessDevelopment of UnitedAuto
Mr. Ishikawa, 44, has served as a director since May 2004 andour Executive Vice President — International Business Devel-opment since June 2004. Previously, Mr. Ishikawa served asthe President of Mitsui Automotive North America, Inc. fromJune 2003 to May 2004. From October 2001 to May 2003,Mr. Ishikawa served as Vice President, Secretary & Treasurerfor Mitsui Automotive North America, Inc. From March 1997 toOctober 2001, Mr. Ishikawa served as the Assistant GeneralManager, Machinery & Automotive Department, of Mitsui & Co.(U.S.A.), Inc. Detroit Office.
Robert H. Kurnick, Jr. —Vice Chairman of UnitedAuto
Mr. Kurnick, Jr., 45, has served as our Vice Chairman sinceMarch 8, 2006 and a director since May 3, 2006. From February2000 until March 2006, Mr. Kurnick served as our ExecutiveVice President and General Counsel. Since January 2003,Mr. Kurnick has served as President of Penske Corporation.Employed by Penske Corporation since January 1995, Mr. Kur-nick has served in various capacities, including Executive VicePresident of Penske Corporation, from January 1995 toDecember 2002. Mr. Kurnick is also a director of PenskeCorporation.
2

William J. Lovejoy —Manager of Lovejoy &Associates
Mr. Lovejoy, 66, has served as a director since March 2004.Since September 2003, Mr. Lovejoy has served as Manager ofLovejoy & Associates, an automotive consulting firm. FromJanuary 2000 until December 2002, Mr. Lovejoy served asGroup Vice President, North American vehicle sales, serviceand marketing for General Motors Corporation. From 1994until December 1999, Mr. Lovejoy served as Vice Presidentof General Motors service and parts operation. From 1962 until1992, Mr. Lovejoy served in various capacities for GeneralMotors Acceptance Corporation (‘‘GMAC”) and ultimatelyPresident of GMAC in 1990.
Kimberly J. McWaters —CEO of Universal TechnicalInstitute, Inc.
Ms. McWaters, 42, has served as a director since December2004. Since October 2003, Ms. McWaters has served as CEOof Universal Technical Institute, Inc. (“UTI”), a nationwide pro-vider of technical educational training for individuals seekingcareers as professional automotive technicians. Since Febru-ary 2000, Ms. McWaters has served as President of UTI. From1984 until 2000, Ms. McWaters held several positions at UTIincluding vice president of marketing and vice president ofsales and marketing.
Eustace W. Mita —Chairman of AchristavestProperties, LLC
Mr. Mita, 52, has served as a director since August 1999. SinceOctober 2002, Mr. Mita has been chairman of AchristavestProperties, LLC, a developer of waterfront properties in NewJersey, Maryland, Massachusetts and Pennsylvania, andChairman of Mita Management, L.L.P., a closely held companywith interests in the automotive and real estate industries.From April 2000 until October 2001, Mr. Mita served as theExecutive Vice President of The Reynolds & Reynolds Com-pany. Prior thereto, Mr. Mita served as President and ChiefExecutive Officer of HAC Group, LLC, an automobile trainingand consulting company with operations in nineteen coun-tries, which was acquired by The Reynolds and ReynoldsCompany in 2000. In 1984, Mr. Mita founded Mita Leasing, aunique concept in automotive retailing and leasing. Mr. Mita isalso a founding director of First Republic Bank.
Lucio A. Noto —Retired Vice Chairman ofExxonMobil Corporation
Mr. Noto, 68, has served as a director since March 2001.Mr. Noto retired as Vice Chairman of ExxonMobil Corporationin January 2001, a position he had held since the merger ofExxon and Mobil companies in November 1999. Before themerger, Mr. Notowas Chairman and CEO of Mobil Corporation,where he had been employed since 1962. Mr. Noto is a man-aging partner of Midstream Partners LLC, an investment com-pany specializing in energy and transportation projects. He isalso a director of International Business Machines Corpora-tion, the Altria Group, Inc., Shinsei Bank, Stem Cell Innova-tions, Inc. and the Commercial International Bank of Egypt.Mr. Noto is a member of the Temasek Technologies (Singapore)International Advisory Counsel.
Roger S. Penske —Chairman of the Board andCEO of UnitedAuto andPenske Corporation
Mr. Penske, 70, has served as our Chairman and CEO sinceMay 1999. Mr. Penske has also been Chairman of the Boardand CEO of Penske Corporation since 1969. Penske Corpo-ration is a privately owned diversified transportation services
3

company that holds, through its subsidiaries, interests in anumber of businesses. Mr. Penske has also been Chairmanof the Board of Penske Truck Leasing Corporation since 1982.Mr. Penske serves as a member of the Boards of Directors ofGeneral Electric Company and Universal Technical Institute.Mr. Penske also is Chairman of the Downtown Detroit Partner-ship, a director of Detroit Renaissance and a member of TheBusiness Council.
Richard J. Peters —Managing Director ofTransportation ResourcePartners, LP
Mr. Peters, 59, has served as a director since May 1999. SinceJanuary 2003, Mr. Peters has been a Managing Director ofTransportation Resource Partners (‘‘TRP”). From January 2000to December 2002, Mr. Peters was President of Penske Cor-poration. Since 1997, Mr. Peters has also served as Presidentand CEO of R.J. Peters & Company, LLC, a private investmentcompany. Mr. Peters has also served as an officer and directorof various subsidiaries of Penske Corporation since 1990.Mr. Peters has been a member of the Board of Directors ofPenske Corporation since 1990 and serves as a member of theBoard of Directors of various TRP portfolio companies, includ-ing Autocam Corporation.
Ronald G. Steinhart —Retired Chairman andCEO, Commercial BankingGroup, Bank OneCorporation
Mr. Steinhart, 66, has served as a director since March 2001.Mr. Steinhart served as Chairman and CEO, Commercial Bank-ing Group, of Bank One Corporation from December 1996 untilhis retirement in January 2000. From January 1995 to Decem-ber 1996, Mr. Steinhart was Chairman and CEO of Bank One,Texas, N.A. Mr. Steinhart joined Bank One in connection withits merger with Team Bank, which he founded in 1988.Mr. Steinhart also serves as a director of Animal Health Inter-national, Inc., Texas Industries Inc., Penson Worldwide, Inc.,and as a Trustee of the MFS/Compass Group of mutual funds.
H. Brian Thompson —Chairman of ComsatInternational
Mr. Thompson, 67, has served as a Director since March 2002.Mr. Thompson is Executive Chairman of Global Telecom &Technology (GTT), a worldwide multi-network telecommuni-cations operator. He is also Chairman of Comsat International,a telecommunications services provider, and heads his ownprivate equity investment and advisory firm, Universal Tele-communications, Inc., in Vienna, Virginia. Mr. Thompsonserved as Chairman and CEO of Global TeleSystems Group,Inc. from March 1999 through September 2000 and from 1991to 1998, he served as Chairman and CEO of LCI International.Subsequent to the June 1998 merger of LCI with Qwest Com-munications International Inc., Mr. Thompson became ViceChairman of the Board for Qwest until his resignation inDecember 1998. In 1999, Mr. Thompson was Chairman ofthe Irish telephone company, Telecom Eirann, and ExecutiveVice President of MCI Communications Corporation from 1981to 1990. Mr. Thompson currently serves as a member of theBoard of Directors of Axcelis Technologies, Inc., Bell CanadaInternational Inc., and Sonus Networks, Inc.
4

PROPOSAL 2 — AMENDMENT TO CERTIFICATE OF INCORPORATION TOCHANGE OUR NAME FROM “UNITED AUTO GROUP, INC.” TO
“PENSKE AUTOMOTIVE GROUP, INC.”Our Board of Directors has unanimously approved, subject to stockholder approval, an
amendment to our certificate of incorporation to change our name from United Auto Group, Inc.to Penske Automotive Group, Inc.
The Board of Directors believes that the Penske name is favorably received in the businesscommunity in light of the performance and recognition of other Penske Corporation invest-ments such as Penske Truck Leasing, a global transportation services provider and supplychain management company. We also believe the change will benefit our company because ofthe “Penske” name recognition and its association with general excellence, due in part to thesuccesses of Penske Racing as well as the business success of Penske Corporation. For thesesame reasons, we currently utilize the “Penske” name at several of our franchises. If the namechange is approved, we will execute a license agreement for the “Penske” name from PenskeCorporation.
The voting and other rights of our common stock will not be affected by the change incorporate name. It also will not affect in any way the validity or transferability of currentlyoutstanding stock certificates and stockholders are not required to surrender those certificatesas a result of the name change. In connection with our name change, we expect to obtain a newNew York Stock Exchange Trading Symbol. The text of the proposed amendment to ourcertificate of incorporation is attached as Annex A. We expect to officially change our corporatename by filing this amendment on July 1, 2007.
THE BOARD OF DIRECTORS RECOMMENDS A VOTE “FOR” THE AMENDMENT TOOUR CERTIFICATE OF INCORPORATION TO CHANGE OUR NAME FROM
“UNITED AUTO GROUP, INC.” TO PENSKE AUTOMOTIVE GROUP, INC.
OUR CORPORATE GOVERNANCE
2006 DIRECTORS BOD Audit
Compensation &ManagementDevelopment
Nominating &Corporate
Governance Executive
John D. Barr . . . . . . . . . . . . . . . . . . . X XMichael R. Eisenson . . . . . . . . . . . . X X XHiroshi Ishikawa . . . . . . . . . . . . . . . . XRobert H. Kurnick, Jr. . . . . . . . . . . . XWilliam J. Lovejoy . . . . . . . . . . . . . . . X XKimberly J. McWaters . . . . . . . . . . . X XEustace W. Mita . . . . . . . . . . . . . . . . X X XLucio A. Noto . . . . . . . . . . . . . . . . . . X XRoger S. Penske. . . . . . . . . . . . . . . . X XRichard J. Peters . . . . . . . . . . . . . . . X XRonald G. Steinhart . . . . . . . . . . . . . X XH. Brian Thompson . . . . . . . . . . . . . X X XNo. of Meetings 2006. . . . . . . . . . . . 7 14 5 2 0
Our Board of Directors has four standing committees: the Audit Committee, the Com-pensation and Management Development Committee, the Nominating and Corporate Gover-nance Committee and the Executive Committee. The Board of Directors approved a charter foreach of the Audit, Compensation and Management Development, and Nominating and Cor-porate Governance committees, which charters are available on our website,
5

www.unitedauto.com under the tab “Corporate Governance” or in print (see “Corporate Gov-ernance Guidelines” below). The principal responsibilities of each committee are describedbelow. All of our directors attended over 83% of our board and committee meetings in 2006,other than Ms. McWaters who attended 67% of the relevant meetings. The average attendanceof our Board members in 2006 was 93%. All of our directors are encouraged to attend theannual meeting and all did attend the annual meeting in 2006.
Audit Committee. The purpose of this committee is to assist the Board of Directors infulfilling its oversight responsibility relating to (1) the integrity of our financial statements andfinancial reportingprocess and our systems of internal accountingand financial controls; (2) theperformance of the internal audit function; (3) the annual independent audit of our financialstatements, (4) the engagement of the independent registered public accounting firms and theevaluation of the independent registered public accounting firms’ qualifications, indepen-dence and performance; and (5) the fulfillment of the other responsibilities set out in the AuditCommittee charter. The Board of Directors has confirmed that all members of the AuditCommittee are “independent” and “financially literate” under the New York Stock Exchangerules and applicable law, and each is an “audit committee financial expert,” as that term isdefined in Securities and Exchange Commission rules. Mr. Steinhart serves on the auditcommittee of three other entities. In 2007, the Board determined that Mr. Steinhart’s simulta-neous service on four audit committees would not impair his ability to effectively serve as amember of our audit committee.
Compensation and Management Development Committee. The purpose of this com-mittee is to assist the Board of Directors in discharging its responsibility relating to compen-sation of our directors, executive officers and such other employees as this committee maydetermine, succession planning and related matters. Each committee member is independentunder our guidelines for director independence.
Nominating and Corporate Governance Committee. The purpose of this committee isto identify individuals qualified to become members of the Board of Directors, to recommendDirector nominees for each annual meeting of stockholders and nominees for election to fill anyvacancies on the Board of Directors and to address related matters. This committee alsodevelops and recommends to the Board of Directors corporate governance principles and isresponsible for leading the annual review of our corporate governance policies and the Boardof Directors’ performance. Each of the Committee members is independent under our guide-lines for director independence.
Executive Committee. Our Executive Committee’s primary function is to assist ourBoard of Directors by acting upon matters when the Board of Directors is not in session.The Executive Committee has the full power and authority of the Board of Directors, except tothe extent limited by law or our certificate of incorporation or bylaws.
Corporate Governance Guidelines. The Nominating and Corporate Governance Com-mittee also makes recommendations concerning our corporate governance guidelines, whichare posted on our website, www.unitedauto.com, under the tab “Corporate Governance.”These guidelines, and the other documents referenced in this section, are also available in printwithout charge to any stockholder who requests them by calling our investor relations depart-ment at 248-648-2500.
Lead Director. One of our governance principles is that we have an independent “LeadDirector,” who is responsible for coordinating the activities of the other outside Directors,including the establishment of the agenda for executive sessions of the outside Directors, andwho shall preside at their meetings. These sessions generally occur as part of each Boardmeeting and include, at least annually, a session comprised of only our independent directors.Our Lead Director is currently H. Brian Thompson. He may be contacted by leaving a messageat the following telephone number: 800-469-1634. All messages will be reviewed by our
6

Corporate Secretary’s office and all (other than frivolous messages) will be forwarded to theLead Director. Any written communications to the Board of Directors may be sent care of theCorporate Secretary to our principal executive office. These communications (other thanfrivolous messages) also will be forwarded to the Lead Director.
Code of Conduct. We have also adopted a Code of Business Conduct and Ethics,applicable to all of our employees and directors, which is posted on our website at www.u-nitedauto.com under the tab “Corporate Governance” and is available in print (see “CorporateGovernance Guidelines” above). We plan to disclose waivers, if any, for our executive officersor directors from the code on our website, www.unitedauto.com.
Director Independence. A majority of our Board of Directors is independent and each ofthe members of our audit, compensation and nominating committees is independent. TheBoard of Directors has determined that Ms. McWaters and Messrs. Barr, Eisenson, Lovejoy,Mita, Steinhart and Thompson are each independent in accordance with the listing require-ments of the New York Stock Exchange, as well as with the more stringent requirements of ourguidelines for independent directors found in our corporate governance guidelines which areavailable on our website www.unitedauto.com and are set forth below. As required by New YorkStock Exchange rules, our Board of Directors made an affirmative determination as to eachindependent director that no material relationship exists which, in the opinion of the Board ofDirectors, would interfere with the exercise of independent judgment in carrying out theresponsibilities of a director. In making these determinations, the Board of Directors reviewedand discussed information provided by the directors and us with regard to each director’sbusiness and personal activities as they may relate to us and our management.
For a director to be considered independent under our corporate governance guidelines,the Board of Directors must determine that the director does not have any direct or indirectmaterial relationship with us (including any parent or subsidiary in a consolidated group withus). In addition to applying these guidelines, the Board of Directors considers relevant factsand circumstances in making an independence determination, and not merely from thestandpoint of the director, but also from that of persons or organizations with which the directorhas an affiliation. With respect to our independent directors, the Board considered the trans-actions, relationships and arrangements described under “Related Party Transactions” in itsindependence determination.
Under our guidelines, a director will not be independent if:
1. the director is employed by us, or an immediate family member is one of ourexecutive officers;
2. the director receives any direct compensation from us, other than director andcommittee fees and forms of deferred compensation for prior service (providedsuch compensation is not contingent in any way on continued service);
3. the director is affiliated with or employed by our independent registered publicaccounting firms (or internal auditors), or an immediate family member is affiliatedwith or employed in a professional capacity by our independent registered publicaccounting firms (or internal auditors); or
4. an executive officer of ours serves on the compensation committee of the board ofdirectors of a company that employs the director or an immediate family member asan executive officer.
A director also will not be independent if, at the time of the independence determination,the director is an executive officer or employee, or if an immediate family member is anexecutive officer, of another company that does business with us and the sales by thatcompany to us or purchases by that company from us, in any single fiscal year during the
7

evaluation period, are more than the greater of one percent of the annual revenues of thatcompany or $1 million. Furthermore, a director will not be independent if, at the time of theindependence determination, the director is an executive officer or employee, or an immediatefamily member is an executive officer, of another company that is indebted to us, or to which weare indebted, and the total amount of either company’s indebtedness to the other at the end ofthe last completed fiscal year is more than one percent of the other company’s total consol-idated assets. Finally, a director will not be independent if, at the time of the independencedetermination, the director serves as an officer, director or trustee of a charitable organization,and our charitable contributions to the organization are more than one percent of thatorganization’s total annual charitable receipts during its last completed fiscal year.
Under the New York Stock Exchange rules, if a company is “controlled,” it need not have amajority of independent directors or solely independent compensation or nominating com-mittees. We are a “controlled company” because more than 50% of the voting power for theelection of directors is collectively held by Penske Corporation, Mitsui & Co. and their affiliates.These entities are considered a group due to the provisions of the stockholders agreementbetween these parties described under “Related Party Transactions.” Even though we are a“controlled company,” we are fully compliant with the New York Stock Exchange rules for non-controlled companies. A majority of our Board of Directors is independent and each of ournominating, audit and compensation committees is comprised solely of independentdirectors.
Director Nominees. The Nominating and Corporate Governance Committee believesthat director candidates should have certain minimum qualifications, including having personalintegrity, loyalty to UnitedAuto and concern for its success and welfare, willingness to applysound and independent business judgment and time available for UnitedAuto matters. Expe-rience in at least one of the following is also desired: high level of leadership experience inbusiness or administration, breadth of knowledge concerning issues affecting UnitedAuto,willingness to contribute special competence to board activities, accomplishments within thedirector’s respective field, and experience reading and understanding financial statements.The Nominating and Corporate Governance Committee retains the right to modify thesequalifications from time to time.
The Nominating and Corporate Governance Committee’s process for identifying andevaluating nominees is as follows: in the case of incumbent directors whose terms of officeare set to expire, the Committee reviews such directors’ overall service to UnitedAuto duringtheir term. In the case of new director candidates, the Committee uses its network of contactsto compile potential candidates, but may also engage, if it deems appropriate, a professionalsearch firm. The Committee considers whether the nominee would be independent and meetswith each candidate individually to discuss and consider his or her qualifications and, ifapproved, recommends the candidate to the Board.
The Nominating and Corporate Governance Committee will consider director candidatesrecommended by stockholders. Stockholder proposals for nominees should be addressed toCorporate Secretary, United Auto Group, 2555 Telegraph Road, Bloomfield Hills, MI 48302 andmust comply with the procedures outlined immediately below. The committee’s evaluation ofstockholder-proposed candidates will be the same as for any other candidates.
Stockholders who wish to recommend individuals for consideration by the committee tobecome nominees for election to the Board may do so by submitting a written recommendationto the Corporate Secretary. Submissions must include sufficient biographical informationconcerning the recommended individual, including age, employment history with employernames and a description of the employer’s business, whether such individual can read andunderstand basic financial statements and a list of board memberships and other affiliations ofthe nominee. The submission must be accompanied by a written consent of the individual to
8

stand for election and serve if elected by the stockholders, a statement of any relationshipsbetween the person recommended and the person submitting the recommendation, a state-ment of any relationships between the candidate and any automotive retailer, manufacturer orsupplier and proof of ownership by the person submitting the recommendation of 500 shares ofour common stock for one year. Recommendations received by November 29, 2007, will beconsidered for nomination at the 2008 annual meeting of stockholders. Recommendationsreceived after November 29, 2007 will be considered for nomination at the 2009 annualmeeting of stockholders.
Compensation Committee Interlocks and Insider Participation. During 2006, theCompensation and Management Development Committee was comprised of H. Brian Thomp-son (Chairman), Eustace Mita and William Lovejoy. As more fully discussed under “RelatedParty Transactions,” Mr. Mita is an investor in Transportation Resource Partners, which isaffiliated with Penske Corporation. In addition, Mr. Mita’s son is employed by us as a generalmanager for which he was compensated $311,400 in 2006, which compensation is commen-surate with his peers’.
EXECUTIVE OFFICERSOur executive officers are elected by the Board of Directors and hold office until their
successors have been duly elected and qualified or until their earlier resignation or removalfrom office. Brief biographies of Messrs. Kurnick and Penske are set forth above. Brief biog-raphies of our other executive officers are provided below.
Roger Penske, Jr., 47, has served as our President since January 3, 2007. From July 2003 toJanuary 2007, he served as our Executive Vice President — East Operations and from January2001 to July 2003 he served as our President — Mid-Atlantic Region. Mr. Penske, Jr. serves as amember of the Board of Directors of Penske Corporation and is the son of our Chairman andChief Executive Officer.
Robert T. O’Shaughnessy, 41, has served as our Executive Vice President and ChiefFinancial Officer since January 3, 2007. From July 2005 until January 2007, he served as SeniorVice President — Finance. From August 1999 until July 2005, he served as our Vice Presidentand Controller. Prior to joining us in May 1997 as Assistant Controller, Mr. O’Shaughnessy was asenior manager for Ernst & Young LLP, an accounting and financial advisory services firm,which he joined in 1987.
Paul F. Walters, 63, has served as our Executive Vice President — Human Resources sinceAugust 1999. Since July 1997, Mr. Walters has also served as Executive Vice President —Administration of Penske Corporation. Mr. Walters served as Senior Vice President of DetroitDiesel Corporation from August 1997 to December 2000.
COMPENSATION COMMITTEE REPORTThe Compensation and Management Development Committee of the Board of Directors,
which we will refer to as the “compensation committee” or “committee”, has reviewed anddiscussed the Compensation Discussion and Analysis set forth below with management.Based on this review and these discussions with management, the committee has recom-mended to our Board of Directors that the Compensation Disclosure and Analysis be includedin this proxy statement.
The Compensation & ManagementDevelopment Committee of the Board ofDirectors
H. Brian Thompson (Chairman)William J. LovejoyEustace W. Mita
9

COMPENSATION DISCUSSION AND ANALYSIS (“CD&A”)
I. General Information
Our Compensation Committee. Our compensation committee is comprised of threeindependent directors, as determined by our Board of Directors pursuant to the listing require-ments of the New York Stock Exchange, as well as the more stringent requirements of ourcorporate governance guidelines. See “Our Corporate Governance — Director Independence”for a discussion of these independence requirements. Our committee’s primary responsibil-ities are to:
• Determine all elements of our executive officer compensation;
• Review and recommend compensation for other members of senior management;
• Review and recommend our compensation and benefit policies for our employeesgenerally;
• Administer our equity incentive plans;
• Make recommendations to the Board of Directors with respect to directorcompensation; and
• Review our management progression and succession plans.
These responsibilities are set out in the committee’s charter which you can find at our websitewww.unitedauto.com. This charter is reviewed annually by our corporate governance com-mittee and Board of Directors. The compensation committee retains the authority to delegateits duties to a subcommittee, though it did not do so in 2006. Proposed committee meetingagendas are prepared by management and sent to the committee prior to every meeting alongwith material for committee review. The final agenda for each meeting is determined by thecommittee chairman. The committee met five times during 2006, and each meeting is typicallyconcluded with an executive session including only the committee members.
Outside Advisors and Consultants. Our compensation committee has the authority tohire outside consultants and advisors at their discretion, and it has full access to any of ouremployees. While it may do so in the future, neither the committee nor company managementhas retained any outside consultants to assist them in fulfilling their duties in the past severalyears.
Role of Executive Officers. The committee relies on our senior management to assist infulfilling many of its duties, in particular our Executive Vice President — Human Resources andChief Executive Officer, each of whom attend part of most committee meetings. These exec-utives make recommendations concerning our compensation policies generally, certain spe-cific elements of compensation for senior management (such as restricted stock awards andbonuses) as well as report to the committee as to company personnel and developments. OurChief Executive Officer also makes specific compensation recommendations concerning ourother executive officers and other employees. Our Chief Executive Officer does not participatein determining his own compensation.
II. Compensation Philosophy
Our compensation program is designed to motivate and reward our executive officers andother key employees, to enhance long-term stockholder value and to attract and retain thehighest quality executive and key employee talent available. We believe our executive com-pensation should be aligned with increasing the value of our common stock and promoting ourkey strategies, values and long term financial and operational objectives.
10

Our compensation program detailed below has evolved over time. At several times duringeach year, the program is reviewed in whole or in part with respect to various factors, including:competitive benchmarking; the tax treatment and the accounting treatment of certain ele-ments of employee compensation; and recent trends regarding executive compensation. Weevaluate the effectiveness of our program generally based on our ability to motivate ourexecutives to deliver superior company wide performance and to retain them on a cost-effective basis.
The majority of our executive and employee compensation is payable in cash in the short-term, and is comprised principally of salary and cash bonuses, which we believe is typicalwithin our industry. We use cash compensation as the majority of our compensation becausewe believe it provides the most flexibility for our employees. However, we also provide long-term compensation in the form of restricted stock awards for certain employees. Our restrictedstock program awards typically vest over four years, with 70% of any award vesting in the thirdand fourth years. We believe this long term compensation helps us to align management’sgoals with those of our other stockholders and provides a long-term retention inducement forour key employees, as discussed below under the heading “Restricted Stock”.
We do not have any required stock ownership guidelines for our employees. We monitorthe stock ownership of our key executives and believe the weighted vesting of our restrictedstock awards will contribute to our executive officers holding a significant equity position in ourcompany.
Determination of Amounts. The committee reviews and determines all aspects ofcompensation for our executive officers. In making decisions regarding non-CEO compen-sation, the committee receives input from our Chief Executive Officer. The committee reviewsannual salary increases or decreases with a view to maintaining external compensationcompetitiveness. External competitiveness is benchmarked against each of the other publiclytraded automotive retailers. We are the second largest publicly traded automotive retailer andthe only one with international operations. While we benchmark our compensation, we do nottarget a specific quartile of pay for our executive officers as compared to our peers as webelieve each of our executive officer’s circumstances and challenges is unique to the individualand we base our compensation accordingly.
Management Incentive Plan. Section 162(m) of the Internal Revenue Code of 1986, asamended, generally imposes a $1 million per year ceiling on tax-deductible remuneration paidto any one of the named executive officers of a public company, unless the remuneration istreated as performance-based or is otherwise exempt from the provisions of Section 162(m).We have designed our Management Incentive Plan, which was approved by our shareholdersin 2004, to provide for the payment of performance-based compensation that is qualifiedwithin the meaning of Section 162(m) of the Internal Revenue Code.
We expect to continue to issue awards under the Management Incentive Plan for our ChiefExecutive Officer, as well as any other officers for whom we believe this plan would provide akey motivation to advance specific annual objectives of the Company. For any awards, thecompensation committee reserves negative discretion to reduce (but not increase) the payoutunder the award. While the committee intends to maximize the tax-efficiency of its compen-sation programs generally, it retains flexibility in the manner in which it awards compensation toact in our best interests, including awarding compensation that may not be tax deductible.
III. Our Compensation Program
Our compensation program primarily consists of four elements:
• base salary;
• annual cash bonus payment;
11

• annual restricted stock award; and
• employee health care and other benefits, such as the use of a company vehicle.
Base Salary. We pay base salary to set a baseline level of compensation for all seniormanagement. The salary levels for our executive officers are determined by scope of jobresponsibility, experience, individual performance, historical salary levels and benchmarkinginformation discussed earlier under “Determination of Amounts”. The committee approvessalary levels for executive officers and certain key employees in order to maintain externalcompensation competitiveness using the benchmarks noted above, and to reflect the contri-butions by those employees in the prior year. The committee also considers our achievement ofcorporate objectives and general economic factors.
Annual Bonus Payments. Each member of our senior management is also eligible toreceive an annual discretionary bonus payment, although our Chief Executive Officer insteadhas historically received the amounts resulting from his performance based awards describedbelow under “Chief Executive Officer Compensation”. We pay annual bonuses to provide anincentive for future performance and as a reward for performance during the prior year. Bonuspayments are determined in varying degrees based on three criteria:
• Evaluation of an individual’s performance in the prior year;
• Evaluation of the annual performance of an individual’s business unit; and
• Our previous year’s company-wide performance and the attainment of corporateobjectives.
Since the annual bonus is based in part on our company-wide performance, we believe theannual bonus also focuses employees on our corporate goals designed to increase stock-holder value.
Restricted Stock. The committee believes that the interests of senior managementshould be closely aligned with those of our stockholders. Therefore, each member of seniormanagement is eligible to receive an incentive equity award because we believe equity grantseffectively align management’s goals with those of our other stockholders.
In 2006, we adopted a written equity award approval policy. Under this policy, all equityawards must be approved by the Board of Directors or compensation committee, whichapproval, absent extenuating circumstances, shall occur at a meeting as opposed to by writtenconsent. The award grant date and price (if applicable) shall be the closing price of our commonstock on the meeting date and the terms of every award are to be reflected in the minutes of themeeting. We typically grant restricted stock awards annually at the first compensation com-mittee meeting of the calendar year. Committee meetings are generally scheduled at least ayear in advance and scheduling decisions are made without regard to anticipated earnings orother major Company announcements. We endeavor to vest all shares on the same date foradministrative ease and endeavor to vest shares outside of a restricted period under our insidertrading policy in order to facilitate sales of shares by recipients to pay for applicable taxes.
In 2006, we issued incentive compensation to our senior management team in the form ofrestricted stock under our 2002 Equity Compensation Plan. Our restricted stock grants formanagement typically vest over four years at a rate of 15%,15%, 20% and 50% per annum,respectively. These shares are subject to forfeiture in the event the executive departs from theCompany. We believe vesting the majority of the awards in the third and fourth years provides alonger-term incentive and more closely aligns the incentives for management with the interestsof our long-term stockholders. We employ this form of compensation in part because many ofour initiatives may take several years to show benefits, such as building best-in-class facilities.These initiatives may be costly in the short-term, but we believe they will provide benefits foryears to come. We also believe that weighted vesting of these awards provides an additional
12

incentive to retain our valuable employees due to the value that may be created over time. Ourrestricted stock awards are designed to mirror our other outstanding stock and thus enable therecipients to vote with our other shareholders and receive dividends.
Our restricted stock grants are generally discretionary (other than those awarded to ourChief Executive Officer or others under our Management Incentive Plan discussed above),based upon a guideline range that takes into account the responsibilities of executive officersand key employees whose contributions and skills are important to our long-term success. In2006, the committee granted approximately 241,000 shares of restricted stock to employees(representing about 0.25% of our current outstanding equity), some of which have revertedback to us as employees have departed from our company. From time-to-time, the committeealso approves special equity awards based on an employee’s outstanding contributions,commencement of employment or other factors.
Other Compensation. We provide our employees with selected benefits or perquisitesin order to attract and retain highly skilled employees. All of our employees are entitled to anumber of benefits such as company contributions toward health and welfare benefits, com-pany matching under our 401(k) plan, and life insurance. We believe these benefits manifest ourconcern for our employees and provide an inducement and retention advantage. With respectto health and welfare benefits, the committee believes that our employees should receive ameaningful benefit package commensurate with those of other automotive retailers, recog-nizing the increasing cost of those benefits in recent years.
As we are an automotive retailer, our senior management is typically provided the use of acompany vehicle, company-sponsored automobile insurance, and a tax gross-up relating tothese amounts. We typically contribute a monthly allowance toward a lease payment for acompany vehicle selected by the employee. The vehicle must be leased from one of ourdealerships and the allowance is based on an employee’s position within our company. In somecircumstances, we purchase a vehicle outright if we believe this will be more cost effective overthe life of the vehicle’s use. We have valued the use of company vehicles in the followingdisclosure tables based on the value of our lease payments or, in situations where we havepurchased a vehicle, on IRS guidelines. We also pay for maintenance and repairs on thevehicles, which costs are included in those tables. Similar to any company providing itsproducts to employees, we provide these vehicles as an inducement and retention benefit.Moreover, because of our unique position as an automotive retailer, we generally can providethese vehicles to employees at a lower cost than could be obtained by the employee.
From time to time, we may adopt other benefits for our senior management, such aspayment for a country club membership or tax gross-ups for certain items. We review thesebenefits on a case-by-case basis and believe, if limited in scope, such benefits can provide anincentive to long term performance and help retain our valuable employees. The value of theseother types of perquisites are quantified based on our cost.
Other Forms of Compensation. The committee has also reviewed various other forms ofexecutive compensation for our management, such as stock options and supplemental retire-ment plans. Prior to 2003, the principal form of equity compensation we employed was thegranting of stock options. Currently, the committee is of the view that salary, bonus andrestricted stock awards should provide the principal components of management compen-sation and that these forms of compensation best align management’s goals with those of ourstockholders. Therefore, after review, the committee has determined not to issue or grant stockoptions, allow for deferred compensation in the form of a deferral of salary or bonus, or anyretirement benefit (other than under our 401(k) plan that is available to all qualified employees).The committee considers the advisability of these additional types of compensation period-ically and retains the flexibility to implement other forms of compensation in the future.
13

No Employment Agreements, Change of Control and Severance Compensation.None of our current executive officers have been provided an employment agreement, norare they entitled to any severance compensation or compensation upon a change of control.We believe our mix of short-term and long-term compensation provides a retention incentivethat makes an employment contract unnecessary, while providing us maximum flexibility withrespect to managing our executive officers. Our lack of pre-arranged severance compensationis consistent with our performance based compensation philosophy, and provides us theflexibility to enter into a post-employment arrangement with an employee based on thecircumstances existing upon departure. This also provides a retention benefit by subjectingto forfeiture our historical equity grants. Historically, we have entered into consulting agree-ments with our departing senior management as we believe it may be important to havecontinuing access to these employee’s institutional knowledge base and guidance. In theseevents, we insist on obtaining a non-compete agreement with these individuals.
In January 2007, our former Executive Vice President — Finance, James R. Davidson,retired from this position. We agreed that Mr. Davidson will remain a part-time employee ofours taking on the responsibility of assisting with certain of our finance operations. We believethis arrangement will provide us with continuing access to Mr. Davidson’s guidance at asignificantly reduced cost. With respect to our former president and chief operating officerwho retired in March 2006, we began a multi-year consulting arrangement that was agreedcontractually at the time of his initial employment. See the discussion under “Potential Ter-mination Payments” for details of this agreement. Both of these former executive officers arelimited by typical non-compete and confidentiality restrictions.
With respect to a change in control, none of our current executive officers have beenguaranteed any change of control payments. However, our outstanding equity awards providethat, in the event of a change of control, the compensation committee has the discretion toaccelerate, vest or rollover any outstanding equity awards.
IV. 2006 Compensation
2006 compensation is noted in the tables following this section. In reviewing individualcompensation, the committee employs a form of “tally sheet” designed to capture all elementsof compensation.
Chief Executive Officer Compensation. In determining the compensation of Mr. Penske,the committee considered the company performance noted below, and also reviewed the CEOcompensation and the financial performance of our peer companies. The committee alsoconsidered Mr. Penske’s previous year’s compensation. Based on their review, the committeeproposed an increase in Mr. Penske’s base salary in 2006. However, for the second consecutiveyear, Mr. Penske declined the salary increase in order to align a greater percentage of hiscompensation with company performance and the value of our common stock. Therefore, thecommittee maintained Mr. Penske’s base salary at $750,000 in 2006. In March 2007, theCommittee again proposed an increase in Mr. Penske’s salary which he declined for the samereasons.
In March 2007, the Committee awarded Mr. Penske 78,886 shares of restricted stockvalued at $1.7 million based on the closing price on the New York Stock Exchange on the date ofapproval ($21.55). These shares vest over a four year period at a rate of 15%,15%, 20% and50% with the final vesting in June 2011, subject to forfeiture in the event Mr. Penske departsfrom the Company. These shares resulted from a performance based award which had beengranted to Mr. Penske in March of 2006 under our management incentive plan discussedabove. The maximum potential amount Mr. Penske could have earned pursuant to this awardwas $2.5 million, though the committee reserved discretion to reduce (but not increase) thepayout under these awards. The amount earned was payable in either cash or stock at the
14

committee’s discretion. Mr. Penske achieved 68% of the performance metrics noted below,which entitled Mr. Penske to the $1.7 million. The specific 2006 performance objectives andrelated performance were as follows:
Objective Result % of award Achievement
• return on equity of 11% . . . . . . . . . . . . . . . . . . . . . . 10.8% 8% 0%• same store retail sales revenue increase of 3% . . . 4.3% 8% 8%• acquisition of annualized revenue of $300 million. . $1.7 billion 8% 8%• employee turnover below 34% . . . . . . . . . . . . . . . . 31.2% 8% 8%• same store service and parts gross increase of
10% or more . . . . . . . . . . . . . . . . . . . . . . . . . . . . . . 6.9% 8% 0%• customer satisfaction scores exceed
manufacturer objectives at 80% of ourfranchises. . . . . . . . . . . . . . . . . . . . . . . . . . . . . . . . . Exceeds 8% 8%
• gross margin greater than 15.5% . . . . . . . . . . . . . . 15.2% 8% 0%• debt to capitalization below 45% . . . . . . . . . . . . . . 48% 8% 0%(1)
• no material weaknesses in our internal controls . . . None 8% 8%• new car inventory less than 60 days supply . . . . . . 52 days 8% 8%
and used car inventory less than 45 days supply . . 40 days• earnings per share from continuing operations at
least $1.35 per share . . . . . . . . . . . . . . . . . . . . . . . . $1.39 10% 10%• common stock price appreciation of 10% . . . . . . . 23% 10% 10%
Total: . . . . . . . . . . . . . . . . . . . . . . . . . . . . . . . . . . . . . . 100% 68%
(1) In December 2006, we issued $375 million of 7.75% senior subordinated notes. For strategicreasons, we used a portion of the proceeds to temporarily repay amounts outstanding under ourfloor plan borrowings until redemption of our outstanding 9.625% notes in March 2007. Had weinstead redeemed the 9.625% notes in December 2006, our debt to capitalization would have been40%, which would have satisfied this percentage of the award.
In March 2007, the Committee established a similar award for Mr. Penske with respect to2007 with a maximum potential payout of $3.0 million. The performance objectives for 2007 areas follows:
Objective % of award
• return on equity of 11%. . . . . . . . . . . . . . . . . . . . . . . . . . . . . . . . . . . . . . . . . . . . . 8%• same store retail revenue increase of 3% . . . . . . . . . . . . . . . . . . . . . . . . . . . . . . 8%• acquisition of annualized revenue of $250 million . . . . . . . . . . . . . . . . . . . . . . . . 8%• employee turnover below 31% . . . . . . . . . . . . . . . . . . . . . . . . . . . . . . . . . . . . . . 8%• same store service and parts revenue increase of 8% or more . . . . . . . . . . . . . 8%• customer satisfaction scores exceed manufacturer objectives at 80% of our
franchises . . . . . . . . . . . . . . . . . . . . . . . . . . . . . . . . . . . . . . . . . . . . . . . . . . . . . . . 8%• gross margin greater than 15.25% . . . . . . . . . . . . . . . . . . . . . . . . . . . . . . . . . . . . 8%• debt to capitalization below 41%. . . . . . . . . . . . . . . . . . . . . . . . . . . . . . . . . . . . . 8%• no material weaknesses in our internal controls . . . . . . . . . . . . . . . . . . . . . . . . . 8%• new car inventory less than 60 days supply and used car inventory less than
45 days supply . . . . . . . . . . . . . . . . . . . . . . . . . . . . . . . . . . . . . . . . . . . . . . . . . . . 8%• earnings per share from continuing operations at least $1.40 per share . . . . . . 10%• common stock price appreciation of 10% . . . . . . . . . . . . . . . . . . . . . . . . . . . . . . 10%
Total: . . . . . . . . . . . . . . . . . . . . . . . . . . . . . . . . . . . . . . . . . . . . . . . . . . . . . . . . . . . . . 100%
15

In summary, Mr. Penske earned $750,000 in salary and $1.7 million in the form of arestricted stock award for a total of $2.45 million for his performance in 2006. This figurediffers from the amount disclosed in the summary compensation table because, for reportingpurposes, the table includes only $393,878 relating to equity awards, which is the amount weexpensed in 2006 relating to Mr. Penske’s equity awards. For internal benchmarking purposes,we will look to the $2.45 million figure as a more accurate measure of Mr. Penske’s total annualcompensation.
Other Executive Officer Compensation. Each of our other executive officers receivedthe stock awards and bonuses set forth in the tables below. In March 2007, the compensation ofMr. O’Shaughnessy was increased to $565,000 retroactive to January 1, 2007, and he wasawarded 10,000 shares of restricted stock vesting over four years at a rate of 15%,15%, 20%and 50%. Messrs. Kurnick and Walters also received 10,000 and 6,000 restricted shares,respectively, with the same vesting schedule. These amounts were determined based on theprinciples set forth above. Mr. Kurnick, our Vice Chairman, is also the President of PenskeCorporation and Mr. Walters, our Executive Vice President of Human Resources, also serves ina similar capacity for Penske Corporation. As a result, Messrs. Kurnick and Walters also receivea substantial amount of total compensation from Penske Corporation, our controlling share-holder. While these individuals devote a substantial amount of time and effort to our company,their total compensation paid by us does reflect that they devote efforts to Penske Corporation.Messrs. Kurnick and Walters did not receive a cash bonus related to 2006 for this reason.
EXECUTIVE AND DIRECTOR COMPENSATIONThe following table contains information concerning 2006 annual and long-term compen-
sation for our Chief Executive Officer, Executive Vice President — Finance in 2006, each of ourthree other most highly compensated executive officers during 2006, and our former Presidentand Chief Operating Officer, collectively referred to as the “named executive officers.”
2006 Summary Compensation Table
Name and Principal Position YearSalary
($)Bonus
($)
StockAwards
($)(1)
All OtherCompensation
($)Total
($)
Roger S. Penske . . . . . . . . . . . . . 2006 $750,000 — $393,878 — $1,143,878(2)Chief Executive Officer
Robert T. O’Shaughnessy . . . . . . 2006 $515,000 $200,000 $130,851 $141,046(3) $ 986,897Chief Financial Officer
Robert H. Kurnick, Jr. . . . . . . . . . 2006 $350,000 — $103,655 $ 14,346(4) $ 468,001Vice Chairman
Paul F. Walters . . . . . . . . . . . . . . 2006 $300,000 — $ 71,704 — $ 371,704Executive Vice President —Human Resources
Samuel X. DiFeo . . . . . . . . . . . . . 2006 $400,000 — $ 62,648 $ 23,969(5) $ 486,617Former President andChief Operating Officer
James R. Davidson . . . . . . . . . . . 2006 $480,000 $320,000 $ 71,704 $ 27,518(6) $ 899,222Former Executive VicePresident — Finance
(1) These amounts reflect the amount of compensation expense we incurred in 2006 pursuant torestricted stock awards granted under our 2002 Equity Compensation Plan (or its substantially similarpredecessor). They were valued in accordance with FAS 123R as discussed in footnotes 1 and 12 toour consolidated financial statements filed in our annual report on Form 10-K on March 1, 2007.
(2) In March 2006, Mr. Penske received a combined equity incentive plan-based award and a non-equityincentive plan-based award in the form of an award payable upon achievement of 2006 performancetargets. The maximum total award for this combined grant was $2.5 million and was payable in cash or
16

restricted stock at the Committee’s discretion at the time of payment of the award. Of the $2.5 millionpotentially payable to Mr. Penske, the actual amount paid to Mr. Penske under this award was78,886 shares of restricted stock vesting over four years at a rate of 15%, 15%, 20% and 50%,and which was valued at $1.7 million, or $21.55 per share (the New York Stock Exchange closing priceon the grant date of the award (March 1, 2007)). See the narrative discussion following this table forfurther discussion of this award.
(3) $16,406 represents the use of company vehicles and related automobile insurance, $70,710 repre-sents payments for a country club membership (though this membership is used for personal andbusiness purposes), and $49,351 represents a tax allowance for several of the noted items. Theremainder represents matching funds under our Company-wide 401(k) plan, Company sponsored lifeinsurance, Company sponsored lunch program, and the personal use of two sporting event tickets.For a discussion of our methodology in valuing these items, see “Compensation Disclosure andAnalysis — Other Compensation”.
(4) $9,178 represents an allowance for a company vehicle and $5,168 represents a tax allowance for thisitem. For a discussion of our methodology in valuing this item, see “Compensation Disclosure andAnalysis — Other Compensation”
(5) $14,700 represents the use of Company vehicles and related automobile insurance, $8,237 repre-sents a tax allowance and the remainder represents Company sponsored life insurance. For adiscussion of our methodology in valuing these items, see “Compensation Disclosure and Analy-sis — Other Compensation”
(6) $14,357 represents the use of Company vehicles and related automobile insurance, $10,378 repre-sents a tax allowance and the remainder represents Company sponsored life insurance and Companysponsored lunch. For a discussion of our methodology in valuing these items, see “CompensationDisclosure and Analysis — Other Compensation.”
Grants of Plan-Based Awards in 2006
Name Grant DateThreshold
($)Maximum
($)Threshold
($)Maximum
($)
All otherAwards:
Number ofShares of
Stock or Units(#)
Grant DateFair Valueof StockAwards
($)
Estimated FuturePayouts Under
Non-Equity IncentivePlan Awards
Estimated FuturePayouts Under
Equity IncentivePlan Awards
Roger S. Penske . . . . . . 3/7/2006 46,146(1) 1,000,000(1)Chief Executive Officer 3/7/2006 — 2,500,000(2)
— 2,500,000(2)Robert T.
O’Shaughnessy . . . . . 3/7/2006 6,000 130,020Chief Financial Officer
Robert H. Kurnick, Jr. . . 3/7/2006 10,000 216,700Vice Chairman
Paul F. Walters . . . . . . . . 3/7/2006 6,000 130,020Executive VicePresident — HumanResources
Samuel X. DiFeo . . . . . . 3/7/2006 2,000 43,340Former President andChiefOperating Officer
James R. Davidson . . . . 3/7/2006 6,000 130,020Former Executive VicePresident — Finance
(1) This represents the shares of restricted stock issued to Mr. Penske in March 2006 resulting from hisattainment of goals outlined in his 2005 incentive award. Note that this table reflects two years ofawards to Mr. Penske: the stock component of the 2005 award actually received in 2006 and the totalpotential award for 2006, paid in 2007.
(2) Because the form of compensation of this award was discretionary in either cash or stock, we havepresented the award as a $2.5 million non-equity incentive plan award and as a $2.5 million equity
17

incentive plan award, even though the total maximum payable under the award is $2.5 million. See thefollowing narrative discussion for an explanation of this award.
Narrative Discussion of Summary Compensation Table and Plan Based Awards
Mr. Penske’s Performance Based Award. The amounts set forth in the two precedingtables reflect payments and awards to our named executive officers based on the principlesand descriptions discussed under “Compensation Discussion and Analysis”. Mr. Penske wasour only named executive officer to receive a performance based award in 2006. The awardwas issued under our management incentive plan and was based on performance targets to beachieved in 2006. A maximum potential payout of $2.5 million was available under the award,payable in cash or stock at the election of the compensation committee at the time thecommittee determined satisfaction of the award. Because the form of compensation wasdiscretionary in either cash or stock, we have presented the award as a $2.5 million non-equityincentive plan award and as a $2.5 million equity incentive plan award, even though the totalmaximum payable under the award is $2.5 million. The payment of the award in March 2007was $1.7 million in the form of 78,886 shares of restricted common stock vesting over four yearsat a rate of 15%,15%, 20% and 50% valued on the date of grant of the restricted stock award.The objective performance targets of Mr. Penske’s award are described in the “CompensationDisclosure and Analysis.”
Other Restricted Stock Awards. The other equity awards noted in the table were eachissued to our named executive officers as part of our annual grant of restricted stock pursuantto the terms of the 2002 Equity Compensation Plan. These awards vest annually over four yearsat a rate of 15%,15%, 20% and 50% and are issued based on principles described in the“Compensation Disclosure and Analysis — Restricted Stock.”
Former Employees. Mr. Davidson served as our Executive Vice President — Financethrough December 2006. Beginning in 2007, he retired from that office and now is employedon a part-time basis assisting with certain of our finance operations. Mr. DiFeo served as ourpresident and chief operating officer until March 8, 2006, at which time he retired from thoseoffices. We and Mr. DiFeo were party to an employment agreement discussed below under“Potential Termination Payments.” We are not a party to employment contracts with any of ourcurrent executive officers.
Outstanding Equity Awards at 2006 Year-End
Name
Number of SecuritiesUnderlying Unexercised
Options Exercisable(#)
OptionExercise
Price
OptionExpiration
Date
Number of Shares orUnits of Stock That
Have Not Vested(#)
Market Value ofShares or Units ofStock That Have
Not Vested(1)
Option Awards Stock Awards
Roger S. Penske . . . . . . . . . . . . . — — — 167,260(2) $3,942,318Chief Executive Officer
Robert T. O’Shaughnessy . . . . . . . 5,000 $10.48 2/22/12Chief Financial Officer — — — 29,350(3) $ 691,780
Robert H. Kurnick, Jr. . . . . . . . . . — — — 22,700(4) $ 535,039Vice Chairman
Paul F. Walters . . . . . . . . . . . . . . — — — 15,300(5) $ 360,621Executive Vice President —Human Resources
Samuel X. DiFeo . . . . . . . . . . . . . — — — 12,850(6) $ 302,875Former President andChief Operating Officer
James R. Davidson . . . . . . . . . . . 14,668 $10.48 2/22/12Former Executive Vice — — — 15,300(7) $ 360,321President — Finance
18

(1) The market value is based upon the closing price of our common stock on December 29, 2006($23.57).
(2) These amounts include the restricted stock issued in 2007 to Mr. Penske as a result of his performancebased equity award with respect to 2006. These restricted shares vest as follows:
June 1, 2007 — 15,521 June 1, 2008 — 33,720 June 1, 2011 — 39,443June 1, 2009 — 39,725 June 1, 2010 — 38,851
(3) The restricted shares vest as follows:June 1, 2007 — 5,250 June 1, 2008 — 7,400June 1, 2009 — 13,700 June 1, 2010 — 3,000
(4) The restricted shares vest as follows:June 1, 2007 — 4,200 June 1, 2008 — 6,500June 1, 2009 — 7,000 June 1, 2010 — 5,000
(5) The restricted shares vest as follows:June 1, 2007 — 3,000 June 1, 2008 — 5,100June 1, 2009 — 4,200 June 1, 2010 — 3,000
(6) The restricted shares vest as follows:June 1, 2007 — 2,750 June 1, 2008 — 5,200June 1, 2009 — 3,900 June 1, 2010 — 1,000
(7) The restricted shares vest as follows:June 1, 2007 — 3,000 June 1, 2008 — 5,100June 1, 2009 — 4,200 June 1, 2010 — 3,000
Option Exercises and Stock Vested
Name
Numberof Shares
Acquired onExercise (#)
ValueRealized on
Exercise
Numberof Shares
Acquired onVesting (#)
ValueRealized
on Vesting(1)
Option Awards Stock Awards
Roger S. Penske. . . . . . . . . . . . . . . . . 920,000 $14,883,850(2) 16,182 $ 347,930Chief Executive Officer
Robert T. O’Shaughnessy. . . . . . . . . . — — 6,200 $133,223Chief Financial Officer
Robert H. Kurnick, Jr. . . . . . . . . . . . . — — 6,400 $ 137,656Vice Chairman
Paul F. Walters . . . . . . . . . . . . . . . . . . 40,000 $ 560,803 5,800 $124,777Executive Vice President —Human Resources
Samuel X. DiFeo. . . . . . . . . . . . . . . . . 360,000 $ 7,623,579 7,100 $152,752Former President andChief Operating Officer
James R. Davidson . . . . . . . . . . . . . . — — 5,800 $124,777Former Executive VicePresident — Finance
(1) The value is based upon the closing price of our common stock on the vest date.
(2) 800,000 of these options were issued to Mr. Penske in 1999 upon his initial investment in the Companyin lieu of any salary in 1999, 2000, and 2001 and any bonus for 1999 and 2000.
Pension Benefits and Nonqualified Deferred Compensation
We do not offer our executives any pension plans or nonqualified deferred compensationplans.
19

Potential Termination Payments
Except for Mr. DiFeo, our former president and chief operating officer, none of our namedexecutive officers is employed under an employment agreement and none have any contrac-tual severance or termination payments.
Termination Payments for Mr. DiFeo. Mr. DiFeo served as our president and chief oper-ating officer until March 8, 2006, at which time he retired from those offices. The following is adescription of the relevant termination payments and arrangements provided to Mr. DiFeo,each as required under Mr. DiFeo’s employment agreement as in effect at that time.
We have agreed to employ Mr. DiFeo as a consultant through December 31, 2010. Duringthat time, Mr. DiFeo is expected to render services and assist in the management of ourbusiness approximately one work week per month. While a consultant, Mr. DiFeo is entitled tocompensation of $400,000 per year, plus the use of an automobile, reimbursement ofexpenses incurred on behalf of us as a consultant, and health benefits comparable to thoseavailable to our management. The estimated annual expense of the consulting agreement foreach of years 2006 through 2010 is $417,667, consisting of $400,000 in direct compensation,continuing health benefits under our health care plan, and $12,000 in automobile expenses.See “Compensation Disclosure and Analysis — Other Compensation” for a discussion of ourvaluation of those expenses. As part of this consulting agreement, we receive the benefit of aconfidentiality and a “non-compete” arrangement where Mr. DiFeo is prohibited from seekingor obtaining employment in the automotive industry without our consent, which consent shallnot be unreasonably withheld. The non-compete arrangements may be waived by us in ourdiscretion.
Director Compensation
The Board of Directors believes that its members should receive a mix of cash and equitycompensation, with the option to receive all compensation in the form of equity. The Board ofDirectors approves changes to director compensation only upon the recommendation of thecompensation committee, which is composed solely of independent directors. Only directorswho are not our paid employees, who we call “outside directors,” are eligible for directorcompensation, unless otherwise noted.
Annual Fee and Restricted Stock Award. Each outside director receives an annual feeof $40,000, except for audit committee members, who receive $45,000. These fees arepayable, at the option of each outside director, in cash or common stock valued on the dateof receipt (generally in March of the year subsequent to service). Our outside directors alsoreceive an annual grantof 2,000 shares of restricted stock which is typically awarded during thefirst quarter of the calendar year. These restricted shares vest ratably and annually over threeyears.
Option to Defer Receipt until Termination of Board Service. Under our Non-EmployeeDirector Compensation Plan, the annual fee and restricted stock awards may be deferred ineither the form of cash (for the annual fee) and/or deferred stock. Each deferred stock unit isequal in value to a share of common stock and ultimately paid in cash after a director retires.These stock units do not have voting rights, but do generate dividend equivalents in the form ofadditional stock units which are credited to the director’s account on the date dividends arepaid. All fees deferred in cash are held in our general funds and interest on such deferred fees iscredited to the director’s account at the then current U.S. 90-day Treasury bill rate on aquarterly basis.
Charitable Donation Matching Program. All directors are also eligible to participate in acharitable matching gift program. Under this program, we will match up to $25,000 per year incontributions by each director to institutions qualified as tax-exempt organizations under
20
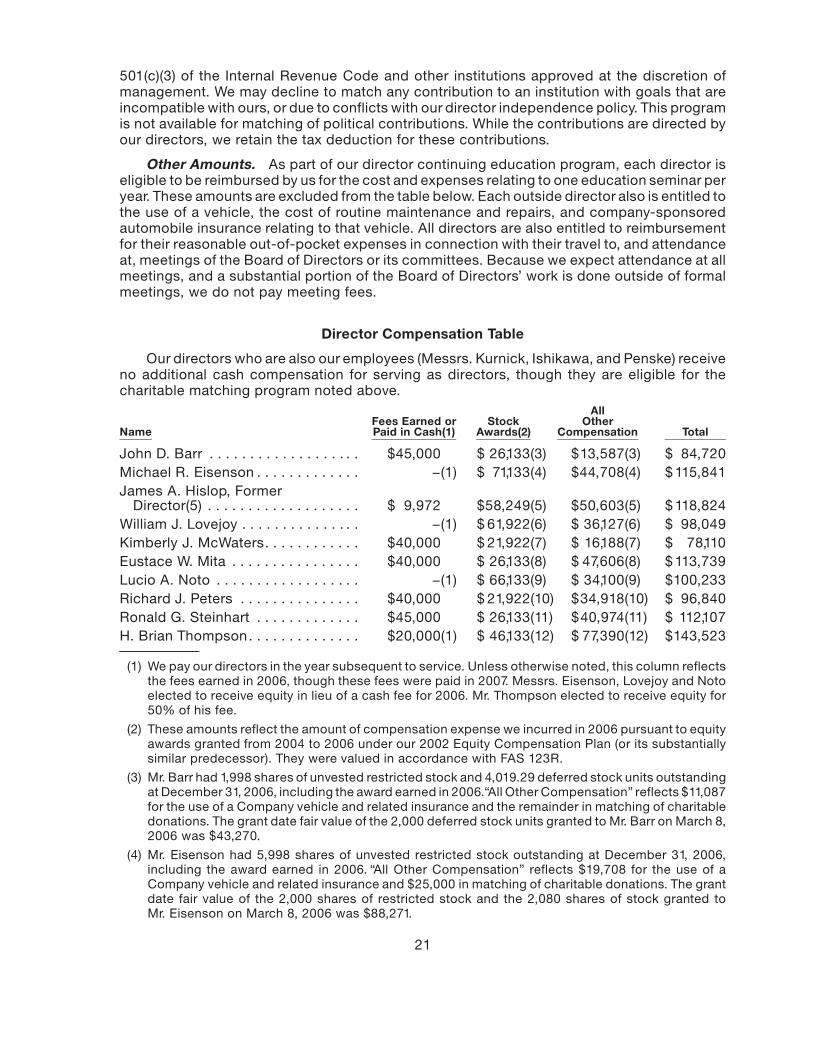
501(c)(3) of the Internal Revenue Code and other institutions approved at the discretion ofmanagement. We may decline to match any contribution to an institution with goals that areincompatible with ours, or due to conflicts with our director independence policy. This programis not available for matching of political contributions. While the contributions are directed byour directors, we retain the tax deduction for these contributions.
Other Amounts. As part of our director continuing education program, each director iseligible to be reimbursed by us for the cost and expenses relating to one education seminar peryear. These amounts are excluded from the table below. Each outside director also is entitled tothe use of a vehicle, the cost of routine maintenance and repairs, and company-sponsoredautomobile insurance relating to that vehicle. All directors are also entitled to reimbursementfor their reasonable out-of-pocket expenses in connection with their travel to, and attendanceat, meetings of the Board of Directors or its committees. Because we expect attendance at allmeetings, and a substantial portion of the Board of Directors’ work is done outside of formalmeetings, we do not pay meeting fees.
Director Compensation Table
Our directors who are also our employees (Messrs. Kurnick, Ishikawa, and Penske) receiveno additional cash compensation for serving as directors, though they are eligible for thecharitable matching program noted above.
NameFees Earned orPaid in Cash(1)
StockAwards(2)
AllOther
Compensation Total
John D. Barr . . . . . . . . . . . . . . . . . . . $45,000 $ 26,133(3) $13,587(3) $ 84,720Michael R. Eisenson . . . . . . . . . . . . . —(1) $ 71,133(4) $44,708(4) $115,841James A. Hislop, Former
Director(5) . . . . . . . . . . . . . . . . . . . $ 9,972 $58,249(5) $50,603(5) $118,824William J. Lovejoy . . . . . . . . . . . . . . . —(1) $61,922(6) $ 36,127(6) $ 98,049Kimberly J. McWaters. . . . . . . . . . . . $40,000 $21,922(7) $ 16,188(7) $ 78,110Eustace W. Mita . . . . . . . . . . . . . . . . $40,000 $ 26,133(8) $ 47,606(8) $113,739Lucio A. Noto . . . . . . . . . . . . . . . . . . —(1) $ 66,133(9) $ 34,100(9) $100,233Richard J. Peters . . . . . . . . . . . . . . . $40,000 $21,922(10) $34,918(10) $ 96,840Ronald G. Steinhart . . . . . . . . . . . . . $45,000 $ 26,133(11) $40,974(11) $ 112,107H. Brian Thompson. . . . . . . . . . . . . . $20,000(1) $ 46,133(12) $ 77,390(12) $143,523
(1) We pay our directors in the year subsequent to service. Unless otherwise noted, this column reflectsthe fees earned in 2006, though these fees were paid in 2007. Messrs. Eisenson, Lovejoy and Notoelected to receive equity in lieu of a cash fee for 2006. Mr. Thompson elected to receive equity for50% of his fee.
(2) These amounts reflect the amount of compensation expense we incurred in 2006 pursuant to equityawards granted from 2004 to 2006 under our 2002 Equity Compensation Plan (or its substantiallysimilar predecessor). They were valued in accordance with FAS 123R.
(3) Mr. Barr had 1,998 shares of unvested restricted stock and 4,019.29 deferred stock units outstandingat December 31, 2006, including the award earned in 2006.“All Other Compensation” reflects $11,087for the use of a Company vehicle and related insurance and the remainder in matching of charitabledonations. The grant date fair value of the 2,000 deferred stock units granted to Mr. Barr on March 8,2006 was $43,270.
(4) Mr. Eisenson had 5,998 shares of unvested restricted stock outstanding at December 31, 2006,including the award earned in 2006. “All Other Compensation” reflects $19,708 for the use of aCompany vehicle and related insurance and $25,000 in matching of charitable donations. The grantdate fair value of the 2,000 shares of restricted stock and the 2,080 shares of stock granted toMr. Eisenson on March 8, 2006 was $88,271.
21

(5) Mr. Hislop resigned from the Board on May 2, 2006.“All Other Compensation” reflects $25,603 for theuse of a Company vehicle, the cost of related insurance and $25,000 in matching of charitabledonations. Upon his resignation, we vested Mr. Hislop’s 3,332 shares of unvested restricted stock,we paid him a pro rata portion of his annual fee, and he was distributed $41,536.73 which repre-sented the balance due to him for previously deferred director compensation. The grant date fairvalue of the 2,000 shares of restricted stock granted to Mr. Hislop on March 8, 2006 was $43,270.
(6) Mr. Lovejoy had 1,332 shares of unvested restricted stock and 10,534.59 deferred stock unitsoutstanding at December 31, 2006, including the award earned in 2006.“All Other Compensation”reflects $11,127 for the use of a Company vehicle and related insurance and $25,000 in matching ofcharitable donations. The grant date fair value of the 3,881 deferred stock units granted to Mr. Lovejoyon March 8, 2006 was $83,955.
(7) Ms. McWaters had 5,332 shares of unvested restricted stock outstanding at December 31, 2006,including the award earned in 2006.“All Other Compensation” reflects the use of a Company vehicleand related insurance. The grant date fair value of the 2,000 shares of restricted stock and 924 sharesof stock granted to Ms. McWaters on March 8, 2006 was $63,261.
(8) Mr. Mita had 5,998 shares of unvested restricted stock outstanding at December 31, 2006, includingthe award earned in 2006.“All Other Compensation” reflects the of use of a Company vehicle andrelated insurance. The grant date fair value of the 2,000 shares of restricted stock granted to Mr. Mitaon March 8, 2006 was $43,270.
(9) Mr. Noto had 1,998 shares of unvested restricted stock and 13,485.48 deferred stock units out-standing at December 31, 2006, including the award earned in 2006. “All Other Compensation”reflects $9,100 for use of a Company vehicle and related insurance and $25,000 in matching ofcharitable donations. The grant date fair value of the 3,881 deferred stock units granted to Mr. Notoon March 8, 2006 was $83,955.
(10) Mr. Peters had 5,332 shares of unvested restricted stock outstanding at December 31, 2006,including the award earned in 2006.“All Other Compensation” reflects $9,918 for use of a Companyvehicle and related insurance and $25,000 in matching of charitable donations. The grant date fairvalue of the 2,000 shares of restricted stock granted to Mr. Peters on March 8, 2006 was $43,270.
(11) Mr. Steinhart had 5,998 shares of unvested restricted stock outstanding at December 31, 2006,including the award earned in 2006.“All Other Compensation” reflects $15,974 for use of a Companyvehicle and related insurance and $25,000 in matching of charitable donations. The grant date fairvalue of the 2,000 shares of restricted stock granted to Mr. Steinhart on March 8, 2006 was $43,270.
(12) Mr. Thompson had 5,998 shares of unvested restricted stock outstanding at December 31, 2006,including the award earned in 2006.“All Other Compensation” reflects $52,390 for use of a Companyvehicle and related insurance and $25,000 in matching of charitable donations. The grant date fairvalue of the 2,000 shares of restricted stock and the 924 shares of stock granted to Mr. Thompson onMarch 8, 2006 was $63,261.
22

SECURITY OWNERSHIP OF CERTAINBENEFICIAL OWNERS AND MANAGEMENT
The following table sets forth information with respect to the beneficial ownership of ourcommon stock as of March 12, 2007 by (1) each person known to us to own more than fivepercent of our common stock, (2) each of our directors, (3) our named executive officers and(4) all of our directors and executive officers as a group.
Beneficial ownership is determined in accordance with the rules of the SEC and includesvoting and investment power with respect to shares. The percentage of ownership is based on94,874,030 shares of our common stock outstanding on March 12, 2007. Unless otherwiseindicated in a footnote, each person identified in the table below has sole voting and dispos-itive power with respect to the common stock beneficially owned by that person and none ofthe shares are pledged as security.
Beneficial Owner Number Percent
Shares BeneficiallyOwned(1)
Penske Corporation(2) . . . . . . . . . . . . . . . . . . . . . . . . . . . . . . . 36,963,360 39.0%2555 Telegraph RoadBloomfield Hills, MI 48302-0954
Mitsui(3). . . . . . . . . . . . . . . . . . . . . . . . . . . . . . . . . . . . . . . . . . . 15,559,217 16.4%2-1, Ohtemachi 1-chome, Chiyoda-kuTokyo, Japan
Barclays Global Investors, NA(4) . . . . . . . . . . . . . . . . . . . . . . . 7,803,220 8.2%145 Fremont St.San Francisco, CA 91405
Baron Capital Group, Inc.(5) . . . . . . . . . . . . . . . . . . . . . . . . . . . 5,113,400 5.4%767 Fifth AvenueNew York, NY 10153
Dimension Fund Advisors LP(6) . . . . . . . . . . . . . . . . . . . . . . . . 4,793,555 5.1%1294 Ocean Avenue,11th FloorSanta Monica, CA 90401
John D. Barr(7) . . . . . . . . . . . . . . . . . . . . . . . . . . . . . . . . . . . . . 9,000 *Michael R. Eisenson . . . . . . . . . . . . . . . . . . . . . . . . . . . . . . . . . 26,080 *Hiroshi Ishikawa . . . . . . . . . . . . . . . . . . . . . . . . . . . . . . . . . . . . 8,500 *Robert H. Kurnick, Jr.(8) . . . . . . . . . . . . . . . . . . . . . . . . . . . . . . 83,292 *William J. Lovejoy(9) . . . . . . . . . . . . . . . . . . . . . . . . . . . . . . . . . 12,000 *Robert T. O’Shaughnessy(10) . . . . . . . . . . . . . . . . . . . . . . . . . . 54,395 *Kimberly J. McWaters . . . . . . . . . . . . . . . . . . . . . . . . . . . . . . . . 6,924 *Eustace W. Mita(11). . . . . . . . . . . . . . . . . . . . . . . . . . . . . . . . . . 1,017,693 1.1%Lucio A. Noto(12) . . . . . . . . . . . . . . . . . . . . . . . . . . . . . . . . . . . 15,664 *Roger S. Penske(13) . . . . . . . . . . . . . . . . . . . . . . . . . . . . . . . . . 37,599,763 39.6%Roger S. Penske, Jr.(14) . . . . . . . . . . . . . . . . . . . . . . . . . . . . . . 75,390 *Richard J. Peters(15). . . . . . . . . . . . . . . . . . . . . . . . . . . . . . . . . 106,760 *Ronald G. Steinhart . . . . . . . . . . . . . . . . . . . . . . . . . . . . . . . . . 24,500 *H. Brian Thompson . . . . . . . . . . . . . . . . . . . . . . . . . . . . . . . . . . 34,894 *Paul F. Walters(16) . . . . . . . . . . . . . . . . . . . . . . . . . . . . . . . . . . . 54,932 *All directors and executive officers as a group (16 persons) . . 38,926,697 41.0%
23

* Less than 1%
(1) Pursuant to the regulations of the SEC, shares are deemed to be “beneficially owned” by a person ifsuch person directly or indirectly has or shares the power to vote or dispose of such shares. Eachperson is deemed to be the beneficial owner of securities which may be acquired within sixty daysthrough the exercise of options, warrants, and rights, if any, and such securities are deemed to beoutstanding for the purpose of computing the percentage of the class beneficially owned by suchperson.
(2) Penske Corporation is the beneficial owner of 36,112,044 shares of common stock, of which it hasshared power to vote and dispose together with a wholly owned subsidiary. Penske Corporation alsohas shared voting power over 851,316 shares under voting agreements. Penske Corporationalso hasthe right to vote the shares owned by the Mitsui entities (see note 3) under certain circumstancesdiscussed under “Certain Relationships and Related Party Transactions.” If these shares weredeemed to be beneficially owned by Penske Corporation, its beneficial ownership would be52,522,577 shares or 55.4%.
(3) Represents 3,111,444 shares held by Mitsui & Co., (U.S.A.), Inc. and 12,447,773 shares held by Mitsui &Co., Ltd.
(4) As reported on Schedule 13G as of December 31, 2006 and filed with the SEC January 23, 2007.
(5) As reported on Schedule 13G as of December 31, 2006 and filed with the SEC on February 14, 2007.
(6) As reported on Schedule 13G as of December 31, 2006 and filed with the SEC February 2, 2007.
(7) Mr. Barr also owns 4,025.85 deferred stock units which vest following his retirement from our Boardof Directors.
(8) Mr. Kurnick has shared voting power with respect to 31,292 of these shares.
(9) Mr. Lovejoy also owns 10,556.7 deferred stock units which vest following his retirement from ourBoard of Directors.
(10) Includes 5,000 shares issuable upon the exercise of options.
(11) 620,000 of these shares are pledged under a line of credit.
(12) Mr. Noto also owns 13,517.17 deferred stock units which vest following his retirement from our Boardof Directors.
(13) Includes the 36,963,360 shares deemed to be beneficially owned by Penske Corporation and64,550 shares deemed to be beneficially owned by Penske Capital Partners, L.L.C., all of whichshares Mr. Penske may be deemed to have shared voting and dispositive power. Mr. Penske is themanaging member of Penske Capital Partners and the Chairman and Chief Executive Officer ofPenske Corporation. 64,500 of the shares deemed owned by Penske Capital Partners are pledged assecurity to Penske Corporation. Mr. Penske disclaims beneficial ownership of the shares beneficiallyowned by Penske Capital and Penske Corporation, except to the extent of his pecuniary interesttherein. Penske Corporation also has the right to vote the shares owned by the Mitsui entities (seenote 3) under certain circumstances discussed under “Certain Relationships and Related PartyTransactions.” If these shares were deemed to be beneficially owned by Mr. Penske, his beneficialownership would be 53,158,980 shares or 56.0%.
(14) Includes 10,000 shares issuable upon the exercise of options. Mr. Penske, Jr. has shared votingpower with respect to 44,090 of these shares.
(15) Mr. Peters has shared voting power with respect to these shares.
(16) Mr. Walters has shared voting power with respect to 18,892 of these shares.
24

AUDIT COMMITTEE REPORTThe Audit Committee of the Board of Directors is responsible for providing independent,
objective oversight of our accounting functions and internal controls. The Audit Committeeacts under a written charter adopted and approved by the Board of Directors. The AuditCommittee is comprised only of independent directors as set forth in the listing requirementsof the New York Stock Exchange, the more stringent requirements of our corporate governanceguidelines and the Securities and Exchange Commission’s additional independence require-ments. In addition, our Board of Directors has determined that each of our committee membersis an “audit committee financial expert,” as defined by Securities and Exchange Commissionrules.
In accordance with the Audit Committee charter, the Audit Committee has the soleauthority to retain and terminate our independent registered public accounting firms and isresponsible for recommending to the Board of Directors that our financial statements beincluded in our annual report on Form 10-K.
The Audit Committee took a number of steps in making this recommendation for our 2006annual report. First, the Audit Committee discussed with our independent registered publicaccounting firms those matters required to be discussed by Statement on Auditing StandardsNo. 61, including information regarding the scope and results of their audits. These commu-nications and discussions are intended to assist the Audit Committee in overseeing thefinancial reporting and disclosure process. Second, the Audit Committee discussed withthe independent registered public accounting firms their independence and received lettersand written disclosures from the independent registered public accounting firms required byIndependence Standards Board Standard No.1 (Independence Discussions with Audit Com-mittees). These discussions and disclosures assisted the Audit Committee in evaluating suchindependence. Finally, the Audit Committee reviewed and discussed the annual audited andquarterly unaudited financial statements with our management and the independent regis-tered public accounting firms in advance of the public release of operating results, and beforethe filing of our annual and quarterly reports with the Securities and Exchange Commission.
Based on the foregoing, as well as on the review and discussions referred to above, andsuch other matters deemed relevant and appropriate by the Audit Committee, the AuditCommittee recommended to the Board of Directors that our financial statements be includedin our 2006 annual report on Form 10-K as filed with the SEC on March 1, 2007.
The Audit Committee of theBoard of Directors
Michael R. Eisenson (Chairman)John D. BarrRonald G. Steinhart
25

INDEPENDENT REGISTERED PUBLIC ACCOUNTING FIRMS
Deloitte & Touche LLP, the member firms of Deloitte Touche Tohmatsu, and their respectiveaffiliates (collectively referred to as “Deloitte”) will audit our consolidated financial statementsfor 2007 and perform other services. In 2006, Deloitte did not audit certain of our subsidiarieswhich own certain of our international operations and their opinions, insofar as they relate tothose operations, are based solely on the reports of the independent auditor of those oper-ations, KPMG Audit PLC (“KPMG”). This arrangement will continue in 2007. We refer to Deloitteand KPMG collectively as our independent registered public accounting firms. We paid theindependent registered public accounting firms the following fees for the enumerated servicesin 2005 and 2006, all of which services were approved by our Audit Committee.
Audit Fees. Audit Fees in the table below include the aggregate fees for professionalservices rendered by the independent registered public accounting firms in connection withthe audits of our consolidated financial statements, including the audits of management’sassessment of internal control over financial reporting, reviews of the consolidated condensedfinancial statements included in our quarterly reports on Form 10-Q, and other servicesnormally provided in connection with statutory or regulatory engagements.
Audit Related Fees. Audit Related Fees in the table below include the aggregate fees forprofessional services rendered by the independent registered public accounting firms inconnection with registration statements, acquisition due diligence, their assurance servicesrelated to benefit plans and accounting research and consultation.
Tax Fees. Tax Fees in the table below include aggregate fees for professional servicesrendered by the independent registered public accounting firms in connection with tax com-pliance, planning and advice.
All Other Fees. All Other Fees in the table below include aggregate fees for all otherservices rendered by the independent registered public accounting firms. These fees relatedprimarily to appraisal review services and benefits advisory services.
2006 2005 2006 2005Deloitte KPMG
Audit Fees. . . . . . . . . . . . . . . . . . . . . . . $ 1,147,000 $ 1,179,000 $ 705,000 $453,000
Audit Related Fees . . . . . . . . . . . . . . . . $ 227,000 $ 291,000 $ 118,000 $ 28,000
Tax FeesTax Compliance . . . . . . . . . . . . . . . . . $ — $ 41,000 $ — $ —Other Tax Fees . . . . . . . . . . . . . . . . . $ 148,000 $ 159,000 — —
$ 148,000 $ 200,000 — —
All Other Fees . . . . . . . . . . . . . . . . . . . . $ 16,000 $ 12,000 $ 199,000 $ 75,000
Total Fees . . . . . . . . . . . . . . . . . . . . . . . $1,538,000 $1,682,000 $1,022,000 $556,000
The Audit Committee has considered the nature of the above-listed services provided bythe independent registered public accounting firms and determined that they are compatiblewith their provision of independent audit services. The Audit Committee has discussed theseservices with the independent registered public accounting firms and management to deter-mine that they are permitted under the Code of Professional Conduct of the American Instituteof Certified Public Accountants and the auditor independence requirements of the Securitiesand Exchange Commission.
Pre-approval Policy. The Audit Committee has adopted a policy requiring pre-approval ofaudit and non-audit services provided by the independent registered public accounting firms.
26

The primary purpose of this policy is to ensure that we engage our public accountants only toprovide audit and non-audit services that are compatible with maintaining independence. TheAudit Committee is required to pre-approve all services relating to work performed for us byour independent registered public accounting firms and related fees. The Audit Committeemust also approve fees incurred for pre-approved services that are in excess of the approvedamount prior to payment, except as provided below. Our independent registered publicaccounting firms are prohibited from performing any service prohibited by applicable law.
Pre-approval of audit and non-audit services may be given at any time up to a year beforecommencement of the specified service. Engagement of the independent registered publicaccounting firms and their fees for the annual audit must be approved by the entire AuditCommittee. The Chairman of the Audit Committee may independently approve services if theestimated fee for the service is less than 10% of the total estimated audit fee, or if the excessfees for pre-approved services are less than 20% of the approved fees for that service;provided, however, that no such pre-approval may be granted with respect to any serviceprohibited by applicable law or that otherwise appears reasonably likely to compromise theindependent registered public accounting firms’ independence. Any pre-approval grantedpursuant to this delegation of authority is reviewed with the Audit Committee at its nextregularly scheduled meeting. Non-audit services for which the estimated fee is greater than10% of the audit fee must be approved by the entire Audit Committee before commencementof the service.
It is anticipated that a representative of Deloitte will be present at the annual meeting withthe opportunity to make a statement and to answer appropriate questions.
RELATED PARTY TRANSACTIONSOur Board of Directors has adopted a written policy with respect to the approval of related
party transactions. Under the policy, related party transactions over $5,000 are to be approvedby a majority of either the members of our Audit Committee or our disinterested Boardmembers. At each regularly scheduled meeting, our Audit Committee reviews any proposednew related party transactions for approval and reviews the status of previously approvedtransactions. The disinterested members of our Board of Directors typically review newmaterial transactions for approval. Each of the transactions noted below was approved byour Board of Directors or Audit Committee pursuant to this policy.
Entities affiliated with Roger S. Penske, our Chairman of the Board and Chief ExecutiveOfficer, are parties to a stockholders agreement described below. Mr. Penske is also Chairmanof the Board and Chief Executive Officer of Penske Corporation, and, through entities affiliatedwith Penske Corporation, our largest stockholder. The parties to the stockholders agreementare International Motor Cars Group, II, L.L.C. (“IMCGII”), Mitsui & Co., Ltd., Mitsui & Co, (USA),Inc. (collectively, “Mitsui”), Penske Corporation and Penske Automotive Holdings Corp. Werefer to IMCGII, Penske Corporation and Penske Automotive Holdings Corp. as the Penskeaffiliated companies.
In connectionwith a sale of shares of our common stock to Mitsui in March 2004, Mitsui andthe Penske affiliated companies agreed to certain “standstill” provisions. Until termination ofthe stockholders agreement discussed below, among other things and with some exceptions,the parties have agreed not to acquire or seek to acquire any of our capital stock or assets,enter into or propose business combinations involving us, participate in a proxy contest withrespect to us or initiate or propose any stockholder proposals with respect to us. Notwith-standing the prior sentence, the purchase agreement permits (1) any transaction approved byeither a majority of disinterested members of our Board of Directors or a majority of ourdisinterested stockholders, (2) in the case of Mitsui, the acquisition of securities if, after givingeffect to such acquisition, its beneficial ownership in us is less than or equal to 49%, (3) in the
27

case of the Penske affiliated companies, the acquisition of securities if, after giving effect tosuch acquisition, their aggregate beneficial ownership in us is less than or equal to 65%, and(4) the acquisition of securities resulting from equity grants by the Board of Directors toindividuals for compensatory purposes.
We have also agreed to grant Mitsui the right to an observer to our Board of Directors aslong as it owns at least 2.5% of our outstanding common stock, and the right to have anappointee designated as a senior vice president of UnitedAuto, as long as it owns at least 10%of our outstanding common stock. Mr. Hiroshi Ishikawa, one of our directors, has beenappointed as our Executive Vice President — International Business Development. We alsoagreed not to take any action that would restrict the ability of a stockholder to propose,nominate or vote for any person as a director of us, subject to specified limitations.
Stockholders Agreement. Simultaneously with this purchase, Mitsui and the Penskeaffiliated companies entered into a stockholders agreement. Under this stockholders agree-ment, the Penske affiliated companies agreed to vote their shares for one director who is arepresentative of Mitsui. In turn, Mitsui agreed to vote its shares for up to fourteen directorsvoted for by the Penske affiliated companies. In addition, the Penske affiliated companiesagreed that if they transfer any of our shares of common stock, Mitsui would be entitled to “tagalong” by transferring a pro rata amount of its shares upon similar terms and conditions, subjectto certain limitations. This agreement terminates on its tenth anniversary, upon the mutualconsent of the parties or when either party no longer owns any of our common stock.
Registration Rights Agreements. We have granted the Penske affiliated companiesregistration rights. Pursuant to our agreements, the Penske affiliated companies each mayrequire us on three occasions to register all or part of our common stock held by them, subjectto specified limitations. They are also entitled to request inclusion of all or any part of theircommon stock in any registration of securities by us on Forms S-1 or S-3 under the SecuritiesAct of 1933, as amended (the “Securities Act”). In connection with the purchase of shares byMitsui discussed above, we have granted registration rights to Mitsui. Under our agreement,Mitsui may require us on two occasions to register all or part of its common stock, subject tospecified limitations. Mitsui also is entitled to request inclusion of all or any part of its commonstock in any registration of securities by us on Forms S-1 or S-3 under the Securities Act.
Other Related Party Interests. Several of our directors and officers are affiliated withPenske Corporation or related entities. Mr. Penske is a managing member of TransportationResource Partners, an organization that undertakes investments in transportation-relatedindustries. Richard J. Peters, one of our directors, is a director of Penske Corporation and amanaging director of Transportation Resource Partners. Robert H. Kurnick, Jr., our Vice Chair-man and a director, is also the President and a director of Penske Corporation and Paul F.Walters, our Executive Vice President — Human Resources serves in a similar capacity forPenske Corporation. Mr. Ishikawa, one of our directors, serves as our Executive Vice Presi-dent — International Business Development and in a similar capacity for Penske Corporation.Our President, Roger S. Penske, Jr., also serves as a director of Penske Corporation and is theson of our Chairman and Chief Executive Officer. These employees or directors receive salary,bonus or other compensation from Penske Corporationor its affiliates unrelated to their serviceat UnitedAuto. Our directors, Eustace W. Mita and Lucio A. Noto are each investors in Trans-portation Resources Partners.
Other Transactions. We are currently a tenant under a number of non-cancelable leaseagreements with Samuel X. DiFeo and members of his family. Mr. DiFeo served as our Presidentand Chief Operating Officer until March 8, 2006. The aggregate amount paid by us in 2006under these leases was $5.9 million. The aggregate amount of all contractual payments from usunder these leases from January 2007 through termination in 2020 is $78.7 million, with anadditional $42.4 million due in the event we exercised all of our optional extensions under the
28

leases through 2045. In September 2006, we sold one of our dealerships to an entity affiliatedwith Mr. DiFeo in exchange for $2.7 million, including payments for inventory.
From time to time, we pay and/or receive fees from Penske Corporation and its affiliates forservices rendered in the normal course of business, including rents paid to Automotive GroupRealty, LLC (“AGR”), as described below, payments to third parties by Penske Corporation onour behalf which we then reimburse to Penske Corporation, payments to third parties made byus on behalf of Penske Corporation which they then reimburse to us, payments relating to theuse of aircraft from Penske Jet, Inc., and payment of a racing sponsorship to Penske Racing in2006. These transactions are reviewed quarterly by our Audit Committee and reflect theprovider’s cost or an amount mutually agreed upon by both parties. Aggregate paymentsrelating to such transactions amounted to $5.4 million paid by UAG and $0.2 million received byUAG in 2006, excluding the payments to AGR discussed below.
We are currently a tenant under a number of non-cancelable lease agreements with AGRand its subsidiaries. AGR is a wholly owned subsidiary of Penske Corporation. The aggregateamount paid by us to AGR in 2006 under these leases was $4.2 million. The aggregate amountof all contractual payments from us to AGR under these leases from January 2007 throughtermination in 2014 is $2.7 million, with an additional $4.5 million due in the event we exercisedall of our optional extensions under the leases through 2024. In addition, in 2006, we sold toAGR improvements for $100,000 which were subsequently leased by AGR to us (and which areincluded in the preceding figure). We also purchased several properties from AGR for $25.1 mil-lion in 2006. Each purchase or sale was valued at a price that was either independentlyconfirmed by a third party appraiser or at the price for which we purchased the property from anindependent third party.
We and Penske Corporation have entered into a joint insurance agreement which providesthat, with respect to certain shared insurance policies (which includes our property policy),available coveragewith respect to a loss shall be paid to each party as stipulated in the policies.In the event of losses by us and Penske Corporation in excess of the limit of any policy during apolicy period, the total policy proceeds shall be allocated based on the ratio of premiums paid.
In 2006, we acquired a 10% interest in Cycle Express, LLC, an auctioneer of powersportvehicles in exchange for $5.5 million. Transportation Resource Partners (“TRP”), an organiza-tion discussed above, simultaneously acquired a controlling interest in this company on thesame financial terms as our investment. We also have continuing investments in two other TRPcontrolled companies: a provider of outsourced vehicle management solutions (“QEK”) and amobile vehicle washing company. In 2006, we paid QEK approximately $1,403,000, relatingprincipally to the preparation and delivery of new vehicles in the U.K., and we received $78,500of management fees from QEK.
We are also party to an operating agreement with Roger S. Penske, Jr. relating to his 10%ownership investment in one of our subsidiaries, HBL, LLC, which is a holding company for fiveof our franchises in Virginia. From time to time, we provide HBL with working capital and otherdebt financing and make periodic pro rata distributions from HBL to Mr. Penske, Jr., which for2006 totaled approximately $715,200. For 2006, Mr. Penske, Jr., also received total compen-sation from us of approximately $1,828,000 in his capacity as Executive Vice President —Eastern Operations, and he received 6,000 shares of restricted stock with a grant date fairvalue of $130,020 in March 2006.
Our officers, directors and their affiliates periodically purchase, lease or sell vehicles fromour dealerships on fair market terms. Additionally, we hire automotive technicians who havegraduated from Universal Technical Institute (“UTI”), a provider of technical education, whoseChief Executive Officer is Kimberly McWaters, one of our directors. We make no payments toUTI for these graduates and hire them on the same terms as other employers.
29

In 2006, we employed the sons of Eustace Mita, one of our directors, and James Davidson,our former Executive Vice President — Finance, at our dealerships as managers, for which theywere compensated $311,400 and $227,000, respectively. In 2006, we employed the son-in-lawof Paul Walters, our Executive Vice President — Human Resources, as Senior Vice President —Manufacturer Relations and as a general manager, for which he received compensation of$286,093. The compensation of these individuals is commensurate with their peers’. For 2006,Mr. Ishikawa received total compensation from us of approximately $150,000 in his capacity asExecutive Vice President — International Business Development, as well as 2,000 shares ofrestricted stock with a grant date fair value of $43,340.
An entity controlled by one of our directors, Lucio A. Noto (the “Investor”), owns an interestin one of our subsidiaries, UAG Connecticut I, LLC (“UAG Connecticut I”), which entitles theInvestor to 20% of the operating profits of UAG Connecticut I. From time to time, we provideUAG Connecticut I with working capital and other debt financing and make periodic pro ratadistributions from UAG Connecticut I to the Investor, which in 2006 totaled $387,538. Inaddition, the Investor paid us $132,000 in 2006 pursuant to his option to purchase up to a20% interest in UAG Connecticut I.
OTHER MATTERS
Securities Authorized for Issuance Under Equity Compensation Plans. The followingtable provides details regarding the shares of common stock issuable upon the exercise ofoutstanding options, warrants and rights granted under our equity compensation plans (includ-ing individual equity compensation arrangements) as of December 31, 2006.
Plan Category
Number of securities tobe issued upon exerciseof outstanding options,
warrants and rights(A)
Weighted-averageexercise price of
outstandingoptions, warrants
and rights(B)
Number of securities remainingavailable for future issuanceunder equity compensationplans (excluding securities
reflected in column (A))(C)
Equity compensation plansapproved by securityholders . . . . . . . . . . . . . . 733,134 $8.40 2,982,957
Equity compensation plansnot approved by securityholders . . . . . . . . . . . . . . 0 — —
Total . . . . . . . . . . . . . . . . . . 733,134 8.40 2,982,957
Section 16(a) Beneficial Ownership Reporting Compliance. Section 16(a) of the Secu-rities Exchange Act of 1934 requires our executive officers and directors and persons whobeneficially own more than 10% of our common stock to file initial reports of ownership andreports of changes of ownership with the SEC. To our knowledge, based solely on our review ofthe Section 16(a) forms furnished to us and representations from our executive officers,directors and greater than 10% beneficial owners, all Section 16(a) reports were timely filedin 2006.
Stockholder Nominations and Proposals for 2008. We must receive any proposalsintended to be presented to stockholders at our 2008 annual meeting of stockholders at ourprincipal executive offices at 2555 Telegraph Road, Bloomfield Hills, Michigan 48302-0954 forinclusion in the proxy statement by November 29, 2007. These proposals must also meet otherrequirements of the rules of the SEC relating to stockholder proposals. Stockholders whointend to present an item of business at the annual meeting of stockholders in 2008 (other thana proposal submitted for inclusion in our proxy statement) must provide us notice of thebusiness no later than February 13, 2008.
30

Proxy Information. We do not anticipate that there will be presented at the annualmeeting any business other than as discussed in the above proposals and the Board ofDirectors is not aware of any other matters that might properly be presented for action atthe meeting. If any other business should properly come before the annual meeting, thepersons named on the enclosed proxy card will have discretionary authority to vote all proxiesin accordance with their best judgment.
Proxies in the form enclosed are solicited by or on behalf of our Board of Directors. We willbear the cost of this solicitation. In addition to the solicitation of the proxies by use of the mails,some of our officers and regular employees, without extra remuneration, may solicit proxiespersonally, or by telephone or otherwise. In addition, we will make arrangements with broker-age houses and other custodians, nominees and fiduciaries to forward proxies and proxymaterial to their principals, and we will reimburse them for their expenses in forwardingsoliciting materials, which are not expected to exceed an aggregate of $5,000.
It is important that proxies be returned promptly. Therefore, you are urged to sign, date andreturn the enclosed proxy card in the accompanying stamped and addressed envelope assoon as possible.
We will provide without charge to each of our stockholders, on the written request ofsuch stockholder, a copy of our Form 10-K for the year ended December 31, 2006 and anyof the other documents referenced herein. Copies can be obtained from United AutoGroup, Inc., Investor Relations, 2555 Telegraph Road, Bloomfield Hills, Michigan48302-0954 (248-648-2500).
Dated: March 29, 2007
31

Annex ACERTIFICATE OF AMENDMENT OF
RESTATED CERTIFICATE OF INCORPORATIONOF
UNITED AUTO GROUP, INC.*****
United Auto Group, Inc., a corporation organized and existing under and by virtue of theGeneral Corporation Law of the State of Delaware, DOES HEREBY CERTIFY:
FIRST: That at a meeting of the Board of Directors of United Auto Group, Inc., resolutionswere duly adopted setting forth a proposed amendment to the Restated Certificate of Incor-poration of said corporation, declaring said amendment to be advisable and subject to con-sideration at a meeting of the stockholders of said corporation for consideration thereof. Theproposed amendment is as follows:
RESOLVED, that the Restated Certificate of Incorporation of this corporation beamended by changing Article I thereof so that, as amended said Article shall be and readas follows:
“The name of the Corporation is Penske Automotive Group, Inc. (the “Corporation”).”
SECOND: That thereafter, pursuant to resolution of its Board of Directors, an annualmeeting of the stockholders of said corporation was duly called and held, upon notice inaccordancewith Section 222 of the General Corporation Law of the State of Delaware at whichmeeting the necessary number of shares as required by statute were voted in favor of theamendment.
THIRD: That said amendment was duly adopted in accordance with the provisions ofSection 242 of the General Corporation Law of the State of Delaware.
IN WITNESS WHEREOF, said United Auto Group, Inc. has caused this certificate to besigned by Shane M. Spradlin, its Secretary, this day of , 2007.
By: Shane M. SpradlinIts: Secretary
32

Dealership FacilitiesState-of-the-art
Turnersville Auto Mall — Turnersville, New JerseyBrands Represented: Acura, BMW, Cadillac, Chevrolet, Honda, HUMMER, Hyundai, Nissan, Scion, Toyota
Inskip Auto Mall — Warwick, Rhode IslandBrands Represented: Acura, Audi, BMW, Bentley, Infiniti, Lexus, Mercedes-Benz, MINI, Nissan, Porsche, Volvo
■ Total Revenue $11.2 Billion – up 16.4%
■ Same-Store Retail Revenue – up 4.3%
■ Income $130.6 Million – up 9.6%
■ Earnings Per Share $1.39 – up 9.4%
21%
18%
16%
10%
7%
4%
4%
3%
Other 6%
Brand Mix
2006 Brand Mix by Manufacturer
7%
31%
62% Premium
DaimlerChrysler 11%
United States 68% 4.8%
Outside U.S. 32% 3.2%
Gross Profit Per Vehicle
New $2,993
Used $2,427
Finance and Insurance $917
Financial Highlights(Based on Continuing Operations)
2006
VolumeForeign Brands
GM, Ford, Chrysler (7%)
Foreign Nameplates(93%)
Same-StoreRevenue Mix Retail Revenue
Growth

2006 Annual Report
United
Auto
2006 A
nnual R
eport
United Auto Group, Inc.2555 Telegraph RoadBloomfield Hills, MI 48302-0954
www.unitedauto.com
in 2008Coming
www.smartusa.com