211-D600 Forensic Biology Section Data Bank Procedures Manual
58
TM Department of Forensic Science FORENSIC BIOLOGY SECTION DATA BANK PROCEDURES MANUAL FLUORESCENT DETECTION PCR – BASED STR DNA PROTOCOL: AMPFℓSTR ® YFILER™ SYSTEM Data Bank Yfiler System Procedures Manual DFS Document 211-D600 Issued by Biology Program Manager Revision 0 Issue Date: 26-March-2012 Page 1 of 58
Transcript of 211-D600 Forensic Biology Section Data Bank Procedures Manual


3 Analysis of Capillary Electrophoretic Data
TM
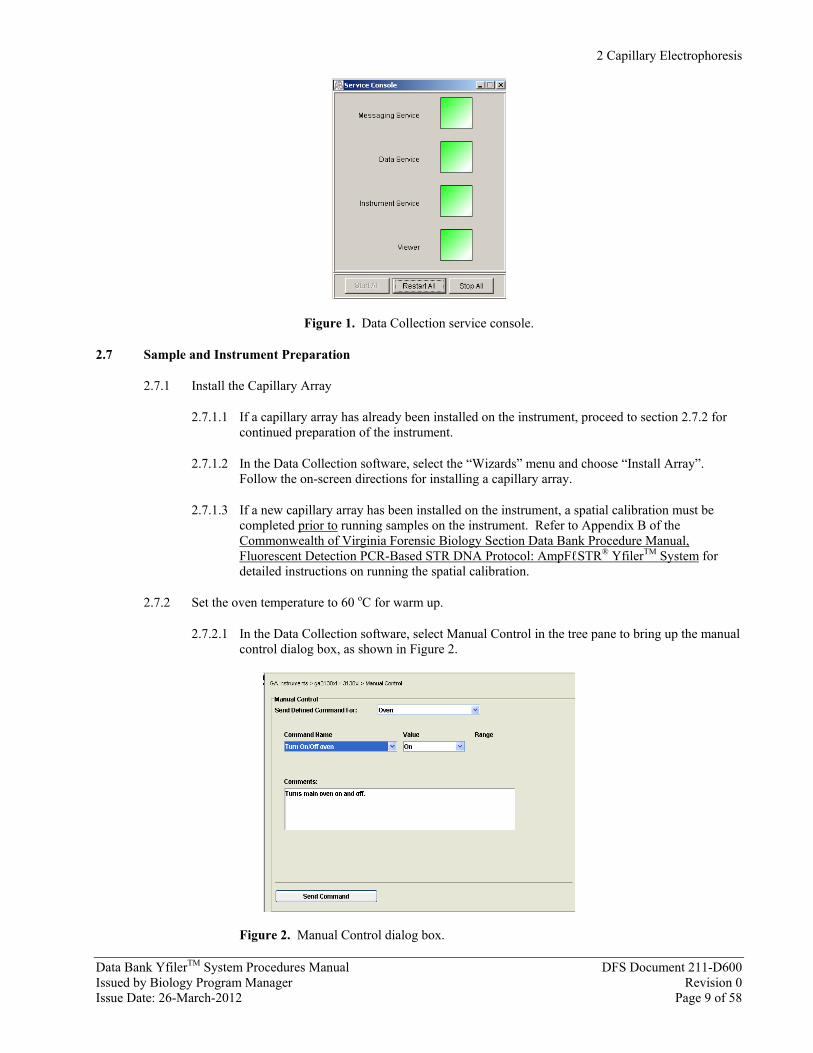
Figure 8. An example of AmpFℓSTR® YfilerTM sample data.
3.3.9.4.4 The negative control(s) should be checked to ensure that no amplification product (called alleles) was observed. Refer to Chapter 4 of the Commonwealth of Virginia Forensic Biology Section Data Bank Procedure Manual, Fluorescent Detection PCR-Based STR DNA Protocol: AmpFℓSTR® YfilerTM System for interpretation guidelines.
3.3.9.4.5 The positive control(s) should be checked to ensure that injection and electrophoresis performance was satisfactory. Refer to Chapter 4 of the Commonwealth of Virginia Forensic Biology Section Data Bank Procedure Manual, Fluorescent Detection PCR-Based STR DNA Protocol: AmpFℓSTR® YfilerTM System for interpretation guidelines.
3.3.9.4.5.1 If the positive control was injected poorly, it can be re-injected/re-run. The original sample injections can be analyzed if the correct types for the positive control are documented upon the re-injection/re-run. However, in order to use the data produced in a run, at least one positive control on the run must result in the properly designated alleles.
3.3.9.4.5.2 Artifacts such as pull-up and spikes may occasionally occur and must be documented as described in Chapter 4 of the Commonwealth of Virginia Forensic Biology Section Data Bank Procedure Manual, Fluorescent Detection PCR-Based STR DNA Protocol: AmpFℓSTR® YfilerTM System.
Data Bank Yfiler System Procedures Manual DFS Document 211-D600 Issued by Biology Program Manager Revision 0 Issue Date: 26-March-2012 Page 26 of 58
COPYRIGHT © 2012
VIRGINIA DEPARTMENT
OF FORENSIC SCIENCE
UNCONTROLLED COPY
3 Analysis of Capillary Electrophoretic Data
TM
3.3.9.4.5.3 If pull-up peaks are due to poor color separation and not excessive peak height of peaks in other channels, then a new spectral may need to be performed and the samples analyzed using the new spectral.
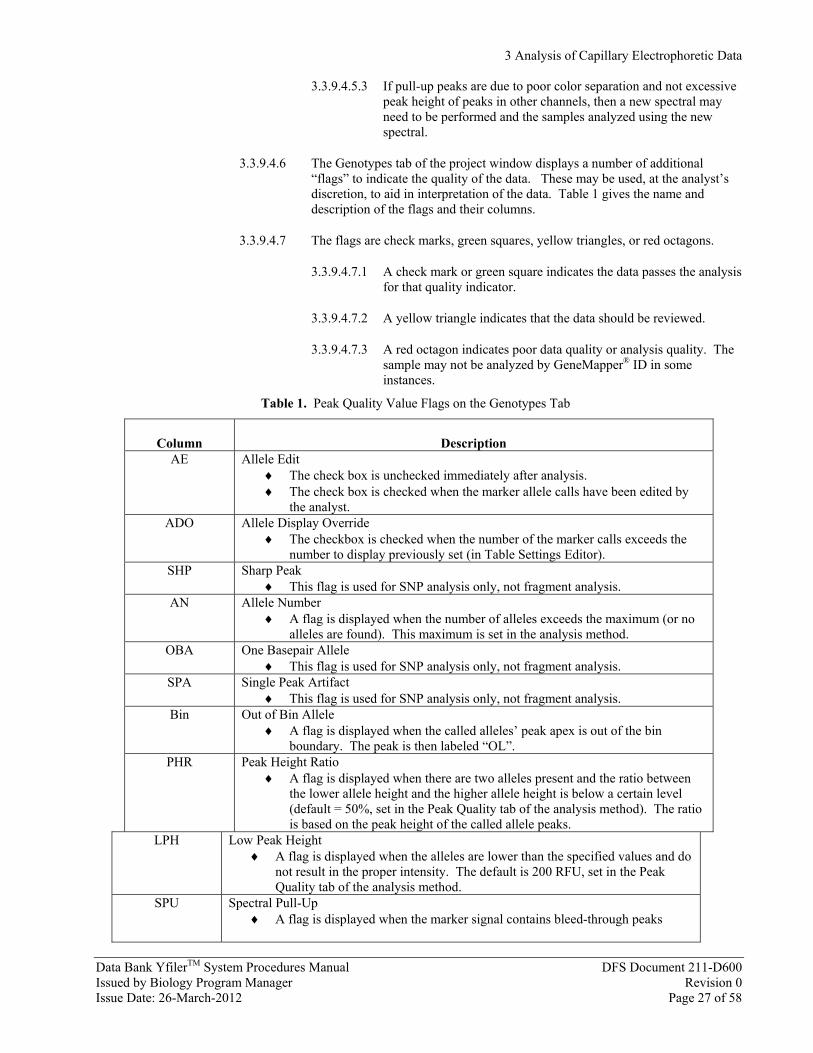
3.3.9.4.6 The Genotypes tab of the project window displays a number of additional “flags” to indicate the quality of the data. These may be used, at the analyst’s discretion, to aid in interpretation of the data. Table 1 gives the name and description of the flags and their columns.
3.3.9.4.7 The flags are check marks, green squares, yellow triangles, or red octagons.
3.3.9.4.7.1 A check mark or green square indicates the data passes the analysis for that quality indicator.
3.3.9.4.7.2 A yellow triangle indicates that the data should be reviewed.
3.3.9.4.7.3 A red octagon indicates poor data quality or analysis quality. The sample may not be analyzed by GeneMapper® ID in some instances.
Table 1. Peak Quality Value Flags on the Genotypes Tab
Issued by Biology Program Manager Revision 0 Issue Date: 26-March-2012 Page 27 of 58
Column Description AE
.
.
Allele Edit The check box is unchecked immediately after analysis The check box is checked when the marker allele calls have been edited by
the analystADO e
.
Allele Display Overrid The checkbox is checked when the number of the marker calls exceeds the
number to display previously set (in Table Settings Editor)SHP
. Sharp Peak
This flag is used for SNP analysis only, not fragment analysisAN r
.
Allele Numbe A flag is displayed when the number of alleles exceeds the maximum (or no
alleles are found). This maximum is set in the analysis methodOBA e
. One Basepair Allel
This flag is used for SNP analysis only, not fragment analysisSPA t
. Single Peak Artifac
This flag is used for SNP analysis only, not fragment analysisBin
Out of Bin Allele
A flag is displayed when the called alleles’ peak apex is out of the binboundary. The peak is then labeled “OL”.
PHR
l
Peak Height Ratio A flag is displayed when there are two alleles present and the ratio between
the lower allele height and the higher allele height is below a certain leve(default = 50%, set in the Peak Quality tab of the analysis method). The ratiois based on the peak height of the called allele peaks.
LPH Low Peak Height A flag is displayed when the alleles are lower than the specified values and do
not result in the proper intensity. The default is 200 RFU, set in the Peak Quality tab of the analysis method.
SPU Spectral Pull-Up A flag is displayed when the marker signal contains bleed-through peaks
Data Bank Yfiler System Procedures Manual DFS Document 211-D600
COPYRIGHT © 2012
VIRGINIA DEPARTMENT
OF FORENSIC SCIENCE
UNCONTROLLED COPY

3 Analysis of Capillary Electrophoretic Data
Data Bank YfilerTM System Procedures Manual DFS Document 211-D600 Issued by Biology Program Manager Revision 0 Issue Date: 26-March-2012 Page 28 of 58
Pull-up is when the peak height of the called peak is less than 10% of the larger peak within ± 1 data point.
BD Broad Peak A flag is displayed when the called alleles’ peak width is wider than 1.5
basepairs. SP Split Peak
A flag is displayed when a split peak is found by the software. A split peak is defined as overlapping peaks that are < 0.25 basepairs apart.
OS Offscale A flag is displayed when there are offscale peaks present within the marker
size range. CC Control Concordance
A flag is displayed when the designated control sample does not exactly match the defined alleles for this marker in the panel.
OVL Overlap A flag is displayed when a peak in the overlapped region is called twice, as it
is possible to have two allele size ranges that overlap. NB Narrow Bin
This flag is used for SNP analysis only, not fragment analysis. DP Double Peak
This flag is used for SNP analysis only, not fragment analysis. GQ
. .
.
.
Genotype Quality A red octagon is shown when the analysis for a sample is of low quality A green square indicates the analysis is of good quality A yellow triangle indicates the analysis should be checked The weighting of the various factors that are used for calculating the genotype
quality are set by the analysis method
3.3.10 Printing the results
3.3.10.1 All results and associated electropherograms will be maintained in electronic form according to the plate number.
3.3.10.2 If a printed copy of the electropherogram is desired, the x- and y-axes should be set accordingly for printing (as shown below). If the axis needs to be changed, right-click on the axis to display the scale settings.
3.3.10.2.1 X-axis = 70bp – 405bp
3.3.10.2.2 Negative Control or Reagent Blank: Y-axis = 0 – 100 RFU
3.3.10.2.3 Samples, Positive Control, and Allelic Ladders: Y-axis = scaled to largest peak
3.3.10.3 For printing purposes, the scale setting may be modified, if necessary, to allow visualization of specific characteristics of a particular electropherogram.
3.3.10.4 Print the electropherogram by File>Print.
3.3.10.5 Should additional documentation be necessary to support an allele designation, other views of the data (such as a zoomed-in view of an electropherogram) may be printed and retained, at the analyst’s discretion.
COPYRIGHT © 2012
VIRGINIA DEPARTMENT
OF FORENSIC SCIENCE
UNCONTROLLED COPY

4 Interpretation of the AmpFℓSTR® Yfiler™ PCR Amplification Results
TM
4 INTERPRETATION OF THE AMPFℓSTR® YFILER™ PCR AMPLIFICATION RESULTS
4.1 Technical Notes
4.1.1 STR alleles are small in size, generally less than 500 bp and contain repeat units ranging from 3 to 7 bases.
4.1.2 If an allele contains an incomplete repeat, the allele is considered a microvariant and is designated by
the number of complete repeats present followed by a decimal point, followed by the number of bases of the incomplete repeat. For example, the DYS458 16.2 allele contains 16 tetrameric repeats plus 2 bases. Because of an addition of two bases, rather than a full repeat, the allele is two bases larger than the next smaller allele and would be a 16.2 allele.
4.1.3 The characteristics of the AmpFℓSTR® Yfiler™ System and the allelic ladders are given in Table 1
below1:
Table 1. Characteristics of the AmpFℓSTR® Yfiler™ System and the allelic ladder.
Locus * Repeat Sequence
5' 3'
Size Range of Allelic Ladder
(bp)
Alleles present in Allelic Ladder
Fluorescent Label/dye color
DYS456 AGAT 100-127 13-18 6-FAM/blue
DYS389I (TCTG) (TCTA) 134-178 10-15 6-FAM/blue
DYS390 (TCTA) (TCTG) 185-245 18-27 6-FAM/blue
DYS389II (TCTG) (TCTA) 246-302 24-34 6-FAM/blue
DYS458 GAAA 133-165 14-20 VIC/green
DYS19 TAGA 167-219 10-19 VIC/green
DYS385a/b GAAA 235-323 7-25 VIC/green
DYS393 AGAT 104-144 8-16 NED/yellow
DYS391 TCTA 146-181 7-13 NED/yellow
DYS439 AGAT 192-236 8-15 NED/yellow
DYS635 TSTA compound 241-274 20-26 NED/yellow
DYS392 TAT 286-335 7-18 NED/yellow
Y GATA H4
TAGA 114-150 8-13 PET/red
DYS437 TCTA 174-210 13-17 PET/red
DYS438 TTTTC 215.5-256.5 8-13 PET/red
DYS448 AGAGAT 273-332 17-24 PET/red
All repeat sequence information was obtained from NIST,
http://www.cstl.nist.gov/biotech/strbase/ystr_fact.htm
Data Bank Yfiler System Procedures Manual DFS Document 211-D600 Issued by Biology Program Manager Revision 0 Issue Date: 26-March-2012 Page 29 of 58
COPYRIGHT © 2012
VIRGINIA DEPARTMENT
OF FORENSIC SCIENCE
UNCONTROLLED COPY

4 Interpretation of the AmpFℓSTR® Yfiler™ PCR Amplification Results
TM
4.1.4 The Fluorescent Internal Lane Standard
The GeneScan-500 LIZ Size Standard is used for obtaining base pair sizing results. The GeneScan-500 LIZ Size Standard is designed for sizing DNA fragments in the 35–500 bp range and it contains 16 single-stranded fragments of 35, 50, 75, 100, 139, 150, 160, 200, 250, 300, 340, 350, 400, 450, 490, and 500 bases.
4.1.5 Verification of the allelic ladder
Figure 1 shows electropherograms of the AmpFℓSTR® Yfiler™ allelic ladder. Ensure that alleles in the allelic ladder are properly designated.
Figure 1. AmpFℓSTR® Yfiler™ allelic ladder. 4.1.6 The “known” haplotype for the control male DNA (Human genomic DNA, 007) using the
AmpFℓSTR® Yfiler™ System is given in Table 2 below:
Locus Haplotype 007
DYS456 15
DYS389I 13
DYS390 24
DYS389II 29
DYS458 17
DYS19 15
DYS385a/b 11,14
DYS393 13
DYS391 11
Data Bank Yfiler System Procedures Manual DFS Document 211-D600 Issued by Biology Program Manager Revision 0 Issue Date: 26-March-2012 Page 30 of 58
COPYRIGHT © 2012
VIRGINIA DEPARTMENT
OF FORENSIC SCIENCE
UNCONTROLLED COPY

4 Interpretation of the AmpFℓSTR® Yfiler™ PCR Amplification Results
TM
DYS439 12
DYS635 24
DYS392 13
Y GATA H4 13
DYS437 15
DYS438 12
DYS448 19
Table 2. Known haplotype of 007 DNA control.
4.2 Procedure
4.2.1 The electropherogram data will be evaluated in order to determine if samples need to be re-injected, re-amplified, injected for a shorter period of time, more/less amplified DNA added to the injection cocktail or if a new spectral must be created due to excessive pull-up.
4.2.2 Data Bank samples are expected to exhibit single-source profiles. This may be determined by examination of the number of alleles (peaks) at each locus.
4.2.2.1 A DNA profile may be considered as having originated from a single individual if a single allele (peak) is observed at each locus. All loci should be taken into account when making this determination. Figure 2 represents an example of an electropherogram from a single source male sample.
NOTE: The DYS385a/b locus consists of a gene duplication where the two loci are separated by 40,775 bp but both loci can be amplified using the same primer set due to shared sequence information. What appear to be two alleles are actually single alleles at each locus. DYS385a may contain an allele identical in size as DYS385b or different (Figure 3). Although DYS389 I and II share a primer, they are also considered two separate loci. Gene duplications can occur at other loci and should be considered when making determinations if the sample is from a single individual.
Figure 2. Electropherogram of a single source male AmpFℓSTR® Yfiler™ profile.
Data Bank Yfiler System Procedures Manual DFS Document 211-D600 Issued by Biology Program Manager Revision 0 Issue Date: 26-March-2012 Page 31 of 58
COPYRIGHT © 2012
VIRGINIA DEPARTMENT
OF FORENSIC SCIENCE
UNCONTROLLED COPY

4 Interpretation of the AmpFℓSTR® Yfiler™ PCR Amplification Results
TM
(A) DYS385 a/b
R primer R primer
a b
F primer F primer
Duplicated regions are 40,775 bp apart and facing
away from each other a = b a b
DYS389 I/II (B)
I
Issued by Biology Program Manager Revision 0 Issue Date: 26-March-2012 Page 32 of 58
Figure 3. DYS385 a/b and DYS389 I/II.
4.2.2.2 The GeneMapper® ID software provides information on peak quality (height, base pair size, shape, number) as well as designating alleles. The GeneMapper® ID data along with the electropherogram data should be used in combination to determine the potential number of contributors to a DNA sample.
4.2.3 When an excess of DNA is added to the amplification cocktail, artifacts may occur. Most of these artifacts will be below the 13% global filter cut-off or 20% stutter filter cut-off and will not be labeled by the software. Application of the global filter causes all peaks below 13% of the highest peak within each marker not to be labeled. Application of the 20% stutter filter causes all peaks in stutter position and below 20% of the main peak not to be labeled. NOTE: If an analyst believes that a peak is real and the software does not label the peak due to the filters applied, the analyst may remove the filters (See 3.3.7.4) and reanalyze the sample to better evaluate the peak in question. Excess DNA added to the PCR reaction can produce an increased amount of PCR product and this can result in the following: 4.2.3.1 Fluorescence intensity that exceeds the linear dynamic range for detection by the instrument
("off-scale" data). Quantitation (peak height and area) for off-scale peaks is not accurate. For example, an allele peak that is off-scale can cause the corresponding stutter peak to appear higher in relative intensity, thus increasing the calculated percent stutter.
4.2.3.2 Multi-component analysis of off-scale data can result in poor spectral separation ("pull-up").
Refer to Figure 4 for an example of pull-up at the DYS439 locus.
I
F primer F primer
R primer
DYS389I DYS389II
Butler, J.M. (2005) Forensic DNA Typing, 2nd Edition, Figure 9.5, ©Elsevier Science/Academic Press
Multi-Copy (Duplicated) Marker
Single Region but Two PCR Products (because forward primers bind twice)
II
Data Bank Yfiler System Procedures Manual DFS Document 211-D600
COPYRIGHT © 2012
VIRGINIA DEPARTMENT
OF FORENSIC SCIENCE
UNCONTROLLED COPY

4 Interpretation of the AmpFℓSTR® Yfiler™ PCR Amplification Results
TM
Figure 4. Pull-up from the green channel (panel 2) showing up in the black/yellow channel (panel 3), which is labeled by the GeneMapper® ID software as an OL allele in DYS439. Note that with the application of the 13% global filter, as is done with databank samples, this peak would not be labeled by GMID.
4.2.3.3 Incomplete +A nucleotide addition
The PCR process using AmpliTaq Gold® is optimized such that an additional Adenosine nucleotide is added onto the extended fragment. Excessive input DNA makes the Adenosine addition less efficient and thus PCR fragments shorter by one nucleotide than the amplicon size may appear (-A).
4.2.3.4 Stutter peaks
Stutter peaks frequently appear during Y-STR profiling. These are most commonly 2, 4 and 8 nucleotides smaller or larger than the amplicon size (true peak). Careful consideration must be made when differentiating stutter peaks and a possible mixture. Stutter is typically more pronounced when excessive quantities of DNA are placed into the amplification cocktail. Not all of the loci contained within the AmpFℓSTR® Yfiler™ System kit consist of four nucleotide repeats; the DYS392 locus consists of a three nucleotide repeat, the DYS438 locus consists of a five nucleotide repeat and the DYS448 locus consists of a six nucleotide repeat. Thus, stutter peaks are typically multiples of the locus repeat lengths; DYS392 will display stutter that is three nucleotides, DYS438, five nucleotides and DYS448, six nucleotides different in size.
Data Bank Yfiler System Procedures Manual DFS Document 211-D600 Issued by Biology Program Manager Revision 0 Issue Date: 26-March-2012 Page 33 of 58
COPYRIGHT © 2012
VIRGINIA DEPARTMENT
OF FORENSIC SCIENCE
UNCONTROLLED COPY
4 Interpretation of the AmpFℓSTR® Yfiler™ PCR Amplification Results
TM
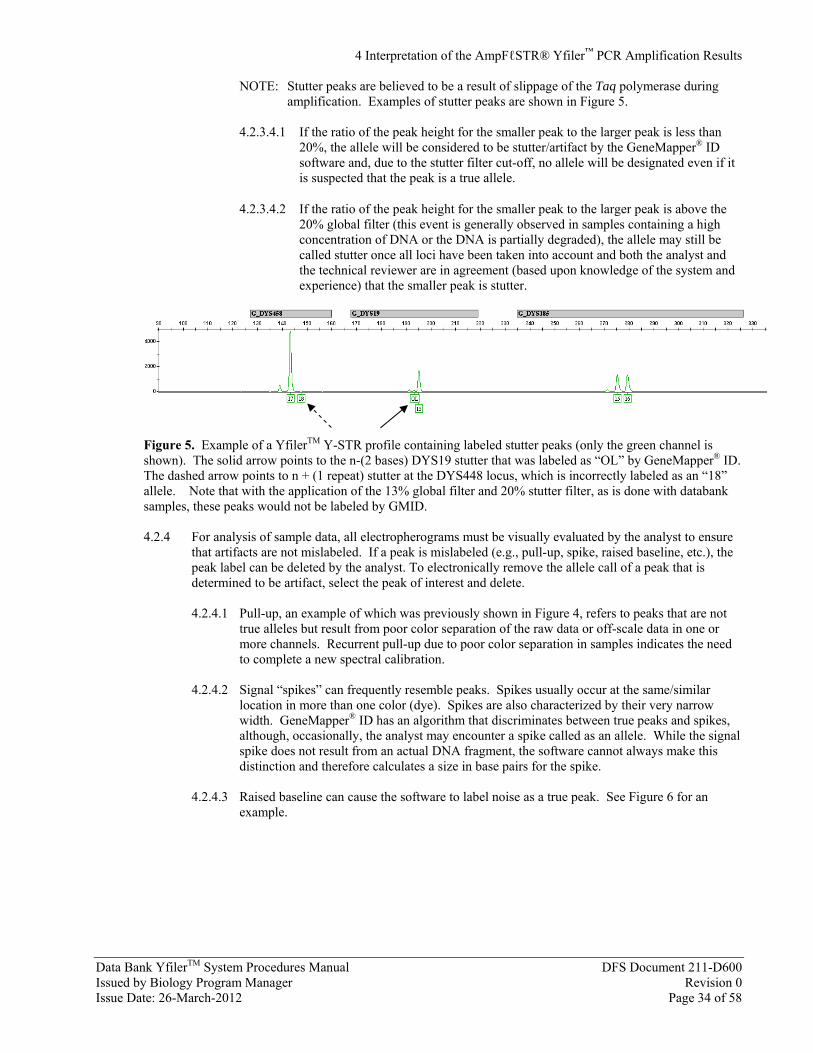
NOTE: Stutter peaks are believed to be a result of slippage of the Taq polymerase during amplification. Examples of stutter peaks are shown in Figure 5.
4.2.3.4.1 If the ratio of the peak height for the smaller peak to the larger peak is less than 20%, the allele will be considered to be stutter/artifact by the GeneMapper® ID software and, due to the stutter filter cut-off, no allele will be designated even if it is suspected that the peak is a true allele.
4.2.3.4.2 If the ratio of the peak height for the smaller peak to the larger peak is above the 20% global filter (this event is generally observed in samples containing a high concentration of DNA or the DNA is partially degraded), the allele may still be called stutter once all loci have been taken into account and both the analyst and the technical reviewer are in agreement (based upon knowledge of the system and experience) that the smaller peak is stutter.
Figure 5. Example of a YfilerTM Y-STR profile containing labeled stutter peaks (only the green channel is shown). The solid arrow points to the n-(2 bases) DYS19 stutter that was labeled as “OL” by GeneMapper® ID. The dashed arrow points to n + (1 repeat) stutter at the DYS448 locus, which is incorrectly labeled as an “18” allele. Note that with the application of the 13% global filter and 20% stutter filter, as is done with databank samples, these peaks would not be labeled by GMID. 4.2.4 For analysis of sample data, all electropherograms must be visually evaluated by the analyst to ensure
that artifacts are not mislabeled. If a peak is mislabeled (e.g., pull-up, spike, raised baseline, etc.), the peak label can be deleted by the analyst. To electronically remove the allele call of a peak that is determined to be artifact, select the peak of interest and delete. 4.2.4.1 Pull-up, an example of which was previously shown in Figure 4, refers to peaks that are not
true alleles but result from poor color separation of the raw data or off-scale data in one or more channels. Recurrent pull-up due to poor color separation in samples indicates the need to complete a new spectral calibration.
4.2.4.2 Signal “spikes” can frequently resemble peaks. Spikes usually occur at the same/similar
location in more than one color (dye). Spikes are also characterized by their very narrow width. GeneMapper® ID has an algorithm that discriminates between true peaks and spikes, although, occasionally, the analyst may encounter a spike called as an allele. While the signal spike does not result from an actual DNA fragment, the software cannot always make this distinction and therefore calculates a size in base pairs for the spike.
4.2.4.3 Raised baseline can cause the software to label noise as a true peak. See Figure 6 for an
example.
Data Bank Yfiler System Procedures Manual DFS Document 211-D600 Issued by Biology Program Manager Revision 0 Issue Date: 26-March-2012 Page 34 of 58
COPYRIGHT © 2012
VIRGINIA DEPARTMENT
OF FORENSIC SCIENCE
UNCONTROLLED COPY

4 Interpretation of the AmpFℓSTR® Yfiler™ PCR Amplification Results
TM
Figure 6. Magnified view showing an example of raised baseline 4.2.4.4 Indication that a peak may be an artifact can result if a given Y-STR profile is known to be
single-source. The determination of artifact vs. true allele is made by using one or more of the following as needed: re-injection, re-amplification and review of the data.
4.2.5 Each electropherogram will include the peaks from each locus labeled with the designated allelic
number, base size and the height of the peak. 4.2.6 An independent electronic analysis must be performed for each sample and will be conducted by the
independent analyst using the GeneMapper® ID software.
4.2.7 If an allele is seen in a region “off ladder” or OL alleles, i.e., larger than the largest allelic ladder peak of the largest MW locus on the electropherogram, smaller than the smallest allelic ladder peak of the smallest MW locus on the electropherogram, or between loci, an allele designation based upon the nomenclature referenced in step 4.2.9.1 will be used.
4.2.7.1 If the allele is seen to the right (higher MW) of the largest allelic ladder peak of the largest
MW locus, it will be assigned the type of the largest allele of the allelic ladder with a greater than sign (>). If the allele is seen to the left of the smallest allelic ladder peak of the smallest MW locus, the allele will be assigned the type of the smallest allele of the allelic ladder with a less than sign (<). The "OL" value on the electropherogram will be manually changed to reflect the allele designation.
4.2.8 If an allele is seen between two loci and either the locus to the right OR left of the peak contains one peak, the allele will be considered to belong with the locus not containing a peak. The assignment of the allele designation will be based upon the nomenclature referenced in step 4.2.10.1.
4.2.8.1 If the allele is to the right of the largest allelic ladder peak of the locus not containing an
allele, it will be assigned the type of the largest allele of the allelic ladder with a greater than sign (>). If the allele is smaller than the smallest allelic ladder peak of the locus not containing a peak, the allele will be assigned the type of the smallest allele of the allelic ladder with a less than sign (<). The "OL" value will be manually changed to reflect the allele designation.
4.2.9 If an allele is seen between two loci and neither the higher nor lower molecular weight locus contains an allele, follow the guidelines outlined in steps 4.2.9.1 through 4.2.9.3.
4.2.9.1 The base pair size for the allele in question will be compared to the base pair values for the
largest allelic ladder peak of the lower molecular weight locus and to the smallest allelic ladder peak of the higher molecular weight locus. An evaluation of the physical location of the allele in question with respect to the higher and lower molecular weight loci will be conducted.
Data Bank Yfiler System Procedures Manual DFS Document 211-D600 Issued by Biology Program Manager Revision 0 Issue Date: 26-March-2012 Page 35 of 58
COPYRIGHT © 2012
VIRGINIA DEPARTMENT
OF FORENSIC SCIENCE
UNCONTROLLED COPY

4 Interpretation of the AmpFℓSTR® Yfiler™ PCR Amplification Results
TM
4.2.9.2 The allele in question will be considered to belong to the locus which is closest in proximity and falls within an appropriate size distance from the locus (i.e., one or two repeat units from the largest/smallest allelic ladder peak).
4.2.9.3 Once it has been determined to which locus the allele belongs, if the allele is larger than the
largest allelic ladder peak it will be assigned the type of the largest allele of the allelic ladder with a greater than sign (>). If an allele is smaller than the smallest allelic ladder peak, the allele will be assigned the type of the smallest allele of the allelic ladder with a less than sign (<). The "OL" value on the electropherogram will be manually changed to reflect the allele designation.
4.2.10 If an allele is visually between two allelic ladder peaks of the same locus, the GeneMapper® ID program generates a value “off ladder”. The allele will be considered to be a microvariant. The allele will be assigned an allele designation of the lower repeat value followed by the number of bases in the incomplete repeat. Example: an allele that migrates one base pair below the DYS391 11 allele will be designated as a DYS391 10.3. The "off ladder" value on the electropherogram will be manually changed to reflect the allele designation.
4.2.11 For a typing result to be reported, all controls must give the expected result and have been treated appropriately (i.e., blanks at same or longer injection times and/or same or larger volumes loaded into the injection cocktail).
4.2.11.1 Reagent Blanks
4.2.11.1.1 If a signal (peak) is detected in a reagent blank at a single locus and the signal is demonstrated to be part of the control, the test results associated with the reagent blank will be evaluated against the samples around it to determine whether the result can be used or if the sample has to be re-injected, re-extracted or re-amplified. If a reinjection does not reproduce the signal (peak), the reagent blank result can be used.
4.2.11.1.2 If a signal (peak) is detected in a reagent blank at multiple loci and the signal is demonstrated to be part of the control, the test results for all loci will be considered inconclusive and all samples associated with the reagent blank will be re-extracted and/or re-amplified.
4.2.11.2 Positive Amplification Control
4.2.11.2.1 The positive control DNA (007 male genomic DNA) must elicit the "known" genotype for each locus as specified in 4.1.6. If an allele is detected in the positive control DNA at a specific locus that is not consistent with the known genotype or if no result is obtained at a single locus, the test will be considered inconclusive at that locus. If it is imperative that the locus be used, the samples will be re-amplified.
4.2.11.3 Negative Amplification Control
4.2.11.3.1 If a signal (peak) is detected in a negative control at a single locus and the signal is demonstrated to be part of the control, the test results associated with the negative control will be evaluated against the samples around it to determine whether the result can be used or if the sample has to be re-injected, re-extracted or re-amplified. If a reinjection does not reproduce the signal (peak), the negative control result can be used.
Data Bank Yfiler System Procedures Manual DFS Document 211-D600 Issued by Biology Program Manager Revision 0 Issue Date: 26-March-2012 Page 36 of 58
COPYRIGHT © 2012
VIRGINIA DEPARTMENT
OF FORENSIC SCIENCE
UNCONTROLLED COPY

4 Interpretation of the AmpFℓSTR® Yfiler™ PCR Amplification Results
Data Bank YfilerTM System Procedures Manual DFS Document 211-D600 Issued by Biology Program Manager Revision 0 Issue Date: 26-March-2012 Page 37 of 58
4.2.11.3.2 If a signal (peak) is detected in the negative amplification control at multiple loci and the signal is demonstrated to be part of the control, the test results for all loci will be considered inconclusive and all samples will be re-amplified.
4.2.12 If it is determined that a sample contains stutter peaks at a majority of the loci and other artifactual peaks are visible throughout the electropherogram due to overloading of the sample and/or amplifying too much sample DNA, the sample may be re-injected using a reduced injection time and/or using less amplified DNA in the injection cocktail following the guidelines described in Chapter 3. Samples may also be re-amplified with less template DNA and then re-typed. If however, the accurate profile can be determined from the original sample profile by both the analyst and the technical reviewer, then the data may be used.
REFERENCES:
1. AmpFℓSTR® Yfiler™ PCR Amplification Kit User’s Manual. Applied Biosystems, 2006.
COPYRIGHT © 2012
VIRGINIA DEPARTMENT
OF FORENSIC SCIENCE
UNCONTROLLED COPY

5 Quality Assurance/Quality Control
TM
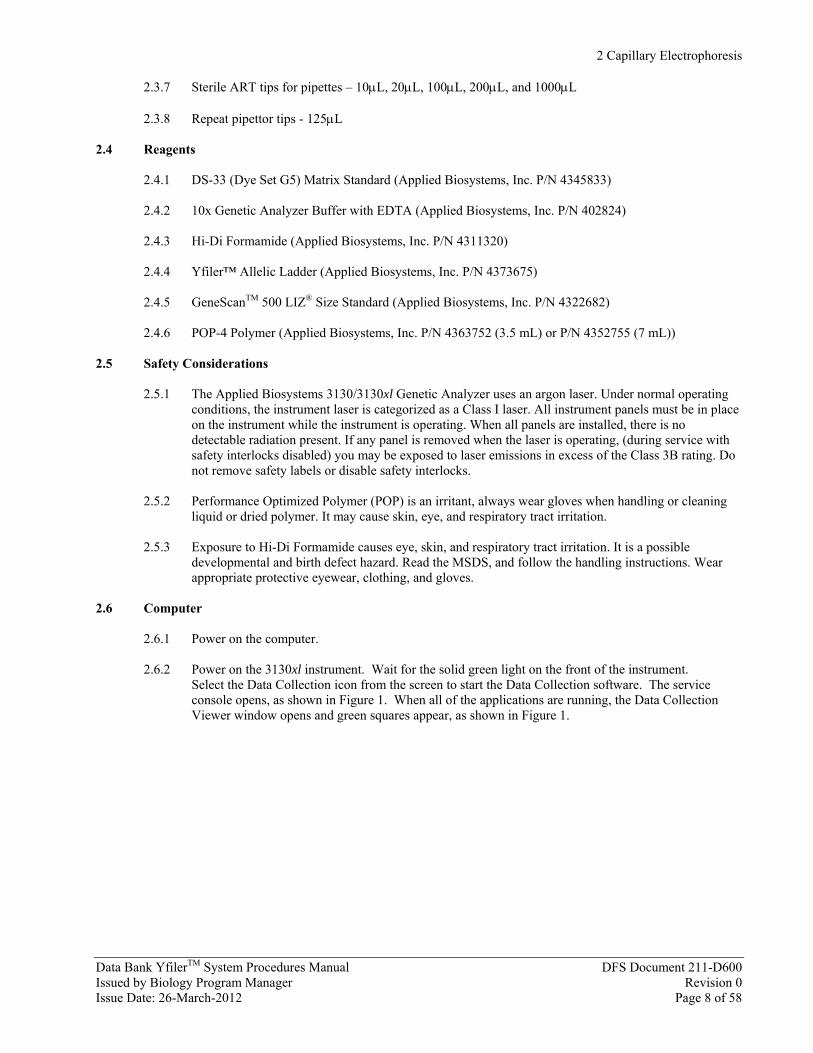
5 QUALITY ASSURANCE/QUALITY CONTROL The purpose of the procedures in this section is to ensure that the parameters of the testing process are routinely monitored in the manner necessary to maintain the success and reliability of the testing procedures. The following is specific to equipment, reagents, and supplies utilized in Y-STR typing. Refer to the Commonwealth of Virginia Department of Forensic Science Forensic Biology Section Procedure Manual Section VI, Quality Assurance Manual for the quality measures that apply to both the PowerPlex® 16 STR typing as well as AmpFℓSTR® YfilerTM Y-STR typing. 5.1 Instruments and Equipment
5.1.1 Calibration and Maintenance Schedules
Routine maintenance and/or calibration will be performed on each instrument/piece of equipment considered essential for Y-STR typing based upon the following schedule: APPLIED BIOSYSTEMS, INC. 3130xl GENETIC ANALYZER: Annually - Have authorized vendor evaluate and perform necessary maintenance and repair.
Record the service call on the "Equipment Calibration/Maintenance/Repair Form" found in Document 210-F600 or comparable log form.
Refer to the Commonwealth of Virginia Department of Forensic Science Forensic Biology Section
Manual Data Bank PowerPlex 16 Procedures Manual: Appendix C for the maintenance of the 3130xl .
If a 3130xl is taken off line for repair/maintenance, prior to being put back in service, a
performance check will be performed. This check will consist of injecting a minimum of 2 ladders and 2 DNA samples of a known genotype.
5.2 Reagents, Chemicals, and Supplies
5.2.1 Sources of Reagents, Chemicals, and Supplies
A listing of commercial sources for all reagents, chemicals, and supplies specific to Y-STR typing is found in the Commonwealth of Virginia Department of Forensic Science, Forensic Biology Data Bank Section Procedure Manual, Fluorescent Detection PCR-Based STR DNA Protocol: AmpFℓSTR® YfilerTM, Appendix A: Reagents.
5.3 Critical Reagents and Supplies
All critical reagents and supplies must be quality control tested for accurate, reliable performance prior to being used in the Forensic Biology Data Bank Section. Refer to the Commonwealth of Virginia Department of Forensic Science Forensic Biology Section Procedure Manual Section VI, Quality Assurance Manual, Chapter 3: Quality Control of Critical Reagents and Supplies for the quality measures that apply to both the PowerPlex® 16 STR typing as well as Y-STR typing using the AmpFℓSTR® YfilerTM amplification kit. The following reagents/kits/supplies that apply only to Y-STR typing will be quality control tested as indicated below when a new lot is received into the laboratory.
5.3.1 AmpFℓSTR® YfilerTM Kits 5.3.1.1 Upon receipt and before use, each new lot of AmpFℓSTR® YfilerTM kits will be quality
control tested to ensure the integrity of the PCR reagents that are provided within the kit.
Data Bank Yfiler System Procedures Manual DFS Document 211-D600 Issued by Biology Program Manager Revision 0 Issue Date: 26-March-2012 Page 38 of 58
COPYRIGHT © 2012
VIRGINIA DEPARTMENT
OF FORENSIC SCIENCE
UNCONTROLLED COPY

5 Quality Assurance/Quality Control
TM
5.3.1.2 Amplify and type one sample that has been extracted of a known DNA type in addition to one negative amplification blank, one female DNA sample (9947A Cell Line), and one positive amplification control (007 and/or GM9948 Cell Line) per new lot of kits. Follow the amplification and typing procedures outlined in Chapters 1, 2, and 3. Record the loading position of the samples and the requisite ladder(s) on the worksheets used for Data Bank analysis.
5.3.1.3 Once the electropherograms have been analyzed, provided the expected types and intensities
are obtained (i.e., known samples and positive amplification control consistent with validation data) and the negative amplification blank and 9947A do not produce results, the new lot of AmpFℓSTR® YfilerTM kits will be considered to have passed the quality control verification and may be put on-line for routine use. The electropherogram data for the quality control verification of the AmpFℓSTR® YfilerTM kits does not need to be analyzed by an independent analyst.
5.3.1.4 Once the new lot of AmpFℓSTR® YfilerTM kits has passed the quality control verification, the
kits will be labeled with the quality control date and the expiration date. Refer to the Commonwealth of Virginia Department of Forensic Science Forensic Biology Section Data Bank Procedure Manual, Fluorescent Detection PCR-Based STR DNA: AmpFℓSTR® YfilerTM for the kit expiration date. All worksheets and paperwork associated with the quality control test will be maintained.
NOTE: This quality control test can be done in conjunction with the quality control testing of
the AmpFℓSTR® YfilerTM Allelic Ladder, or GeneScan 500 LIZ Size Standard.
5.3.2 AmpFℓSTR® YfilerTM Allelic Ladder or GeneScan 500 LIZ Size Standard 5.3.2.1 Type one negative amplification blank and one positive amplification control (007 or 9948
Cell Line). Follow the typing procedures outlined in the Commonwealth of Virginia Department of Forensic Science Forensic Biology Section Data Bank Procedure Manual, Fluorescent Detection PCR-Based STR DNA Protocol: AmpFℓSTR® YfilerTM, Chapters 1, 2, and 3. Record the loading position of the samples and requisite ladder(s) on the worksheets used for Data bank analysis.
5.3.2.2 Once the electropherograms have been analyzed, providing the expected types and intensities
are obtained (i.e., positive amplification control) and the negative amplification blank does not produce typing results, the new lot of AmpFℓSTR® YfilerTM Allelic Ladder or GeneScan 500 LIZ Size Standard will be considered to have passed the quality control verification and may be implemented for routine use. The electropherogram data for the quality control verification of the AmpFℓSTR® YfilerTM Allelic Ladder or GeneScan 500 LIZ Size Standard does not need to be analyzed by an independent analyst.
5.3.2.3 Once the new lot of AmpFℓSTR® YfilerTM Allelic Ladder or GeneScan 500 LIZ Size
Standard has passed the quality control verification, the stock container will be labeled with the quality control date and expiration date. Refer to the Commonwealth of Virginia Department of Forensic Science Forensic Biology Section Data Bank Procedure Manual, Fluorescent Detection PCR-Based STR DNA Protocol: AmpFℓSTR® YfilerTM for the AmpFℓSTR® YfilerTM Allelic Ladder or GeneScan 500 LIZ Size Standard expiration date. All worksheets and paperwork associated with the quality control test will be maintained.
NOTE: This quality control test can be done in conjunction with the quality control testing of
the AmpFℓSTR® Yfiler kit(s).
5.3.3 Standard Reference Material (SRM) 2395
The Standard Reference Material (SRM) 2395 kit is designed to ensure that each step of the procedure for the DNA polymerase chain reaction (PCR) Y-STR testing methodology is functioning properly and
Data Bank Yfiler System Procedures Manual DFS Document 211-D600 Issued by Biology Program Manager Revision 0 Issue Date: 26-March-2012 Page 39 of 58
COPYRIGHT © 2012
VIRGINIA DEPARTMENT
OF FORENSIC SCIENCE
UNCONTROLLED COPY

5 Quality Assurance/Quality Control
Data Bank YfilerTM System Procedures Manual DFS Document 211-D600 Issued by Biology Program Manager Revision 0 Issue Date: 26-March-2012 Page 40 of 58
can be calibrated to the national standard provided by the National Institute of Standards and Technology (NIST). 5.3.3.1 Each laboratory conducting Y-STR analysis will verify its procedure using the SRM 2395 kit
or samples traceable to a SRM kit annually. 5.3.3.2 Six samples are provided in the SRM 2395 kit. Each sample will be amplified using the
AmpFℓSTR® YfilerTM kit according to the procedure manual. Alternately, at least two NIST traceable samples can be processed according to the procedure manual. Refer to Appendix G of the Commonwealth of Virginia Department of Forensic Science Forensic Biology Section Procedure Manual, Section VI, Quality Assurance Program DNA Typing of Biological Materials for information on how to prepare NIST traceable samples.
5.3.3.3 Once the electropherograms have been analyzed, the expected types obtained and the controls
typed appropriately, the laboratory’s procedure will be considered to be functioning properly and calibrated to the national standard. The electropherogram data for the quality control verification of the laboratory’s PCR-based procedure does not need to be analyzed by an independent analyst.
5.3.3.4 All worksheets and paperwork associated with the quality control test will be maintained.
COPYRIGHT © 2012
VIRGINIA DEPARTMENT
OF FORENSIC SCIENCE
UNCONTROLLED COPY

Appendix A – Reagents
TM
APPENDIX A - REAGENTS 1. This appendix describes the preparation of reagents necessary for the Y-STR DNA analysis. For each reagent
listed, the company and catalog number is included. As a reagent is prepared, it will be labeled to include the following information:
Identity Concentration Lot number Date of preparation Initials of preparer Date of expiration and if appropriate: Date of autoclaving Storage requirements 2. All reagents will be prepared with Type I water, unless other wise stated. 3. All chemicals and reagents will be stored according to the manufacturers' specifications. All chemicals
containing biologicals will be disposed of in biohazard bags. 4. Any changes in chemical supply companies will be carefully checked by the Section Supervisor to ensure the
chemical being provided meets the specifications necessary for the reagent. Any changes in chemical supply companies will be brought to the Biology Program Manager’s attention so the list can be updated as necessary.
5. Concentrations preceding reagent components reflect the final concentrations of that specific component in the
resulting mixture.
When a reagent is diluted and used by a number of examiners and retained, a lot number must be created and the reagent must be traceable to the reagent log. The container with the diluted reagent must contain the new lot number, the date the dilution was prepared, and the initials of the individual preparing the dilution. If a stock solution is diluted and used once and discarded or the dilution is used only by the examiner preparing the dilution, a new lot number does not need to be assigned or recorded in the reagent log. The Positive Control DNA is an example of such reagents where this applies. The original reagent stock lot number will be used.
10x GENETIC ANALYZER BUFFER WITH EDTA
Expiration date: Three years from date of receipt Purchased from Applied Biosystems, Foster City, CA., PN 402824, 25 mL each.
AMPFℓSTR YfilerTM KIT
Expiration date: Manufacturer’s expiration date Purchased from Applied Biosystems, Inc., Foster City, CA., Catalog Number 4359513 for 100 reaction kit
Kit components included (expiration date same as kit unless specified): AMPFℓSTR YfilerTM PRIMER SET AMPFℓSTR YfilerTM PCR REACTION MIX AMPFℓSTR YfilerTM ALLELIC LADDER – expiration date: 6 mos. from date of initial use or
manufacturer’s specified expiration date on the kit, whichever comes first AMPLITAQ® GOLD DNA POLYMERASE – 5U/L CONTROL DNA (007 MALE DNA STANDARD-0.10 ng/L, 9947A FEMALE CELL LINE- 10 ng/L)
Data Bank Yfiler System Procedures Manual DFS Document 211-D600 Issued by Biology Program Manager Revision 0 Issue Date: 26-March-2012 Page 41 of 58
COPYRIGHT © 2012
VIRGINIA DEPARTMENT
OF FORENSIC SCIENCE
UNCONTROLLED COPY

Appendix A – Reagents
Data Bank YfilerTM System Procedures Manual DFS Document 211-D600 Issued by Biology Program Manager Revision 0 Issue Date: 26-March-2012 Page 42 of 58
AMPLITAQ® GOLD DNA POLYMERASE
Expiration date: Manufacturer's expiration date Applied BioSystems, Foster City, CA., Catalog number N808-0243 (6 pack) or N808-0244 (12 pack).
GENESCAN-500 LIZ SIZE STANDARD
Expiration date: Manufacturer's expiration date Applied Biosystems, Inc., Foster City, CA, PN 4322682. Standard includes 16 DNA fragments of the following sizes: 35, 50, 75,100, 139, 150, 160, 200, 250, 300, 340, 350, 400, 450, 490 and 500 bp.
HI-DITM FORMAMIDE
Expiration date: Three years from date of receipt Applied Biosystems, Inc., Foster City, CA, PN 4311230, 25 mL each. Aliquoted into 500 L aliquots for DB and stored at -20oC.
MATRIX STANDARD – DS-33 (Dye Set G5)
Expiration date: Manufacturer's expiration date Applied Biosystems, Foster City, CA, PN 4345833.
COPYRIGHT © 2012
VIRGINIA DEPARTMENT
OF FORENSIC SCIENCE
UNCONTROLLED COPY

Appendix B – Capillary Electrophoresis Maintenance
TM
APPENDIX B – CAPILLARY ELECTROPHORESIS MAINTENANCE 1 General Maintenance Schedule for the 3130xl
Table 1. Maintenance Tasks
Task Frequency
Ensure adequate levels of buffer and water in reservoirs Before each run
Ensure the level of buffer in the buffer jar reaches the red line. The overflow hole should not be occluded.
Before each run
Replace the water and 1X running buffer in the reservoirs and make sure the outside of the reservoirs are dry.
Every 48 hours or before each
run, whichever comes last
Check for bubbles in the pump block, lower polymer block, interconnect tube, polymer supply tube, and channels. Remove all bubbles with the Bubble Remove wizard.
Before each run
Check the loading-end header to ensure the capillary tips are not crushed or damaged.
Before each run
Ensure that sufficient volume of polymer is present in the bottle for run.
Before each run
Ensure the pump block and lower polymer block are securely fit on the instrument.
Before each run or daily,
whichever comes last
Clean the instrument surfaces.
As needed
Check for leaks around the array knob, interconnecting tube nuts, and check valve.
Before each run or as needed
Replace the polymer using the Replenish Polymer Wizard
Every two weeks or as needed
Check the storage conditions of used arrays, if applicable.
Weekly
Run the Water wash wizard. Flush the array port during this wizard, whether or not bubbles are present in the array port.
Monthly or as needed, whichever comes last
Flush the water trap.
Monthly or as needed, whichever comes last
Defragment the PC’s hard drive.
As needed
Clean the drip tray. As needed
Change the array.
As needed
Remove any dried polymer from the capillary tips. Use a lint-free wipe moistened with deionized water.
As needed
Data Bank Yfiler System Procedures Manual DFS Document 211-D600 Issued by Biology Program Manager Revision 0 Issue Date: 26-March-2012 Page 43 of 58
COPYRIGHT © 2012
VIRGINIA DEPARTMENT
OF FORENSIC SCIENCE
UNCONTROLLED COPY

Appendix B – Capillary Electrophoresis Maintenance
TM
2 Wizards - Wizards are automated instrument processes which allow the user to perform a variety of tasks. Each wizard has been designed with specific instructions to achieve the purpose of the wizard. The wizards are accessed by selecting the desired wizard from the “Wizards” menu and activated when the instrument name is selected in the tree pane. The wizards include:
Install Array- used to install or replace capillary arrays
Change Polymer Type- change to a different polymer type (ex. POP-4 to POP-6)
Replenish Polymer – replace the polymer in the PDP with polymer with the same or different lot number.
Bubble Remove – remove bubbles (>0.2 mm) in the PDP chamber, channels, tubing, as well as the array port
Water Wash – rinse the PDP chamber, lower polymer block, channels and tubing
Instrument Shutdown – prepares the instrument for long term storage and removes the capillary array
Autosampler Calibration – calibrates the positions on the Autosampler
Update Cap Array Info – correct or update capillary array information
3 Replacing the Polymer using the Replenish Polymer Wizard
3.1 NOTE: Only use the replenish polymer wizard if the polymer type is not changing. If a different polymer type is desired, select the Change Polymer Type Wizard.
3.2 In the Data Collection Software 3.0, select Wizards> Replenish Polymer Wizard
3.3 Follow the directions given in the wizard to load fresh polymer on the instrument.
3.4 Record the date, lot number, expiration date, and polymer type in the 3130xl Instrument Log.
4 Flushing the Water Trap
4.1 The water trap in the polymer delivery pump creates a water barrier between the pump chamber seal and the actual pump. The water trap should be flushed with Type I H2O on a monthly basis or as needed to wash out any polymer and to clear bubbles. The trap must be left filled with Type I H2O.
4.1.1 Fill a 20 mL luer lock syringe with type 1 H2O. Remove any bubbles from the syringe.
4.1.2 Attach the syringe to the forward facing luer fitting at the top of the pump block, as shown in Figure 1. Hold the fitting with one hand while threading the syringe onto the fitting with the other hand.
4.1.3 Open the luer fitting by grasping the body of the fitting and turning it and the attached syringe approx. one-half turn counterclockwise.
4.1.4 Open the exit fitting at the top left side of the pump block by turning it approximately one-half turn counterclockwise.
4.1.5 Hold an empty beaker or tube under the exit fitting to catch approximately 5 mL of waste. Flush the trap by pushing steadily on the syringe plunger. Take approximately 30 seconds to flush 5 mL of Type 1 H2O through the trap.
4.1.6 Close the luer fitting then the exit fitting by turning each clockwise until the fittings seal against the block. Do not over-tighten the fittings.
Data Bank Yfiler System Procedures Manual DFS Document 211-D600 Issued by Biology Program Manager Revision 0 Issue Date: 26-March-2012 Page 44 of 58
COPYRIGHT © 2012
VIRGINIA DEPARTMENT
OF FORENSIC SCIENCE
UNCONTROLLED COPY

Appendix B – Capillary Electrophoresis Maintenance
TM
4.1.7 Remove the syringe from the luer fitting. Hold the fitting with one hand while turning the syringes counterclockwise with the other hand.
Figure 1. Diagram of the pump block for flushing the water trap. The solid arrow points to the luer fitting described in
4.1.2 above. The dashed arrow points to the exit fitting described in 4.1.4.
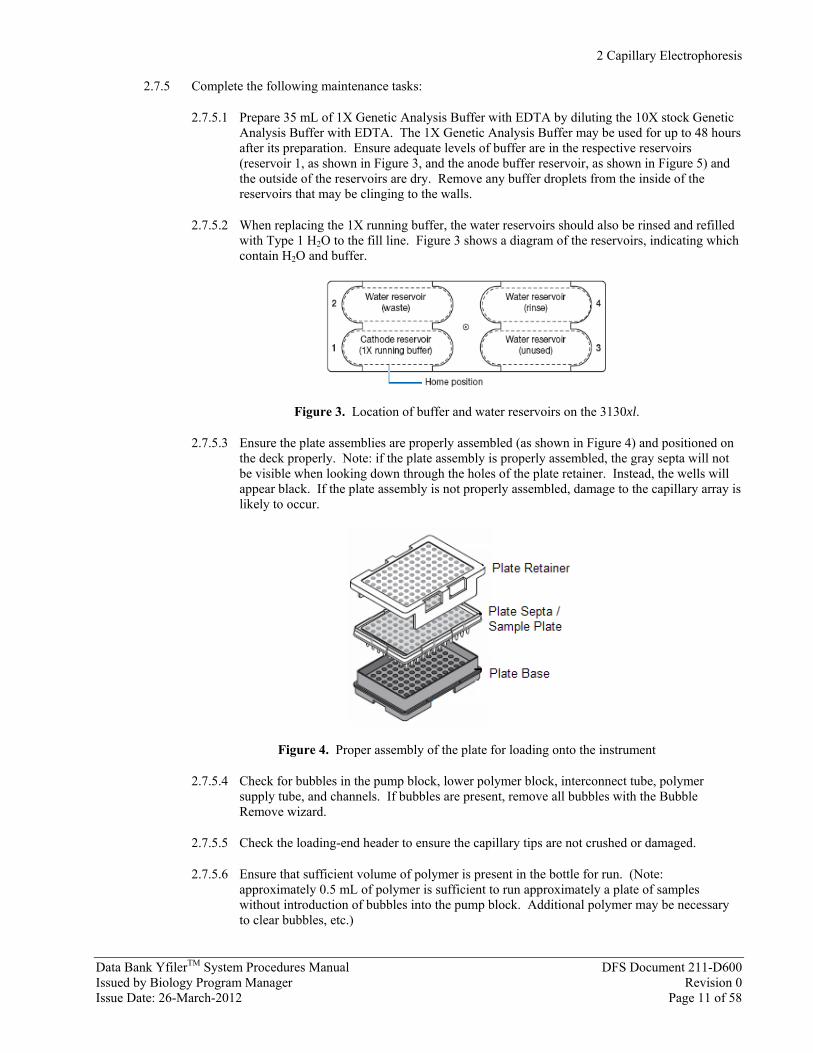
5 Rinsing and Filling Buffer and Water Reservoirs
5.1 Ensure the instrument doors are closed.
5.2 Press the TRAY button on the outside of the instrument to bring the autosampler to the forward position.
5.3 Wait until the autosampler has stopped moving and then open the instrument doors.
5.4 Remove the anode buffer reservoir by gently pulling down and twisting slightly.
5.5 Remove the cathode buffer reservoir and H2O reservoirs.
5.6 Discard the solutions into the sink and rinse out the reservoirs with ddH2O or Type 1 H2O.
5.7 Dry with a lint-free wipe the cathode and anode reservoirs and then fill the reservoir to the fill line with 1X Genetic Analyzer buffer.
5.8 Fill the water reservoirs to the fill line with ddH2O or Type 1 H2O(approximately 17 mL).
5.9 Place a clean septa strip on each reservoir and dry the outside of the reservoirs using a lint-free wipe. Be sure that the septa are dry and fitted flush on the tops of the reservoirs in order to prevent damaging the capillary tips.
5.10 Place the reservoirs into position on the autosampler as shown in Figure 2.
Issued by Biology Program Manager Revision 0 Issue Date: 26-March-2012 Page 45 of 58
Figure 2. Position of water and buffer reservoirs on the 3130xl.
6 Changing the Capillary Array
6.1 The capillary array should last approximately 100 runs.
6.2 The capillary array may need to be replaced if poor sizing precision or allele calling results, or if poor resolution and/or decreased signal intensity is demonstrated.
Data Bank Yfiler System Procedures Manual DFS Document 211-D600
COPYRIGHT © 2012
VIRGINIA DEPARTMENT
OF FORENSIC SCIENCE
UNCONTROLLED COPY

Appendix B – Capillary Electrophoresis Maintenance
TM
6.3 Close the oven and instrument doors, and then press the “Tray” button.
6.4 In the Data Collection 3.0 software, select Wizards>Install Array Wizard.
6.5 Open the instrument and oven doors
6.6 Follow the directions given in the wizard to install or replace an array.
6.7 Click Finish when done.
6.8 Close and lock the oven door.
6.9 Note: if you have replaced the array with one of a different length, a new spectral calibration must be completed for the dye set and array length combination.
6.10 Use the Update Capillary Array Info wizard (Wizard>Update Capillary Array Info) to identify the capillary array length and serial number information. The capillary serial number and date must also be added to the 3130xl instrument log.
6.11 A new spatial calibration must be completed. See 7 below for directions.
7 Performing a Spatial Calibration
7.1 A spatial calibration is used by the instrument to correlate the signal from each capillary with the signal detected by the CCD camera.
7.2 A spatial calibration must be performed when the capillary array is installed or replaced, any time the capillary array is removed from the detection block, and when the instrument is moved.
7.3 Creation of the spatial calibration file
7.3.1 On the left side of the Data Collection Software, select GA Instruments>ga3130xl>3130xl>Spatial Run Scheduler, as shown in Figure 3.
Data Bank Yfiler System Procedures Manual DFS Document 211-D600 Issued by Biology Program Manager Revision 0 Issue Date: 26-March-2012 Page 46 of 58
COPYRIGHT © 2012
VIRGINIA DEPARTMENT
OF FORENSIC SCIENCE
UNCONTROLLED COPY

Appendix B – Capillary Electrophoresis Maintenance
TM
Figure 3. Spatial Run Scheduler
7.3.2 In the spatial protocols section on the right side of the screen, select either:
7.3.2.1 Protocol>3130 SpatialFill_1, if the capillaries do not contain fresh polymer, or
7.3.2.2 Protocol>3130 SpatialNoFill_1, if the capillaries do contain fresh polymer.
7.3.3 Click Start. The calibration run lasts approximately 2 min (6 min when filling the capillaries as well.)
7.4 Evaluation of the spatial calibration file
7.4.1 The spatial calibration profile is evaluated according to:
o Peak Height – Similar peak heights should be observed for all peaks.
o Orange Crosses – One orange cross should mark the top of each peak.
o Peak Shape – Each peak should be sharp. Small shoulders are acceptable.
o Spacing – The difference between adjacent peaks should be approximately
15 pixels.
7.4.2 See Figure 4 for an example of an acceptable spatial calibration profile.
Data Bank Yfiler System Procedures Manual DFS Document 211-D600 Issued by Biology Program Manager Revision 0 Issue Date: 26-March-2012 Page 47 of 58
COPYRIGHT © 2012
VIRGINIA DEPARTMENT
OF FORENSIC SCIENCE
UNCONTROLLED COPY

Appendix B – Capillary Electrophoresis Maintenance
TM
Figure 4. An example of an acceptable spatial calibration profile.
7.4.3 In the Capillary Positions table, ensure that the values in both the Left spacing and Right spacing columns range between 13 and 16 pixels.
7.4.3.1 To move the cross, type in a new value in the Positions box for the capillary of interest and press Enter.
7.4.4 If the calibration passed, click Accept to write the calibration data to the database and the *.ini file. If the calibration failed, click Reject and repeat the spatial calibration.
7.4.4.1 Poor spatial calibration is most often due to a dirty detection window or one or more broken capillaries. The capillary array detection cell should be removed from the instrument and the mirrored side cleaned with methanol (air dry) to clean the window. While the detection cell is off the instrument, ensure that the capillaries are not broken near the detection cell.
8 Performing a Spectral Calibration
8.1 The spectral calibration creates a matrix that is used during a run to reduce the raw (collected) data from the instrument to the 4-dye or 5-dye data stored in the sample files.
8.2 The spectral calibration is specific to each dye set.
8.3 The spectral calibration needs to be performed when using a new dye set on the instrument, when the capillary array length or polymer type is changed, after the laser or CCD camera have been serviced/replaced, or if you see extensive pull-up or pull-down peaks in the data.
Note: For each dye set, a spectral calibration for each capillary array length and polymer type combination must be created.
Note: A new spectral cannot be associated with previously-collected data. For example, if a new kit (with a new dye set) is used on the instrument, it is necessary to perform a spectral calibration before running the samples with that new kit.
8.4 For Fragment analysis, two common dye sets are:
Dye Set F – used with AmpFℓSTR® COfiler® Kit, AmpFℓSTR® Profiler Plus® Kit, etc.
Dye Set G5 – used with AmpFℓSTR® YfilerTM Kit, AmpFℓSTR® Identifiler® Kit, AmpFℓSTR® MiniFiler® Kit, etc.
8.4.1 For Dye Set G5 (AmpFℓSTR® YfilerTM Kit), the DS-33 Matrix Standards should be used.
Data Bank Yfiler System Procedures Manual DFS Document 211-D600 Issued by Biology Program Manager Revision 0 Issue Date: 26-March-2012 Page 48 of 58
COPYRIGHT © 2012
VIRGINIA DEPARTMENT
OF FORENSIC SCIENCE
UNCONTROLLED COPY

Appendix B – Capillary Electrophoresis Maintenance
TM
8.4.2 Preparing the calibration standard
8.4.3 For the matrix standard, remove a tube of the matrix standard from the refrigerator, vortex to mix thoroughly, and spin briefly in a microcentrifuge. Follow the package insert for Hi-DiTM formamide and matrix standard ratios.
8.4.4 Vortex the formamide/matrix standard mixture thoroughly. Briefly centrifuge the mixture.
8.4.5 Heat the mixture at 95 oC for 5 minutes.
8.4.6 Cool the tubes in a freezer block for 2 minutes.
8.5 Loading the samples
8.5.1 Add 10 L of denatured calibration standards to each well of the first two columns of a 96-well plate.
8.5.2 Seal the plate by laying the septa flat on the plate.
8.5.3 Inspect the plate and septa to ensure that the septa fit snugly and flush on the plate. Inspect the plate to ensure no bubbles are located at the bottom of a well. If so, either briefly centrifuge the plate or use a pipet tip to remove the bubbles.
8.5.4 Leave the plate on ice until ready to prepare the plate assembly and place the assembly on the autosampler.
8.5.5 Assemble the plate assembly by placing the sample plate into the black plate base. Snap the white plate retainer onto the plate and plate base. Note: Verify that the holes of the plate retainer and the septa are aligned. If not, reassemble the plate assembly.
8.6 Creating a Spectral Instrument protocol
8.6.1 On the left side of the Data Collection software window, choose GA Instruments>ga3130xl>Protocol Manager to open the Protocol Manager, as shown in Figure 5.
Data Bank Yfiler System Procedures Manual DFS Document 211-D600 Issued by Biology Program Manager Revision 0 Issue Date: 26-March-2012 Page 49 of 58
COPYRIGHT © 2012
VIRGINIA DEPARTMENT
OF FORENSIC SCIENCE
UNCONTROLLED COPY

Appendix B – Capillary Electrophoresis Maintenance
TM
Figure 5. Creation of a protocol for a spectral calibration. The solid arrow points to the appropriate selection on the menu at the left side of the screen. The dashed arrow (near bottom) points to the “New”
button for creating a new instrument protocol, as described in 8.7.2 below.
8.6.2 In the Instrument Protocols box, click “New…”, which opens the Protocol Editor dialog box. Complete the Protocol editor dialog box:
Type a name for the protocol, typically including “Spectral” and the dye set utilized in the title.
Select Spectral in the Type drop-down list.
Select the correct dye set for your run.
Select the polymer and array length from the drop-down lists
Select your chemistry file (Matrix Standard) in the Chemistry drop-down list.
In the Run Module drop-down list, select the run module.
These modules are named with the array length and polymer type in the title. For example, Spect36_POP4 is the name of the run module that should be used when the array length is 36 cm and the polymer type used is POP-4.
Click OK.
Data Bank Yfiler System Procedures Manual DFS Document 211-D600 Issued by Biology Program Manager Revision 0 Issue Date: 26-March-2012 Page 50 of 58
COPYRIGHT © 2012
VIRGINIA DEPARTMENT
OF FORENSIC SCIENCE
UNCONTROLLED COPY
Appendix B – Capillary Electrophoresis Maintenance
TM
8.7 Performing the Spectral Calibration Plate Record
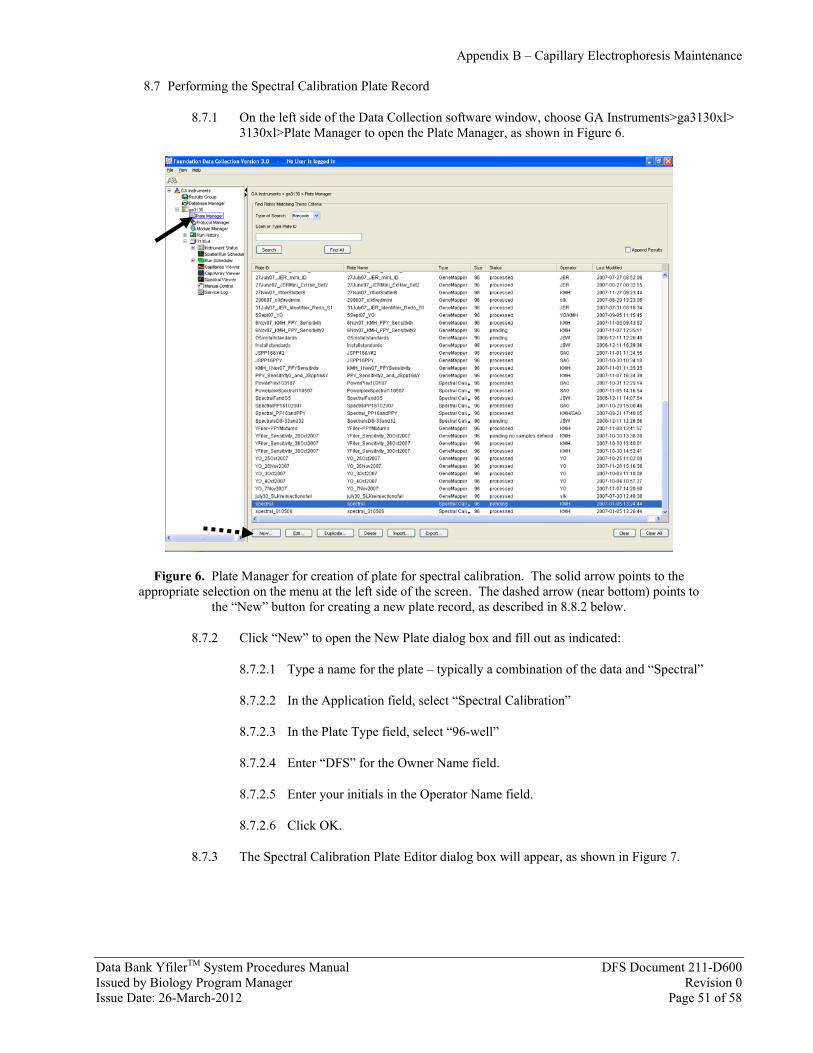
8.7.1 On the left side of the Data Collection software window, choose GA Instruments>ga3130xl> 3130xl>Plate Manager to open the Plate Manager, as shown in Figure 6.
Figure 6. Plate Manager for creation of plate for spectral calibration. The solid arrow points to the appropriate selection on the menu at the left side of the screen. The dashed arrow (near bottom) points to
the “New” button for creating a new plate record, as described in 8.8.2 below.
8.7.2 Click “New” to open the New Plate dialog box and fill out as indicated:
8.7.2.1 Type a name for the plate – typically a combination of the data and “Spectral”
8.7.2.2 In the Application field, select “Spectral Calibration”
8.7.2.3 In the Plate Type field, select “96-well”
8.7.2.4 Enter “DFS” for the Owner Name field.
8.7.2.5 Enter your initials in the Operator Name field.
8.7.2.6 Click OK.
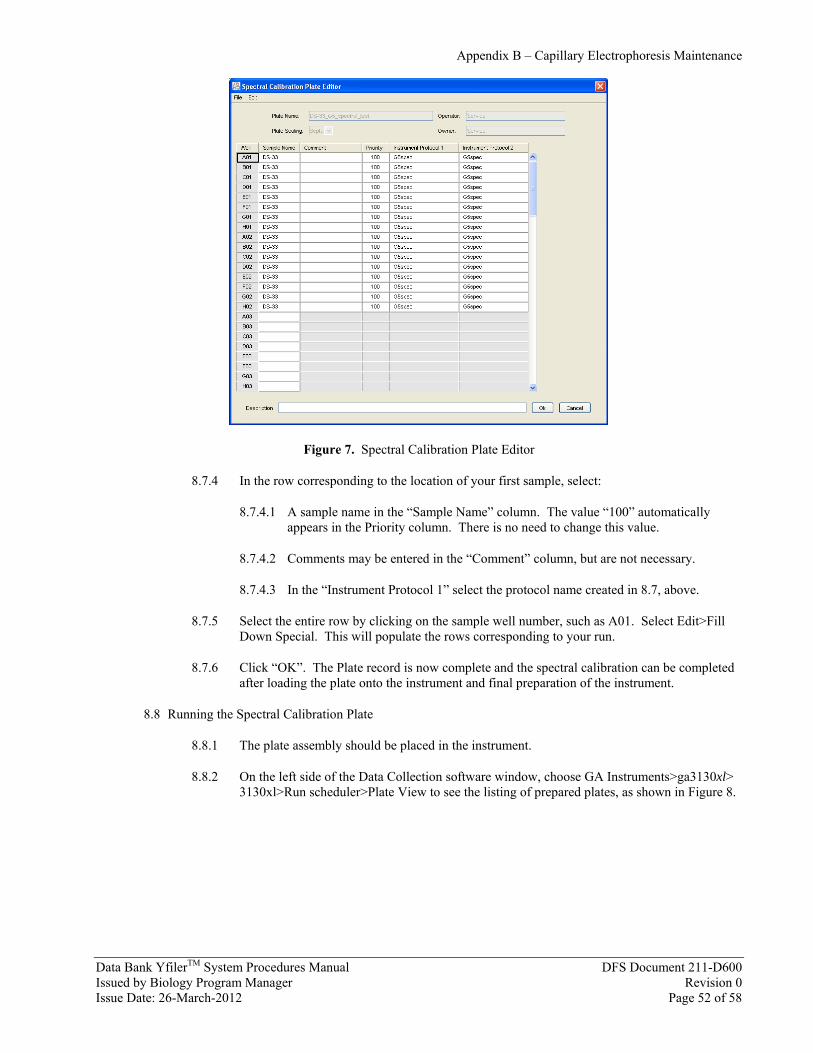
8.7.3 The Spectral Calibration Plate Editor dialog box will appear, as shown in Figure 7.
Data Bank Yfiler System Procedures Manual DFS Document 211-D600 Issued by Biology Program Manager Revision 0 Issue Date: 26-March-2012 Page 51 of 58
COPYRIGHT © 2012
VIRGINIA DEPARTMENT
OF FORENSIC SCIENCE
UNCONTROLLED COPY
Appendix B – Capillary Electrophoresis Maintenance
TM
Figure 7. Spectral Calibration Plate Editor
8.7.4 In the row corresponding to the location of your first sample, select:
8.7.4.1 A sample name in the “Sample Name” column. The value “100” automatically appears in the Priority column. There is no need to change this value.
8.7.4.2 Comments may be entered in the “Comment” column, but are not necessary.
8.7.4.3 In the “Instrument Protocol 1” select the protocol name created in 8.7, above.
8.7.5 Select the entire row by clicking on the sample well number, such as A01. Select Edit>Fill Down Special. This will populate the rows corresponding to your run.
8.7.6 Click “OK”. The Plate record is now complete and the spectral calibration can be completed after loading the plate onto the instrument and final preparation of the instrument.
8.8 Running the Spectral Calibration Plate
8.8.1 The plate assembly should be placed in the instrument.
8.8.2 On the left side of the Data Collection software window, choose GA Instruments>ga3130xl> 3130xl>Run scheduler>Plate View to see the listing of prepared plates, as shown in Figure 8.
Data Bank Yfiler System Procedures Manual DFS Document 211-D600 Issued by Biology Program Manager Revision 0 Issue Date: 26-March-2012 Page 52 of 58
COPYRIGHT © 2012
VIRGINIA DEPARTMENT
OF FORENSIC SCIENCE
UNCONTROLLED COPY

Appendix B – Capillary Electrophoresis Maintenance
TM
Figure 8. Run scheduler for spectral calibration plate. The solid arrow points to the appropriate selection on the menu at the left side of the screen. The dashed arrow points to the “Find All” button for finding the plate record created in 8.8.
8.8.3 Choose “Find All” to see a listing of all plate records. Alternatively, an advanced search can be completed. The plate name from 8.8.2 can be used to find the spectral plate of interest. Select “Search” and “Advanced” in the “Type of Search” drop-down list.
8.8.4 Once the plate of interest is found, select the plate record by clicking on the plate name. Click on the plate position indicator (grid) which corresponds to the location in which the plate resides, as completed in 8.9.1 above, shown in Figure 9. The plate map color will change from yellow to green to indicate that the plate is successfully linked. In the toolbar or the
Data Collection software, click the green arrow near the top of the screen to begin the run. Click OK when the dialog box appears (“You are about to start processing plates…”).
Data Bank Yfiler System Procedures Manual DFS Document 211-D600 Issued by Biology Program Manager Revision 0 Issue Date: 26-March-2012 Page 53 of 58
COPYRIGHT © 2012
VIRGINIA DEPARTMENT
OF FORENSIC SCIENCE
UNCONTROLLED COPY

Appendix B – Capillary Electrophoresis Maintenance
TM
Figure 9. Plate Editor. The arrow points to the plate position indicator grid.
8.9 Evaluating the Spectral Calibration Data
8.9.1 Viewing the Pass/Fail Status after the run
8.9.1.1 On the left side of the Data Collection software window, choose GA Instruments>ga3130xl> 3130xl>Instrument Status>Event Log to see the event messages.
8.9.1.2 In the “Event Messages” section of the window, view the pass/fail status of each capillary. Each capillary (1-16, for the 3130xl) should have a Q-value (q) and a condition number (c) in the range shown in Table 1.
Table 1. Acceptable condition number range and Q-values for analysis of spectral calibration data.
Dye Set Acceptable Condition
Number Range (c) Acceptable Q-value (q)
Fragment Analysis D 4 – 8.5 above 0.95 F 6 – 12 above 0.95
E5 2.5 – 4 above 0.95 G5 8.5 – 14.5 above 0.95
Any other 4- or 5-dye set
1 – 20 above 0.80
Data Bank Yfiler System Procedures Manual DFS Document 211-D600 Issued by Biology Program Manager Revision 0 Issue Date: 26-March-2012 Page 54 of 58
COPYRIGHT © 2012
VIRGINIA DEPARTMENT
OF FORENSIC SCIENCE
UNCONTROLLED COPY

Appendix B – Capillary Electrophoresis Maintenance
TM
8.9.2 Assessment of the Spectral Profiles and Raw Data
8.9.2.1 After assessing the pass/fail status of the capillaries in 8.10.1, the spectral calibration profile for each capillary must be assessed.
8.9.2.2 On the left side of the Data Collection software window, choose GA Instruments>ga3130xl> 3130xl>Spectral Viewer to see the spectral data, as shown in Figure 10.
Figure 10. Spectral Viewer. The solid arrow points to the appropriate selection on the menu at the left side of the screen. The dashed arrow (near bottom) points to passing wells (green) indicated on the plate diagram.
8.9.2.3 In the “Dye Set” drop down list, choose the dye set utilized.
8.9.2.4 In the “List of calibrations for Dye Set ___”, choose the spectral just created by ensuring the date and time correspond to that run. Do not click “set” until the data has been verified as acceptable.
8.9.2.5 Each well containing spectral sample of the 96-well plate is colored green (if passing) in the plate diagram, as shown in Figure 10. Each well can be clicked to verify the spectral profile and raw data for each independently. A failing capillary is colored tan (or yellow when selected).
8.9.2.6 Verify that the spectral and raw data profiles for each well are acceptable by meeting the following criteria:
Data Bank Yfiler System Procedures Manual DFS Document 211-D600 Issued by Biology Program Manager Revision 0 Issue Date: 26-March-2012 Page 55 of 58
COPYRIGHT © 2012
VIRGINIA DEPARTMENT
OF FORENSIC SCIENCE
UNCONTROLLED COPY

Appendix B – Capillary Electrophoresis Maintenance
TM
8.9.2.6.1 For 4-dye chemistry, the order of peaks in the spectral (top) profile should be: blue-green-yellow-red (left to right). For 5-dye chemistry, the order of the peaks in the spectral (top) profile should be blue-green-yellow-red-orange (left to right). If the peaks are not in the correct order, the calibration run has failed.
8.9.2.6.2 The order of peaks in the raw data (bottom) profile should be:
8.9.2.6.2.1 Fragment Analysis (e.g., STRs) – 4-dye: red-yellow-green-blue and 5-dye: orange, red-yellow-green-blue.
8.9.2.6.2.2 If the peaks are in the wrong order or extraneous peaks are affecting the spectral profile, the calibration run has failed.
8.9.2.6.3 The peaks in the spectral profile should not contain “gross overlaps, dips or other irregularities”. If so, the calibration has failed. A proper looking spectral profile is shown in Figure 12.
Figure 12. An example of a proper spectral calibration profile.
8.9.2.7 If the spectral profile passes, the file name can be changed to reflect the date, dye set, array length, and polymer type by clicking “Rename”.
8.9.3 Activating a Spectral Calibration File
8.9.3.1 Note: every new spectral calibration is automatically the active one for that dye set, unless manually changed. For example, if a spectral calibration were repeated but the first spectral was optimal, one may wish to choose the first spectral as the active spectral.
Data Bank Yfiler System Procedures Manual DFS Document 211-D600 Issued by Biology Program Manager Revision 0 Issue Date: 26-March-2012 Page 56 of 58
COPYRIGHT © 2012
VIRGINIA DEPARTMENT
OF FORENSIC SCIENCE
UNCONTROLLED COPY

Appendix B – Capillary Electrophoresis Maintenance
Data Bank YfilerTM System Procedures Manual DFS Document 211-D600 Issued by Biology Program Manager Revision 0 Issue Date: 26-March-2012 Page 57 of 58
8.9.3.2 On the left side of the Data Collection software window, choose GA Instruments>ga3130xl> 3130-4DFS>Spectral Viewer to see the spectral data, as shown in Figure 12.
8.9.3.3 In the “Dye Set” drop down list, select the dye set of interest.
8.9.3.4 In the “List of Calibrations for Dye Set: ___”, select the spectral calibration you wish to activate. The spectral profile and raw data are then displayed. If the spectral calibration is acceptable as described in 1.4.14.2.6, click “Set”.
9 Long periods of inactivity
9.1 If the ABI 3130xl Genetic Analyzer remains unused for an extended period of time (approximately 2 weeks or longer), it is recommended that either a blank run (consisting of only formamide and size standard) be completed or the capillary array removed and the capillary ends stored in Type I H2O until further use.
COPYRIGHT © 2012
VIRGINIA DEPARTMENT
OF FORENSIC SCIENCE
UNCONTROLLED COPY

Appendix C – Storage of Electronic Data
TM
APPENDIX C - STORAGE OF ELECTRONIC DATA 1 Saving Sample files and Project files
1.1 Sample files and project files generated by the databank using the Applied Biosystems, Inc. 3130xl Genetic Analyzer and analyzed using the GeneMapper® ID software will be saved onto a storage medium and stored according to the following procedures.
1.2 After the data has been technically reviewed and found to be acceptable, the electronic sample files and
project files will be transferred onto a medium for permanent storage. The storage medium will be labeled appropriately to indicate the data files are Yfiler samples and with the appropriate plate number. The folders may be deleted from the computer after the data has been stored and a backup copy has been made.
1.3 The storage medium will then be stored securely with the databank sample plate documentation in a
specified location within the laboratory for easy retrieval. 1.4 If a file(s) needs to be subsequently added to the storage medium for a given plate of databank samples,
the analyst will make arrangements with his/her supervisor to have the storage medium retrieved from storage and have the file(s) added to the appropriate storage medium.
Data Bank Yfiler System Procedures Manual DFS Document 211-D600 Issued by Biology Program Manager Revision 0 Issue Date: 26-March-2012 Page 58 of 58
COPYRIGHT © 2012
VIRGINIA DEPARTMENT
OF FORENSIC SCIENCE
UNCONTROLLED COPY