210211 Newcrest FY21 Half Year Results – Presentation
35
FY21 Half Year Results NEWCREST Sandeep Biswas Managing Director and Chief Executive Officer Gerard Bond Finance Director and Chief Financial Officer
Transcript of 210211 Newcrest FY21 Half Year Results – Presentation
FY21 Half Year ResultsNEWCREST
Sandeep BiswasManaging Director and Chief Executive Officer
Gerard BondFinance Director and Chief Financial Officer
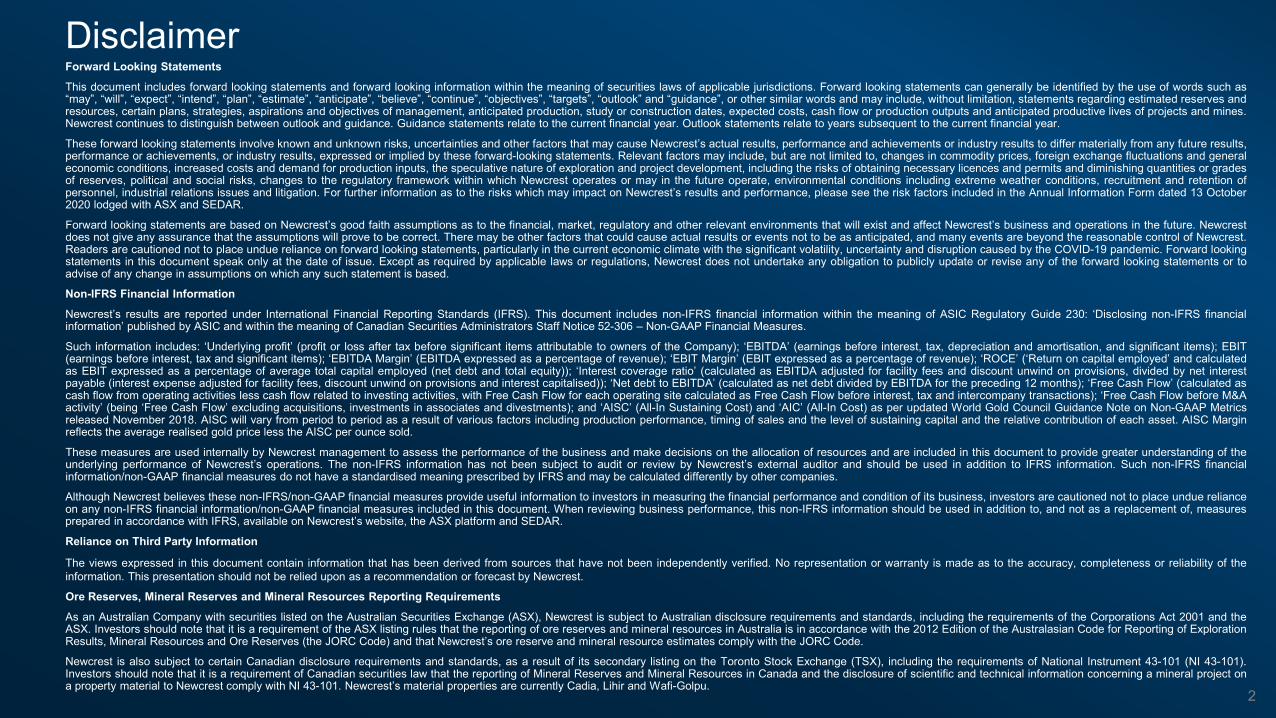
DisclaimerForward Looking StatementsThis document includes forward looking statements and forward looking information within the meaning of securities laws of applicable jurisdictions. Forward looking statements can generally be identified by the use of words such as“may”, “will”, “expect”, “intend”, “plan”, “estimate”, “anticipate”, “believe”, “continue”, “objectives”, “targets”, “outlook” and “guidance”, or other similar words and may include, without limitation, statements regarding estimated reserves andresources, certain plans, strategies, aspirations and objectives of management, anticipated production, study or construction dates, expected costs, cash flow or production outputs and anticipated productive lives of projects and mines.Newcrest continues to distinguish between outlook and guidance. Guidance statements relate to the current financial year. Outlook statements relate to years subsequent to the current financial year.
These forward looking statements involve known and unknown risks, uncertainties and other factors that may cause Newcrest’s actual results, performance and achievements or industry results to differ materially from any future results,performance or achievements, or industry results, expressed or implied by these forward-looking statements. Relevant factors may include, but are not limited to, changes in commodity prices, foreign exchange fluctuations and generaleconomic conditions, increased costs and demand for production inputs, the speculative nature of exploration and project development, including the risks of obtaining necessary licences and permits and diminishing quantities or gradesof reserves, political and social risks, changes to the regulatory framework within which Newcrest operates or may in the future operate, environmental conditions including extreme weather conditions, recruitment and retention ofpersonnel, industrial relations issues and litigation. For further information as to the risks which may impact on Newcrest’s results and performance, please see the risk factors included in the Annual Information Form dated 13 October2020 lodged with ASX and SEDAR.
Forward looking statements are based on Newcrest’s good faith assumptions as to the financial, market, regulatory and other relevant environments that will exist and affect Newcrest’s business and operations in the future. Newcrestdoes not give any assurance that the assumptions will prove to be correct. There may be other factors that could cause actual results or events not to be as anticipated, and many events are beyond the reasonable control of Newcrest.Readers are cautioned not to place undue reliance on forward looking statements, particularly in the current economic climate with the significant volatility, uncertainty and disruption caused by the COVID-19 pandemic. Forward lookingstatements in this document speak only at the date of issue. Except as required by applicable laws or regulations, Newcrest does not undertake any obligation to publicly update or revise any of the forward looking statements or toadvise of any change in assumptions on which any such statement is based.
Non-IFRS Financial InformationNewcrest’s results are reported under International Financial Reporting Standards (IFRS). This document includes non-IFRS financial information within the meaning of ASIC Regulatory Guide 230: ‘Disclosing non-IFRS financialinformation’ published by ASIC and within the meaning of Canadian Securities Administrators Staff Notice 52-306 – Non-GAAP Financial Measures.
Such information includes: ‘Underlying profit’ (profit or loss after tax before significant items attributable to owners of the Company); ‘EBITDA’ (earnings before interest, tax, depreciation and amortisation, and significant items); EBIT(earnings before interest, tax and significant items); ‘EBITDA Margin’ (EBITDA expressed as a percentage of revenue); ‘EBIT Margin’ (EBIT expressed as a percentage of revenue); ‘ROCE’ (‘Return on capital employed’ and calculatedas EBIT expressed as a percentage of average total capital employed (net debt and total equity)); ‘Interest coverage ratio’ (calculated as EBITDA adjusted for facility fees and discount unwind on provisions, divided by net interestpayable (interest expense adjusted for facility fees, discount unwind on provisions and interest capitalised)); ‘Net debt to EBITDA’ (calculated as net debt divided by EBITDA for the preceding 12 months); ‘Free Cash Flow’ (calculated ascash flow from operating activities less cash flow related to investing activities, with Free Cash Flow for each operating site calculated as Free Cash Flow before interest, tax and intercompany transactions); ‘Free Cash Flow before M&Aactivity’ (being ‘Free Cash Flow’ excluding acquisitions, investments in associates and divestments); and ‘AISC’ (All-In Sustaining Cost) and ‘AIC’ (All-In Cost) as per updated World Gold Council Guidance Note on Non-GAAP Metricsreleased November 2018. AISC will vary from period to period as a result of various factors including production performance, timing of sales and the level of sustaining capital and the relative contribution of each asset. AISC Marginreflects the average realised gold price less the AISC per ounce sold.
These measures are used internally by Newcrest management to assess the performance of the business and make decisions on the allocation of resources and are included in this document to provide greater understanding of theunderlying performance of Newcrest’s operations. The non-IFRS information has not been subject to audit or review by Newcrest’s external auditor and should be used in addition to IFRS information. Such non-IFRS financialinformation/non-GAAP financial measures do not have a standardised meaning prescribed by IFRS and may be calculated differently by other companies.
Although Newcrest believes these non-IFRS/non-GAAP financial measures provide useful information to investors in measuring the financial performance and condition of its business, investors are cautioned not to place undue relianceon any non-IFRS financial information/non-GAAP financial measures included in this document. When reviewing business performance, this non-IFRS information should be used in addition to, and not as a replacement of, measuresprepared in accordance with IFRS, available on Newcrest’s website, the ASX platform and SEDAR.
Reliance on Third Party Information
The views expressed in this document contain information that has been derived from sources that have not been independently verified. No representation or warranty is made as to the accuracy, completeness or reliability of theinformation. This presentation should not be relied upon as a recommendation or forecast by Newcrest.
Ore Reserves, Mineral Reserves and Mineral Resources Reporting RequirementsAs an Australian Company with securities listed on the Australian Securities Exchange (ASX), Newcrest is subject to Australian disclosure requirements and standards, including the requirements of the Corporations Act 2001 and theASX. Investors should note that it is a requirement of the ASX listing rules that the reporting of ore reserves and mineral resources in Australia is in accordance with the 2012 Edition of the Australasian Code for Reporting of ExplorationResults, Mineral Resources and Ore Reserves (the JORC Code) and that Newcrest’s ore reserve and mineral resource estimates comply with the JORC Code.
Newcrest is also subject to certain Canadian disclosure requirements and standards, as a result of its secondary listing on the Toronto Stock Exchange (TSX), including the requirements of National Instrument 43-101 (NI 43-101).Investors should note that it is a requirement of Canadian securities law that the reporting of Mineral Reserves and Mineral Resources in Canada and the disclosure of scientific and technical information concerning a mineral project ona property material to Newcrest comply with NI 43-101. Newcrest’s material properties are currently Cadia, Lihir and Wafi-Golpu.
2

DisclaimerCompetent Person’s StatementThe information in this document that relates to Mineral Resources or Ore Reserves has been extracted from the release titled “Annual Mineral Resources and Ore Reserves Statement – 31 December 2020” dated 11 February 2021(the original MR&OR release), and have been prepared in accordance with the requirements of Appendix 5A of the ASX Listing Rules by Competent Persons.
The information in this document that relates to Exploration Results at Red Chris has been extracted from Newcrest’s releases titled “Quarterly Exploration Report” dated 28 January 2021, 23 July 2020 and 30 April 2020 (the originalexploration releases). The information in this document that relates to Exploration Results at Havieron has been extracted from Newcrest’s release titled “Quarterly Exploration Report” dated 28 January 2021.
The original MR&OR release and the original exploration releases (together, the original releases) are available to view at www.asx.com.au under the code “NCM” and on Newcrest’s SEDAR profile. Newcrest confirms that it is not awareof any new information or data that materially affects the information included in the original releases and that all material assumptions and technical parameters underpinning the estimates in the original releases continue to apply andhave not materially changed. Newcrest confirms that the form and context in which the competent person’s findings are presented have not been materially modified from the original releases.
Technical and Scientific InformationThe technical and scientific information contained in this document relating to Wafi-Golpu and Lihir was reviewed and approved by Craig Jones, Newcrest’s Chief Operating Officer Papua New Guinea, FAusIMM and a Qualified Personas defined in NI 43-101.
The technical and scientific information contained in this document relating to Cadia was reviewed and approved by Philip Stephenson, Newcrest’s Chief Operating Officer Australia and Americas, FAusIMM and a Qualified Person asdefined in NI 43-101.
3
Newcrest Mining Limited
1H FY21 Key achievements Safety &
sustainability
Our growth story
Financial results & shareholder returns
Lihir optimisation
Summary
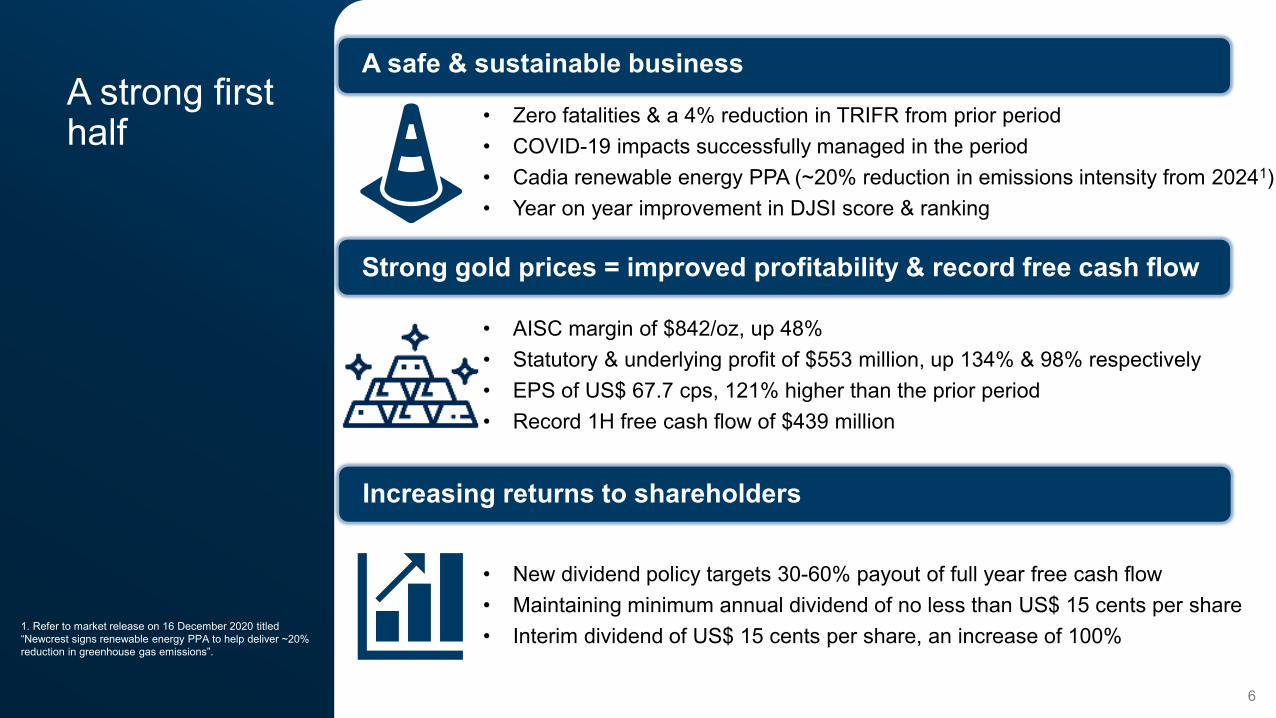
A strong first half
6
A safe & sustainable business
Strong gold prices = improved profitability & record free cash flow
• Zero fatalities & a 4% reduction in TRIFR from prior period• COVID-19 impacts successfully managed in the period• Cadia renewable energy PPA (~20% reduction in emissions intensity from 20241)• Year on year improvement in DJSI score & ranking
• AISC margin of $842/oz, up 48%• Statutory & underlying profit of $553 million, up 134% & 98% respectively• EPS of US$ 67.7 cps, 121% higher than the prior period• Record 1H free cash flow of $439 million
Increasing returns to shareholders
• New dividend policy targets 30-60% payout of full year free cash flow• Maintaining minimum annual dividend of no less than US$ 15 cents per share• Interim dividend of US$ 15 cents per share, an increase of 100%1. Refer to market release on 16 December 2020 titled
“Newcrest signs renewable energy PPA to help deliver ~20% reduction in greenhouse gas emissions”.
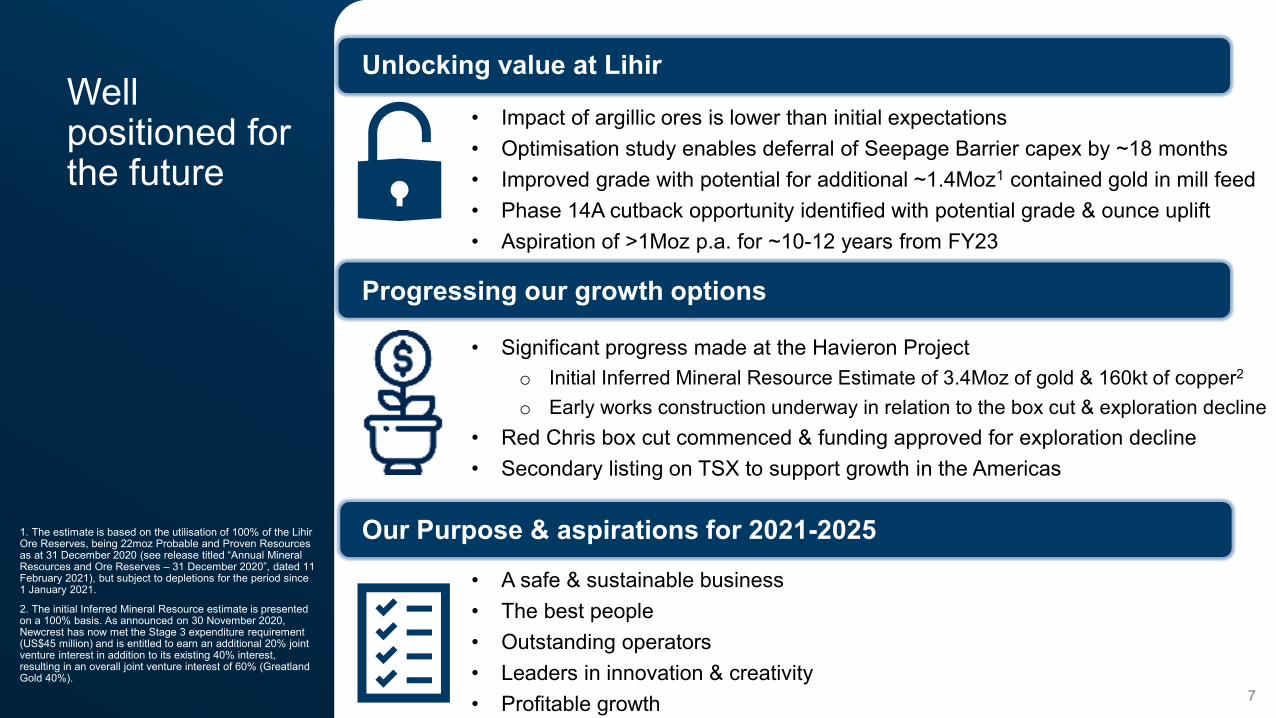
Well positioned for the future
7
Unlocking value at Lihir
Progressing our growth options
• Impact of argillic ores is lower than initial expectations• Optimisation study enables deferral of Seepage Barrier capex by ~18 months• Improved grade with potential for additional ~1.4Moz1 contained gold in mill feed• Phase 14A cutback opportunity identified with potential grade & ounce uplift• Aspiration of >1Moz p.a. for ~10-12 years from FY23
• Significant progress made at the Havieron Projecto Initial Inferred Mineral Resource Estimate of 3.4Moz of gold & 160kt of copper2
o Early works construction underway in relation to the box cut & exploration decline• Red Chris box cut commenced & funding approved for exploration decline• Secondary listing on TSX to support growth in the Americas
Our Purpose & aspirations for 2021-2025
• A safe & sustainable business• The best people• Outstanding operators• Leaders in innovation & creativity• Profitable growth
1. The estimate is based on the utilisation of 100% of the Lihir Ore Reserves, being 22moz Probable and Proven Resources as at 31 December 2020 (see release titled “Annual Mineral Resources and Ore Reserves – 31 December 2020”, dated 11 February 2021), but subject to depletions for the period since 1 January 2021.
2. The initial Inferred Mineral Resource estimate is presented on a 100% basis. As announced on 30 November 2020, Newcrest has now met the Stage 3 expenditure requirement (US$45 million) and is entitled to earn an additional 20% joint venture interest in addition to its existing 40% interest, resulting in an overall joint venture interest of 60% (Greatland Gold 40%).
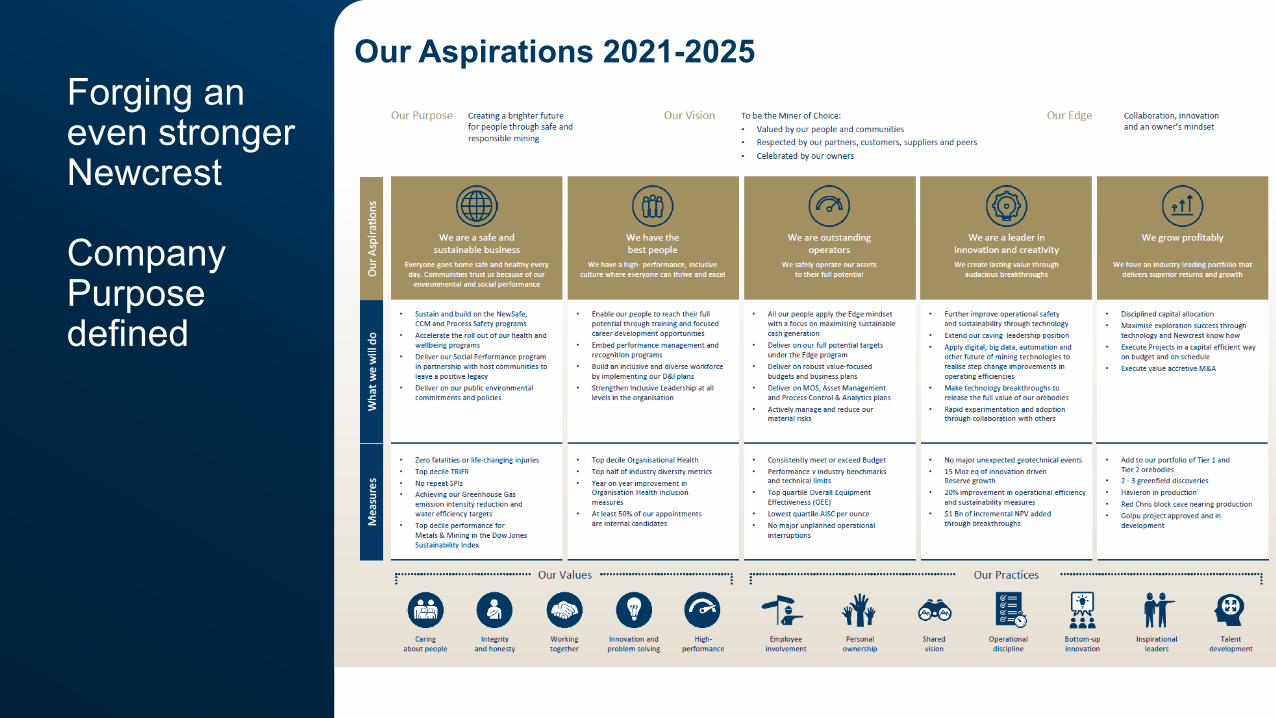
Forging an even stronger Newcrest
Company Purpose defined
Our Aspirations 2021-2025
Mea
sure
s
1H FY21 Key achievements Safety &
sustainability
Our growth story
Financial results & shareholder returns
Lihir optimisation
Summary
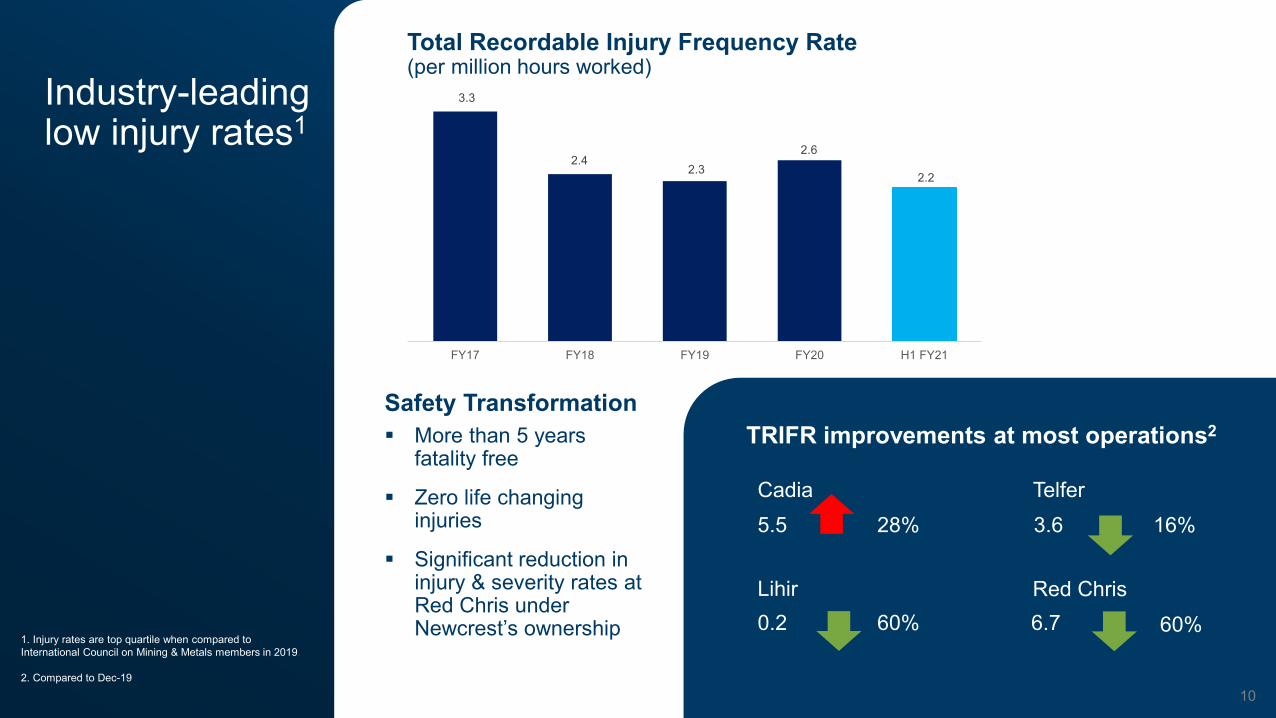
Industry-leading low injury rates1
Safety Transformation More than 5 years
fatality free
Zero life changing injuries
Significant reduction in injury & severity rates at Red Chris under Newcrest’s ownership
TRIFR improvements at most operations2
Cadia
Lihir
Telfer5.5 28%
0.2 60%
3.6 16%
1. Injury rates are top quartile when compared to International Council on Mining & Metals members in 2019.
2. Compared to Dec-19
Total Recordable Injury Frequency Rate (per million hours worked)
Red Chris6.7 60%
10
3.3
2.4 2.3
2.6
2.2
FY17 FY18 FY19 FY20 H1 FY21
11
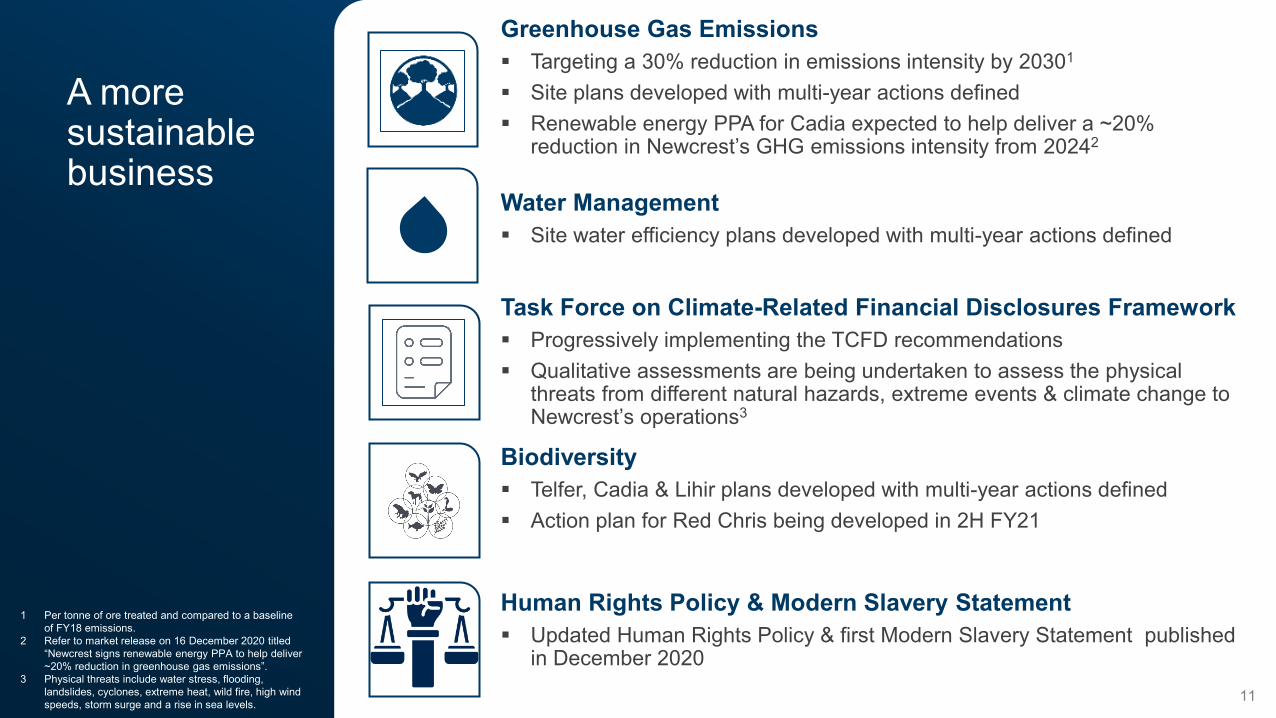
Greenhouse Gas Emissions Targeting a 30% reduction in emissions intensity by 20301
Site plans developed with multi-year actions defined Renewable energy PPA for Cadia expected to help deliver a ~20%
reduction in Newcrest’s GHG emissions intensity from 20242
Water Management Site water efficiency plans developed with multi-year actions defined
Task Force on Climate-Related Financial Disclosures Framework Progressively implementing the TCFD recommendations Qualitative assessments are being undertaken to assess the physical
threats from different natural hazards, extreme events & climate change to Newcrest’s operations3
Biodiversity Telfer, Cadia & Lihir plans developed with multi-year actions defined Action plan for Red Chris being developed in 2H FY21
Human Rights Policy & Modern Slavery Statement Updated Human Rights Policy & first Modern Slavery Statement published
in December 2020
1 Per tonne of ore treated and compared to a baseline of FY18 emissions.
2 Refer to market release on 16 December 2020 titled “Newcrest signs renewable energy PPA to help deliver ~20% reduction in greenhouse gas emissions”.
3 Physical threats include water stress, flooding, landslides, cyclones, extreme heat, wild fire, high wind speeds, storm surge and a rise in sea levels.
A more sustainable business
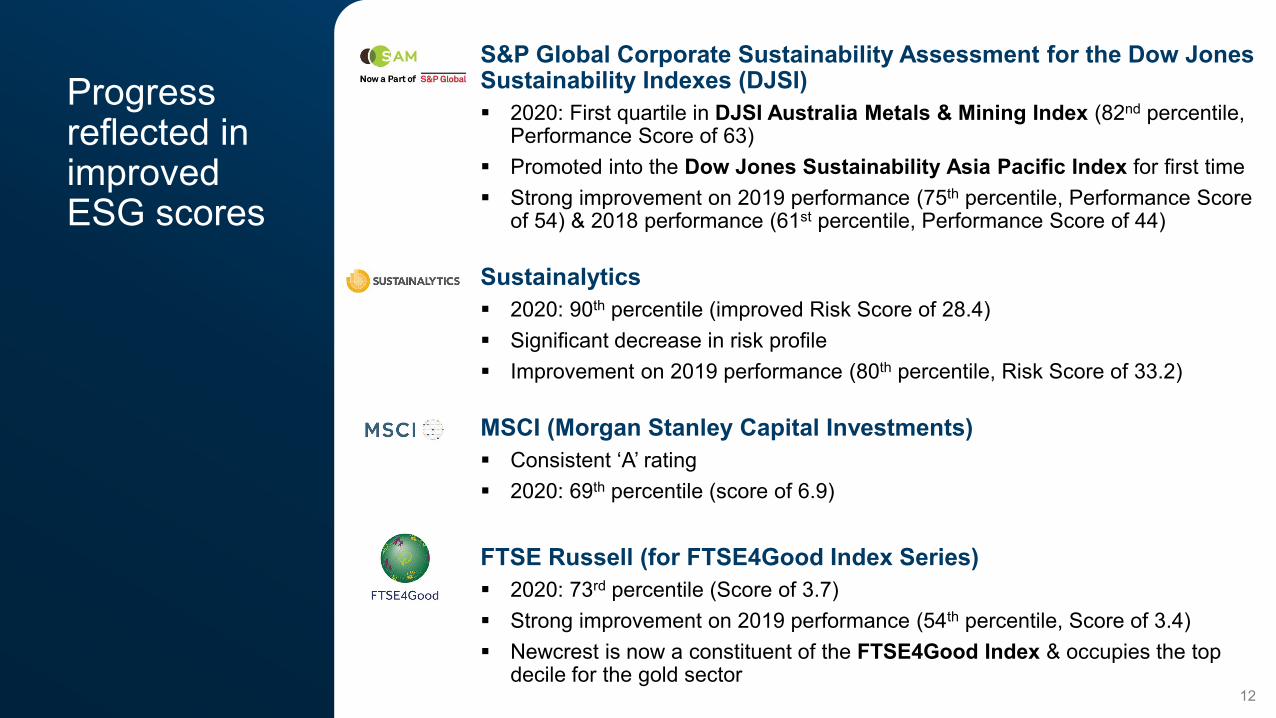
Progress reflected in improved ESG scores
12
S&P Global Corporate Sustainability Assessment for the Dow Jones Sustainability Indexes (DJSI) 2020: First quartile in DJSI Australia Metals & Mining Index (82nd percentile,
Performance Score of 63) Promoted into the Dow Jones Sustainability Asia Pacific Index for first time Strong improvement on 2019 performance (75th percentile, Performance Score
of 54) & 2018 performance (61st percentile, Performance Score of 44)
Sustainalytics 2020: 90th percentile (improved Risk Score of 28.4) Significant decrease in risk profile Improvement on 2019 performance (80th percentile, Risk Score of 33.2)
MSCI (Morgan Stanley Capital Investments) Consistent ‘A’ rating 2020: 69th percentile (score of 6.9)
FTSE Russell (for FTSE4Good Index Series) 2020: 73rd percentile (Score of 3.7) Strong improvement on 2019 performance (54th percentile, Score of 3.4) Newcrest is now a constituent of the FTSE4Good Index & occupies the top
decile for the gold sector
1H FY21 Key achievements Safety &
sustainability
Our growth story
Financial results & shareholder returns
Lihir optimisation
Summary
14
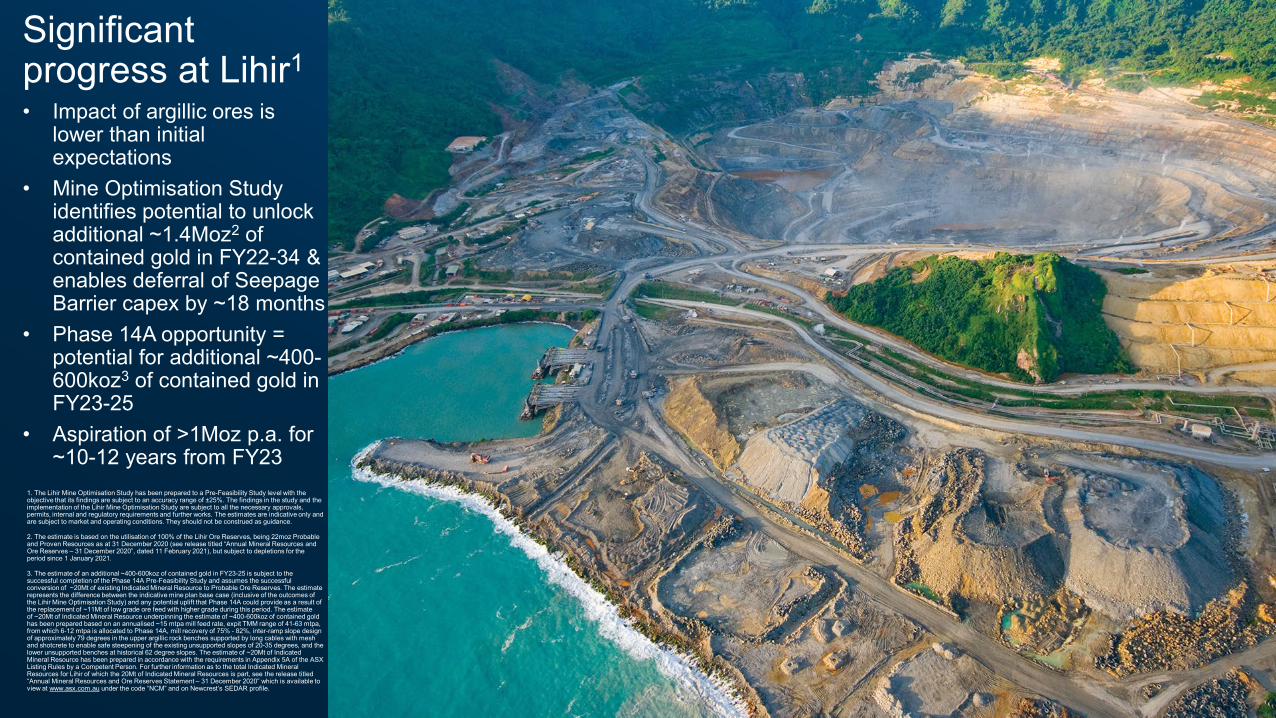
Significant progress at Lihir1
• Impact of argillic ores is lower than initial expectations
• Mine Optimisation Study identifies potential to unlock additional ~1.4Moz2 of contained gold in FY22-34 & enables deferral of Seepage Barrier capex by ~18 months
• Phase 14A opportunity = potential for additional ~400-600koz3 of contained gold in FY23-25
• Aspiration of >1Moz p.a. for ~10-12 years from FY23
1. The Lihir Mine Optimisation Study has been prepared to a Pre-Feasibility Study level with the objective that its findings are subject to an accuracy range of ±25%. The findings in the study and the implementation of the Lihir Mine Optimisation Study are subject to all the necessary approvals, permits, internal and regulatory requirements and further works. The estimates are indicative only and are subject to market and operating conditions. They should not be construed as guidance.
2. The estimate is based on the utilisation of 100% of the Lihir Ore Reserves, being 22moz Probable and Proven Resources as at 31 December 2020 (see release titled “Annual Mineral Resources and Ore Reserves – 31 December 2020”, dated 11 February 2021), but subject to depletions for the period since 1 January 2021.
3. The estimate of an additional ~400-600koz of contained gold in FY23-25 is subject to the successful completion of the Phase 14A Pre-Feasibility Study and assumes the successful conversion of ~20Mt of existing Indicated Mineral Resource to Probable Ore Reserves. The estimate represents the difference between the indicative mine plan base case (inclusive of the outcomes of the Lihir Mine Optimisation Study) and any potential uplift that Phase 14A could provide as a result of the replacement of ~11Mt of low grade ore feed with higher grade during this period. The estimate of ~20Mt of Indicated Mineral Resource underpinning the estimate of ~400-600koz of contained gold has been prepared based on an annualised ~15 mtpa mill feed rate, expit TMM range of 41-63 mtpa, from which 6-12 mtpa is allocated to Phase 14A, mill recovery of 75% - 82%, inter-ramp slope design of approximately 79 degrees in the upper argillic rock benches supported by long cables with mesh and shotcrete to enable safe steepening of the existing unsupported slopes of 20-35 degrees, and the lower unsupported benches at historical 62 degree slopes. The estimate of ~20Mt of Indicated Mineral Resource has been prepared in accordance with the requirements in Appendix 5A of the ASX Listing Rules by a Competent Person. For further information as to the total Indicated Mineral Resources for Lihir of which the 20Mt of Indicated Mineral Resources is part, see the release titled “Annual Mineral Resources and Ore Reserves Statement – 31 December 2020” which is available to view at www.asx.com.au under the code “NCM” and on Newcrest’s SEDAR profile.
15
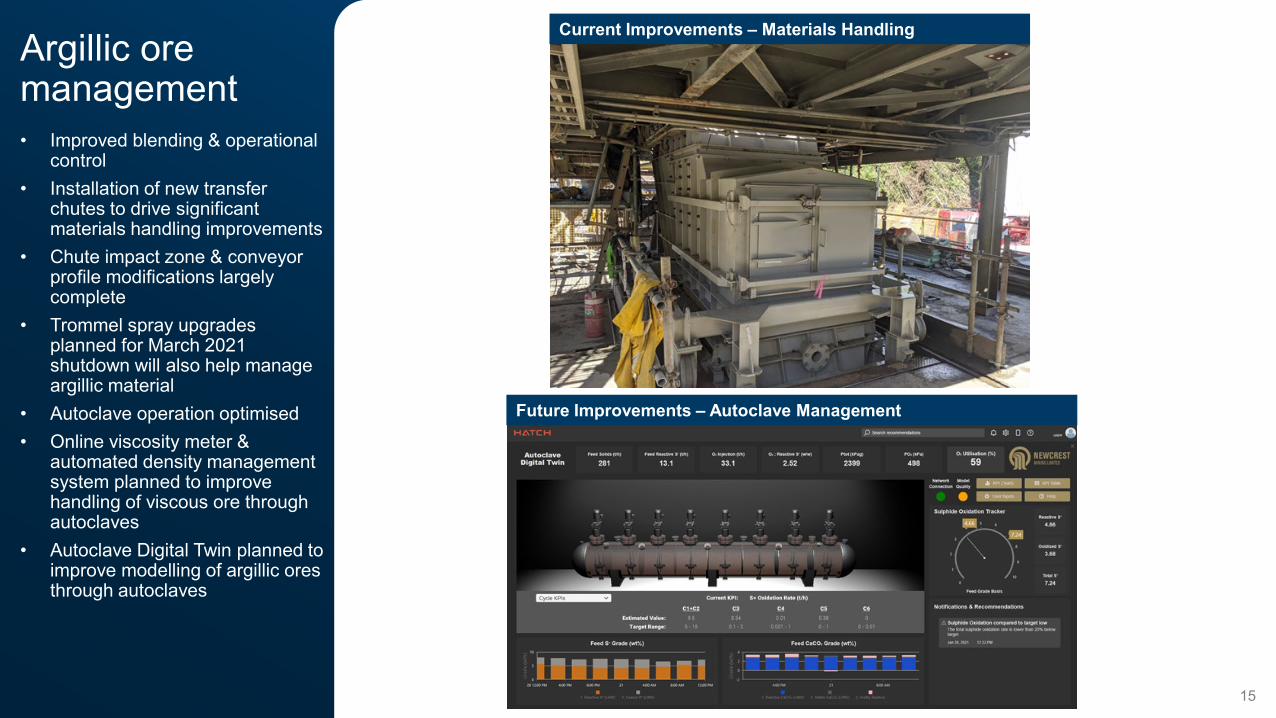
Current Improvements – Materials Handling
Future Improvements – Autoclave Management
Argillic ore management• Improved blending & operational
control• Installation of new transfer
chutes to drive significant materials handling improvements
• Chute impact zone & conveyor profile modifications largely complete
• Trommel spray upgrades planned for March 2021 shutdown will also help manage argillic material
• Autoclave operation optimised• Online viscosity meter &
automated density management system planned to improve handling of viscous ore through autoclaves
• Autoclave Digital Twin planned to improve modelling of argillic ores through autoclaves
16
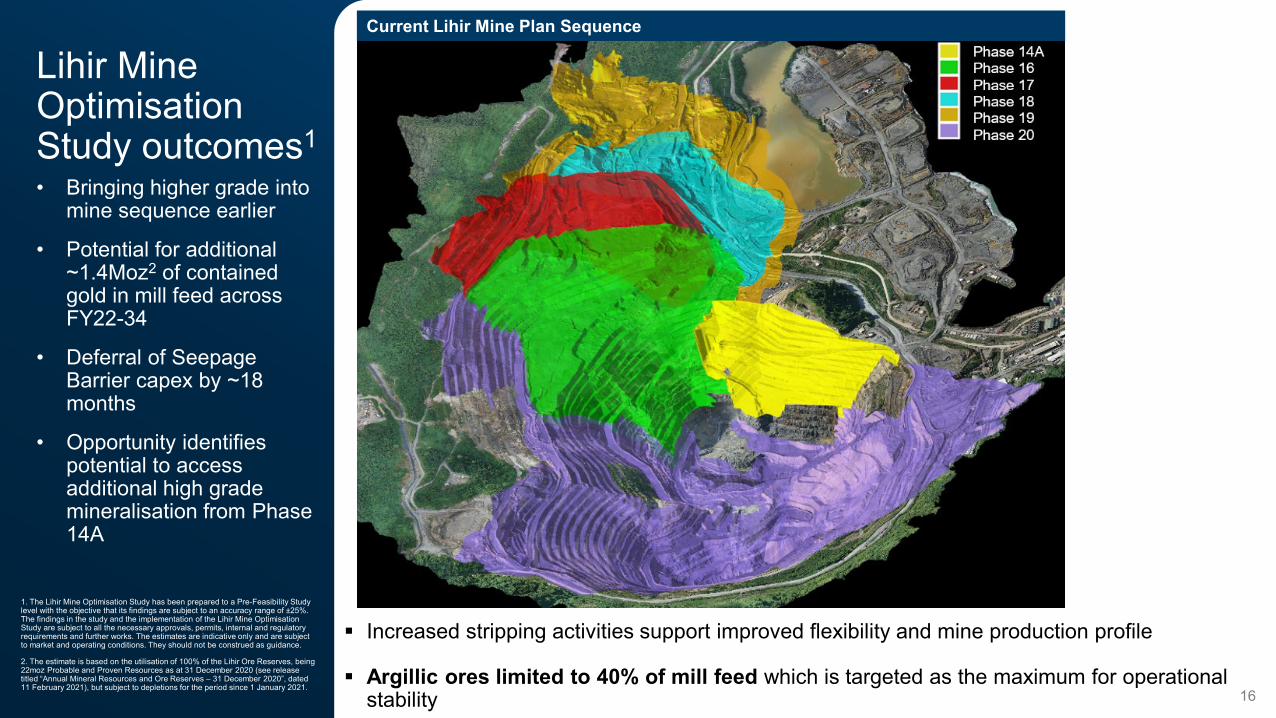
Lihir Mine Optimisation Study outcomes1
• Bringing higher grade into mine sequence earlier
• Potential for additional ~1.4Moz2 of contained gold in mill feed across FY22-34
• Deferral of Seepage Barrier capex by ~18 months
• Opportunity identifies potential to access additional high grade mineralisation from Phase 14A
1. The Lihir Mine Optimisation Study has been prepared to a Pre-Feasibility Study level with the objective that its findings are subject to an accuracy range of ±25%. The findings in the study and the implementation of the Lihir Mine Optimisation Study are subject to all the necessary approvals, permits, internal and regulatory requirements and further works. The estimates are indicative only and are subject to market and operating conditions. They should not be construed as guidance.
2. The estimate is based on the utilisation of 100% of the Lihir Ore Reserves, being 22moz Probable and Proven Resources as at 31 December 2020 (see release titled “Annual Mineral Resources and Ore Reserves – 31 December 2020”, dated 11 February 2021), but subject to depletions for the period since 1 January 2021.
Current Lihir Mine Plan Sequence
Increased stripping activities support improved flexibility and mine production profile
Argillic ores limited to 40% of mill feed which is targeted as the maximum for operational stability
17
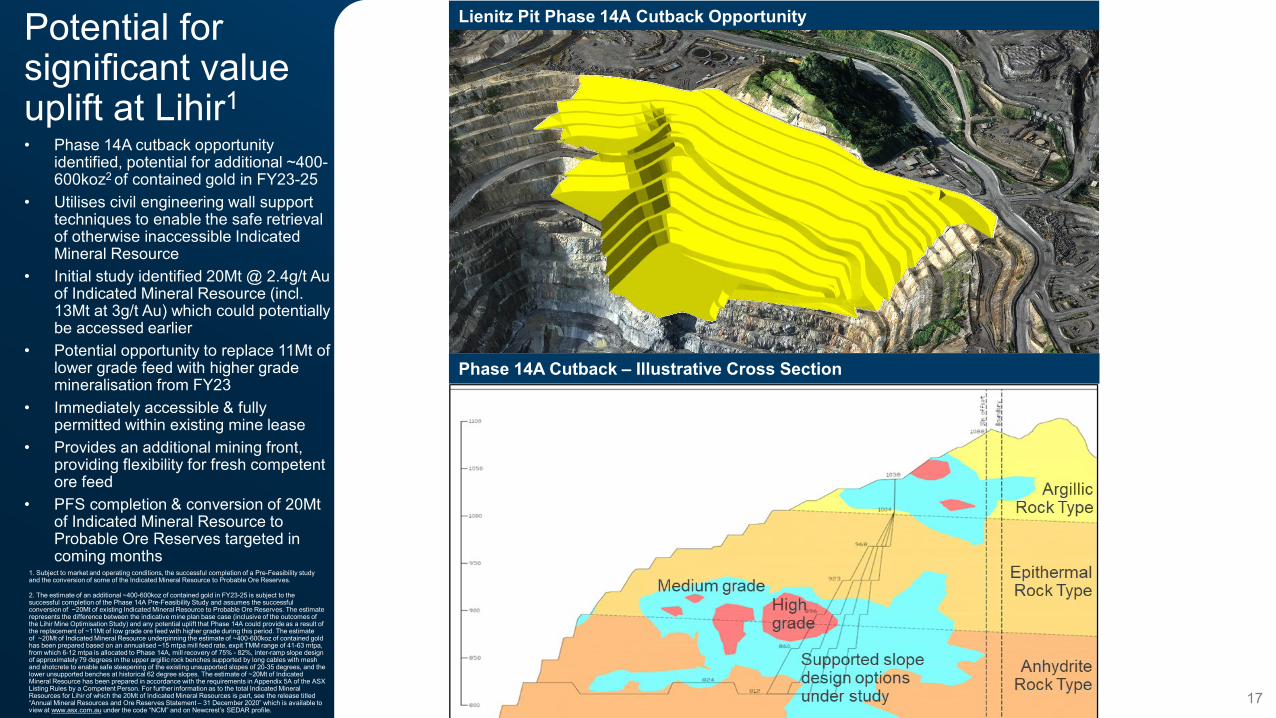
Potential for significant value uplift at Lihir1• Phase 14A cutback opportunity
identified, potential for additional ~400-600koz2 of contained gold in FY23-25
• Utilises civil engineering wall support techniques to enable the safe retrieval of otherwise inaccessible Indicated Mineral Resource
• Initial study identified 20Mt @ 2.4g/t Au of Indicated Mineral Resource (incl. 13Mt at 3g/t Au) which could potentially be accessed earlier
• Potential opportunity to replace 11Mt of lower grade feed with higher grade mineralisation from FY23
• Immediately accessible & fully permitted within existing mine lease
• Provides an additional mining front, providing flexibility for fresh competent ore feed
• PFS completion & conversion of 20Mt of Indicated Mineral Resource to Probable Ore Reserves targeted in coming months
1. Subject to market and operating conditions, the successful completion of a Pre-Feasibility study and the conversion of some of the Indicated Mineral Resource to Probable Ore Reserves.
2. The estimate of an additional ~400-600koz of contained gold in FY23-25 is subject to the successful completion of the Phase 14A Pre-Feasibility Study and assumes the successful conversion of ~20Mt of existing Indicated Mineral Resource to Probable Ore Reserves. The estimate represents the difference between the indicative mine plan base case (inclusive of the outcomes of the Lihir Mine Optimisation Study) and any potential uplift that Phase 14A could provide as a result of the replacement of ~11Mt of low grade ore feed with higher grade during this period. The estimate of ~20Mt of Indicated Mineral Resource underpinning the estimate of ~400-600koz of contained gold has been prepared based on an annualised ~15 mtpa mill feed rate, expit TMM range of 41-63 mtpa, from which 6-12 mtpa is allocated to Phase 14A, mill recovery of 75% - 82%, inter-ramp slope design of approximately 79 degrees in the upper argillic rock benches supported by long cables with mesh and shotcrete to enable safe steepening of the existing unsupported slopes of 20-35 degrees, and the lower unsupported benches at historical 62 degree slopes. The estimate of ~20Mt of Indicated Mineral Resource has been prepared in accordance with the requirements in Appendix 5A of the ASX Listing Rules by a Competent Person. For further information as to the total Indicated Mineral Resources for Lihir of which the 20Mt of Indicated Mineral Resources is part, see the release titled “Annual Mineral Resources and Ore Reserves Statement – 31 December 2020” which is available to view at www.asx.com.au under the code “NCM” and on Newcrest’s SEDAR profile.
Lienitz Pit Phase 14A Cutback Opportunity
Phase 14A Cutback – Illustrative Cross Section
18
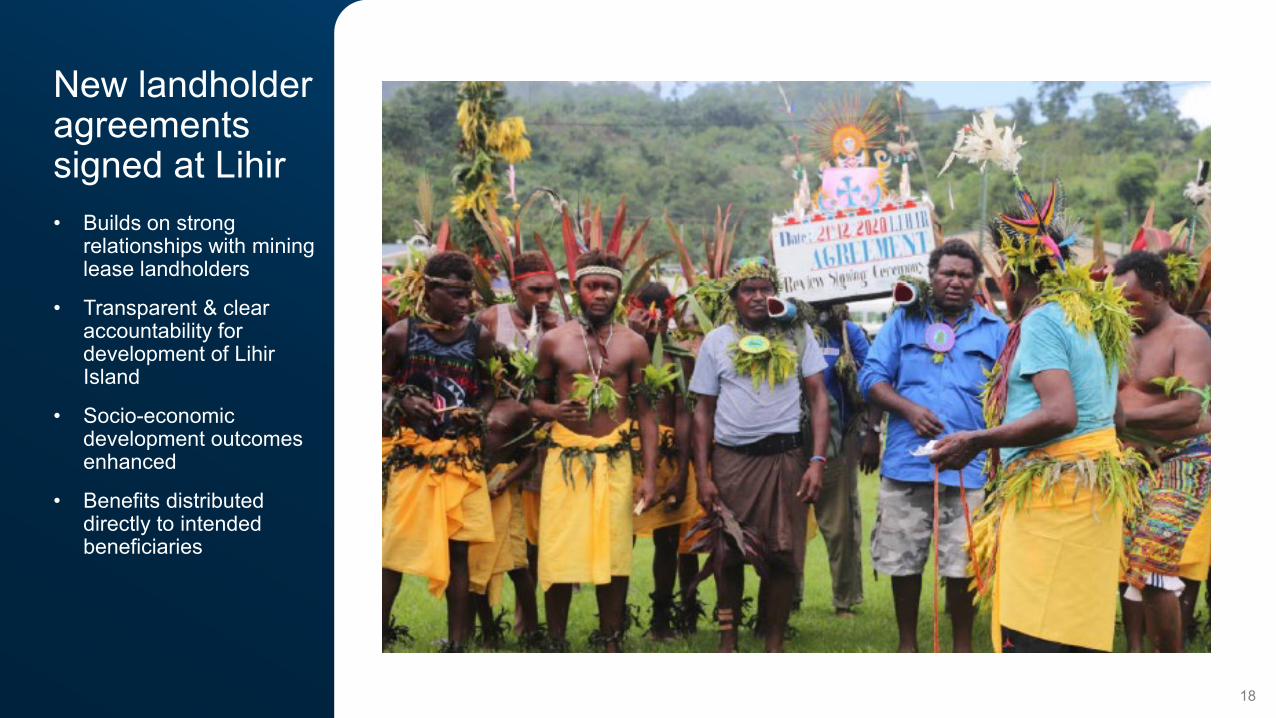
New landholder agreements signed at Lihir• Builds on strong
relationships with mining lease landholders
• Transparent & clear accountability for development of Lihir Island
• Socio-economic development outcomes enhanced
• Benefits distributed directly to intended beneficiaries
1H FY21 Key achievements Safety &
sustainability
Our growth story
Financial results & shareholder returns
Lihir optimisation
Summary
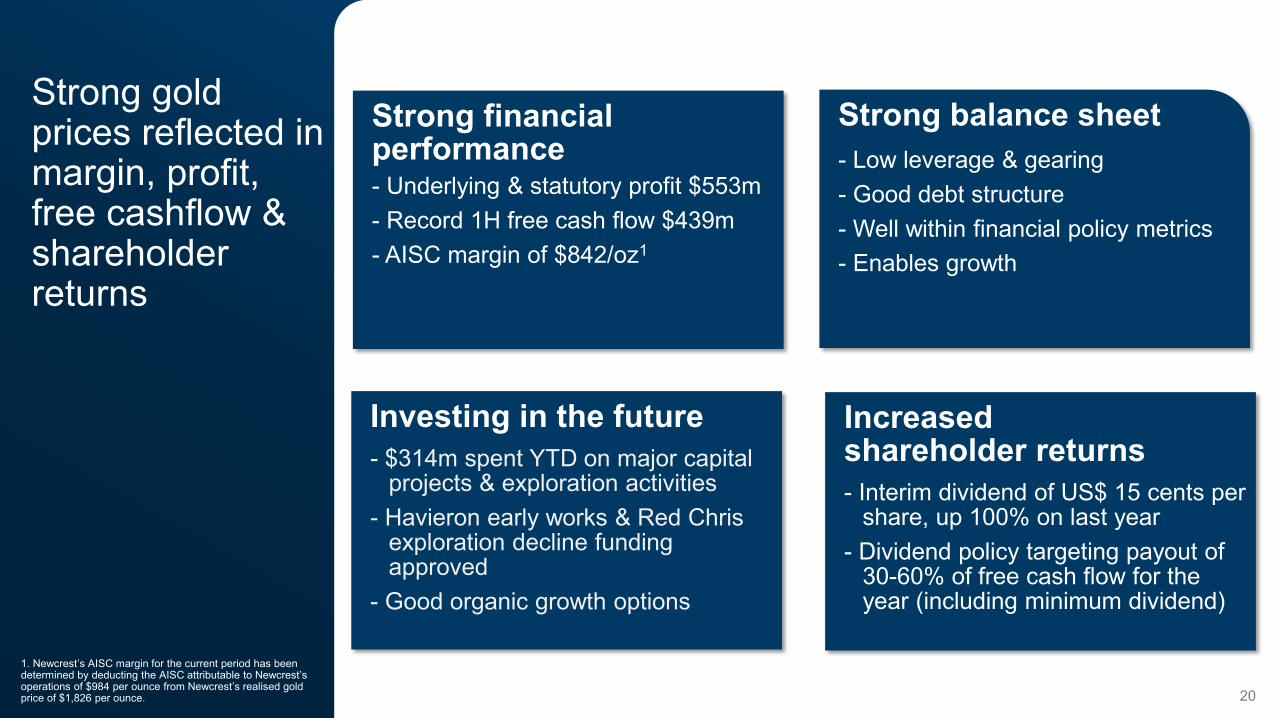
Strong gold prices reflected in margin, profit, free cashflow & shareholder returns
Strong financial performance - Underlying & statutory profit $553m- Record 1H free cash flow $439m- AISC margin of $842/oz1
Strong balance sheet- Low leverage & gearing- Good debt structure - Well within financial policy metrics- Enables growth
Investing in the future- $314m spent YTD on major capital
projects & exploration activities- Havieron early works & Red Chris
exploration decline funding approved
- Good organic growth options
Increased shareholder returns- Interim dividend of US$ 15 cents per
share, up 100% on last year- Dividend policy targeting payout of
30-60% of free cash flow for the year (including minimum dividend)
20
1. Newcrest’s AISC margin for the current period has been determined by deducting the AISC attributable to Newcrest’s operations of $984 per ounce from Newcrest’s realised gold price of $1,826 per ounce.

1. Cash investment in M&A activity in FY20 comprises the payment for the acquisition of Red Chris (70% ownership) of $769 million, the acquisition of Fruta del Norte finance facilities of $460 million, further investments in Lundin Gold of $79 million, net proceeds from divestment of Gosowong of $20 million and payment of $3 million for an interest in Antipa Minerals Ltd
$3.5
Bill
ion
21
Strong record of free cash flow generation• ~$35 million received
in 1H from Fruta del Norte finance facilities
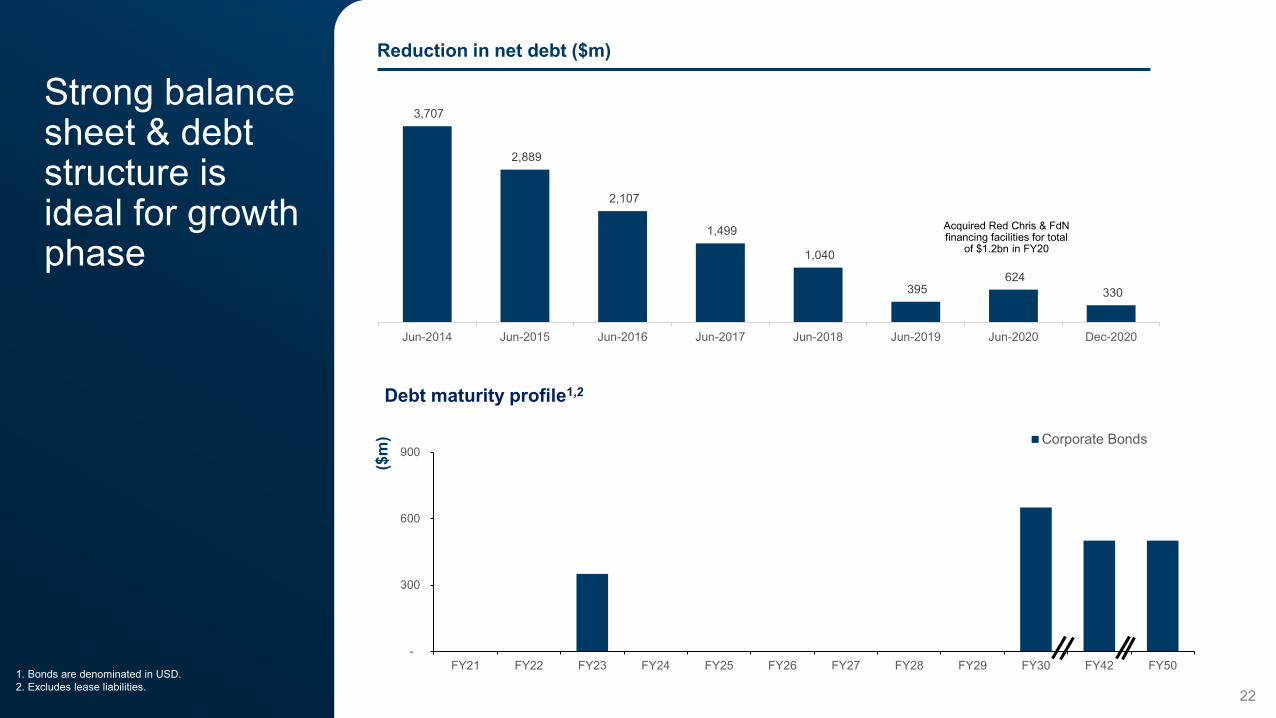
Strong balance sheet & debt structure is ideal for growth phase
Debt maturity profile1,2
1. Bonds are denominated in USD.2. Excludes lease liabilities.
Reduction in net debt ($m)
Acquired Red Chris & FdN financing facilities for total
of $1.2bn in FY20
22
-
300
600
900
FY21 FY22 FY23 FY24 FY25 FY26 FY27 FY28 FY29 FY30 FY42 FY50
Corporate Bonds
($m
)
3,707
2,889
2,107
1,499
1,040
395 624
330
Jun-2014 Jun-2015 Jun-2016 Jun-2017 Jun-2018 Jun-2019 Jun-2020 Dec-2020
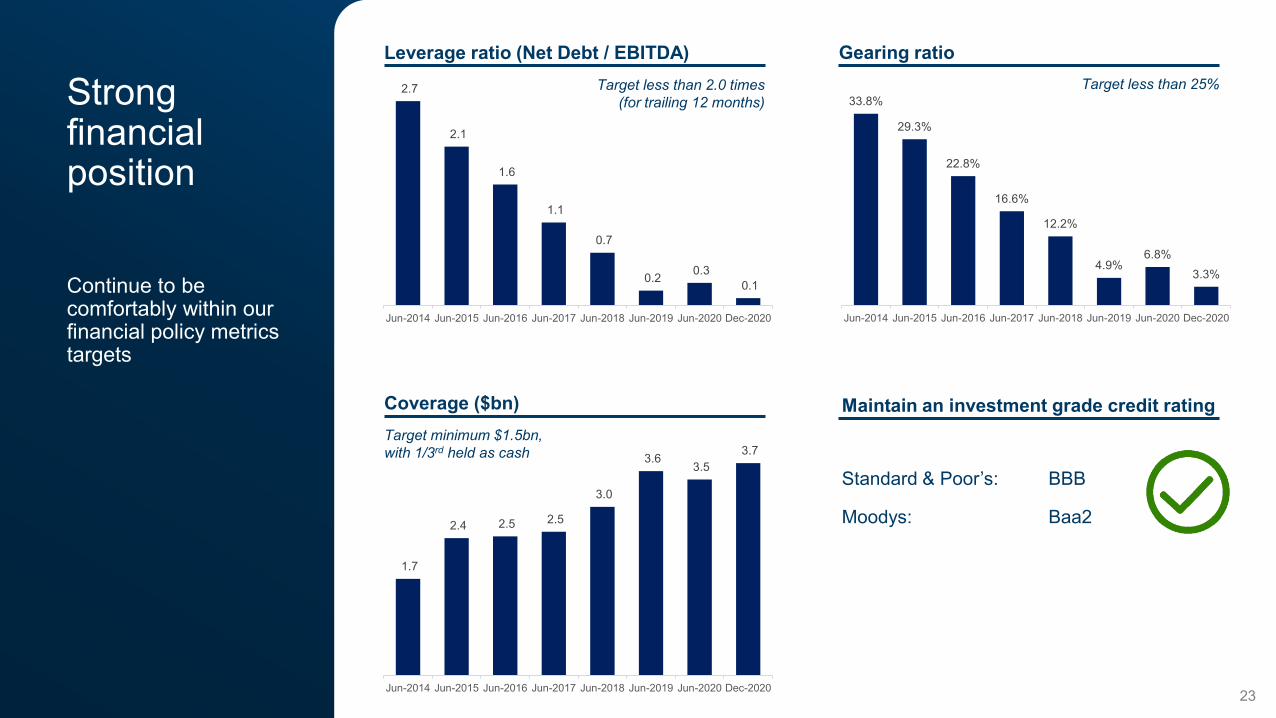
Strong financial position
Continue to be comfortably within our financial policy metrics targets
Coverage ($bn)
Gearing ratioLeverage ratio (Net Debt / EBITDA)
Maintain an investment grade credit rating
Standard & Poor’s: BBB
Moodys: Baa2
Target less than 2.0 times(for trailing 12 months)
Target less than 25%
Target minimum $1.5bn,with 1/3rd held as cash
23
2.7
2.1
1.6
1.1
0.7
0.2 0.3 0.1
Jun-2014 Jun-2015 Jun-2016 Jun-2017 Jun-2018 Jun-2019 Jun-2020 Dec-2020
33.8%
29.3%
22.8%
16.6%
12.2%
4.9%6.8%
3.3%
Jun-2014 Jun-2015 Jun-2016 Jun-2017 Jun-2018 Jun-2019 Jun-2020 Dec-2020
1.7
2.4 2.5 2.5
3.0
3.6 3.5
3.7
Jun-2014 Jun-2015 Jun-2016 Jun-2017 Jun-2018 Jun-2019 Jun-2020 Dec-2020
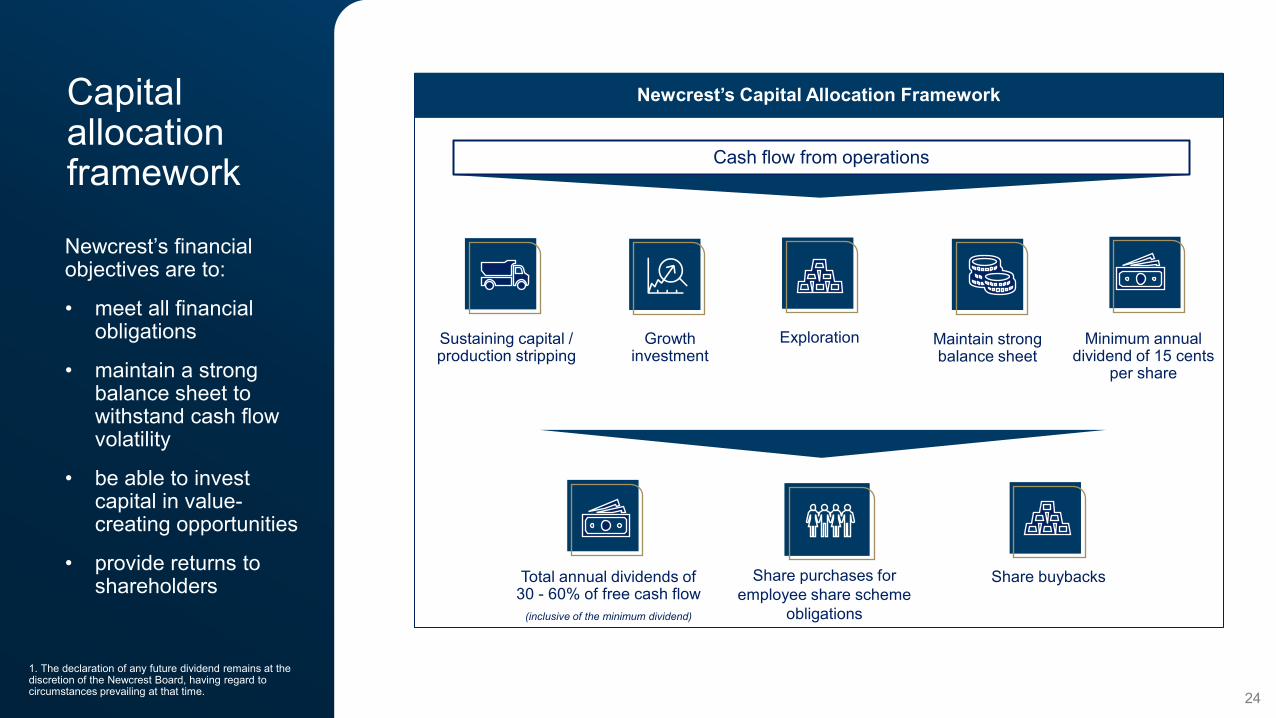
Capital allocation framework
Newcrest’s financial objectives are to:
• meet all financial obligations
• maintain a strong balance sheet to withstand cash flow volatility
• be able to invest capital in value-creating opportunities
• provide returns to shareholders
1. The declaration of any future dividend remains at the discretion of the Newcrest Board, having regard to circumstances prevailing at that time. 24
Total annual dividends of 30 - 60% of free cash flow
(inclusive of the minimum dividend)
Newcrest’s Capital Allocation Framework
Sustaining capital / production stripping
Growth investment
Share buybacks
Minimum annual dividend of 15 cents
per share
Cash flow from operations
Share purchases foremployee share scheme
obligations
Exploration Maintain strong balance sheet
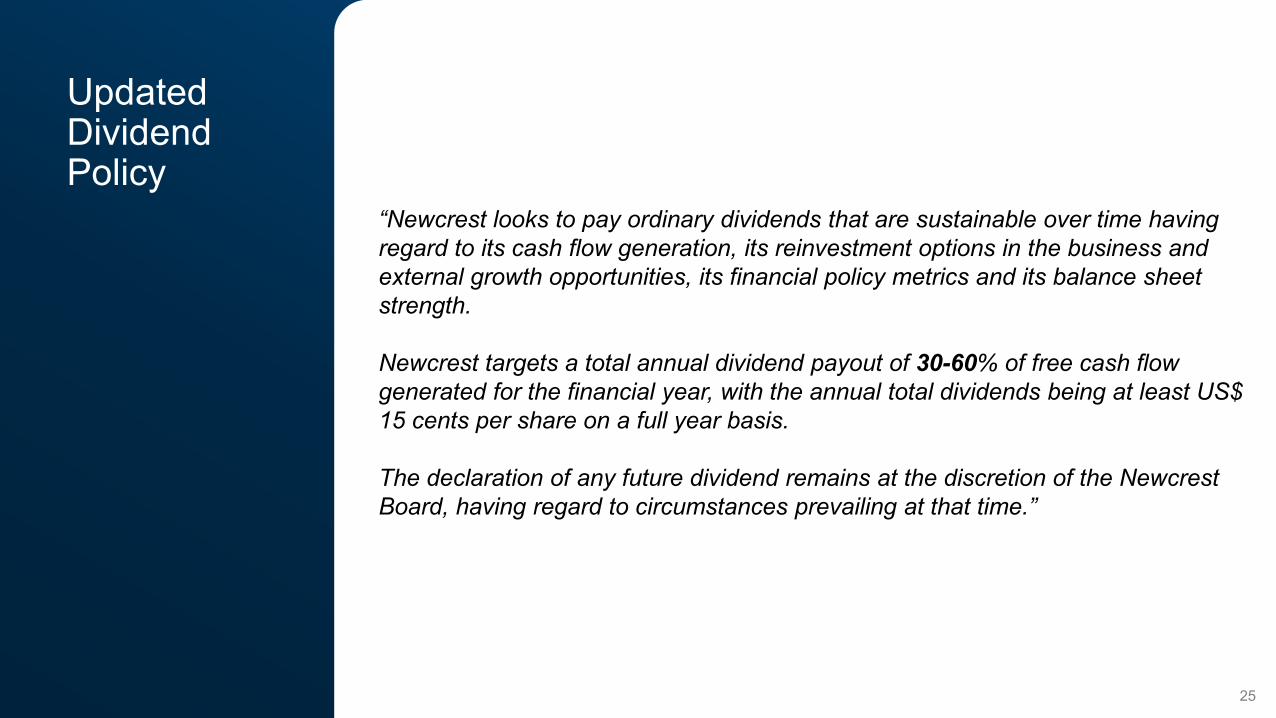
UpdatedDividend Policy
“Newcrest looks to pay ordinary dividends that are sustainable over time having regard to its cash flow generation, its reinvestment options in the business and external growth opportunities, its financial policy metrics and its balance sheet strength.
Newcrest targets a total annual dividend payout of 30-60% of free cash flow generated for the financial year, with the annual total dividends being at least US$ 15 cents per share on a full year basis.
The declaration of any future dividend remains at the discretion of the Newcrest Board, having regard to circumstances prevailing at that time.”
25
1. Dividends declared / determined in respect of each financial year
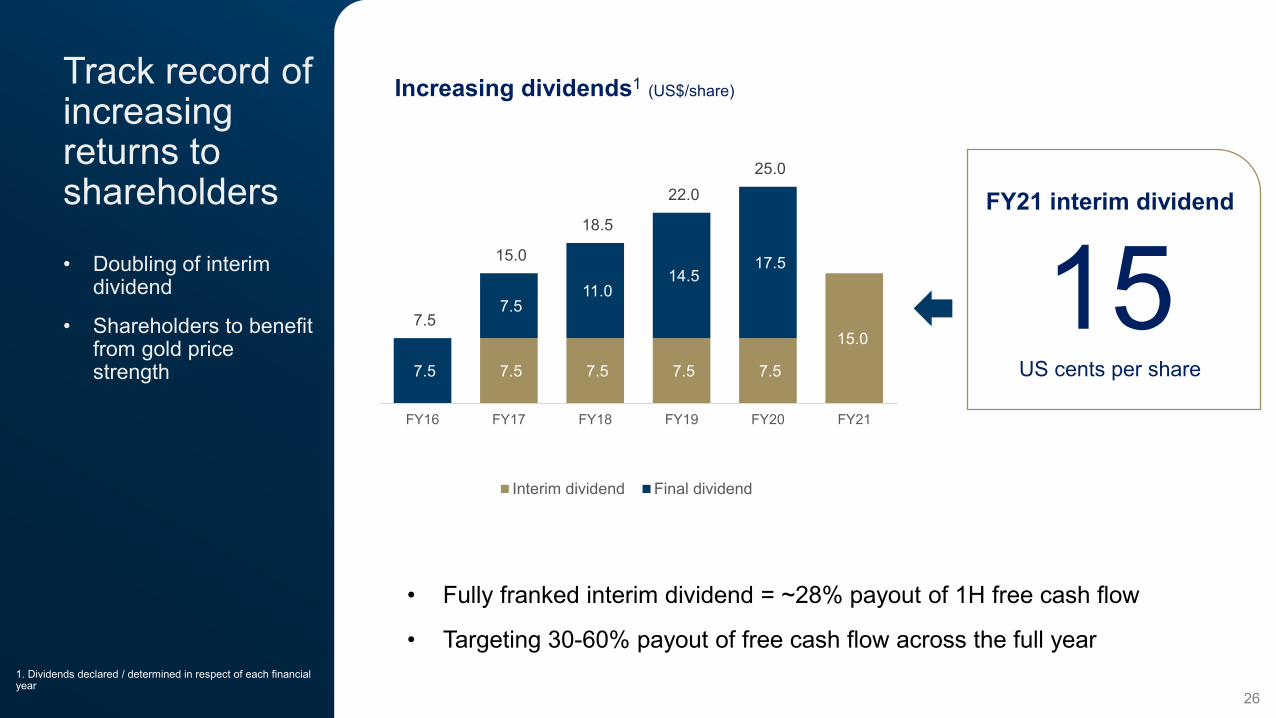
FY21 interim dividend
15US cents per share
Increasing dividends1 (US$/share)
-
7.5 7.5 7.5 7.5
15.0
7.5
7.5 11.0
14.5 17.5
7.5
15.0
18.5
22.0 25.0
FY16 FY17 FY18 FY19 FY20 FY21
Interim dividend Final dividend
• Fully franked interim dividend = ~28% payout of 1H free cash flow
• Targeting 30-60% payout of free cash flow across the full year
Track record of increasing returns to shareholders
• Doubling of interim dividend
• Shareholders to benefit from gold price strength
26
1H FY21 Key achievements Safety &
sustainability
Our growth story
Financial results & shareholder returns
Lihir optimisation
Summary
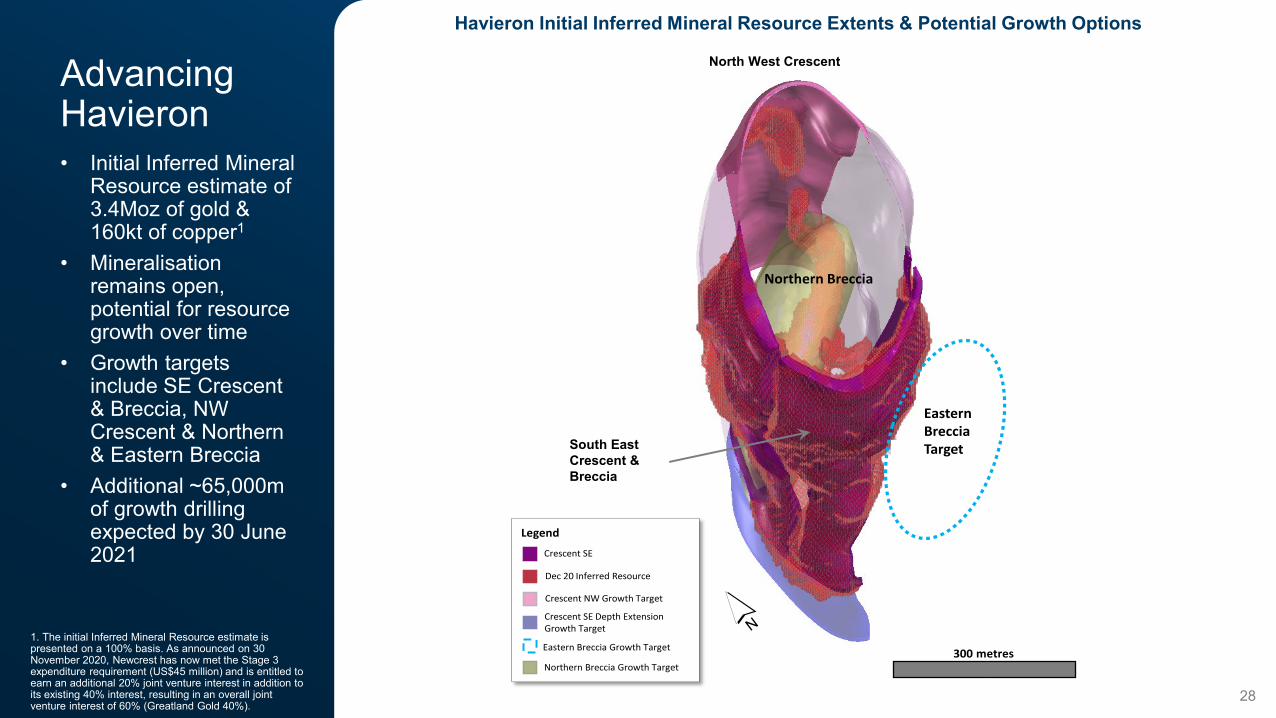
1. The initial Inferred Mineral Resource estimate is presented on a 100% basis. As announced on 30 November 2020, Newcrest has now met the Stage 3 expenditure requirement (US$45 million) and is entitled to earn an additional 20% joint venture interest in addition to its existing 40% interest, resulting in an overall joint venture interest of 60% (Greatland Gold 40%).
28
Advancing Havieron• Initial Inferred Mineral
Resource estimate of 3.4Moz of gold & 160kt of copper1
• Mineralisation remains open, potential for resource growth over time
• Growth targets include SE Crescent & Breccia, NW Crescent & Northern & Eastern Breccia
• Additional ~65,000m of growth drilling expected by 30 June 2021
Havieron Initial Inferred Mineral Resource Extents & Potential Growth Options
Crescent SE
Dec 20 Inferred Resource
Legend
Crescent NW Growth Target
Crescent SE and Breccia
Northern Breccia
300 metres
Crescent NW
Eastern BrecciaTarget
Crescent SE Depth Extension Growth Target
Eastern Breccia Growth Target
Northern Breccia Growth Target
South East Crescent &Breccia
North West Crescent
29
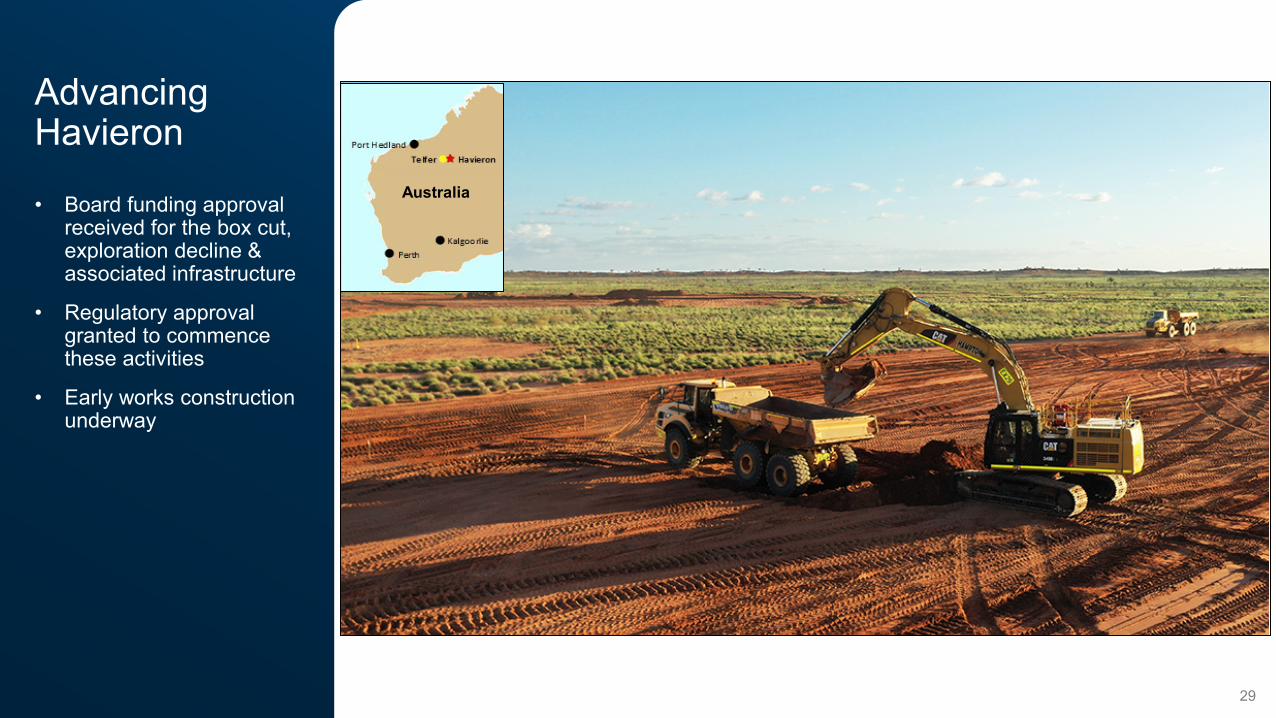
Advancing Havieron
• Board funding approval received for the box cut, exploration decline & associated infrastructure
• Regulatory approval granted to commence these activities
• Early works construction underway
Australia
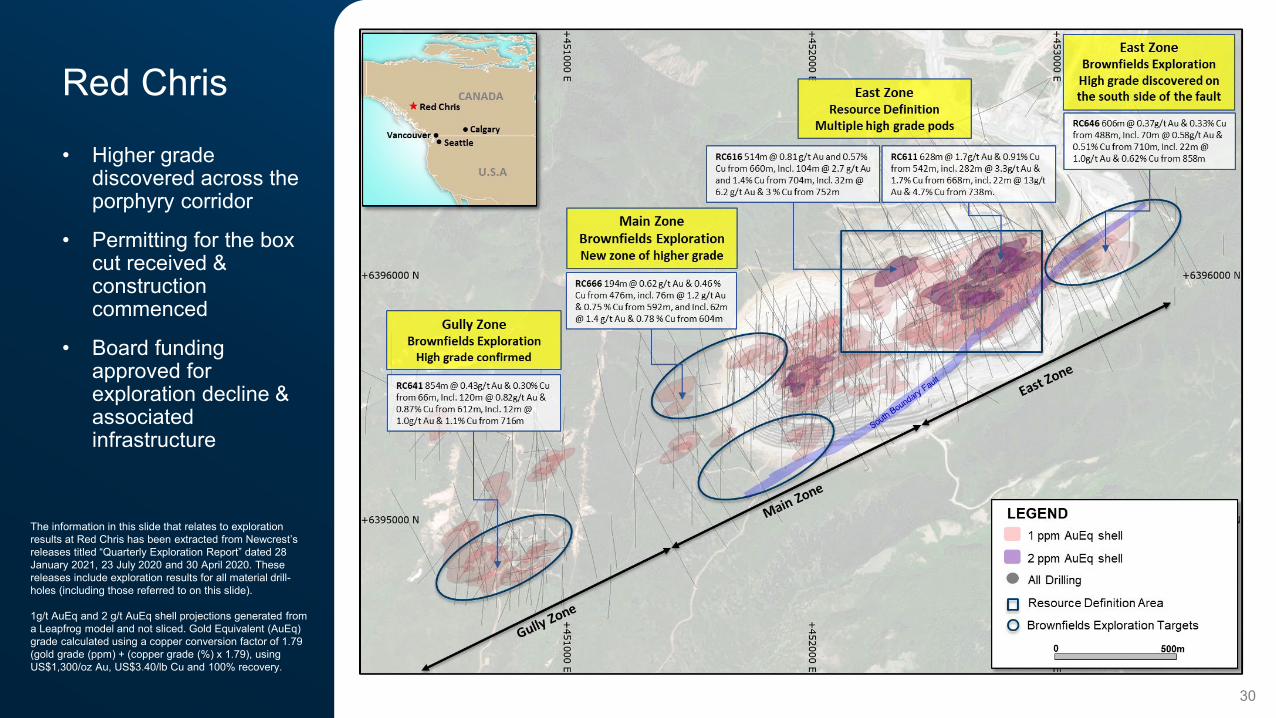
The information in this slide that relates to exploration results at Red Chris has been extracted from Newcrest’s releases titled “Quarterly Exploration Report” dated 28January 2021, 23 July 2020 and 30 April 2020. These releases include exploration results for all material drill-holes (including those referred to on this slide).
1g/t AuEq and 2 g/t AuEq shell projections generated from a Leapfrog model and not sliced. Gold Equivalent (AuEq) grade calculated using a copper conversion factor of 1.79 (gold grade (ppm) + (copper grade (%) x 1.79), using US$1,300/oz Au, US$3.40/lb Cu and 100% recovery.
30
Red Chris
• Higher grade discovered across the porphyry corridor
• Permitting for the box cut received & construction commenced
• Board funding approved for exploration decline & associated infrastructure
31
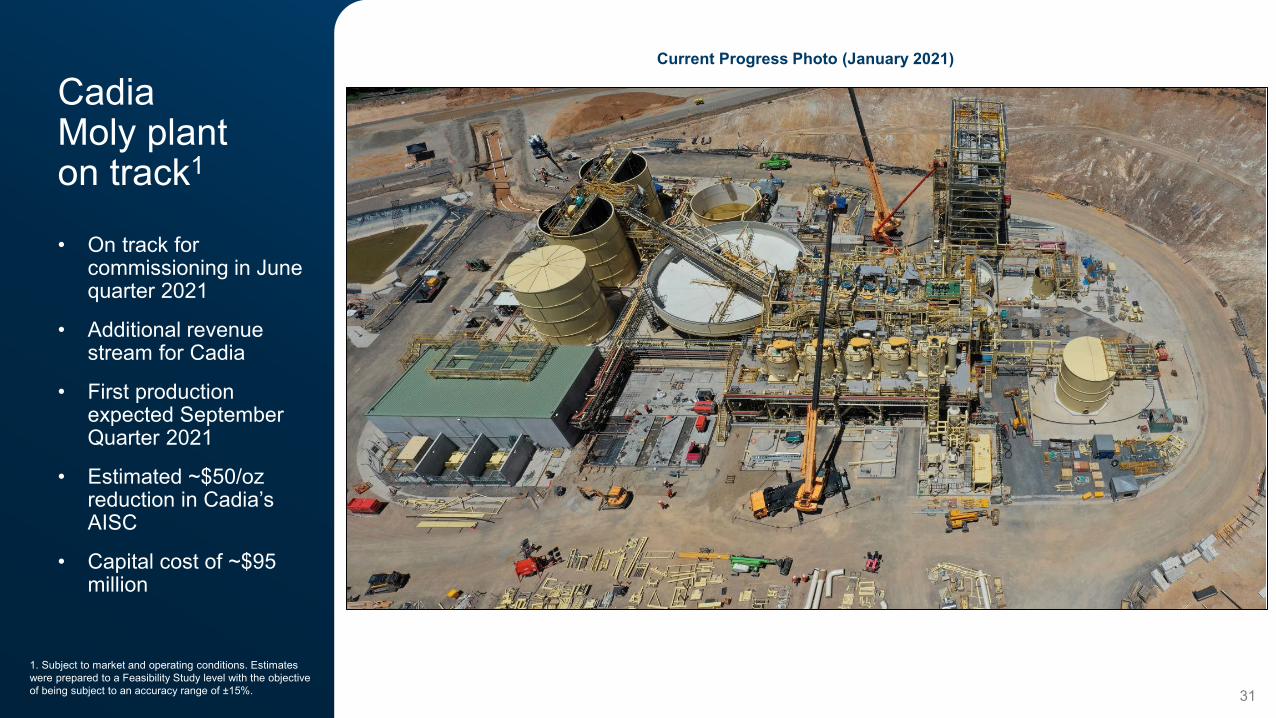
Cadia Moly plant on track1
• On track for commissioning in June quarter 2021
• Additional revenue stream for Cadia
• First production expected September Quarter 2021
• Estimated ~$50/oz reduction in Cadia’s AISC
• Capital cost of ~$95 million
1. Subject to market and operating conditions. Estimates were prepared to a Feasibility Study level with the objective of being subject to an accuracy range of ±15%.
Current Progress Photo (January 2021)
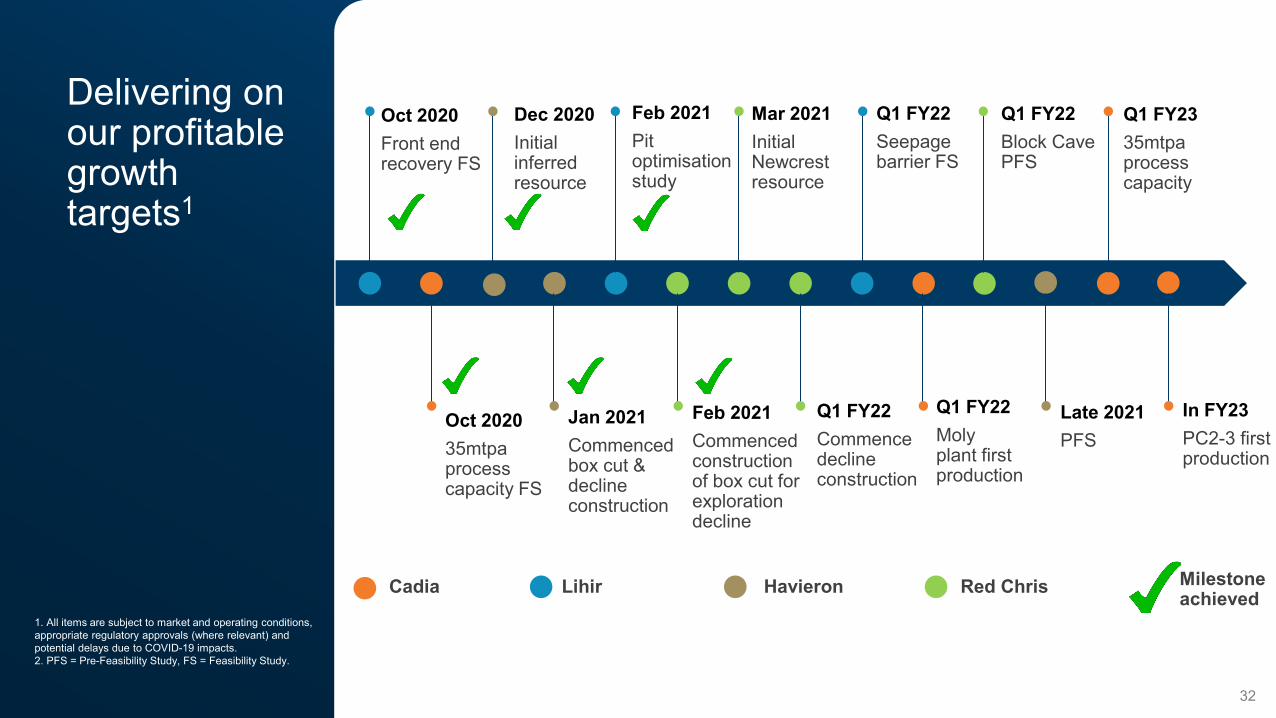
Delivering on our profitable growth targets1
32
1. All items are subject to market and operating conditions, appropriate regulatory approvals (where relevant) and potential delays due to COVID-19 impacts.2. PFS = Pre-Feasibility Study, FS = Feasibility Study.
Cadia Lihir Havieron Red Chris
Feb 2021Pit optimisation study
In FY23PC2-3 first production
Late 2021PFS
Oct 2020Front end recovery FS
Feb 2021Commenced construction of box cut for exploration decline
Jan 2021Commenced box cut & decline construction
Dec 2020Initial inferred resource
Mar 2021Initial Newcrest resource
Q1 FY22Seepage barrier FS
Q1 FY22Block Cave PFS
Q1 FY22Moly plant first production
Oct 202035mtpa process capacity FS
Milestone achieved
Q1 FY22Commence decline construction
Q1 FY2335mtpa process capacity
1H FY21 Key achievements Safety &
sustainability
Our growth story
Financial results & shareholder returns
Lihir optimisation
Summary
A strong first half & well positioned for the future
34
Our aspirations for 2021 - 2025
A safe & sustainable business
Strong gold prices = improved profitability & record free cash flow
Unlocking value at Lihir
Increasing returns to shareholders
Progressing our growth options
Newcrest’s value proposition

Find out more:www.newcrest.com
Engage with us
+61 3 9522 5717
+1 (866) 396 0242