21. TRIASSIC-LOWER CRETACEOUS WIRELINE … Rad, U., Haq, B. U., et al., 1992 Proceedings of the...
15
von Rad, U., Haq, B. U., et al., 1992 Proceedings of the Ocean Drilling Program, Scientific Results, Vol. 122 21. TRIASSIC-LOWER CRETACEOUS WIRELINE LOG DATA FROM SITES 759 THROUGH 764 1 Ron Boyd 2 and Alistair Bent 3 ABSTRACT Wireline log data from ODP Sites 759 through 764 are among the first to be published from the Exmouth-Wombat plateau region. Log analysis at these sites defined boundaries, trends, and log units. These analyses were also used to interpret the lithology at each site and, where possible, to correlate between adjacent sites on each plateau. The continuous data response of wireline logs proved useful for interpreting lithology and other sedimentary features in zones of poor recovery and for positioning partly recovered intervals at their correct depth. Continuous log response also enabled a more confident interpretation of depositional environments from trend analysis and assisted the interpretation of relative sea-level variation. Results enabled detailed correlation between Sites 762 and 763 on the southern Exmouth Plateau and a broader relationship to be established between Sites 759 and 760 on the Wombat Plateau. Wireline log data from the Exmouth and Wombat plateaus document two tectonic depositional cycles on the northwest Australian margin. The first is Late Triassic in age and follows a Permian rifting event. It was encountered only on the Wombat Plateau. The second is Early Cretaceous, documents a continental breakup event, and can be identified on both the Wombat and Exmouth plateaus. Superimposed on the large tectonic events are cycles of shorter duration reflecting sea-level oscillations and fluctuations in sediment supply. INTRODUCTION Location and Setting Wireline log data were collected at all six sites (759, 760, 761, 762, 763, and 764) drilled during Ocean Drilling Program (ODP) Leg 122 on two submarine plateaus adjacent to the northwest Australian continental margin (Fig. 1). Sites 762 and 763 are on the southern Exmouth Plateau (Exon and Willcox, 1980) whereas the other four site are located to the north on the adjacent Wombat Plateau (Exon et al., 1982; von Rad and Exon, 1983). Present water depth at these sites ranges from 1359 to 2698 m. In the early Mesozoic, the present northwest Australian margin was part of a continental rift zone on northeast Gondwanaland that bordered the Tethys sea to the north (von Rad and Exon, 1983; Fullerton et al., 1989). An initial phase of deep crustal extension and thinning of the Exmouth-Wombat Plateau area occurred during the Permian (Williamson and Falvey, 1988) and was followed by rifting during the Triassic- Jurassic (Audley-Charles, 1988). A thick paralic sequence of Triassic-Early Cretaceous (Fig. 2) clastic and carbonate rocks prograded northward from the Australian and possibly Greater Indian continents into the Tethys sea (Exon and Willcox, 1980). The Jurassic was a time of uplift, tilting, and erosion over much of the area. Seafloor spreading began on the margins of the Exmouth and Wombat plateaus during a second phase of rifting in the Late Jurassic to Early Creta- ceous (Audley-Charles, 1988). During the middle Cretaceous, subsidence continued, the southern clastic supply ended, and sedimentation switched first to hemipelagic mudstones, then to marls, and finally, by the Late Cretaceous, to pelagic deposition of chalks and oozes (Boote and Kirk, 1989). 1 von Rad, U., Haq, B. U., et al., 1992. Proc. ODP, Sci. Results, 122: College Station, TX (Ocean Drilling Program). 2 Center for Marine Geology, Dalhousie University, Halifax, Nova Scotia, B3H 3J5, Canada. 3 British Petroleum, 301 St. Vincent Street, Glasgow, G2 5DD, Scotland. Objectives and Content Here we concentrate primarily on log data from the Trias- sic-Early Cretaceous period of southern-sourced clastic sed- iment supply. These log data are among the first to be published from the Exmouth-Wombat plateau region. Log analysis of the various log string data combinations (see "Methods") was used to define boundaries, trends, and log units (e.g., Fig. 3). These analyses have been used to interpret the lithology at each site and, where possible, to correlate between adjacent sites on each plateau. Together with seismic and biostratigraphic data, log analysis has also been used to interpret the depositional sedimentary environments and to infer relative sea-level history. Wireline logs provide a rela- tively continuous data response and have proved useful in the present study for interpreting lithology and other sedimentary features in zones of poor recovery and for positioning partly recovered intervals at their correct depth. Continuous log response enables a more confident interpretation of deposi- tional environments from trend analysis and particularly as- sists interpretation of continuous sea-level variation. The wireline log data are presented separately, first for the Wombat Plateau, and second for the Exmouth Plateau. Be- cause the times of deposition logged on the two plateaus mostly do not coincide, correlation between sites was at- tempted only within each plateau. METHODS Geophysical well logging procedures for each site and a brief outline of the operation of each tool used on Leg 122 are given in Haq, von Rad, O'Connell, et al. (1990). A variety of well log data was collected on Leg 122. The tool combination run at each site generally depended on several factors, includ- ing hole conditions and time. Of principal interest to this study was the seismic-stratigraphic tool string consisting of the long-spacing sonic (LSS) tool or sonic digital tool (SDT), the dual induction (DIL) or phaser induction (DIT-E) tool, the gamma-ray (GR) or natural gamma spectrometry tool (NGT), and the caliper tool (MCD). Where hole conditions prevented running the seismic-stratigraphic tool string, data were ob- 377
Transcript of 21. TRIASSIC-LOWER CRETACEOUS WIRELINE … Rad, U., Haq, B. U., et al., 1992 Proceedings of the...

von Rad, U., Haq, B. U., et al., 1992Proceedings of the Ocean Drilling Program, Scientific Results, Vol. 122
21. TRIASSIC-LOWER CRETACEOUS WIRELINE LOG DATA FROM SITES 759 THROUGH 7641
Ron Boyd2 and Alistair Bent3
ABSTRACT
Wireline log data from ODP Sites 759 through 764 are among the first to be published from the Exmouth-Wombatplateau region. Log analysis at these sites defined boundaries, trends, and log units. These analyses were also usedto interpret the lithology at each site and, where possible, to correlate between adjacent sites on each plateau. Thecontinuous data response of wireline logs proved useful for interpreting lithology and other sedimentary features inzones of poor recovery and for positioning partly recovered intervals at their correct depth. Continuous log responsealso enabled a more confident interpretation of depositional environments from trend analysis and assisted theinterpretation of relative sea-level variation.
Results enabled detailed correlation between Sites 762 and 763 on the southern Exmouth Plateau and a broaderrelationship to be established between Sites 759 and 760 on the Wombat Plateau. Wireline log data from theExmouth and Wombat plateaus document two tectonic depositional cycles on the northwest Australian margin. Thefirst is Late Triassic in age and follows a Permian rifting event. It was encountered only on the Wombat Plateau. Thesecond is Early Cretaceous, documents a continental breakup event, and can be identified on both the Wombat andExmouth plateaus. Superimposed on the large tectonic events are cycles of shorter duration reflecting sea-leveloscillations and fluctuations in sediment supply.
INTRODUCTION
Location and Setting
Wireline log data were collected at all six sites (759, 760,761, 762, 763, and 764) drilled during Ocean Drilling Program(ODP) Leg 122 on two submarine plateaus adjacent to thenorthwest Australian continental margin (Fig. 1). Sites 762and 763 are on the southern Exmouth Plateau (Exon andWillcox, 1980) whereas the other four site are located to thenorth on the adjacent Wombat Plateau (Exon et al., 1982; vonRad and Exon, 1983). Present water depth at these sitesranges from 1359 to 2698 m.
In the early Mesozoic, the present northwest Australianmargin was part of a continental rift zone on northeastGondwanaland that bordered the Tethys sea to the north (vonRad and Exon, 1983; Fullerton et al., 1989). An initial phase ofdeep crustal extension and thinning of the Exmouth-WombatPlateau area occurred during the Permian (Williamson andFalvey, 1988) and was followed by rifting during the Triassic-Jurassic (Audley-Charles, 1988). A thick paralic sequence ofTriassic-Early Cretaceous (Fig. 2) clastic and carbonate rocksprograded northward from the Australian and possiblyGreater Indian continents into the Tethys sea (Exon andWillcox, 1980). The Jurassic was a time of uplift, tilting, anderosion over much of the area. Seafloor spreading began onthe margins of the Exmouth and Wombat plateaus during asecond phase of rifting in the Late Jurassic to Early Creta-ceous (Audley-Charles, 1988). During the middle Cretaceous,subsidence continued, the southern clastic supply ended, andsedimentation switched first to hemipelagic mudstones, thento marls, and finally, by the Late Cretaceous, to pelagicdeposition of chalks and oozes (Boote and Kirk, 1989).
1 von Rad, U., Haq, B. U., et al., 1992. Proc. ODP, Sci. Results, 122:College Station, TX (Ocean Drilling Program).
2 Center for Marine Geology, Dalhousie University, Halifax, Nova Scotia,B3H 3J5, Canada.
3 British Petroleum, 301 St. Vincent Street, Glasgow, G2 5DD, Scotland.
Objectives and Content
Here we concentrate primarily on log data from the Trias-sic-Early Cretaceous period of southern-sourced clastic sed-iment supply. These log data are among the first to bepublished from the Exmouth-Wombat plateau region. Loganalysis of the various log string data combinations (see"Methods") was used to define boundaries, trends, and logunits (e.g., Fig. 3). These analyses have been used to interpretthe lithology at each site and, where possible, to correlatebetween adjacent sites on each plateau. Together with seismicand biostratigraphic data, log analysis has also been used tointerpret the depositional sedimentary environments and toinfer relative sea-level history. Wireline logs provide a rela-tively continuous data response and have proved useful in thepresent study for interpreting lithology and other sedimentaryfeatures in zones of poor recovery and for positioning partlyrecovered intervals at their correct depth. Continuous logresponse enables a more confident interpretation of deposi-tional environments from trend analysis and particularly as-sists interpretation of continuous sea-level variation.
The wireline log data are presented separately, first for theWombat Plateau, and second for the Exmouth Plateau. Be-cause the times of deposition logged on the two plateausmostly do not coincide, correlation between sites was at-tempted only within each plateau.
METHODSGeophysical well logging procedures for each site and a
brief outline of the operation of each tool used on Leg 122 aregiven in Haq, von Rad, O'Connell, et al. (1990). A variety ofwell log data was collected on Leg 122. The tool combinationrun at each site generally depended on several factors, includ-ing hole conditions and time. Of principal interest to this studywas the seismic-stratigraphic tool string consisting of thelong-spacing sonic (LSS) tool or sonic digital tool (SDT), thedual induction (DIL) or phaser induction (DIT-E) tool, thegamma-ray (GR) or natural gamma spectrometry tool (NGT),and the caliper tool (MCD). Where hole conditions preventedrunning the seismic-stratigraphic tool string, data were ob-
377

R. BOYD, A. BENT
15°S
17r
19C
21
^ • North Rankin Ir- i 7 ^ Goodwyn I
/ J<_ Scarborough I a I^/Walusl^ £T Dampler Iv I Saturn I yf/rt 0 North Tryal Rocks I
I Eendracht I
109°E 113° 115C 117C 119°
Figure 1. Bathymetric map of the Exmouth Plateau region showing the location of ODP sites (solid circles = Leg 122, open circles = Leg123) and commercial wells. Bathymetry is in meters (N. F. Exon, unpubl. data). Log data from Mesozoic strata at all six Leg 122 sitesare discussed in this paper.
tained from the lithoporosity combination and the geochemi-cal combination, both of which can be run effectively in drillpipe. The lithoporosity combination includes the NGT, litho-density (LDT), and compensated neutron (CNT-G) tools. Thegeochemical combination includes the NGT, induced gamma-ray spectrometry (GST), and the aluminum clay tools (ACT).
An analysis of the wireline log data was performed usingtechniques outlined in Rider (1986). This analysis consisted offirst identifying lithology from the gamma, resistivity, andsonic logs and cross-correlating these log identifications withthe recovered core intervals. All site depths are listed both inmeters below sea level (mbsl) and in meters below seafloor(mbsf) to enable correlation among core, log, and seismicdata. Sections of poor core recovery generally coincided withintervals interpreted as sandstone or massive limestone fromthe logs. A log fades analysis was then performed usingbaseline, trend line, log shape, and abrupt break techniques.From this analysis an interpretation of depositional environ-ments and relative sea level was derived. Sequence strati-graphic procedures follow those described in Vail (1987),whereas sequence stratigraphic nomenclature for sequences,systems tracts, and sea level follows that of Van Wagoner etal. (1987).
WOMBAT PLATEAUThe four sites drilled on the Wombat Plateau (Fig. 1) were
all terminated in Triassic sediments. The drill sites encoun-tered a sequence of Triassic marginal marine and marine
deposits overlain by Cretaceous and Cenozoic sediments.Jurassic sediments were absent over the plateau. The WombatPlateau is interpreted as a northern segment of the ExmouthPlateau which formed during the Middle Jurassic rift phase(von Rad et al., 1989). The oldest sediments encountered onthe plateau consist of early to middle Carnian to Norianmarginal marine sediments, predominantly carbonates, over-lain by fully marine Rhaetian crinoidal limestones, reefalcomplexes, and shelf limestones.
A major subangular unconformity dissects the Triassic overthe area, and the absence of Jurassic sediments is attributed totilting and uplift of the plateau prior to the onset of seafloorspreading in the Argo Abyssal Plain. Subsequent breakup of themargin at about Callovian?-Berriasian times saw rapid subsid-ence of the Wombat Plateau, and the Triassic unconformity wastransgressed, depositing condensed sections of Cretaceous glau-conitic limestones and belemnite-rich mudstones.
By middle Cretaceous times clastic supply to the areadiminished and hemipelagic conditions were established overthe Wombat Plateau, resulting in the middle to late Aptiandeposition of deep-water clay stones. These are succeeded byan organic black shale, marking the Cenomanian/Turonianboundary and overlain by pelagic carbonate facies.
Log Character at Site 759The total and spectral gamma-ray log data are of excellent
quality over the open-hole section, and the electric logsrecorded good data over most of the open hole. The sonic log
378
TRIASSIC-LOWER CRETACEOUS WIRELINE LOG DATA
TECTONICEVENTS
2ND
TIMOR OBDUCTION
1ST
TIMOR OBDUCTION
STAGE 5
MATURE OCEAN TO
INCIPIENT COLLISION
STAGE 4POSTBREAKUPAND RIFT TO
DRIFT TRANSITION
BREAKUP SOUTH OF
EXMOUTH PLATEAU
STAGE 3SECOND RIFT
TO FINAL BREAKUP
BREAKUP NORTH OF
EXMOUTH PLATEAU
STAGE 2RIFT ONSET
TO INITIAL BREAKUP
RIFT ONSET
STAGE 1
INTRACRATONIC
SEDIMENTATION
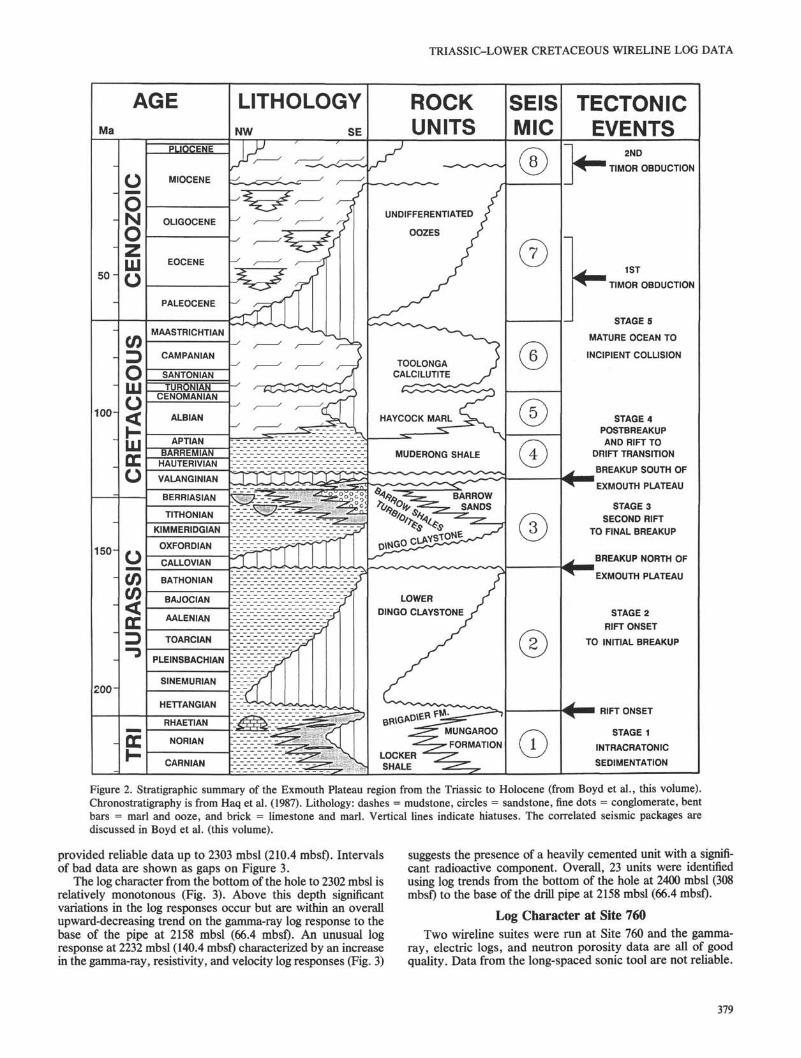
Figure 2. Stratigraphic summary of the Exmouth Plateau region from the Triassic to Holocene (from Boyd et al., this volume).Chronostratigraphy is from Haq et al. (1987). Lithology: dashes = mudstone, circles = sandstone, fine dots = conglomerate, bentbars = marl and ooze, and brick = limestone and marl. Vertical lines indicate hiatuses. The correlated seismic packages arediscussed in Boyd et al. (this volume).
provided reliable data up to 2303 mbsl (210.4 mbsf). Intervalsof bad data are shown as gaps on Figure 3.
The log character from the bottom of the hole to 2302 mbsl isrelatively monotonous (Fig. 3). Above this depth significantvariations in the log responses occur but are within an overallupward-decreasing trend on the gamma-ray log response to thebase of the pipe at 2158 mbsl (66.4 mbsf). An unusual logresponse at 2232 mbsl (140.4 mbsf) characterized by an increasein the gamma-ray, resistivity, and velocity log responses (Fig. 3)
suggests the presence of a heavily cemented unit with a signifi-cant radioactive component. Overall, 23 units were identifiedusing log trends from the bottom of the hole at 2400 mbsl (308mbsf) to the base of the drill pipe at 2158 mbsl (66.4 mbsf).
Log Character at Site 760Two wireline suites were run at Site 760 and the gamma-
ray, electric logs, and neutron porosity data are all of goodquality. Data from the long-spaced sonic tool are not reliable.
379

R. BOYD, A. BENT
ú Z $- > E
2275
2300
2325
2350
2375
0
0
SGR
100
100
200
ILD
LITHOLOGY:
100
ILM DTL
0 2 20 i 200 100
DTL
LIMESTONE
SANDSTONE
SHALE
MARL
COAL
ORGANICSHALE
ILD
ILD
DTL
200 100
SYSTEMS TRACT (ST)
HST HIGHSTANDST
SMW SHELF MARGIN WEDGE
TST TRANSGRESSIVEST
LST LOW STAND ST
Figure 3. Wireline log data from Sites 759 (left) and 760 (right) for the gamma-ray (SGR), resistivity (ILD to the left and ILMto the right), and sonic (DTL) logs. Also shown are the interpreted lithology, log units, relative sea level, and correlationbetween the two sites.
380

TRIASSIC-LOWER CRETACEOUS WIRELINE LOG DATA
No overall broad trends are discernable from the bottom ofthe hole up to 2049.7 mbsl (80 mbsf), where there is a sharpdrop in the gamma-ray log and resistivity log response (Fig. 4).Between the base of the pipe at 2032.7 mbsl (63 mbsf) and2049.7 mbsl (80 mbsf), there is a downward decrease in thesonic velocity and a corresponding increase in the neutronporosity log response. Two intervals with unusual log re-sponses occur over the logged interval. The first, at 2119.7mbsl (150 mbsf), is 1.5 m thick and is characterized by a lowgamma-ray log response (30 API units) and a pronouncedincrease in the interval transit time to 220 µs/ft, concurrentwith a slight decrease in the resistivity log response (Fig. 4).The unit is also marked by an increase in the neutron porosityreading to 70% and a decrease in the thorium to potassiumratio. At 2096.7 mbsl (127 mbsf) is a second 1.5-m-thick unitthat has a high gamma-ray log response (140 API units) thatcorresponds with an increase in the thorium content to 22 ppmand a slight increase in the uranium content (Fig. 4). Theneutron porosity log indicates a reading of 40%, and both thevelocity and resistivity response increase slightly. It waspossible to log only a relatively short section of the total openhole at Site 760 as a result of poor hole conditions, and the logtrend analysis of this section identifies 10 units.
Log Character at Site 761Bridging problems in Hole 761C made it impossible to run
open-hole logs over much of the section, and the DIT-E, SDT,and NGT combination was run only over a short section ofhole between 2428 and 2293 mbsl (260.1 and 125.1 mbsf). Datafrom the remaining section of hole down to 2583 mbsl (415.1mbsf) were obtained by running the geochemical tool throughpipe. Data from the geochemical tool are of good quality, butbetween 2513 and 2458 mbsl (345.1 and 290.1 mbsf) thegamma-ray data are invalidated by irradiation of the pipe.
The open-hole log data are generally characterized by a lowgamma-ray log response (10-15 API units) and by low velocityand electric log responses (Fig. 5). A broad peak in thegamma-ray log response at 2338 mbsl (170.1 mbsf) indicatesthe position of the Cretaceous/Tertiary boundary interval. Asmall increase in the gamma-ray log and electric log responseat 2408 mbsl (240.1 mbsf) suggests the presence of a clay unitwith lower porosity than the overlying sediments.
Log responses from the geochemical tool below the open-hole section define a long interval of calcium abundance.Small troughs in the calcium log and corresponding peaks inthe silica and aluminium responses indicate the presence ofclastic-rich stringers (Fig. 6). These stringers are more pre-dominant below 2508 mbsl (340.1 mbsf).
Log Character at Site 764Technical problems at Site 764 prevented running open-
hole logs. However, it was possible to run both the geochem-ical tool and the neutron porosity log tool through the drillpipe with relatively good results. Results from the totalgamma-ray log, run with the neutron porosity tool, can beused only for the identification of general trends, because ofthe irradiation of the drill pipe and consequent high gamma-ray counts over the logged section.
From the base of the logged section at 2983.6 mbsl (285mbsf) up to 2910 mbsl (211.4 mbsf) there is a general upwardincrease in the gamma-ray log response concomitant with anincrease in the neutron porosity reading (Fig. 7). Gamma-raypeaks over this interval coincide with silicon-, thorium-, andpotassium-enriched intervals (Fig. 8). Between 2910 and2820.6 mbsl (211.4 and 122 mbsO low gamma-ray, thorium,and potassium log responses coincide with high silicon andlow aluminium ratios. The neutron porosity log displays a
broad upward increase to near the top of the unit and then asharp decrease at 2820.6 mbsl (122 mbsf).
Above 2820.6 mbsl (122 mbsf) there is a shift in thegamma-ray log response which gradually increases to a max-imum at 2756.6 mbsl (58 mbsf) with a corresponding peak onthe neutron porosity log response. Intervals of low gamma-rayresponse (10 API) and porosity over this unit correspond withhigh calcium readings from the geochemical log response.Above this unit the gamma-ray log response falls to below 10API units and then displays a very slight upward increase tothe seafloor at 2698.6 mbsl. The upward increase in porosity tothe seafloor reflects the increasingly unlithified nature of thesediment.
Lithologic InterpretationOpen-hole log responses at Sites 759 and 760 (Figs. 3 and 4)
over the Carnian and Norian sections are indicative of arelatively mudstone-/siltstone-rich sequence with interbeds ofsandstone and limestone. At Site 759 the limestone bedsbecome thicker and more common toward the top of theNorian section. The shale and siltstone lithology at Sites 759and 760 is characterized by high gamma-ray and neutronporosity log responses and low compressional-wave veloci-ties. At Site 759 gamma-ray peaks at 2308 mbsl (216.4 mbsf)and 2274 mbsl (182.4 mbsf) are indicative of more organic-richintervals and correspond with an increase in uranium/thoriumand potassium on the geochemical log.
Sand and sandstone units are typified by relatively highergamma-ray log responses of between 40 and 60 API units, areflection of the high clay content and fine nature of thesesandstones. Both the sonic log and neutron log indicateporosities of between 70% and 75% in the sand and sandstoneunits, but it is suggested that the actual porosities are probablymore in the region of 35% to 40%. The discrepancy is probablydue to the high clay content and generally unlithified nature ofthe sands. For example, unit 4 at 2119.7 mbsl (150 mbsf) atSite 760 is characterized (Fig. 4) by a sharp decrease in thevelocity and resistivity log response concomitant with areduction in the gamma-ray log response; this is a commonfeature of uncompacted sands. Cemented sandstone units at2232 mbsl (140.4 mbsf) and 2096 mbsl (126.3 mbsf) at Sites 759and 760, respectively, display an unusually high gamma-raylog response that can be attributed to the presence of thorium-bearing heavy minerals.
Limestone intervals at Site 759 are characterized by lowgamma-ray log responses and relatively high resistivities andcompressional-wave velocities (Fig. 3). Both of these proper-ties are a result of the low porosity and high degree ofcementation of the limestones seen in the core. Limestonelithology at Site 759 also displays a distinctive "blocky"character on the gamma-ray log compared with the upward-fining and -coarsening trends over the sandstone interval.Only one limestone unit was identified at Site 760, at the baseof the logged section, where it is characterized by a sharpdecrease in the neutron porosity log and an increase in theresistivity log response. As the neutron log porosity to realporosity has a 1/1 relationship over limestone, the lithology inwhich it is calibrated, the value of 10% can be taken as real.
The sediments above the top Triassic unconformity at2049.7 mbsl (80 mbsf) at Site 760 are interpreted as chalks ormarls passing up into oozes with characteristic low gamma-ray log responses and neutron log porosities ranging from 50%to 55%. A 40-cm-thick manganese crust at the Triassic uncon-formity was recovered in the core but was beyond theresolution of the logs. Chalk and oozes were also identifiedabove the top Triassic unconformity at 2423.4 mbsl (255.5mbsf) and 2747.9 mbsl (49.3 mbsf) at Sites 761 and 764,
381

Lith. L j t h.„ „ unit A umt B50 | 1 pr1—i—•—i—•—I I—•—1~~1—!—I 1 * i * j ^ L — ! — * I T H I ' i ' ! ' ! : I I..."!..;...!.'...''
11 "1 r ; •-v ! | : : I f : : i » i H••••
III Log " ~ i ^ > T Z Z t ~ Z ~•-I• •""^%r•• l • • - ~ ~m <- ~ Y9 Q_ Subunit _ ^ - - •*^ I — - fi I - 90 ^ • £L P
|__ •^^^^^ j-S3*"" . I : ^-.; I ^ : r^f ; i
LOW p^J ^̂ 5̂ . ! :; i 3 i i^.; ; \.~ - porosity • j /S~ - – JQ \ - -. j *^T ] - - ; ^ ; ; • • \ i i -
^ s a n d s : ^' " "I.I..I!±i'"II".ZiIII I •̂ ! I - £ 1 1
Q porosity - ~ - = g ^ * f — - ^ * j i _f^*-• | - - ^ ^ - ••~ • • = - ^ • •_
sands ' j ̂ Z ! " " \ i " " ! \j* j ' - ^ ^ : i!.^
1 3 0 - IV Low _ ^~T~ =~1 - ^r\ \........ - | ^ΛU I _ 130_ iv - ; f - -rr~" _porosity [ W . . .j ‰^ | j ,i...j j ^ j j...sands 2 \£~~ I ^ . j I j ^ L j ™̂ _... .: ......(..*••
1 5 0 — λsandSy --̂ —•~* , M . _= — • -~•><••i-rK -r — — | L ‰ ^ ^ I _ 1 5 0 _ -—- ^==z^T^ - — '̂ c=-~~ ~~-
LOW J\^S ÷ 'Z^^ZIJII i;il4i;3.4lI""J""II < / ..7.71.'.porosity 3 - j a S • ^ j " " X -U 1 : ". J Kj. I : " :...... \ "L .sands L ^ . I ^4 1 ^ ^― I -'"' L<
170—» 1 1 1 ' L--X 1 1 1 I 1 5 J 1 1 I I I I ^ i I I I 1 7 0 J I I i I i I i I i I I . M I • I i0 50 100 150 0 10 20 0 25 50 75 100 1 0 1 5 2 0 2 5 3.0 o 2 4 6 8
Total gamma (API) Th (ppm) Neutron porosity (%) velocity (km/s) R<ohm-m)
Figure 4. Wireline log data from Site 760. A. Open-hole logs of total gamma-ray, thorium count (Th), and neutron porosity. B. Velocity and deep formation resistivity (R) logs. Also shownis the correlation of the logs to lithologic units defined in Haq, von Rad, O'Connell, et al. (1990).

TRIASSIC-LOWER CRETACEOUS WIRELINE LOG DATA
150
200
250
Open hole
r\K/Tboundary
0 20 40 60 0Total gamma (API)
^ i ' i ' r
1 2 3 4R (ohm-m)
51.6 1.8 2.0 2.2 2.4Vo (km/s)
Figure 5. Open-hole logs of total gamma-ray, resistivity (R), andcompressional-wave velocity (Vp) recorded at Site 761 by the seismic-stratigraphic tool string. The data were smoothed using a 1.0-mrunning average calculated at 0.5-m intervals.
respectively. The equivalent section was not logged at Site759. Lithology below the top Triassic unconformity at Sites761 and 764 (Figs. 5-8) consists of Rhaetian carbonates andcarbonate mudstones, and their overall log character differssignificantly from that of the Triassic sequences at Site 759and 760.
At Site 761 pure limestones predominate down to 2490mbsl (322.1 mbsf), below which the limestones become in-creasingly impure, grading into carbonate mudstone and marlsas the silica content (in the gamma-ray spectrometry capturelog) increases (Fig. 6). Toward the base of the hole, thegamma spectroscopy ratio log clearly distinguishes limestonefrom mudstone using the silicon/calcium ratio. The onlysandstone interpreted on the logs at Site 761 occurs between2430 and 2426 mbsl (262.1 and 258.1 mbsf).
Log analysis below the top Triassic unconformity at Site764 shows that, as for Site 761, carbonate lithology is predom-inant. Core recovery over much of this section was very poorand it is therefore difficult to ground-truth log analyses.However, variations in the different geochemical log re-sponses allow for the definition of broad trends over thelogged section. Iron-rich limestones and carbonate mudstonesare identified in the interval between 2983.6 and 2910 mbsl(285 and 211.4 mbsf) at Site 764. Above this, the very lowgamma-ray, thorium, and potassium log responses over thesection up to 2820.6 mbsl (122 mbsf) are interpreted as
limestone with very low detrital clay contents (Fig. 7). Theincrease in the gamma-ray log response above 2820.6 mbsl(122 mbsf) indicates the presence of clay-rich carbonates withthin, purer limestone stringers. A marked increase in theneutron porosity log response (Fig. 8) just below the topTriassic unconformity at 2753.6 mbsl (55 mbsf) coincides withan increase in the calcium log response and may represent amore porous grainstone.
Correlation of Sites 759, 760, 761, and 764Because of the variety of logging techniques that had to be
adopted at the Leg 122 sites on the Wombat Plateau, logcorrelation among the sites is only possible over limitedintervals. Figure 3 shows logs from Sites 759 and 760, tied atthe top Triassic unconformity. Tentative correlations acrossthe underlying Norian section are depicted, notably the oc-currence of a radioactive sandstone in unit 14 at Site 759 andunit 6 at Site 760. These units may relate to a single event withimportant implications for relative sea-level interpretation, asdiscussed in the following section.
Interpretation of Depositional Environments andRelative Sea Levels on the Wombat Plateau
At Sites 759 and 760 the log units and overall log charac-teristics below the top Triassic unconformity are indicative ofrestricted conditions with limited clastic input interrupted byperiods of shallow-marine limestone deposition.
The basal section at Site 759, from 2400 to about 2305 mbsl(308.4 to 213.4 mbsf), consists of an upward-shoaling clasticsequence that was probably deposited in a prodelta or basinalenvironment. Above 2305 mbsl (213.4 mbsf) the alternatinglimestone, mudstone, and upward-fining sandstone lithologyis considered to represent deposition on a shallow platformwith the environment fluctuating from a marginal marine/lagoon type to intertidal and shallow-marine types. Individualfacies include lagoonal mudstones, tidal channel sandstones,and shallow-marine carbonates. The cemented sandstone unitidentified at both Sites 759 and 760 is interpreted as a placerdeposit. Carbonate facies are less prevalent at Site 760, butthe overall depositional environment over the logged sectionis still essentially a restricted low-energy shoreline or la-goonal-type system. This is supported by rootlets in the coredmudstone intervals and a distinctive lack of marine fauna.Above the Triassic unconformity at Sites 759 and 760 deposi-tion occurred in a deep-marine carbonate environment.
Relative sea level of the Carnian and Norian sections atSites 759 and 760 appears to occur primarily within thehighstand systems tract. At Site 759 a broad upward shoalingwithin the highstand systems tract marks the transition from aprodelta to marginal marine environment. At both Sites 759and 760, smaller-scale upward-shoaling cycles result in aupward facies transition from lagoonal to tidal flat sedimentscapped by swamp or marsh deposits.
The occurrence of a placer deposit at Sites 759 and 760 isinterpreted as the product of a low relative sea-level sand. Thethin, unconsolidated sand overlying this unit at both sites istherefore interpreted as occurring within the subsequenttransgressive systems tract.
In contrast to Sites 759 and 760, sediments below the topTriassic unconformity at Sites 761 and 764 consist predomi-nantly of Rhaetian marine carbonates. At Site 761 the logcharacter at the base of the hole is interpreted as thinlyinterbedded limestone and mudstone units. The absence ofsandstones over this interval, the clean nature of the interbed-ded carbonates, and the rapid alternation between carbonateand clastic deposition suggests transgressive/regressive con-ditions in a continental shelf environment.
383

R. BOYD, A. BENT
100
200
300
400
B
100
200
Q.α>Q
300
4 0 0 -
0.2Calcium
>
0.4 0.01 0.02 0.030 20 40 60 80 0Aluminum Si/AI
0.1 0.2Silicon
0.3
Figure 6. Profiles of relative elemental abundance at Site 761. A. The calcium abundance log indicatesthe presence of a limestone unit from 260 to 340 mbsf. B. Aluminum, silicon, and the ratio of siliconto aluminium (Si/AI).
Above 2553 mbsl (385.1 mbsf) at Site 761 there is anupward transition into marls and calcareous mudstones.These sediments have a clastic component but are not asradioactive as the underlying mudstones and have lowercarbonate contents. This interval suggests either a diminutionof the clastic sediment supply by removal of the source,subsidence and deepening of the basin, or both. A higherenergy carbonate lithology predominates from 2490 mbsl(322.1 mbsf) to the top Triassic unconformity. Overlying theunconformity, a thin unconsolidated sandstone is interpretedas a transgressive coastal/continental shelf sand depositedunder relatively high-energy conditions. Overlying the sand-stone there is a gradual upward transition into bathyal chalksand oozes.
At Site 764 a marine carbonate environment predominatesfrom the base of the logged section at 2983.6 mbsl (285 mbsf)to the top Triassic unconformity. The core lithology indicatesthat the majority of this section is a coral and sponge reefcomplex with related perireefal facies. A sequence boundarycan be tentatively drawn at the top of the reefal complex at2771 mbsl (72.4 mbsf), which is overlain by shallow-marinelimestones and calcareous mudstones.
Relative sea-level interpretation of the Triassic sequence atSite 761 suggests that the section below 2553 mbsl (385.1mbsf) is within a transgressive systems tract with a lowersequence boundary at about 2593 mbsl (425.1 mbsf). Thislower sequence boundary is extrapolated from the presence ofnonmarine sediments in Core 122-761C-33R, below the baseof the log data. Above 2552 mbsl (384.1 mbsf) the Triassic
sediments are within the highstand systems tract. Similarly, atSite 764 the Triassic reef complex represents the highstandsystems tract, the base of which lies below the logged intervalat approximately 2979 mbsl (280.4 mbsf). The sequenceboundary at the top of the reefal complex at 2771 mbsl (72.4mbsf) may represent a sharp drop in relative sea level, inwhich case the overlying marine carbonates represent thetransgressive systems tract.
EXMOUTH PLATEAU
Drilling at both sites on the southern Exmouth Plateauterminated in Lower Cretaceous sediments (see Brenner etal., this volume). This period was characterized by high ratesof northward clastic sediment supply (Exon and Willcox,1980) lithologically and time equivalent to the Barrow Group(Fig. 2) on the adjacent Northwest Shelf (e.g., Barber, 1982).Between the Tithonian and Valanginian, a thick clastic wedge(Boot and Kirk, 1989) prograded from the southern transformmargin northwestward onto subsiding continental crust (Er-skine and Vail, 1988). This clastic slope/margin system depos-ited more than 1500 m of clastic sediments in less than 15m.y., over a 300-km-wide depositional wedge and a number ofrelative sea-level cycles (Boyd et al., this volume; Haq et al.,this volume). This clastic supply diminished after breakupsouth of the Exmouth Plateau (Fig. 2) and the initiation ofseafloor spreading in the Hauterivian (Fullerton et al., 1989).A regional transgression spread east onto the Australiancraton after the Neocomian and sedimentation on the subsid-ing Exmouth Plateau switched to deeper water facies and a
384

TRIASSIC-LOWER CRETACEOUS WIRELINE LOG DATA
Gamma ray Neutron porosity(API) (%)
0 50 75 15
200
250 -
Lithologic units
Figure 7. Gamma-ray and neutron porosity logs from Hole 764B. Theneutron porosity values are affected by water displacing the bottom-hole assembly and 8.25-in. pipe above 201 mbsf, but the downholeporosity trends are considered valid. The log peaks at 24.0-30.5 and100-106 mbsf (asterisks) are due to pipe movement and are invalid.Also shown is the correlation of the logs to lithologic units defined inHaq, von Rad, O'Connell, et al. (1990).
carbonate-dominated composition (Exon and Willcox, 1980;Barber, 1982).
Our analysis of wireline log data from the southern Ex-mouth Plateau covers sediments deposited between the Ber-riasian and the Cenomanian. Site 763 was designed to samplea more proximal section of Barrow Group equivalent sedi-ments whereas Site 762 was designed to sample a more distalsection. Berriasian-Cenomanian sediments were logged be-tween 2271 and 2170 mbsl (911 and 810 mbsf) at Site 762 andbetween 2045 and 1750 mbsl (677.5 and 382.5 mbsf) at Site763. At Site 763 only part of the seismic-stratigraphic stringwas run and data consist of gamma-ray, resistivity, and caliperlogs. At Site 762 a full log suite from the seismic-stratigraphicstring (sonic, caliper, resistivity, total gamma-ray, andthorium, potassium, and uranium spectral logs), geochemicalstring (total gamma-ray; thorium, potassium, and uraniumspectral logs; and elemental yields of silicon, calcium, sulfur,aluminium, iron, hydrogen, and chlorine) and lithodensitystring (neutron porosity, density, and gamma-ray) is available.Lithologic interpretations of the log data were ground-truthedwith reference to equivalent core locations, where available,and correlated with adjacent proprietary lithologic and wire-
Gamma ray 10 Th (ppm) 30(API) -10 K(%) 10
0 50 20 U (ppm) 0
50
1 0 0 -
150 —
200-
250 -
Lithologic units
1
Cretaceous/Tertiary boundary
Log subunits
Figure 8. Gamma-ray, thorium, potassium, and uranium logs recordedin the pipe at Site 764. The log peaks at 24.0-30.5 and 100-106 mbsf(asterisks) are due to pipe movement and are invalid. Also shown isthe correlation of the logs to lithologic units defined in Haq, von Rad,O'ConneU, et al. (1990).
line log data (Esso Australia unpublished well completionreports, Vinck-1 and Eendracht-1). Environmental and sea-level interpretations were correlated with regional seismicdata (Boyd et al., this volume) and age determinations arefrom Brenner et al. (this volume).
Log Character at Site 763The data quality of the gamma-ray log is high throughout Site
763 whereas the electric logs display a subdued but interpretabletrace (Fig. 9). The combination of the two logs and reference to theadjacent industry Vinck-1 well enabled subdivision and interpreta-tion of the wireline log data. The most prominent features on theelectric logs were a series of resistivity peaks most clearly seenbetween 1991 and 2002 mbsl (623.5 and 634.5 mbsf), 2014 and 2017mbsl (646.5 and 649.5 mbsf), and 2226 and 2228 mbsl (858.5 and860.5 mbsf) (Fig. 9). Where not obscured by other trends, theresistivity peaks were observed to correlate with decreased gam-ma-ray response. The interval between 2044 and 2008 mbsl (676.5and 640.5 mbsf) contains two thicker units of low resistivity andgamma-ray response. Three intervals of higher gamma-ray re-sponse centered at 1946, 1966, and 1986 mbsl (578.5, 598.5, and618.5 mbsf) are more intense than other gamma-ray peaks and, asshown on the spectral gamma-ray log (Fig. 10), are primarilyderived from a uranium source. A prominent trend of decreasinggamma-ray response was observed between 1946 and 1923 mbsl(578.5 and 555.5 mbsf). With some minor variability, this feature of
385

R. BOYD, A. BENT
2152
2177
2202
2227
2252
2277
ILM
LITHOLOGY:
LIMESTONE
SANDSTONE
SHALE
I l i X MARL
COAL
^ 3 ORGANIChá SHALE
ILM
SYSTEMS TRACT (ST)
HST HIGHSTAND ST
SMW SHELF MARGIN WEDGE
TST TRANSGRESSIVE ST
LST LOW STAND ST
Figure 9. Wireline log data from Sites 762 (right) and 763 (left) on the southern Exmouth Plateaufor the gamma-ray (SGA and SGR) and resistivity (ILD to the right and ILM to the left; nocrossover) logs. Also shown are the interpreted lithology, log units, relative sea level, andcorrelation between the two sites.
386

TRIASSIC-LOWER CRETACEOUS WIRELINE LOG DATA
200
Logunit
300 —
400 —
8-
500 —
600 —
700
K/T(Cretaceous/
Tertiary)
C/T(Cenomanian/
Turonian)
0 60 120 0Total gamma (API)
1R
2(ohm-m)
3 0 5Th
10(ppm)
1 5 0 0 .01K (X)
0.02 0u
4(ppm)
Figure 10. Total gamma-ray, resistivity (R), and spectral gamma-ray logs for the relative abundance of thorium (Th), potassium (K), anduranium (U) from Site 763. The clay-rich clastic strata of the Barrow Group and Muderong Shale can be identified from the high gamma-rayresponse below 578 mbsf. The middle Cretaceous to Tertiary chalks and oozes above 555 mbsf display a low gamma-ray response.
diminished gamma-ray response continues to the top of the loggedinterval at 1566 mbsl (198.5 mbsf). Within this interval is a thin zoneof higher resistivity at 1912.5-1896.5 mbsl (545-529 mbsf), followedupward by a broad interval of little change to a prominent peak inthe gamma-ray log at 1750 mbsl (382.5 mbsf) and then a return tolow gamma-ray response. The identification of log trends andcharacteristic response patterns has enabled the definition of 13 logunits between 2045 and 1750 mbsl (677.5 and 382.5 mbsf).
Log Character at Site 762
At Site 762, the number of available logs is greater than at Site763, but the Lower Cretaceous section is thinner. The log interpre-tation at Site 762 concentrated again on gamma-ray and electric logs(Fig. 9) as these data enabled correlation with features and trendsevident at Site 763 (Fig. 9) and the adjacent industry well, Een-dracht-1. Sonic and density logs (Figs. 11 and 12) show clear trendsand enabled comparison with seismic data; the photoelectric effect,porosity, and some elemental logs also display clear trends andcorrelations. Poor data quality below 2241 mbsl (881 mbsf) re-stricted interpretations beyond this depth. Clear resistivity peaksoccur at 2220.9, 2215.9, 2204.4, and 2191.7 mbsl (860.9, 855.9,844.4, and 831.7 mbsf) (Fig. 9). These peaks all correlate withgamma-ray troughs and density, velocity, and porosity log peaks.Peaks in gamma-ray logs and in the uranium content of thegamma-ray log occur at 2193.4-2196.4,2205.7-2210.7, and 2227.9-2234.9 mbsl (833.4-836.4, 845.7-850.7, and 867.9-874.9 mbsf). Asharp kick occurs in almost all logs at 2193.2 mbsl (833.2 mbsf) andis characterized by a sharp reduction in the gamma-ray log (Fig. 9)and silicon yield and increases in velocity, resistivity (Fig. 11), and
calcium yield. An isolated gamma-ray log peak and associatedelectric and sonic log troughs occur at 2170.5 mbsl (810.5 mbsf).The combination of all of the events allows the logs to be subdi-vided into nine units (Fig. 9).
Lithologic Interpretation
Intervals of high (>3-4 ohm-m) resistivity and low intervaltransit time indicate low porosity and permeability, and in theLower Cretaceous sections at Sites 763 and 762 are inter-preted (Fig. 9) to represent a compact limestone lithology atSites 762 (e.g., 2220.9, 2215.9, 2204.4, and 2291.7 mbsl; 860.9,855.9, 844.4, and 931.7 mbsf) and 763 (1991-2002, 2014-2017,and 2226-2228 mbsl; 623.5-634.5, 646.5-649.5, and 658.5-660.5 mbsf). This interpretation is supported by high photo-electric effect values, low gamma-ray, high density, and lowneutron porosity responses. Further confirmation is given byreference to recrystallized limestones in the cores, such asSection 122-762C-82X-2, 78-100 cm, and Cores 122-763B-48X, 122-763B-49X, and 122-763B-54X.
Above 2192.9 mbsl (832.9 mbsf) at Site 762 and 1923 mbsl(555.5 mbsf) at Site 763 the radioactive content of the sedi-ments as reflected in the gamma-ray log displays a markeddecrease (Fig. 9) associated with an increase in density,photoelectric effect, resistivity, and calcium yield. Theseproperties are consistent with a shift from clastic- to carbon-ate-dominated sedimentation. The sediments above 2192.9mbsl (832.2 mbsf) at Site 762 and above 1923 mbsl (555.5 mbsf)at Site 763 are therefore interpreted as mostly marls, chalks,and oozes whereas those below these depths are interpreted to
387

Gamma ray (API) Resistivity (ohm•m) Velocity (km/s) Lith r ,»c>0 10 20 30 40 0 1 2 3 1.4 1.8 2.2 2.6 unit 0 Gammaray (API) ^ Resistivity <ohm-m^ ^ ^ Velocity (km/s) L,.h
^ ^ ^ ^ f 1 ^ ^ ^ ^V IVB
^ ^ • •S ^ ^ ^ K "IB i B ^ L -
15oo-B ^? -H B —H ^p . i y B
BF ^ L ^ ^ ^ ^ o ^ C ^ ^ ^ f IVD
^ ^ t e 2 ^ ^ . Cenomanian Turoπian ^ B ^ ^ ^ ^
^ ^ L L . ù 8 1 ° - ^ * " boundary fl • P ^ fl B J T _
B^ L I ^^^ I ^^^^^_ J_. B , ^^*^^^ ^^ ivh
^F I^B. ^ • ^ ^ ^ ^ sillstone ^ ^ ^ v
B|r ^ ^ ^ ^ ^ E ^ ^ ^ 1 Barrow Delta ^ ^ ^ _ ^ ^ ^ ~^ P ^ ^ V ^ ^ ^ (silts, clays) ^ • f c ^ • — ^ ^ ^ ^ * "
^r ^E ^L. IVA v̂*1 ^> B
^K ^L. ^• ^K_ ^B ^k v
600-B ^P* ~fl ^r ~fl B ^L^to- ^ r IVB ^ ^ ^ ^ ^ ^ ^ ^ • ^ f
^^― I ^^― I B I K J 910-1 ' - ^ 1 -I 1Figure 11. Total gamma-ray, resistivity, and velocity logs for the interval from 400 to 910 mbsf (note scale change), Hole 762C. Also shown is the correlation of the logs to lithologic unitsdefined in Haq, von Rad, O'Connell, et al. (1990).

TRIASSIC-LOWER CRETACEOUS WIRELINE LOG DATA
Porosity (%) Bulk density (g/cm3)
20 70 1.4 1.8 2.2300-I ' • • I I J L_
400-
Q_CDD
500-
600-
610
710-
<r>Q
810-
910-
Porosity (%) Bulk density (%)
50 100 1.2 1.6 2.0 2.4I _L_ _l I L
Figure 12. Porosity (calculated from density) and bulk density for the interval from 300 to 910 mbsf, Hole 762C. Also shown is the correlationof the logs to lithologic units defined in Haq, von Rad, O'Connell, et al. (1990).
consist mostly of mud(stones) and sand(stones). The intervals2011-2018 and 2023-2028 mbsl (643.5-650.5 and 655.5-660.5mbsf) at Site 763 have a low gamma-ray response and a lowresistivity; industry logs from the adjacent Vinck-1 well alsoshow an increased interval transit time in these depth ranges.The lithology is interpreted to be unconsolidated sand. Corerecovery in this interval was poor, but those sedimentsexamined all contained a sand component.
The remainder of the sediments below the transition tomarls, chalks, and oozes at both sites are interpreted to bemudstones. Several intervals in this lithology contained par-ticularly high gamma-ray responses characterized by peaks inuranium content at Sites 762 (e.g., 2195, 2208, and 2230 mbsl;835, 848, and 876 mbsf) and 763 (1946, 1966, and 1986 mbsl;578.5, 598.5, and 618.5 mbsf). The intervals are interpreted asorganic-rich mudstones deposited under reducing conditions.These intervals in the core contain glauconite, zeolite, andbelemnite-rich mudstones, and the organic geochemistry indi-cated that most of the intervals that were sampled contain highlevels of organic carbon.
Correlation of Sites 762 and 763Reference to the clear gamma-ray peak associated with
the Cenomanian/Turonian boundary and to the distinctivelimestone units allows a confident correlation of the logs tocore depths. At Hole 763C the shipboard logs are between1.45 to 3.43 m higher than the core whereas at Hole 762B theshipboard seismic-stratigraphic logs are 2.9 m higher than
the core, the geochemical logs are 4.9 m higher, and thelithodensity logs are 1.5 m higher. The lithologic and logunits defined in the following can be used to correlatebetween Sites 762 and 763. These correlations again arebased mainly on corresponding resistivity and gamma logpeaks (Fig. 9). In particular, the black shale peaks in thegamma-ray log associated with Cenomanian/Turonianboundary can be correlated between sites, as can an un-named lower Aptian-Albian limestone. The characteristicseries of limestone peaks in the Barrow Group of Berriasianage can be seen at both sites, indicating that they are ofregional extent. Several of the gamma-ray peaks and thelong transitional unit between clastic and carbonate unitsobserved at Site 763 are missing at Site 762, indicating ahiatus from Late Hauterivian to Aptian may occur at this siteat the sharp kick seen at 2192.9 mbsl (832.9 mbsf).
Interpretation of Depositional Environments andRelative Sea Levels on the Exmouth Plateau
The log units and their characteristics at Sites 762 and 763suggest a broad pattern of terrigenous clastic deposition in adistal setting followed by a transition into a carbonate-domi-nated environment. This transition occurs sharply at 2192.9mbsl (832.9 mbsf), between units 7 and 12 at Site 762 and overa broader zone (unit 10) at Site 763. From the base of thelogged interval at Site 763 to 2011 mbsl (643.5 mbsf) theinterpreted lithology consists of interbedded muds, sands, andcemented sandstones and limestones. A similar lithology is
389
R. BOYD, A. BENT
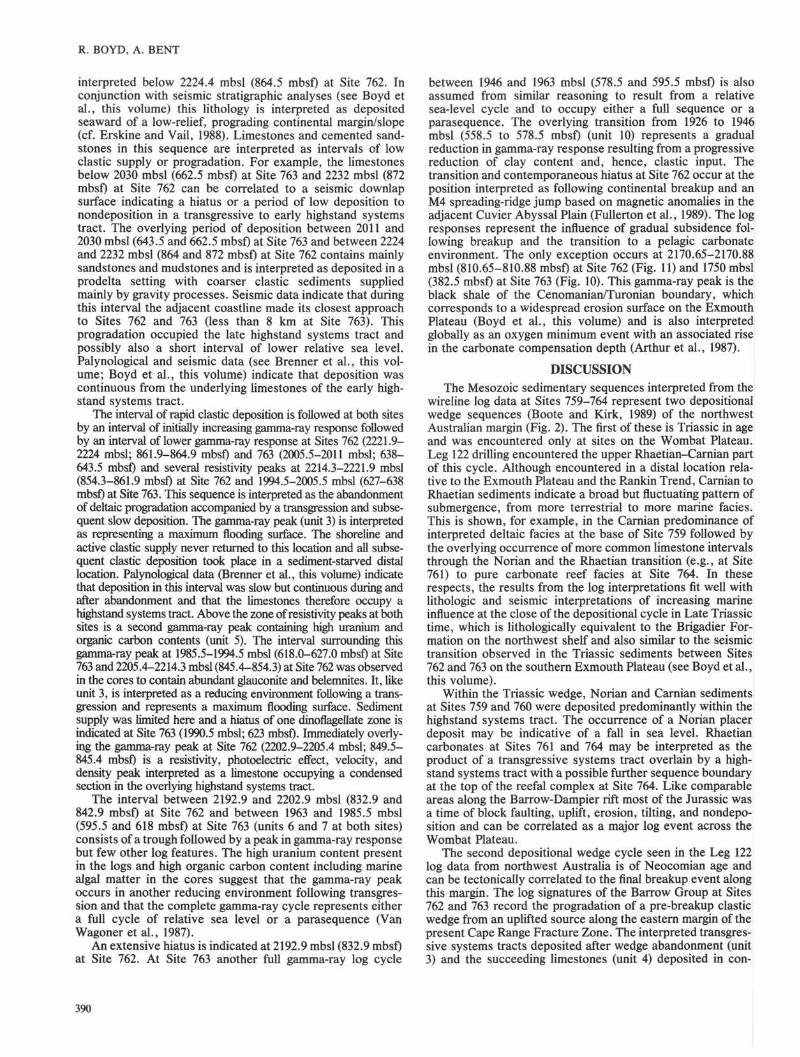
interpreted below 2224.4 mbsl (864.5 mbsf) at Site 762. Inconjunction with seismic stratigraphic analyses (see Boyd etal., this volume) this lithology is interpreted as depositedseaward of a low-relief, prograding continental margin/slope(cf. Erskine and Vail, 1988). Limestones and cemented sand-stones in this sequence are interpreted as intervals of lowclastic supply or progradation. For example, the limestonesbelow 2030 mbsl (662.5 mbsf) at Site 763 and 2232 mbsl (872mbsf) at Site 762 can be correlated to a seismic downlapsurface indicating a hiatus or a period of low deposition tonondeposition in a transgressive to early highstand systemstract. The overlying period of deposition between 2011 and2030 mbsl (643.5 and 662.5 mbsf) at Site 763 and between 2224and 2232 mbsl (864 and 872 mbsf) at Site 762 contains mainlysandstones and mudstones and is interpreted as deposited in aprodelta setting with coarser clastic sediments suppliedmainly by gravity processes. Seismic data indicate that duringthis interval the adjacent coastline made its closest approachto Sites 762 and 763 (less than 8 km at Site 763). Thisprogradation occupied the late highstand systems tract andpossibly also a short interval of lower relative sea level.Palynological and seismic data (see Brenner et al., this vol-ume; Boyd et al., this volume) indicate that deposition wascontinuous from the underlying limestones of the early high-stand systems tract.
The interval of rapid clastic deposition is followed at both sitesby an interval of initially increasing gamma-ray response followedby an interval of lower gamma-ray response at Sites 762 (2221.9—2224 mbsl; 861.9-864.9 mbsf) and 763 (2005.5-2011 mbsl; 638-643.5 mbsf) and several resistivity peaks at 2214.3-2221.9 mbsl(854.3-861.9 mbsf) at Site 762 and 1994.5-2005.5 mbsl (627-638mbsf) at Site 763. This sequence is interpreted as the abandonmentof deltaic progradation accompanied by a transgression and subse-quent slow deposition. The gamma-ray peak (unit 3) is interpretedas representing a maximum flooding surface. The shoreline andactive clastic supply never returned to this location and all subse-quent clastic deposition took place in a sediment-starved distallocation. Palynological data (Brenner et al., this volume) indicatethat deposition in this interval was slow but continuous during andafter abandonment and that the limestones therefore occupy ahighstand systems tract. Above the zone of resistivity peaks at bothsites is a second gamma-ray peak containing high uranium andorganic carbon contents (unit 5). The interval surrounding thisgamma-ray peak at 1985.5-1994.5 mbsl (618.0-627.0 mbsf) at Site763 and 2205.4-2214.3 mbsl (845.4-854.3) at Site 762 was observedin the cores to contain abundant glauconite and belemnites. It, likeunit 3, is interpreted as a reducing environment following a trans-gression and represents a maximum flooding surface. Sedimentsupply was limited here and a hiatus of one dinoflagellate zone isindicated at Site 763 (1990.5 mbsl; 623 mbsf). Immediately overly-ing the gamma-ray peak at Site 762 (2202.9-2205.4 mbsl; 849.5-845.4 mbsf) is a resistivity, photoelectric effect, velocity, anddensity peak interpreted as a limestone occupying a condensedsection in the overlying highstand systems tract.
The interval between 2192.9 and 2202.9 mbsl (832.9 and842.9 mbsf) at Site 762 and between 1963 and 1985.5 mbsl(595.5 and 618 mbsf) at Site 763 (units 6 and 7 at both sites)consists of a trough followed by a peak in gamma-ray responsebut few other log features. The high uranium content presentin the logs and high organic carbon content including marinealgal matter in the cores suggest that the gamma-ray peakoccurs in another reducing environment following transgres-sion and that the complete gamma-ray cycle represents eithera full cycle of relative sea level or a parasequence (VanWagoner et al., 1987).
An extensive hiatus is indicated at 2192.9 mbsl (832.9 mbsf)at Site 762. At Site 763 another full gamma-ray log cycle
between 1946 and 1963 mbsl (578.5 and 595.5 mbsf) is alsoassumed from similar reasoning to result from a relativesea-level cycle and to occupy either a full sequence or aparasequence. The overlying transition from 1926 to 1946mbsl (558.5 to 578.5 mbsf) (unit 10) represents a gradualreduction in gamma-ray response resulting from a progressivereduction of clay content and, hence, clastic input. Thetransition and contemporaneous hiatus at Site 762 occur at theposition interpreted as following continental breakup and anM4 spreading-ridge jump based on magnetic anomalies in theadjacent Cuvier Abyssal Plain (Fullerton et al., 1989). The logresponses represent the influence of gradual subsidence fol-lowing breakup and the transition to a pelagic carbonateenvironment. The only exception occurs at 2170.65-2170.88mbsl (810.65-810.88 mbsf) at Site 762 (Fig. 11) and 1750 mbsl(382.5 mbsf) at Site 763 (Fig. 10). This gamma-ray peak is theblack shale of the Cenomanian/Turonian boundary, whichcorresponds to a widespread erosion surface on the ExmouthPlateau (Boyd et al., this volume) and is also interpretedglobally as an oxygen minimum event with an associated risein the carbonate compensation depth (Arthur et al., 1987).
DISCUSSIONThe Mesozoic sedimentary sequences interpreted from the
wireline log data at Sites 759-764 represent two depositionalwedge sequences (Boote and Kirk, 1989) of the northwestAustralian margin (Fig. 2). The first of these is Triassic in ageand was encountered only at sites on the Wombat Plateau.Leg 122 drilling encountered the upper Rhaetian-Carnian partof this cycle. Although encountered in a distal location rela-tive to the Exmouth Plateau and the Rankin Trend, Carnian toRhaetian sediments indicate a broad but fluctuating pattern ofsubmergence, from more terrestrial to more marine facies.This is shown, for example, in the Carnian predominance ofinterpreted deltaic facies at the base of Site 759 followed bythe overlying occurrence of more common limestone intervalsthrough the Norian and the Rhaetian transition (e.g., at Site761) to pure carbonate reef facies at Site 764. In theserespects, the results from the log interpretations fit well withlithologic and seismic interpretations of increasing marineinfluence at the close of the depositional cycle in Late Triassictime, which is lithologically equivalent to the Brigadier For-mation on the northwest shelf and also similar to the seismictransition observed in the Triassic sediments between Sites762 and 763 on the southern Exmouth Plateau (see Boyd et al.,this volume).
Within the Triassic wedge, Norian and Carnian sedimentsat Sites 759 and 760 were deposited predominantly within thehighstand systems tract. The occurrence of a Norian placerdeposit may be indicative of a fall in sea level. Rhaetiancarbonates at Sites 761 and 764 may be interpreted as theproduct of a transgressive systems tract overlain by a high-stand systems tract with a possible further sequence boundaryat the top of the reefal complex at Site 764. Like comparableareas along the Barrow-Dampier rift most of the Jurassic wasa time of block faulting, uplift, erosion, tilting, and nondepo-sition and can be correlated as a major log event across theWombat Plateau.
The second depositional wedge cycle seen in the Leg 122log data from northwest Australia is of Neocomian age andcan be tectonically correlated to the final breakup event alongthis margin. The log signatures of the Barrow Group at Sites762 and 763 record the progradation of a pre-breakup clasticwedge from an uplifted source along the eastern margin of thepresent Cape Range Fracture Zone. The interpreted transgres-sive systems tracts deposited after wedge abandonment (unit3) and the succeeding limestones (unit 4) deposited in con-
390

TRIASSIC-LOWER CRETACEOUS WIRELINE LOG DATA
densed sections of late Berriasian-Valanginian age record theremoval of this major clastic source during the late Valangin-ian (M10) breakup event (Fullerton et al., 1989). The overlyingHauterivian interval of cyclic organic claystone depositionrecords the westward passage of the Greater India continentalblock along the southern transform margin of the ExmouthPlateau. The final transition to a carbonate-dominated envi-ronment is recorded in the decreasing gamma log trend fromlog unit 9 through unit 10 at Site 763 and follows the loss ofclastic sediment supply and the onset of subsidence as GreaterIndia cleared the Australian continent following the M4 ridgejump at the end of the Hauterivian (Fullerton et al., 1989). Inthis context, the transition to carbonate-dominated environ-ments on the southern Exmouth Plateau at the close of theNeocomian cycle is paralleled by the Early Cretaceous trans-gression on the Wombat Plateau. On the Wombat Plateau thistransgression is recorded as a major log unconformity and isrepresented as a reworked shoreface sandstone at Site 761which passes upward into marine sediments that represent theeventual transition to a permanently deep marine setting. Likethe southern Exmouth Plateau, the transition here is alsorepresented by a upward-diminishing gamma log trend reflect-ing gradual deepening during post-rift subsidence and theremoval of the clastic supply source.
CONCLUSIONS
1. Detailed correlation of log units, lithologic interpreta-tions, and depositional systems tracts was possible at theExmouth Plateau sites. Results indicate clastic sedimentationof sandstones and mudstones, followed by abandonmentindicated by limestones and organic mudstones, and thensubsidence and transition to limestones, chalks, and oozes ofa deep-water marine environment.
2. Correlation of the sites on the Wombat Plateau is difficultfrom log analysis alone. Log correlations can be tied at the topTriassic unconformity with additional possible correlations ofNorian limestone and radioactive sandstone events betweenSites 759 and 760. Relative sea-level interpretations mayenable broad facies correlations at Sites 761 and 764.
3. Wireline log data from the Exmouth and Wombatplateaus document two tectonic depositional cycles on thenorthwest Australian margin. The first is Late Triassic in ageand followed a Permian rifting event. It was encountered onlyon the Wombat Plateau. The second is Early Cretaceous,documents a continental breakup event, and can be identifiedon both the Wombat and Exmouth plateaus. Superimposed onthe large tectonic events are cycles of shorter duration reflect-ing sea-level oscillations and fluctuations in sediment supply.
4. The post-breakup rift to drift transition is everywheredocumented by an upward-decreasing gamma log trend re-flecting the reduction and removal of clastic supply followedby a transition to carbonate deposition. This occurs both inthe Norian-Rhaetian part of the Triassic cycle and the Neo-comian- Aptian part of the Cretaceous cycle.
ACKNOWLEDGMENTSWe would like to acknowledge the assistance given in data
collection while at sea on the JOIDES Resolution by the crewand the ODP technical and logistics personnel and in particu-lar for the help given by D. Hsieu (Schlumberger), R. Wilkens,
and X. Golovchenko (LDGO). We would also like to acknowl-edge the drafting assistance provided at British Petroleum(Glasgow), funding provided by a Canadian NSERC CSPgrant to RB, an Alexander von Humboldt Fellowship pro-vided to RB, and facilities provided by Geomar Institute, Kiel,FRG, while RB was on sabbatical leave.
REFERENCES
Arthur, M. A., Schlanger, S. O., and Jenkyns, H. C , 1987. TheCenomanian-Turonian oceanic anoxic event, II. Paleoceano-graphic controls on organic-matter production and preservation.In Brooks, J., and Fleet, A. J. (Eds.), Marine Petroleum SourceRocks. Geol. Soc. Spec. Publ. London, 26:401-420.
Audley-Charles, M. G., 1988. Evolution of the southern margin ofTethys (North Australian region) from early Permian to LateCretaceous. In Audley-Charles, M. G., and Hallam, A. (Eds.),Gondwana and Tethys: Geol. Soc. Spec. Publ. London, 37:79-100.
Barber, P. M., 1982. Paleotectonic evolution and hydrocarbon gener-ation of the central Exmouth Plateau. APEA J., 22:131-134.
Boote, D.R.D., and Kirk, R. B., 1989. Depositional wedge cycles onan evolving plate margin, western and northwestern Australia.AAPGBull., 73:216-243.
Erskine, R. D., and Vail, P. R., 1988. Seismic stratigraphy of theExmouth Plateau. In Bally, A. W. (Ed.), Atlas of Seismic Stratig-raphy. AAPG Stud, in Geol., 27:163-173.
Exon, N. F., von Rad, U., and von Stackelberg, U., 1982. Thegeological development of the passive margins of the ExmouthPlateau off northwest Australia. Mar. Geol., 47:131-152.
Exon, N. F., and Willcox, J. B., 1980. The Exmouth Plateau:stratigraphy, structure and petroleum potential. Bull. Bur. Miner.Resour. Geol. Geophys. Aust., 199.
Fullerton, L. G., Sager, W. W., and Handschumacher, D. W., 1989.Late Jurassic-Early Cretaceous evolution of the eastern IndianOcean adjacent to northwest Australia. J. Geophys. Res.,94:2937-2953.
Haq, B. U., Hardenbol, J., and Vail, P. R., 1987. Chronology offluctuating sea levels since the Triassic. Science, 235:1156-1167.
Haq, B. U., von Rad, U., O'Connell, S., et al., 1990. Proc. ODP, Init.Repts., 122: College Station, TX (Ocean Drilling Program).
Rider, M. H., 1986. The Geological Interpretation of Well Logs:London (Blackie/Halstead Press).
Vail, P. R., 1987. Seismic stratigraphy interpretation utilizing se-quence stratigraphy. In Bally, A. W. (Ed.), Atlas of SeismicStratigraphy. AAPG Stud. Geol., 27(2): 1-10.
Van Wagoner, J. C , Mitchum, R. M., Jr., Posamentier, H. W., andVail, P. R., 1987. Key definitions of sequence stratigraphy. InBally, A. W. (Ed.), Atlas of Seismic Stratigraphy. AAPG Stud.Geol., 27(2): 11-14.
von Rad, U., and Exon, N. F., 1983. Mesozoic-Cenozoic sedimentaryand volcanic evolution of the starved passive continental margin offnorthwest Australia. In Watkins, J. S., and Drake, C. L. (Eds.),Studies in Continental Margin Geology: AAPG Mem., 34:253-281.
von Rad, U., Thurow, J., Haq, B. U., Gradstein, F., Ludden, J., andODP Leg 122/123 Shipboard Scientific Parties, 1989. Triassic toCenozoic evolution of the NW Australian continental margin andthe birth of the Indian Ocean (preliminary results of ODP Legs 122and 123). Geol. Rundsch., 78:1189-1210.
Williamson, P. E., and Falvey, D. A., 1988. Preliminary post-cruisereport, Rig Seismic research cruises 7 and 8: deep seismic struc-ture of the Exmouth Plateau. BMR Geol. Geophys. Rec, 1988/31.
Date of initial receipt: 30 May 1990Date of acceptance: 9 May 1991Ms 122B-119
391