
2.1 Populations and Resources - htscience.wikispaces.com populations and... · Chapter 2...
7
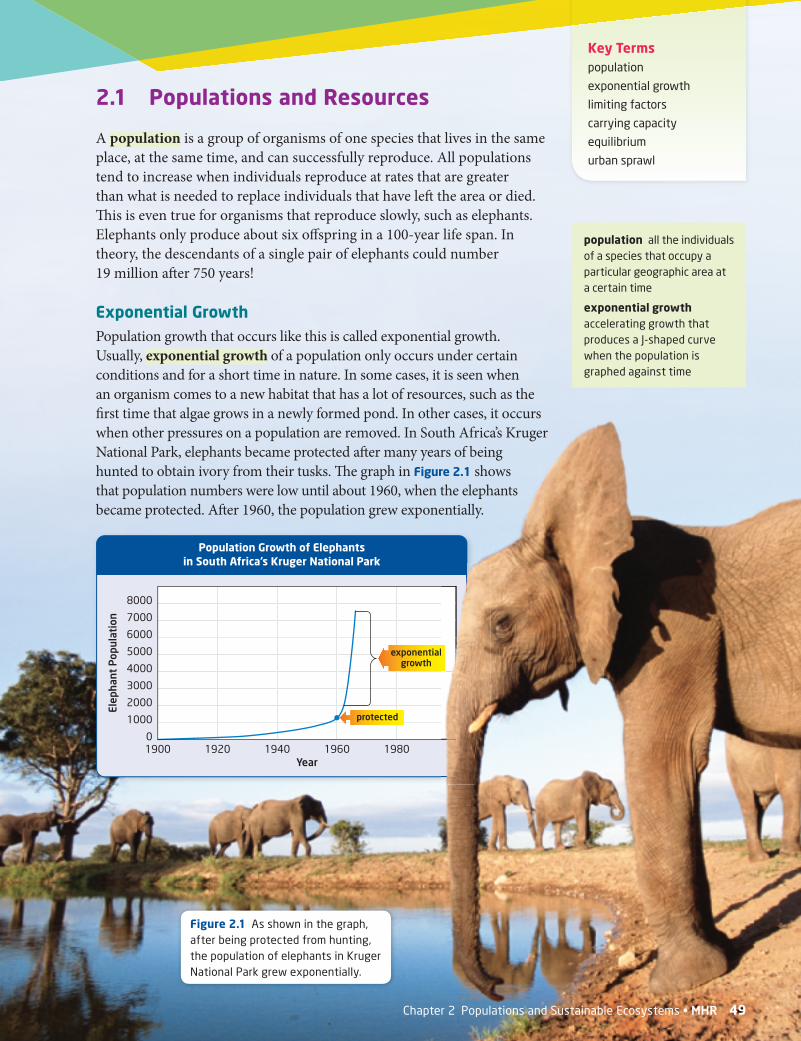
Elephant Population Year 8000 7000 6000 5000 4000 3000 2000 1000 0 1920 1900 1940 1960 1980 Population Growth of Elephants in South Africa’s Kruger National Park exponential growth protected 2.1 Populations and Resources A population is a group of organisms of one species that lives in the same place, at the same time, and can successfully reproduce. All populations tend to increase when individuals reproduce at rates that are greater than what is needed to replace individuals that have leſt the area or died. is is even true for organisms that reproduce slowly, such as elephants. Elephants only produce about six offspring in a 100-year life span. In theory, the descendants of a single pair of elephants could number 19 million aſter 750 years! Exponential Growth Population growth that occurs like this is called exponential growth. Usually, exponential growth of a population only occurs under certain conditions and for a short time in nature. In some cases, it is seen when an organism comes to a new habitat that has a lot of resources, such as the first time that algae grows in a newly formed pond. In other cases, it occurs when other pressures on a population are removed. In South Africa’s Kruger National Park, elephants became protected aſter many years of being hunted to obtain ivory from their tusks. e graph in Figure 2.1 shows that population numbers were low until about 1960, when the elephants became protected. Aſter 1960, the population grew exponentially. population all the individuals of a species that occupy a particular geographic area at a certain time exponential growth accelerating growth that produces a J-shaped curve when the population is graphed against time Figure 2.1 As shown in the graph, after being protected from hunting, the population of elephants in Kruger National Park grew exponentially. Key Terms population exponential growth limiting factors carrying capacity equilibrium urban sprawl Chapter 2 Populations and Sustainable Ecosystems • MHR 49
Transcript of 2.1 Populations and Resources - htscience.wikispaces.com populations and... · Chapter 2...
Elep
hant
Pop
ulat
ion
Year
8000
7000
6000
5000
4000
3000
2000
1000
019201900 1940 1960 1980
Population Growth of Elephantsin South Africa’s Kruger National Park
exponentialgrowth
protected
2.1 Populations and Resources
A population is a group of organisms of one species that lives in the same place, at the same time, and can successfully reproduce. All populations tend to increase when individuals reproduce at rates that are greater than what is needed to replace individuals that have left the area or died. Th is is even true for organisms that reproduce slowly, such as elephants. Elephants only produce about six off spring in a 100-year life span. In theory, the descendants of a single pair of elephants could number 19 million aft er 750 years!
Exponential GrowthPopulation growth that occurs like this is called exponential growth. Usually, exponential growth of a population only occurs under certain conditions and for a short time in nature. In some cases, it is seen when an organism comes to a new habitat that has a lot of resources, such as the fi rst time that algae grows in a newly formed pond. In other cases, it occurs when other pressures on a population are removed. In South Africa’s Kruger National Park, elephants became protected aft er many years of being hunted to obtain ivory from their tusks. Th e graph in Figure 2.1 shows that population numbers were low until about 1960, when the elephants became protected. Aft er 1960, the population grew exponentially.
population all the individuals of a species that occupy a particular geographic area at a certain time
exponential growth accelerating growth that produces a J-shaped curve when the population is graphed against time
Figure 2.1 As shown in the graph, after being protected from hunting, the population of elephants in Kruger National Park grew exponentially.
Key Termspopulation
exponential growth
limiting factors
carrying capacity
equilibrium
urban sprawl
Chapter 2 Populations and Sustainable Ecosystems • MHR 49
048-085_Ch02_MACS09.indd 2048-085_Ch02_MACS09.indd 2 4/8/09 2:40:31 PM4/8/09 2:40:31 PM
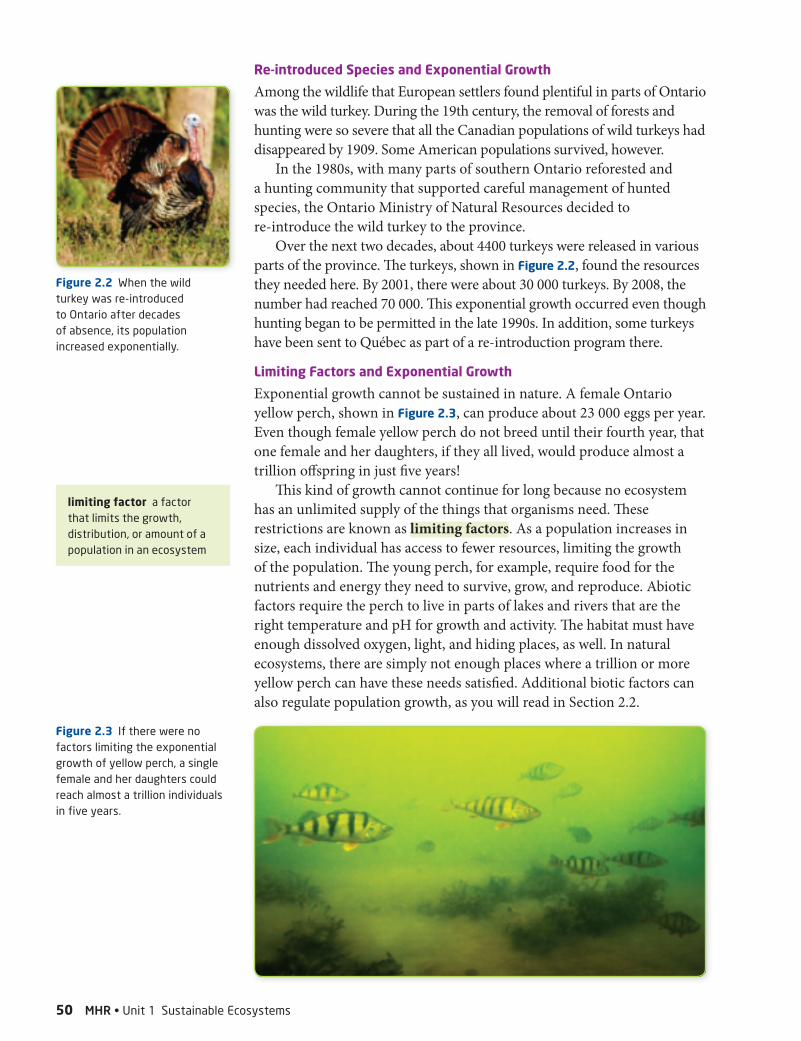
Figure 2.2 When the wild turkey was re-introduced to Ontario after decades of absence, its population increased exponentially.
Re-introduced Species and Exponential Growth
Among the wildlife that European settlers found plentiful in parts of Ontario was the wild turkey. During the 19th century, the removal of forests and hunting were so severe that all the Canadian populations of wild turkeys had disappeared by 1909. Some American populations survived, however.
In the 1980s, with many parts of southern Ontario reforested and a hunting community that supported careful management of hunted species, the Ontario Ministry of Natural Resources decided to re-introduce the wild turkey to the province.
Over the next two decades, about 4400 turkeys were released in various parts of the province. Th e turkeys, shown in Figure 2.2, found the resources they needed here. By 2001, there were about 30 000 turkeys. By 2008, the number had reached 70 000. Th is exponential growth occurred even though hunting began to be permitted in the late 1990s. In addition, some turkeys have been sent to Québec as part of a re-introduction program there.
Limiting Factors and Exponential Growth
Exponential growth cannot be sustained in nature. A female Ontario yellow perch, shown in Figure 2.3, can produce about 23 000 eggs per year. Even though female yellow perch do not breed until their fourth year, that one female and her daughters, if they all lived, would produce almost a trillion off spring in just fi ve years!
Th is kind of growth cannot continue for long because no ecosystem has an unlimited supply of the things that organisms need. Th ese restrictions are known as limiting factors. As a population increases in size, each individual has access to fewer resources, limiting the growth of the population. Th e young perch, for example, require food for the nutrients and energy they need to survive, grow, and reproduce. Abiotic factors require the perch to live in parts of lakes and rivers that are the right temperature and pH for growth and activity. Th e habitat must have enough dissolved oxygen, light, and hiding places, as well. In natural ecosystems, there are simply not enough places where a trillion or more yellow perch can have these needs satisfi ed. Additional biotic factors can also regulate population growth, as you will read in Section 2.2.
limiting factor a factor that limits the growth, distribution, or amount of a population in an ecosystem
Figure 2.3 If there were no factors limiting the exponential growth of yellow perch, a single female and her daughters could reach almost a trillion individuals in five years.
50 MHR • Unit 1 Sustainable Ecosystems
048-085_Ch02_MACS09.indd 3048-085_Ch02_MACS09.indd 3 4/8/09 2:41:00 PM4/8/09 2:41:00 PM
Learning Check
1. When do populations tend to increase?
2. Why did the re-introduced turkey population in Ontario grow exponentially?
3. List three examples of limiting factors.
4. Occasionally, humans are put in situations in which their resources are limited. In the summer of 2003, eastern North America experienced a sustained power failure. What resources do you think became quickly limited?
Carrying CapacityCarrying capacity is the size of a population that can be supported indefi nitely by the resources and services of a given ecosystem. Beyond this carrying capacity, no additional individuals can be supported, at least not for long. When a population is maintained at its carrying capacity, the size of the population is at an equilibrium, or balance. In a given time period, there is a balance between the number of individuals that are added to the population and the number of individuals that leave or die.
When one of the necessary resources is being used at a rate that exceeds the carrying capacity of the ecosystem, the population will drop to a natural equilibrium. Th e limiting resource might be food, but it could also be an abiotic factor. For example, polar bears need pack ice on which to hunt, lake trout need rocky lake bottoms on which to lay eggs, and the fl ying squirrels in Figure 2.4 need holes in trees as a place to roost.
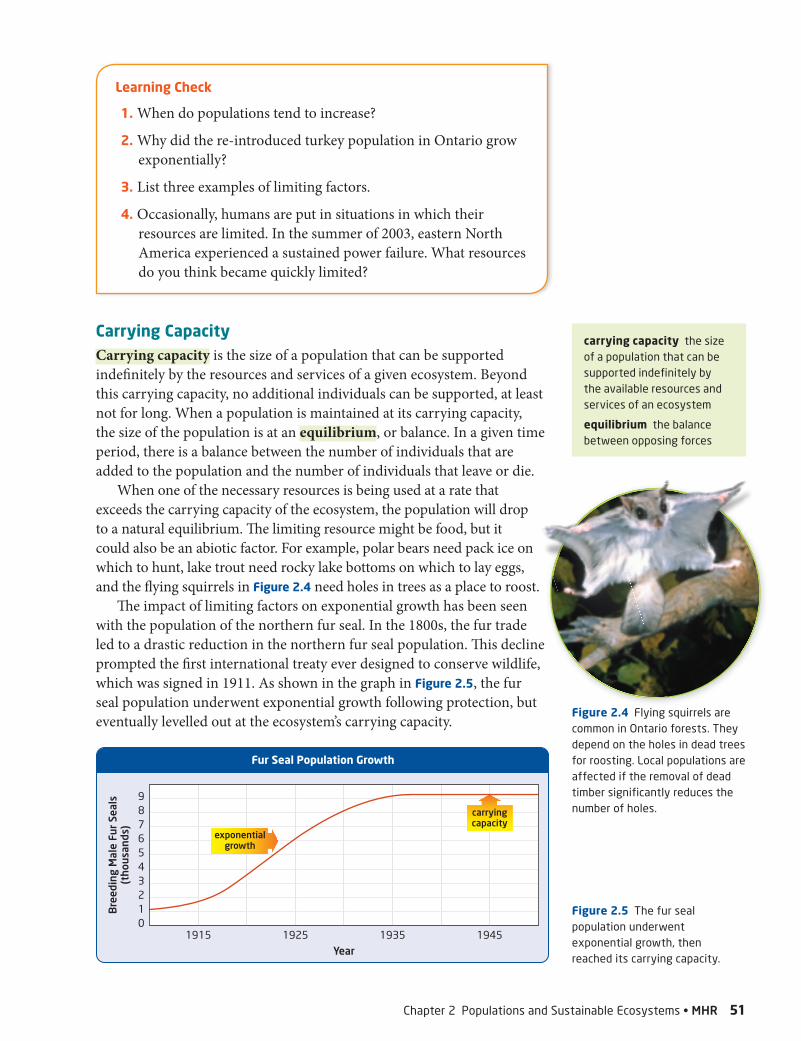
Th e impact of limiting factors on exponential growth has been seen with the population of the northern fur seal. In the 1800s, the fur trade led to a drastic reduction in the northern fur seal population. Th is decline prompted the fi rst international treaty ever designed to conserve wildlife, which was signed in 1911. As shown in the graph in Figure 2.5, the fur seal population underwent exponential growth following protection, but eventually levelled out at the ecosystem’s carrying capacity.
carrying capacity the size of a population that can be supported indefi nitely by the available resources and services of an ecosystem
equilibrium the balance between opposing forces
Bre
edin
g M
ale
Fur
Seal
s(t
hous
ands
)
9876543210
1915 1925 1935 1945
Fur Seal Population Growth
Year
exponentialgrowth
carryingcapacity
Figure 2.5 The fur seal population underwent exponential growth, then reached its carrying capacity.
Figure 2.4 Flying squirrels are common in Ontario forests. They depend on the holes in dead trees for roosting. Local populations are affected if the removal of dead timber significantly reduces the number of holes.
Chapter 2 Populations and Sustainable Ecosystems • MHR 51
048-085_Ch02_MACS09.indd 4048-085_Ch02_MACS09.indd 4 4/8/09 2:41:12 PM4/8/09 2:41:12 PM
How have bird populations changed over the years? To make sure that a population is sustainable, wildlife managers and sometimes citizens do surveys to fi nd out if the population is in equilibrium, growing, or declining. In this activity, you will graph and analyze the results of surveys for three species.
Barrie, Ontario Bird Count: 1983 to 2007
Year Downy Woodpecker
Mourning Dove
Ruffed Grouse
1983 26 14 13
1985 27 119 14
1987 37 124 11
1989 35 211 11
1991 40 247 5
1993 29 242 2
1995 29 325 4
1997 50 190 3
1999 29 264 6
2001 24 402 5
2003 16 182 4
2005 38 416 2
2007 36 226 9
Materials
• 3 pieces of graph paper • ruler
Procedure 1. Plot the data for the survey results on three pieces of
graph paper (one per species). Determine the proper scale for each graph.
2. Draw a line of best fi t to estimate the pattern of the data.
3. Using the line of best fi t, extrapolate to the year 2020.
Questions 1. Describe the population growth of each species using
the terms “increasing,” “decreasing,” and “equilibrium.”
2. Identify two factors that could affect the declining species in this area.
3. Identify two factors that could affect the increasing species in this area.
4. In the 2006 Canadian census, Barrie was found to be the fastest-growing city in Canada. Does this information change the answers you gave for questions 2 and 3? Explain.
5. Is extrapolation using a straight line likely to be reliable for many decades in the future? Why or why not?
Human Activities and Carrying Capacity
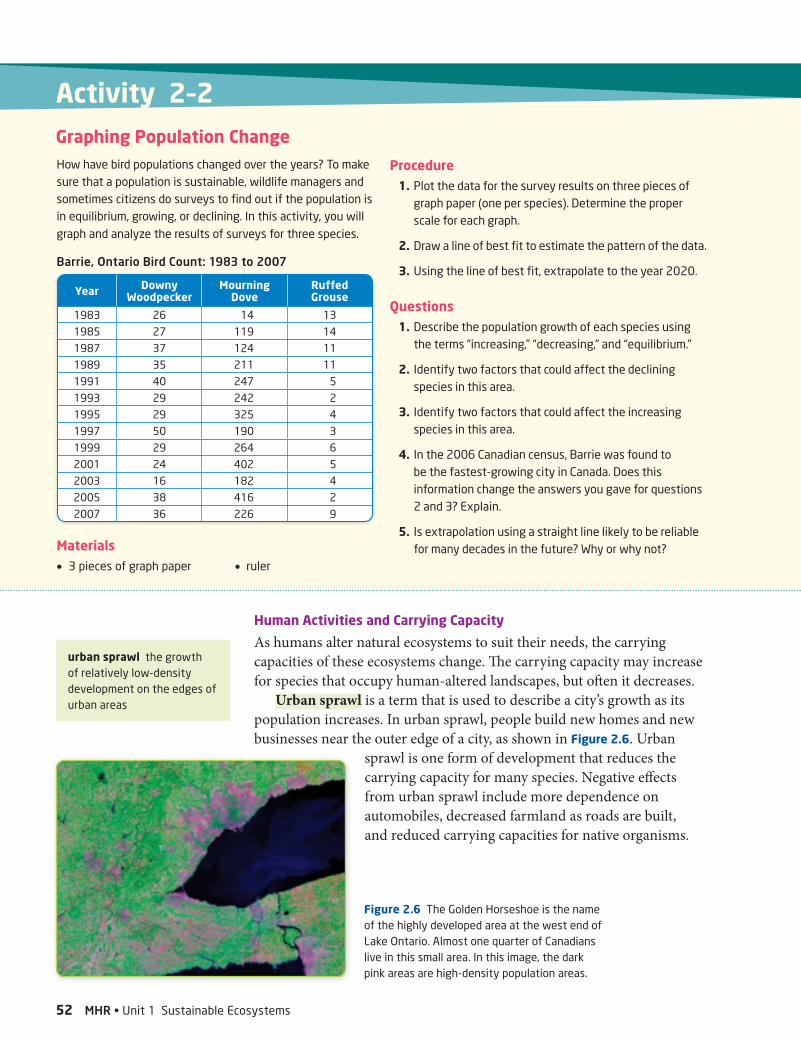
As humans alter natural ecosystems to suit their needs, the carrying capacities of these ecosystems change. Th e carrying capacity may increase for species that occupy human-altered landscapes, but oft en it decreases.
Urban sprawl is a term that is used to describe a city’s growth as its population increases. In urban sprawl, people build new homes and new businesses near the outer edge of a city, as shown in Figure 2.6. Urban
sprawl is one form of development that reduces the carrying capacity for many species. Negative eff ects from urban sprawl include more dependence on automobiles, decreased farmland as roads are built, and reduced carrying capacities for native organisms.
urban sprawl the growth of relatively low-density development on the edges of urban areas
Activity 2–2Graphing Population Change
Figure 2.6 The Golden Horseshoe is the name of the highly developed area at the west end of Lake Ontario. Almost one quarter of Canadians live in this small area. In this image, the dark pink areas are high-density population areas.
52 MHR • Unit 1 Sustainable Ecosystems
048-085_Ch02_MACS09.indd 52048-085_Ch02_MACS09.indd 52 4/8/09 3:57:43 PM4/8/09 3:57:43 PM
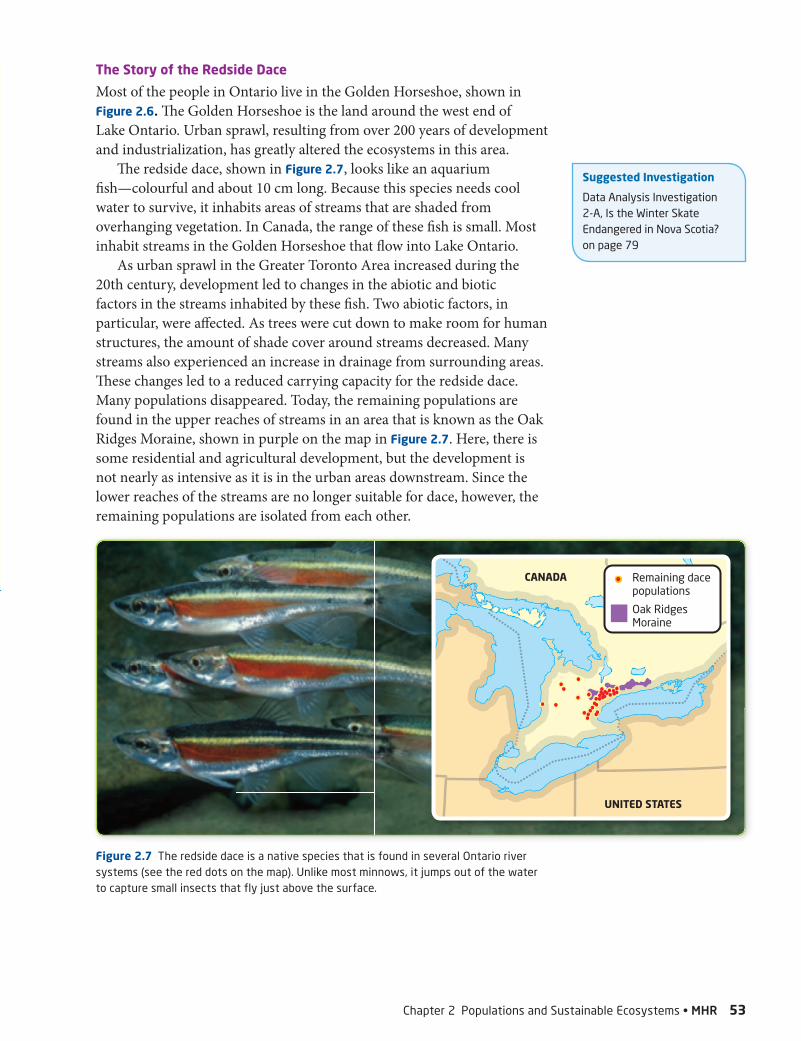
The Story of the Redside Dace
Most of the people in Ontario live in the Golden Horseshoe, shown in Figure 2.6. Th e Golden Horseshoe is the land around the west end of Lake Ontario. Urban sprawl, resulting from over 200 years of development and industrialization, has greatly altered the ecosystems in this area.
Th e redside dace, shown in Figure 2.7, looks like an aquarium fi sh—colourful and about 10 cm long. Because this species needs cool water to survive, it inhabits areas of streams that are shaded from overhanging vegetation. In Canada, the range of these fi sh is small. Most inhabit streams in the Golden Horseshoe that fl ow into Lake Ontario.
As urban sprawl in the Greater Toronto Area increased during the 20th century, development led to changes in the abiotic and biotic factors in the streams inhabited by these fi sh. Two abiotic factors, in particular, were aff ected. As trees were cut down to make room for human structures, the amount of shade cover around streams decreased. Many streams also experienced an increase in drainage from surrounding areas. Th ese changes led to a reduced carrying capacity for the redside dace. Many populations disappeared. Today, the remaining populations are found in the upper reaches of streams in an area that is known as the Oak Ridges Moraine, shown in purple on the map in Figure 2.7. Here, there is some residential and agricultural development, but the development is not nearly as intensive as it is in the urban areas downstream. Since the lower reaches of the streams are no longer suitable for dace, however, the remaining populations are isolated from each other.
CANADA
UNITED STATES
Remaining dacepopulations
Oak RidgesMoraine
Figure 2.7 The redside dace is a native species that is found in several Ontario river systems (see the red dots on the map). Unlike most minnows, it jumps out of the water to capture small insects that fly just above the surface.
Suggested Investigation
Data Analysis Investigation 2-A, Is the Winter Skate Endangered in Nova Scotia? on page 79
Chapter 2 Populations and Sustainable Ecosystems • MHR 53
048-085_Ch02_MACS09.indd 53048-085_Ch02_MACS09.indd 53 4/10/09 1:26:05 PM4/10/09 1:26:05 PM
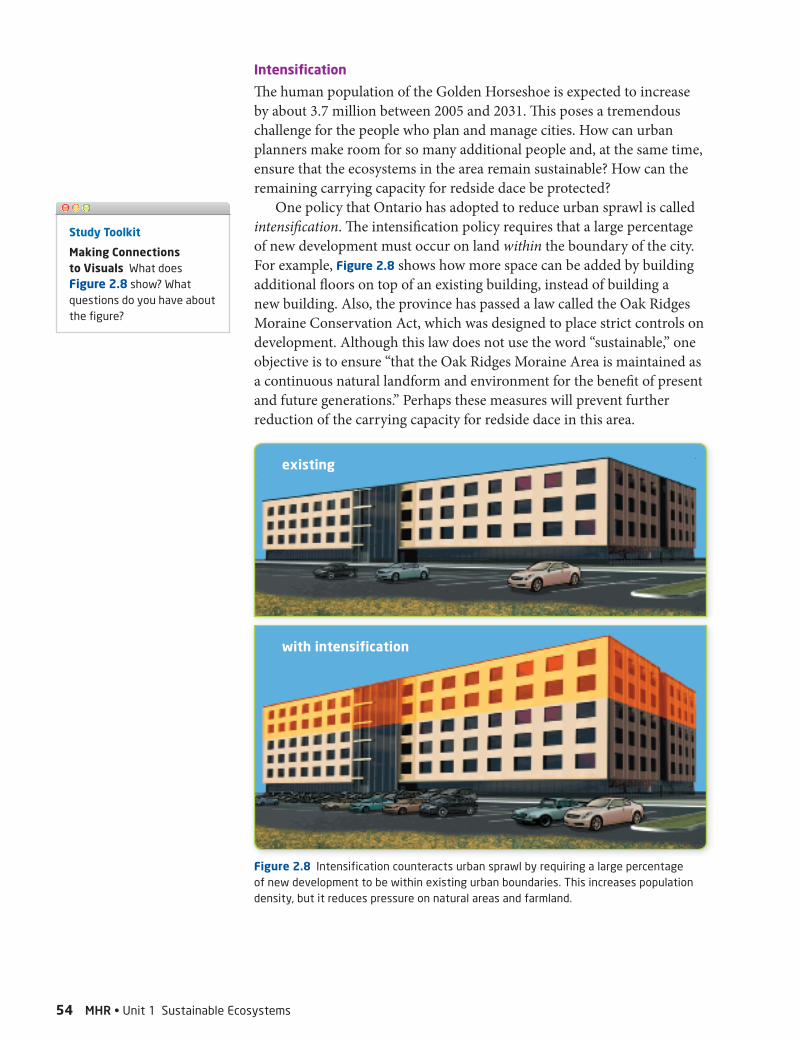
Intensifi cation
Th e human population of the Golden Horseshoe is expected to increase by about 3.7 million between 2005 and 2031. Th is poses a tremendous challenge for the people who plan and manage cities. How can urban planners make room for so many additional people and, at the same time, ensure that the ecosystems in the area remain sustainable? How can the remaining carrying capacity for redside dace be protected?
One policy that Ontario has adopted to reduce urban sprawl is called intensifi cation. Th e intensifi cation policy requires that a large percentage of new development must occur on land within the boundary of the city. For example, Figure 2.8 shows how more space can be added by building additional fl oors on top of an existing building, instead of building a new building. Also, the province has passed a law called the Oak Ridges Moraine Conservation Act, which was designed to place strict controls on development. Although this law does not use the word “sustainable,” one objective is to ensure “that the Oak Ridges Moraine Area is maintained as a continuous natural landform and environment for the benefi t of present and future generations.” Perhaps these measures will prevent further reduction of the carrying capacity for redside dace in this area.
Figure 2.8 Intensification counteracts urban sprawl by requiring a large percentage of new development to be within existing urban boundaries. This increases population density, but it reduces pressure on natural areas and farmland.
Study Toolkit
Making Connections to Visuals What does Figure 2.8 show? What questions do you have about the fi gure?
existing
with intensification
54 MHR • Unit 1 Sustainable Ecosystems
048-085_Ch02_MACS09.indd 7048-085_Ch02_MACS09.indd 7 4/8/09 2:42:01 PM4/8/09 2:42:01 PM
Section 2.1 Review
Section Summary
• Populations tend to increase exponentially when there are available resources.
• When resources that are needed by populations become limited, the carrying capacity of an ecosystem has been reached.
• Human alterations of an ecosystem, such as through urban sprawl, oft en reduce the carrying capacity of the ecosystem for other species.
Review Questions
K/U 1. Explain why exponential growth is not sustainable in nature.
K/U 2. How would the removal of dead timber from an area aff ect the carrying capacity for fl ying squirrels?
A 3. Some whiptail lizard populations have no males because the females only produce daughters. If one of these whiptail lizards produces 10 daughters per year, and these daughters breed aft er one year, how many whiptails will there be aft er two years? (Assume that no lizards die or move to other areas.)
K/U 4. Identify two factors that limited the growth of the redside dace, and describe how they limited its growth. Th en identify one other factor, not mentioned in the section, and describe how it could limit the growth of this species.
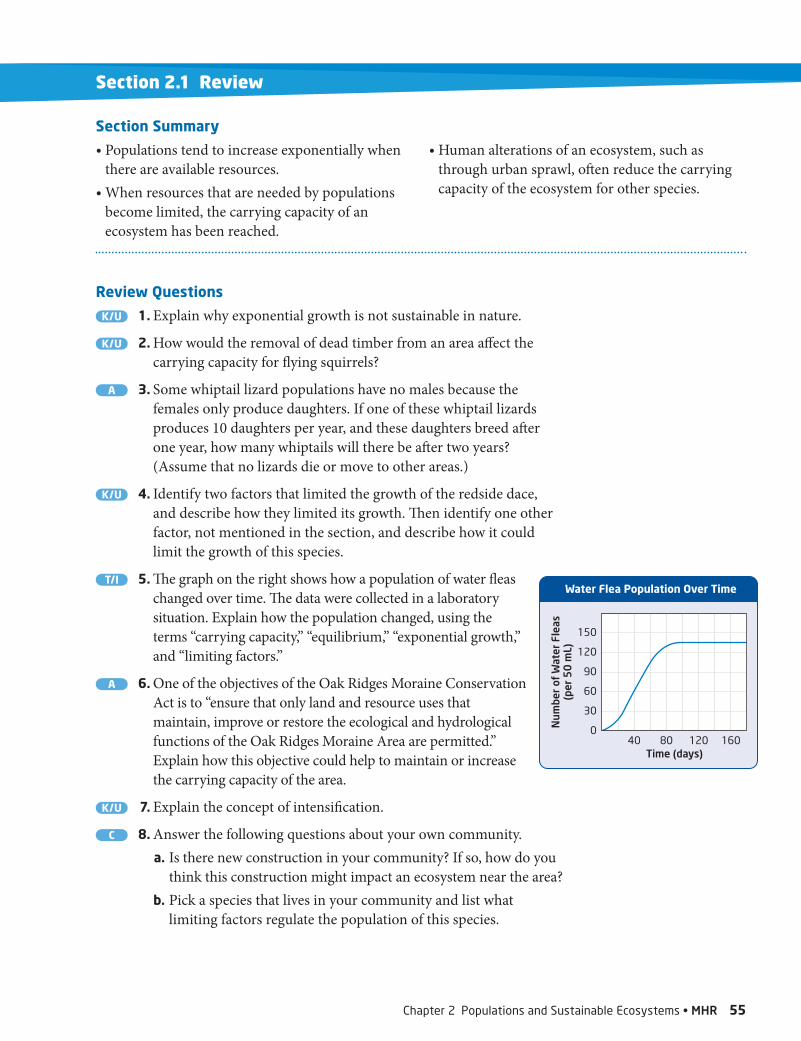
T/I 5. Th e graph on the right shows how a population of water fl eas changed over time. Th e data were collected in a laboratory situation. Explain how the population changed, using the terms “carrying capacity,” “equilibrium,” “exponential growth,” and “limiting factors.”
A 6. One of the objectives of the Oak Ridges Moraine Conservation Act is to “ensure that only land and resource uses that maintain, improve or restore the ecological and hydrological functions of the Oak Ridges Moraine Area are permitted.” Explain how this objective could help to maintain or increase the carrying capacity of the area.
K/U 7. Explain the concept of intensifi cation.
C 8. Answer the following questions about your own community. a. Is there new construction in your community? If so, how do you
think this construction might impact an ecosystem near the area? b. Pick a species that lives in your community and list what
limiting factors regulate the population of this species.
Num
ber
of W
ater
Fle
as(p
er 5
0 m
L)
150
120
90
60
30
040 80 120 160
Water Flea Population Over Time
Time (days)
Chapter 2 Populations and Sustainable Ecosystems • MHR 55
048-085_Ch02_MACS09.indd 8048-085_Ch02_MACS09.indd 8 4/8/09 2:42:05 PM4/8/09 2:42:05 PM
![Stroke [uncensored] - by MHR Corporation](https://static.fdocuments.in/doc/165x107/554b58f0b4c905e9388b4e5a/stroke-uncensored-by-mhr-corporation.jpg)