2.1 Functions and Their Graphs What you should learn: Goal1 Goal2 Represent relations and functions....
84
2.1 Functions and Their Graphs What you should learn: Goal Goal 1 1 Goal Goal 2 2 Represent relations and functions. Graph and evaluate linear functions. 2.1 Functions and Their Graphs 2.1 Functions and Their Graphs
-
Upload
edith-bates -
Category
Documents
-
view
219 -
download
1
Transcript of 2.1 Functions and Their Graphs What you should learn: Goal1 Goal2 Represent relations and functions....

2.12.1 Functions and Their Graphs
What you should learn:GoalGoal 11
GoalGoal 22
Represent relations and functions.
Graph and evaluate linear functions.
2.1 Functions and Their Graphs2.1 Functions and Their Graphs

x -2 -1 0 1 2
12 xy -3 -1 1 3 5
graph 12 xyconstruct a table of values
Now, let’s write ordered pairs, and graph.
The ordered pairs are
(-2, -3), (-1, -1), (0, 1), (1, 3), 2, 5)
Plot these points on a coordinate plane.
And draw the line.


x -2 -1 0 1 2
13
2 xy
graph 13
2 xy
construct a table of values
Now, let’s write ordered pairs, and graph.
Graph the linear equation. Select integers for x, starting with -2 and ending with 2. Organize you work in a table.
3
7
3
5 1
3
1
3
1

The ordered pairs are
Plot these points on a coordinate plane.
And draw the line.
3
1,2,
3
1,1,1,0,
3
5,1,
3
7,2
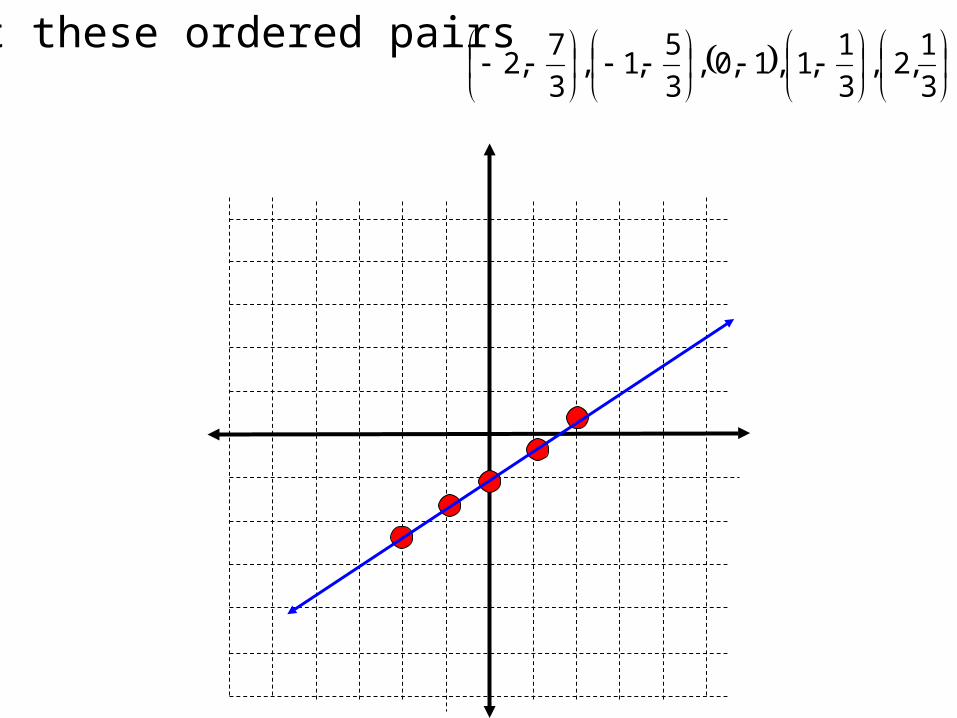
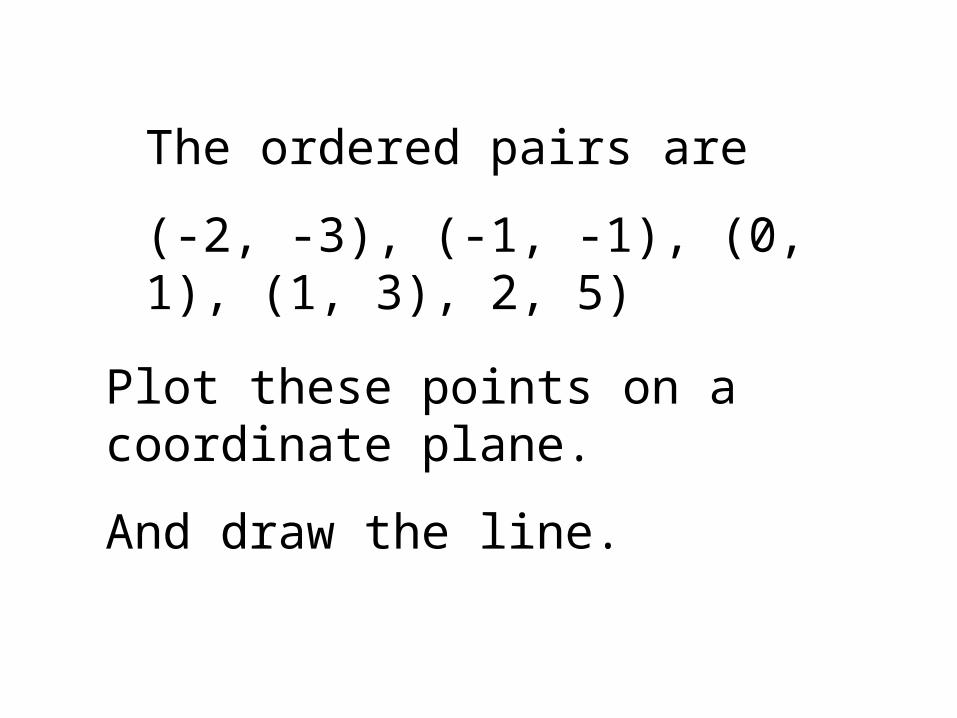
Plot these ordered pairs
3
1,2,
3
1,1,1,0,
3
5,1,
3
7,2
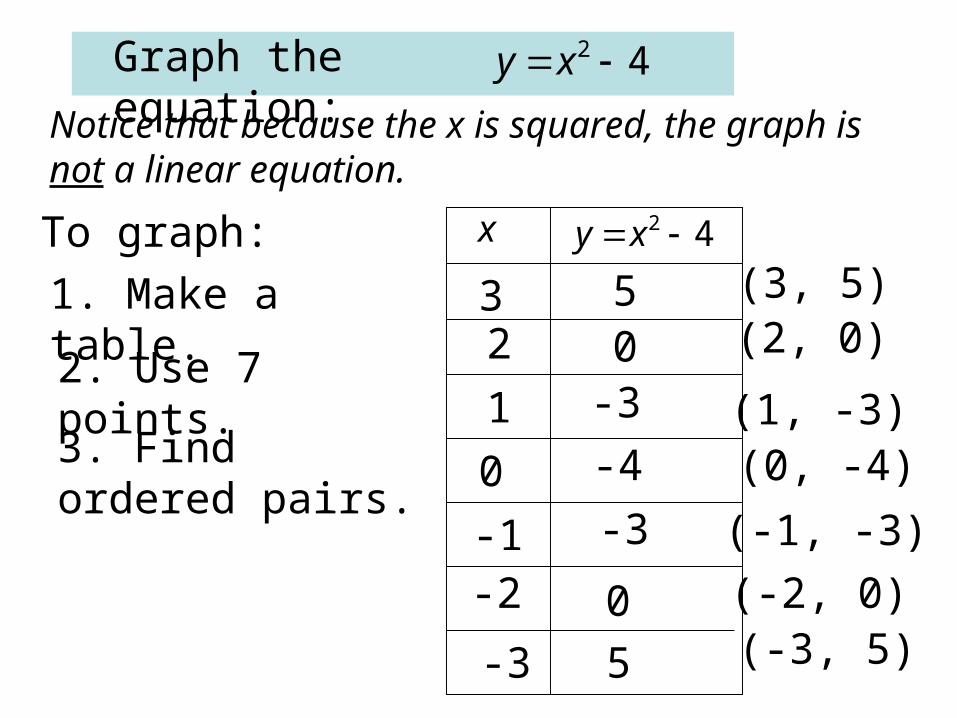
Graph the equation: 42 xy
Notice that because the x is squared, the graph is not a linear equation.
To graph:
1. Make a table.
2. Use 7 points.
3. Find ordered pairs.
x 42 xy
0
-1-2
-3
1
23 5
0-3
-4
-3
0
5
(3, 5)(2, 0)
(1, -3)(0, -4)
(-1, -3)
(-2, 0)(-3, 5)

(3, 5)(2, 0)
(1, -3)(0, -4)
(-1, -3)
(-2, 0)(-3, 5)
Plot these ordered pairs
Reflection on the SectionReflection on the SectionReflection on the SectionReflection on the Section
When is a relation a function?
assignmentassignment
2.1 Functions and Their Graphs2.1 Functions and Their Graphs

2.22.2 Slope and Rate of Change
What you should learn:GoalGoal 11
GoalGoal 22
Find slopes of lines and classify parallel and perpendicular lines.
Use slope to solve real-life problems.
2.2 Slope and Rate of Change2.2 Slope and Rate of Change
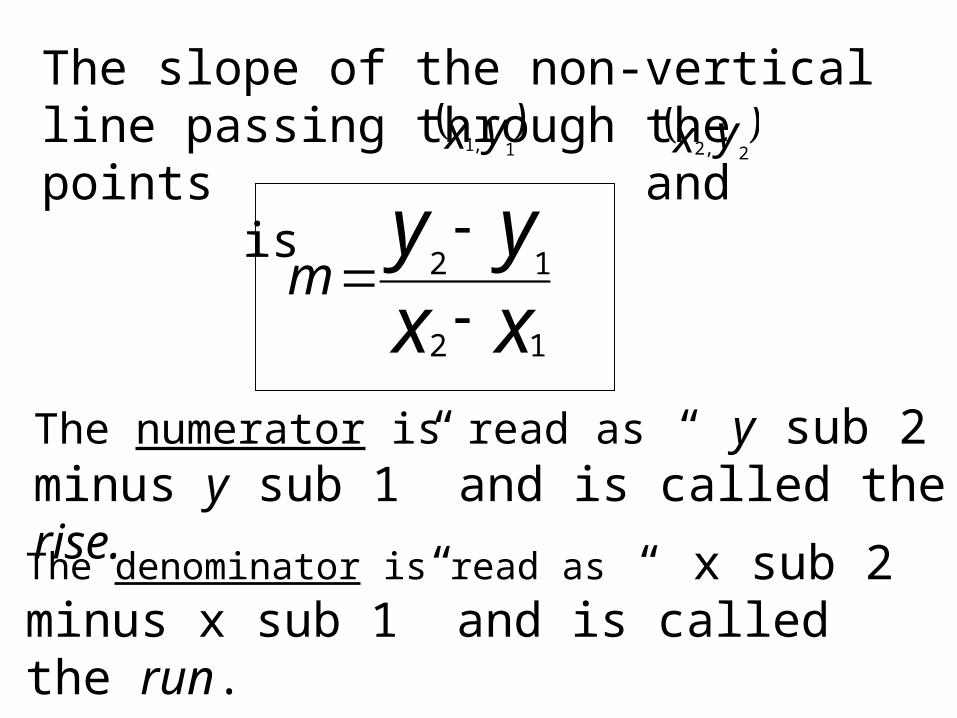
The slope of the non-vertical line passing through the points and is yx 1,1 yx 2,2
xxyy
m12
12
The numerator is read as “ y sub 2 minus y sub 1” and is called the rise.
The denominator is read as “ x sub 2 minus x sub 1” and is called the run.

Find the Slope of the line passing through each pair of points or state that the Slope is undefined.
ex1) (5, 6) and (-3, 2)
xxyy
m12
12
use
53
62
m
8
4
m2
1
Make the substitution.
Do the math.
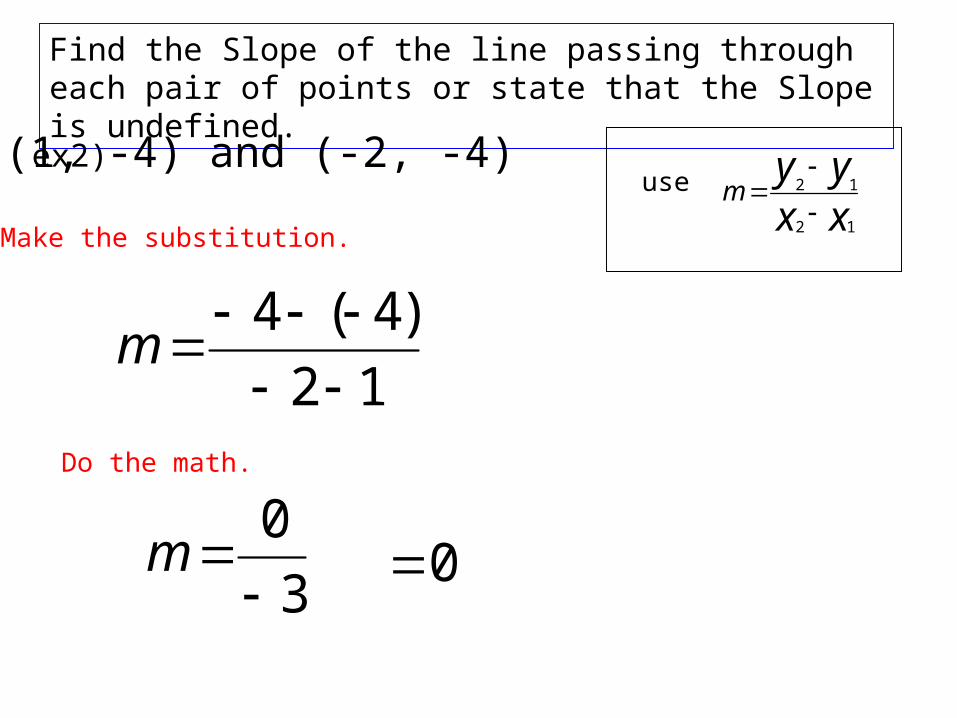
Find the Slope of the line passing through each pair of points or state that the Slope is undefined.
ex2) (1, -4) and (-2, -4)
xxyy
m12
12
use
12
)4(4
m
3
0
m 0
Make the substitution.
Do the math.
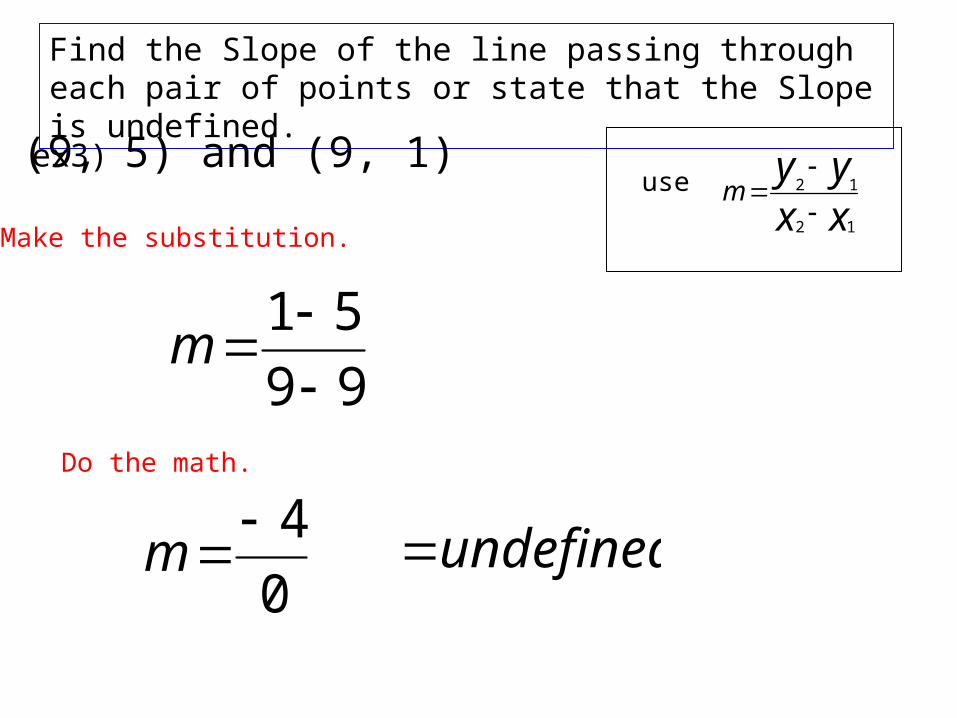
Find the Slope of the line passing through each pair of points or state that the Slope is undefined.
ex3) (9, 5) and (9, 1)
xxyy
m12
12
use
99
51
m
0
4m undefined
Make the substitution.
Do the math.

Find the slope given 2 points.
( 1998, 1502), (2004, 1112)
ex)
xxyy
m12
12
19982004
15021112
m
656
390
m
this is your slope
use the formula…

Classification of lines by Slope
1. A line with positive slope rises from left to right. (m > 0)
2. A line with negative slope falls from left to right. (m < 0)
3. A line with slope zero is horizontal. (m = 0)
4. A line with undefined slope is vertical. (m is undefined)

Find the slope of each line, or state that the slope is undefined.
directions
Count the Rise 7Count the Run
8So, the SLOPE is
8
7
or also written8
7m

Find the slope of each line, or state that the slope is undefined.
directions
Count the Rise 6
Count the Run 8
So, the SLOPE is
8
6 or reduced to
4
3m

Find the slope of each line, or state that the slope is undefined.
directions
Count the Rise 7Count the Run 0So, the SLOPE is
0
7
This fraction is undefined. So, m is undefined.

Find the slope of each line, or state that the slope is undefined.
directions
Count the Rise 0Count the Run 6So, the SLOPE is
6
0
This fraction is zero. So, m = 0.

Slope and Parallel Lines
1. If two non-vertical lines are parallel, then they have they have the same slope.the same slope.
2. If two distinct non-vertical lines have the same slope, then they are parallel.
3. Two distinct vertical lines, each with undefined slope, are parallel.
4. Because two parallel have the same “steepness”,same “steepness”, they must have the same slope.

Slope and Perpendicular Lines
1. If two non-vertical lines are perpendicular, then the product of their slopes is -1.
2. If the product of the slopes of two lines is -1, then the lines are perpendicular.
3. A horizontal line having zero slope is perpendicular to a vertical line having undefined slope.

Determine whether the lines through each pair of points are parallel.
ex) (3, 8) and (-5, 4)(4, 2) and (8, 4)
35
84
m
8
4
m2
1
48
24
m
4
2m
2
1
Same slopes,… parallelSame slopes,… parallel.
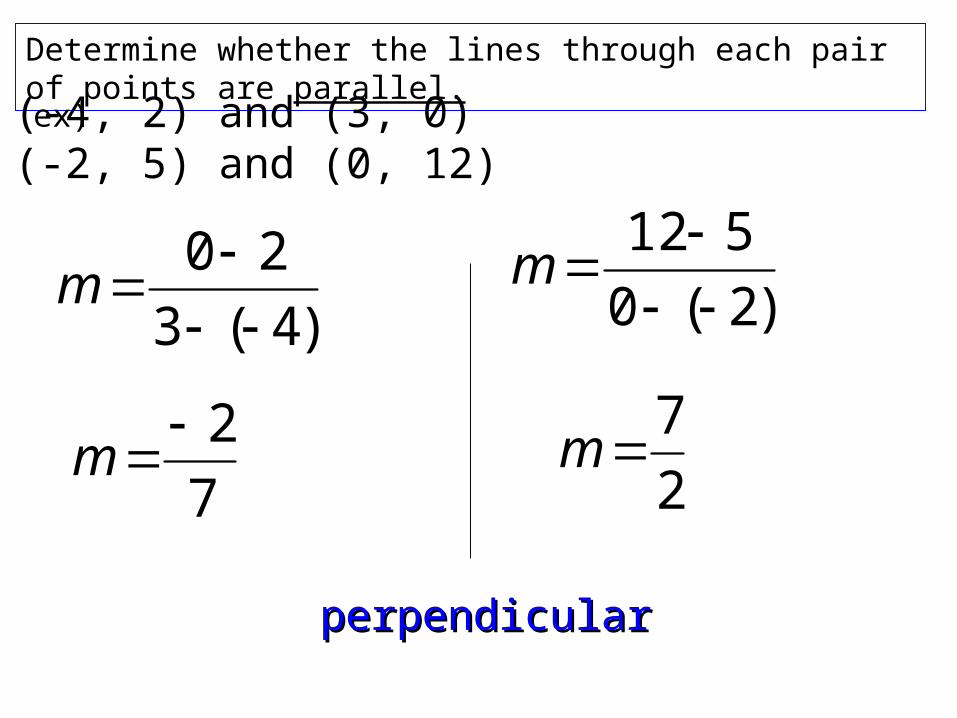
Determine whether the lines through each pair of points are parallel.
ex) (-4, 2) and (3, 0)(-2, 5) and (0, 12)
)4(3
20
m
7
2m
)2(0
512
m
2
7m
perpendicularperpendicular

Using Slope in Real Life
SOLUTION
In a home repair manual the following ladder safety guideline is given.
Adjust the ladder until the distance from the base of the ladder to the wall is at least one quarter of the height where the top of the ladder hits the wall.
Let x represent the minimum distance that the ladder’s base should be from the wall for the ladder to safely reach a height of 20 feet.
The ladder’s base should be at least 5 feet from the wall.
Find the minimum distance a ladder’s base should be from a wall if you need the ladder to reach a height of 20 feet.
5 = x
20 = 4x
Write a proportion.
The rise is 20 and the run is x.
Cross multiply.
Solve for x.
riserun
=41
=20x
41
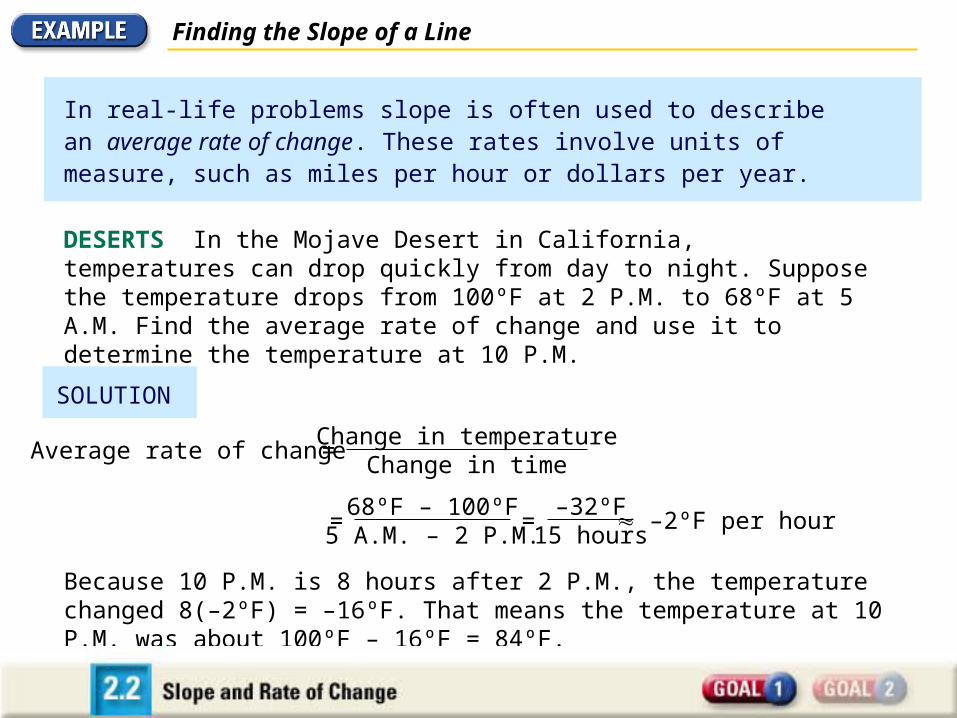
Finding the Slope of a Line
DESERTS In the Mojave Desert in California, temperatures can drop quickly from day to night. Suppose the temperature drops from 100ºF at 2 P.M. to 68ºF at 5 A.M. Find the average rate of change and use it to determine the temperature at 10 P.M.
SOLUTION
=68ºF – 100ºF
5 A.M. – 2 P.M.=
–32ºF15 hours
–2ºF per hour
Because 10 P.M. is 8 hours after 2 P.M., the temperature changed 8(–2ºF) = –16ºF. That means the temperature at 10 P.M. was about 100ºF – 16ºF = 84ºF.
Average rate of changeChange in temperature
Change in time=
In real-life problems slope is often used to describe an average rate of change. These rates involve units of measure, such as miles per hour or dollars per year.

Reflection on the SectionReflection on the SectionReflection on the SectionReflection on the Section
How can you tell from a line’s graph if it has positive, negative, or zero slope?
assignmentassignment
2.2 Slope and Rate of Change2.2 Slope and Rate of Change

2.32.3 Quick Graphs of Linear Equations
What you should learn:GoalGoal 11
GoalGoal 22
Use the slope-intercept form of a linear equation to graph linear equations.
Use the standard form of a linear equation to graph linear equations.
2.3 Quick Graphs of Linear Equations2.3 Quick Graphs of Linear Equations

Intercepts of a line
Using Intercepts to Graph Ax + By = C.
(this is the Standard Form of a Linear equation.)
1.To find the x-intercept, let y = 0 and solve for x in Ax = C.
2. To find the y-intercept, let x = 0 and solve for y in By = C.
3. Find a checkpoint, a third ordered-pair.
4. Graph the equation by drawing a line through the three points.

Finding the x- and y- intercepts….
Find the x-intercept of the equation 2x + 3y = 6.
To find the x-intercept, substitute (0) in for y. Solve for x.
2x + 3(0) = 6
2x = 6
x = 3
So, that means the x-intercept is 3 or (3, 0)
The coordinat
e

Find the y-intercept of 2x + 3y = 6.
To find the y-intercept, substitute (0) in for x. Solve for y.
2(0) + 3y = 6
3y = 6
y = 2
So, that means the y-intercept is 2 or (0, 2)
The coordinat
e
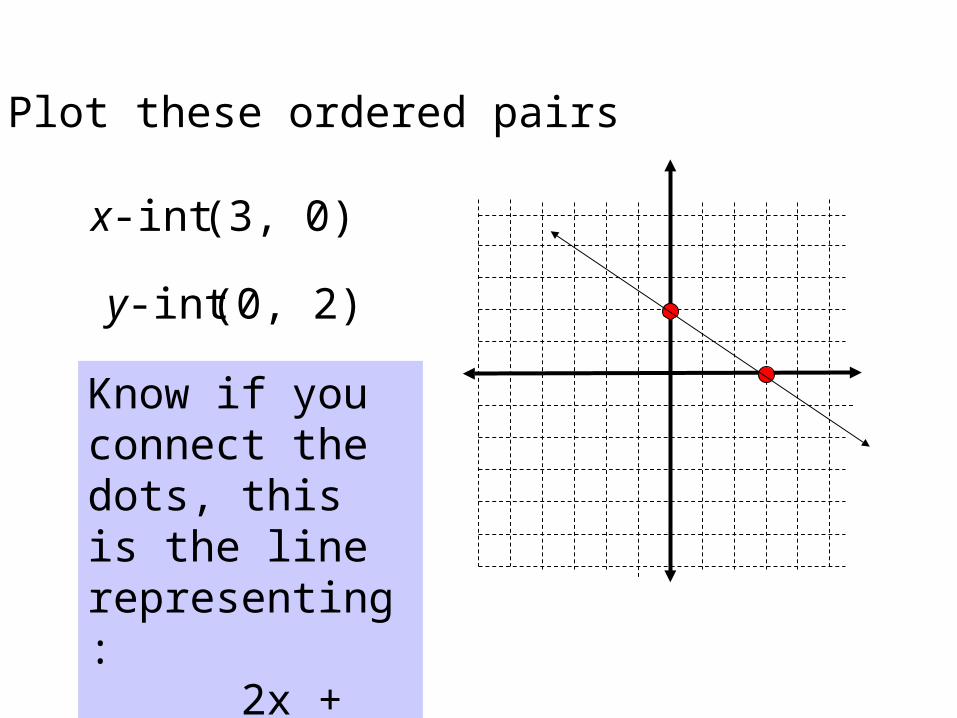
(3, 0)
Plot these ordered pairs
(0, 2)
x-int
y-int
Know if you connect the dots, this is the line representing: 2x + 3y =6

Find the x- and y- intercepts of each equation.
Do not graph, yet.
ex) -x + 4y = 8.
To find the x-intercept, substitute (0) in for y. Solve for x.
-x + 4(0) = 8
-x = 8
x = -8
(-8, 0) ( 0, 2)
The coordinate
s
To find the y-intercept, substitute (0) in for x. Solve for y.
-(0) + 4y = 8
4y = 8
y = 2

Use the x and y intercepts and a check point to graph each equation.
2054 yxEx)
4x + 5(0) = 20
4x = 20
x = 5
x-intercept
4(0) + 5y = 20
5y = 20
y = 4
y-intercept
x-interceptx- axis
y-intercepty- axis
Use a checkpoint, to see if the line is in the right spot. Do this by picking an x-coordinate, substitute, and solve for y.
205)1(4 y2.3y
Pick x = 1
That’s the coordinate ( 1, 3.2)

Write an equation in slope-intercept form of the line that passes through the two points.
Ex ) x-intercept = 4 What coordinates are these?
What coordinates are these?
1. Find the slope1. Find the slope
2. You have a y-int. and a
slope.
2. You have a y-int. and a
slope.3. write in slope-intercept form.3. write in slope-intercept form.
y-intercept = 2

Horizontal and Vertical Lines
The graph of a linear equation in one variable is a horizontal or vertical line.
The graph of y = b is a horizontal line.
The graph of x = a is a vertical line.
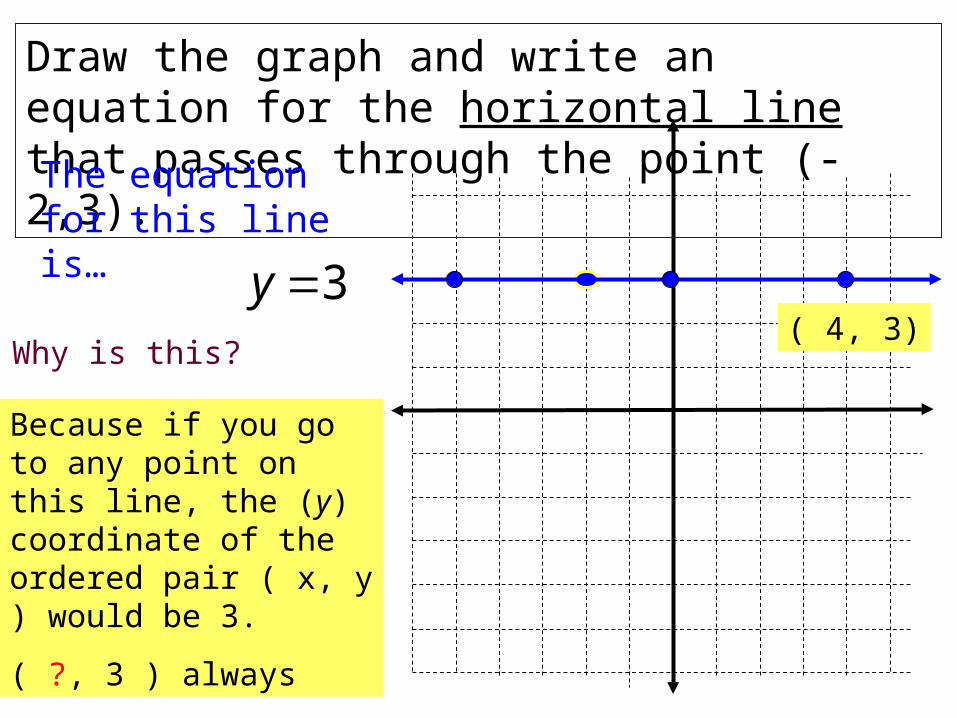
Draw the graph and write an equation for the horizontal line that passes through the point (-2,3).
The equation for this line is…
3yWhy is this?
Because if you go to any point on this line, the (y) coordinate of the ordered pair ( x, y ) would be 3.
( ?, 3 ) always
( 4, 3)

Draw the graph and write an equation for the vertical line that passes through the point (-2,3).
The equation for this line is…
2x
Why is this?
Because if you go to any point on this line, the (x) coordinate of the ordered pair ( x, y ) would be -2.
( -2, ? ) always
( -2, -3)

What is your weekly payment?
In a real-life context the y-intercept often represents an initialamount and the slope often represents a rate of change.
What is the original amount you owe on layaway?
Graph the model.
You are buying an $1100 computer on layaway. You make a $250 deposit and then make weekly payments according to the equation a = 850 – 50 t where a is the amount you owe and t is the number of weeks.
Using the Slope-Intercept Form

What is the original amount you owe on layaway?
SOLUTION
Using the Slope-Intercept Form
Then you can see that the a-intercept is 850.
So, the original amount you owe on layaway (the amount when t = 0) is $850.
First rewrite the equation as a = – 50t + 850 so that it is inslope-intercept form.
a = – 50 t + 850

What is your weekly payment?
Using the Slope-Intercept Form
SOLUTION
a = – 50t + 850
From the slope-intercept form you can see that the slope is m = – 50.
This means that the amount you owe is changing at a rate of – 50 per week.
a = – 50 t + 850
In other words, your weekly payment is $50.

Graph the model.
Using the Slope-Intercept Form
SOLUTION
Notice that the line stops when it reaches the t-axis (at t = 17).
a = – 50 t + 850
(17, 0)
(0, 850)
The computer is completely paid for at that point.
(at t = 17). (17, 0)

Reflection on the SectionReflection on the SectionReflection on the SectionReflection on the Section
Give an advantage of graphing a line using the slope-intercept form of its equation.
assignmentassignment
2.3 Quick Graphs of Linear Equations2.3 Quick Graphs of Linear Equations
2.42.4 Writing Equations of Lines
What you should learn:GoalGoal 11
GoalGoal 22
Write linear equations.
Write direct variation equations.
2.4 Writing Equations of Lines2.4 Writing Equations of Lines
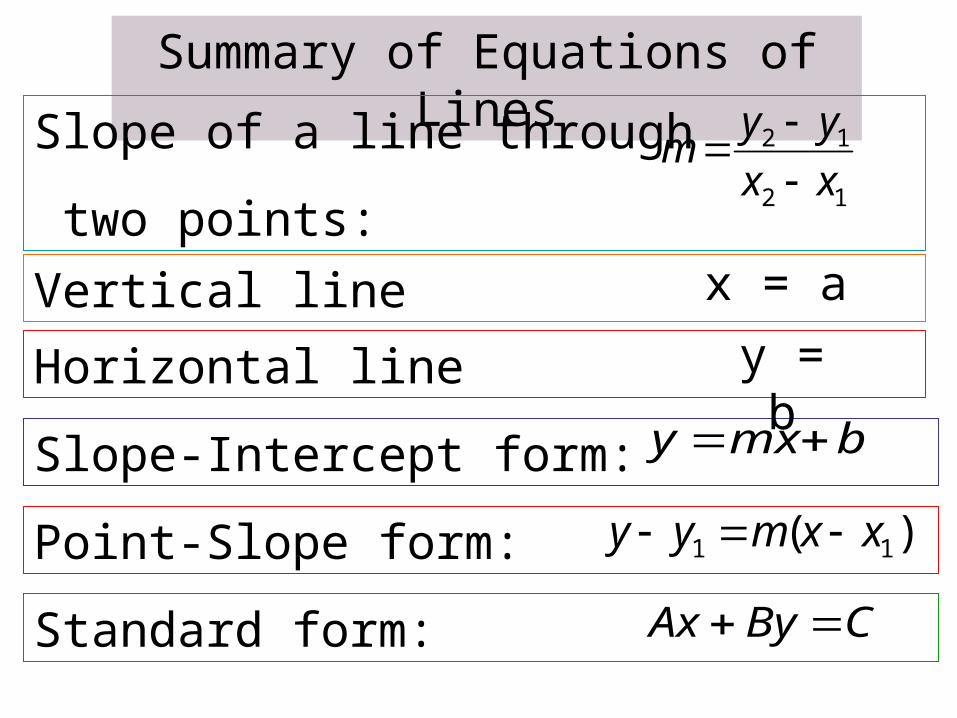
Summary of Equations of Lines
Slope of a line through
two points:
Vertical line
Horizontal line
Slope-Intercept form:
Point-Slope form:
Standard form:
12
12
xx
yym
x = a
y = b
)( 11 xxmyy
bmxy
CByAx

Point-Slope FormPoint-Slope Form
)( 11 xxmyy
This means that if you have a slope and a point, you will now use this formula to write
the equation for the line.

How about some examples…?
Ex 1)
Write an equation of the line that passes through the point and has the given slope.
Then write in Slope-Intercept Form.
(2, 3) , m = 2
)( 11 xxmyy
)2(23 xysubstitute
put in Slope-Intercept form
12 xy
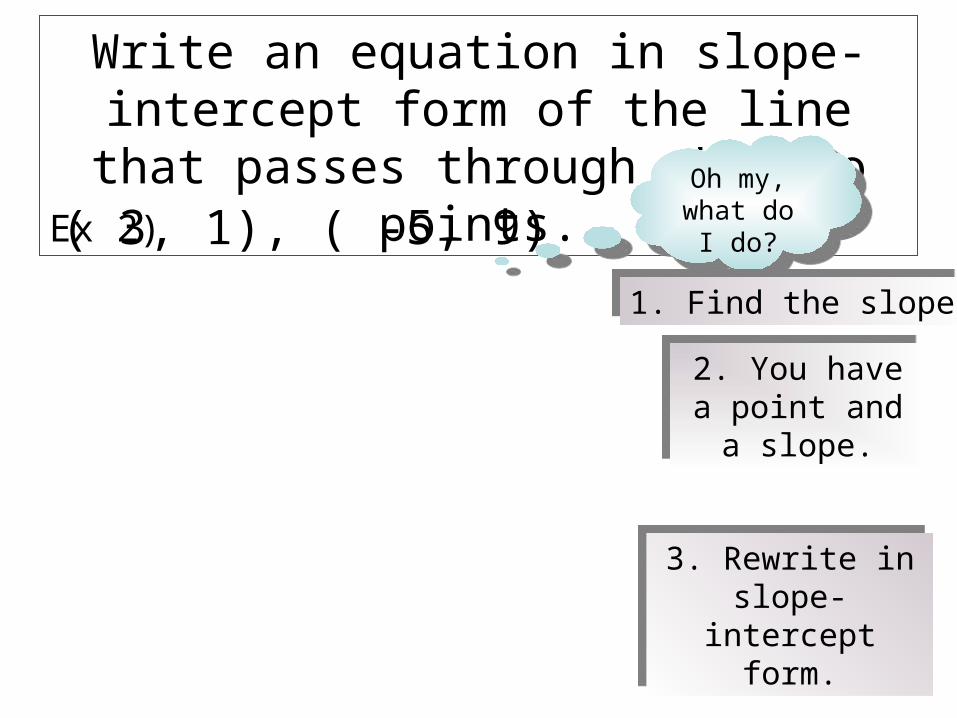
Write an equation in slope-intercept form of the line that passes through the two points.
Ex 2) ( 3, 1), ( -5, 9)Oh my,
what do I do?
Oh my, what do I
do?
1. Find the slope1. Find the slope
2. You have a point and a
slope.
2. You have a point and a
slope.
3. Rewrite in slope-intercept
form.
3. Rewrite in slope-intercept
form.

Reflection on the SectionReflection on the SectionReflection on the SectionReflection on the Section
Describe how to determine that a set of data values exhibits direct variation, and how to find the
constant of variation.
assignmentassignment
2.4 Writing Equations of Lines2.4 Writing Equations of Lines

2.52.5 Correlation and Best-Fitting Lines
What you should learn:GoalGoal 11
GoalGoal 22
Use a scatter plot to identify the correlation shown by a set of data.
Approximate the best-fitting line for a set of data.
2.5 Correlation and Best-Fitting Lines2.5 Correlation and Best-Fitting Lines
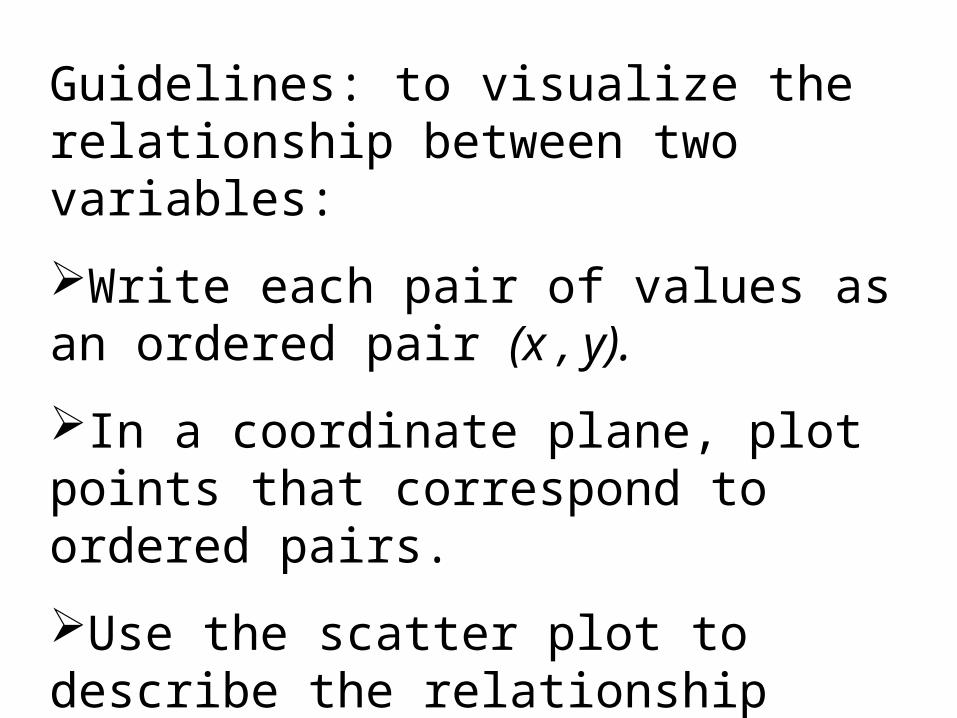
Guidelines: to visualize the relationship between two variables:
Write each pair of values as an ordered pair (x , y).
In a coordinate plane, plot points that correspond to ordered pairs.
Use the scatter plot to describe the relationship between the variables.

f (ft/sec) 0 7 14 22 29 36 44 51 58
m (mph) 0 5 10 15 20 25 30 35 40
feet
per
sec
ond
10
20
30
40
50
60
10 20 30 40 50Miles per Hour
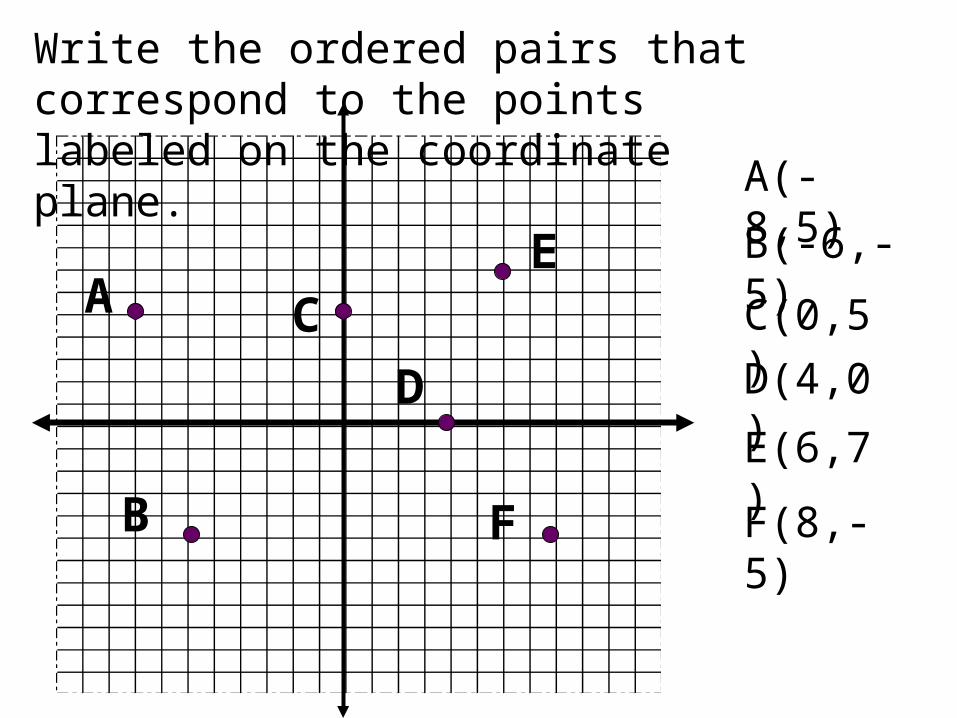
A(-8,5)
Write the ordered pairs that correspond to the points labeled on the coordinate plane.
A
B
C
D
E
F
B(-6,-5)
C(0,5)
D(4,0)
E(6,7)
F(8,-5)

Reflection on the SectionReflection on the SectionReflection on the SectionReflection on the Section
How do you use the best-fitting line to make a prediction?
assignmentassignment
2.5 Correlation and Best-Fitting Lines2.5 Correlation and Best-Fitting Lines

2.62.6 Linear Inequalities in Two Variables
What you should learn:GoalGoal 11
GoalGoal 22
Graph linear inequalities in two variables
Use linear inequalities to solve real-life problems, such as finding the number of minutes you can call relatives using a calling card.
2.6 Linear Inequalities in Two Variables2.6 Linear Inequalities in Two Variables

Sketching the Graph of a Linear Inequality
1.Sketch the graph of the corresponding linear equation. (Use a dashed line for inequalities with < or > and a solid line for inequalities with or ) This line separates the coordinate plane into two half planes.
example) Sketch the graph. 12 yx

2. Test a point in one of the half planes to find whether it is a solution of the inequality.
You are going to sketch the graph of …
12 yx
a.) Solve for y
b.) find x- and y-int

12 yx
We will test the point (0, 0) by substituting into the original inequality.
1)0()0(2
10 TRUE
So,…we shade that side of the plane.


sketch the graph of …
33 yx
either solve for y, (slope-intercept form)
or find x- and y-int
Graph the line
33 yx
Test an easy to deal with point…like (0,0)
3)0()0(3 False30
So, shade in the other side.
So, shade in the other side.
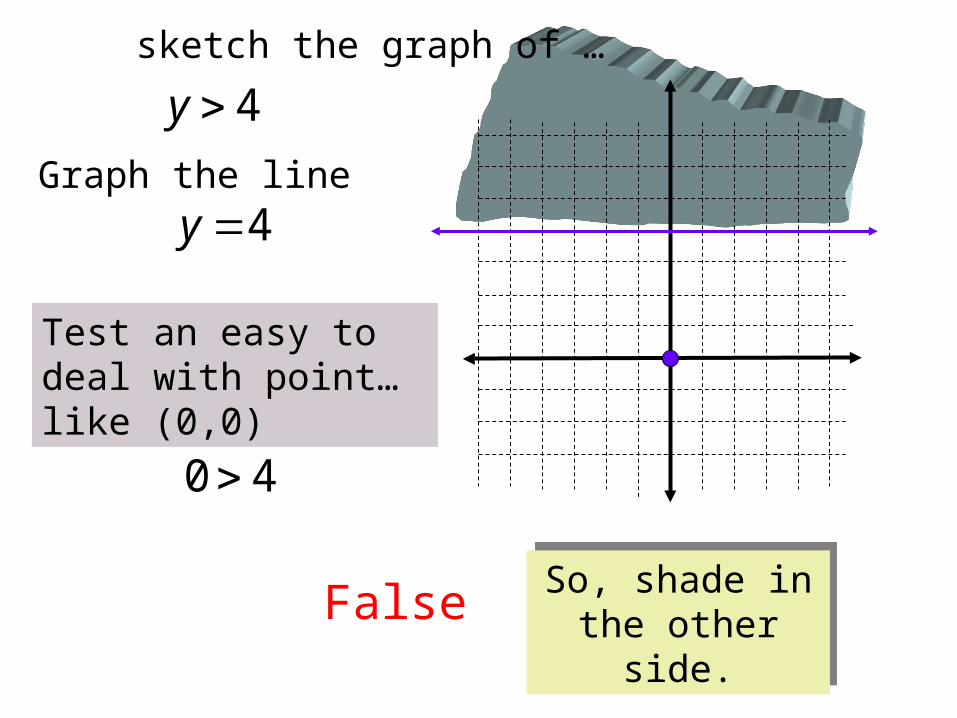
sketch the graph of …
4y
Graph the line
4y
Test an easy to deal with point…like (0,0)
40
FalseSo, shade in the
other side.So, shade in the
other side.

Using Linear Inequalities in Real Life
You have relatives living in both the United States and Mexico. You are given a prepaid phone card worth $50. Calls within the continental United States cost $.16 per minute and calls to Mexico cost $.44 per minute.
Write a linear inequality in two variables to represent the number of minutes you can use for calls within the United States and for calls to Mexico.
SOLUTION
Verbal Model
United States
rate
United States time
• +Mexico
rateMexico
time• Value of Card
Labels
…
United States rate = 0.16
United States time = x
Mexico rate = 0.44
Mexico time = y
Value of card = 50
(dollars per minute)
(dollars per minute)
(minutes)
(minutes)
(dollars)

Using Linear Inequalities in Real Life
Algebraic Model
…
You have relatives living in both the United States and Mexico. You are given a prepaid phone card worth $50. Calls within the continental United States cost $.16 per minute and calls to Mexico cost $.44 per minute.
Write a linear inequality in two variables to represent the number of minutes you can use for calls within the United States and for calls to Mexico.
0.16 x + 0.44 y 50
Graph the boundary line 0.16 x + 0.44 y = 50 . Use a solid line because 0.16 x + 0.44 y 50.
Graph the inequality and discuss three possible solutions in the context of the real-life situation.
Test the point (0, 0). Because (0, 0) is a solution if the inequality, shade the half-plane below the line. Finally, because x and y cannot be negative, restrict the graph to the points in the first quadrant.
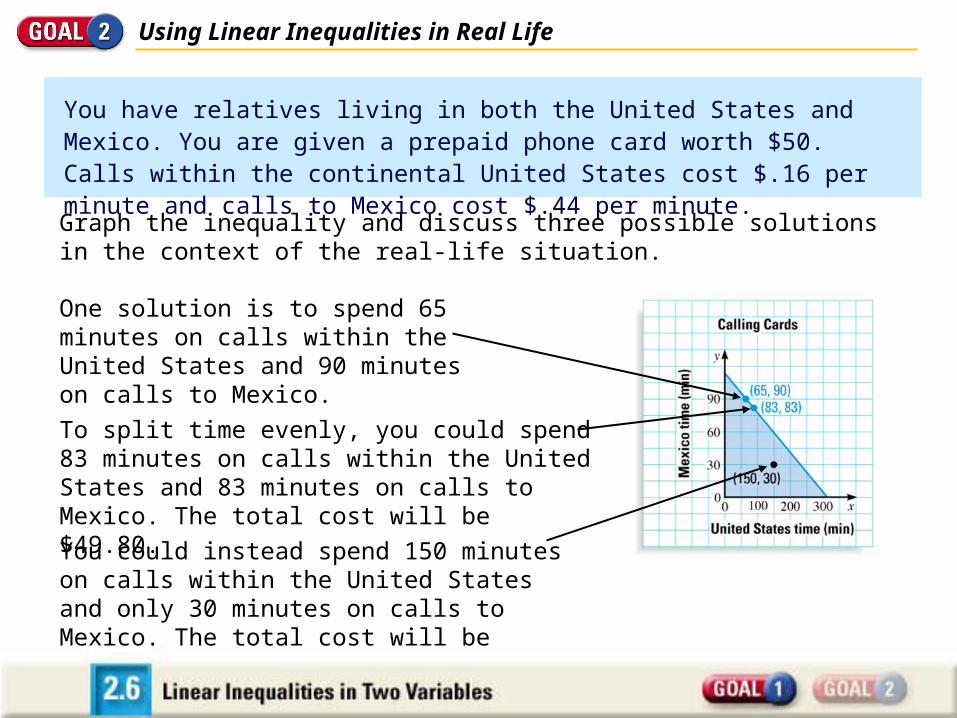
Using Linear Inequalities in Real Life
You have relatives living in both the United States and Mexico. You are given a prepaid phone card worth $50. Calls within the continental United States cost $.16 per minute and calls to Mexico cost $.44 per minute.
Graph the inequality and discuss three possible solutions in the context of the real-life situation.
Possible solutions are points within the shaded region shown.
One solution is to spend 65 minutes on calls within the United States and 90 minutes on calls to Mexico.
To split time evenly, you could spend 83 minutes on calls within the United States and 83 minutes on calls to Mexico. The total cost will be $49.80.
You could instead spend 150 minutes on calls within the United States and only 30 minutes on calls to Mexico. The total cost will be $37.20.

Reflection on the SectionReflection on the SectionReflection on the SectionReflection on the Section
When is a relation a function?
assignmentassignment
2.6 Linear Inequalities in Two Variables2.6 Linear Inequalities in Two Variables

2.72.7 Piecewise Functions
What you should learn:GoalGoal 11
GoalGoal 22
Represent piecewise functions
Use piecewise functions to model real-life quantities.
2.7 Piecewise Functions2.7 Piecewise Functions
Reflection on the SectionReflection on the SectionReflection on the SectionReflection on the Section
A phone company charges in 6 second blocks. What will a graph of the charges look like?
assignmentassignment
2.7 Piecewise Functions2.7 Piecewise Functions

2.82.8 Absolute Value Functions
What you should learn:GoalGoal 11
GoalGoal 22
Represent absolute value functions.
Use Absolute Value functions to model real-life situations.
2.8 Absolute Value Functions2.8 Absolute Value Functions


52 x
Solve the equation algebraically.
solution
52 x or 52 x
7x 3xThe equation has two solutions: 7 and -3. Check these solutions by substituting each into the original equation.

Check by Sketching the graph of the equation
Find the coordinates of the Vertex.x - 2 = 0
x = 2
The coordinates for the vertex are (2,-5)
Now, make a table. Pick a couple of x-points less than 2 and a couple of x-points greater than 2.
52 x yx 52rewrite

x
7
3
2
1
-3
0
-4
-5
-4
0
y Solutions are the x-intercepts.

Graphs of Absolute Value Equations
How to graph an absolute value equation.

Sorry…In this lesson we will learn to sketch the graph of absolute value. To begin, let’s look at the graph of .xy
By constructing a table of values and plotting points, you can see that the graph is V-shaped and opens up. The VERTEX of this graph is (0,0).

x
-3
-2
-1
0
1
2
3
2
1
0
1
2
.xy

.xy .xy
Vertex at (0,0) opens up
Vertex at (0,0) opens down
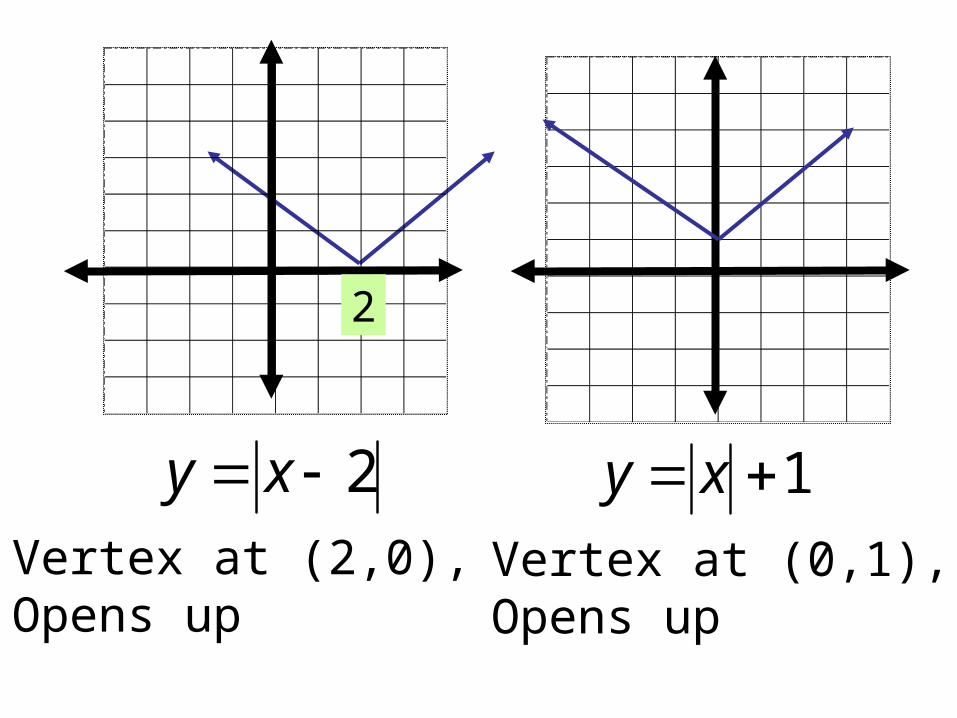
2 xy 1 xy
Vertex at (2,0), Opens up
2
Vertex at (0,1),Opens up

Sketching the graph of an Absolute Value
cbxay
1. Find the x-coordinate of the vertex by finding the value of x for which x + b =0
2. Make a table of values using the x-coordinate of the vertex, some x-values to its left, and some to its right.
3. Plot the points given, and connect.
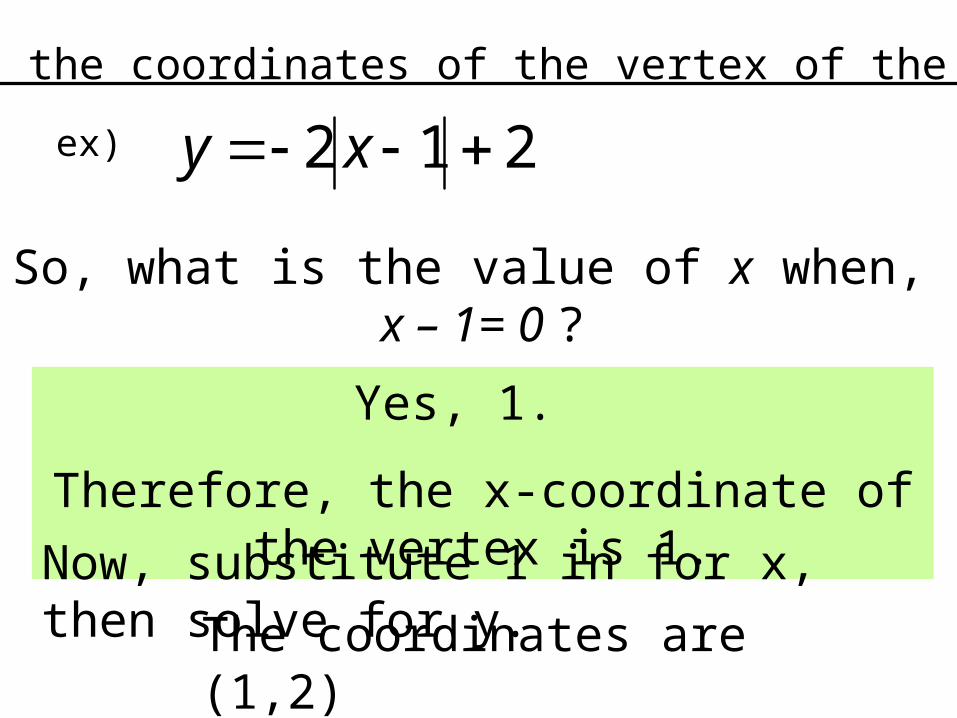
Find the coordinates of the vertex of the graph
ex) 212 xy
So, what is the value of x when, x – 1= 0 ?
Yes, 1.
Therefore, the x-coordinate of the vertex is 1.
Now, substitute 1 in for x, then solve for y.
The coordinates are (1,2)

Sketch the graph of the equation
ex) 23 xyFind the coordinates of the Vertex.x + 3 = 0
x = -3
The coordinates for the vertex are (-3,-2)
Now, make a table. Pick a couple of x-points less than -3 and a couple of x-points greater than -3.

x
-5
-4
-3
-2
-1
0
-1
-2
-1
0
y
Reflection on the SectionReflection on the SectionReflection on the SectionReflection on the Section
For the graph of
Tell how to find the vertex, the direction the graph opens, and the slopes of the braches.
assignmentassignment
2.8 Absolute Value Functions2.8 Absolute Value Functions
khxay