2.1 Depository Corporation’s Survey - sbp.org.pk · Note: Depository Corporations include monthly...
31
10 2.1 Depository Corporation’s Survey (Million Rupees) I T E M S 2011 2012 2013 2014 Dec Jun Dec Jun Dec Jun Net Foreign Assets 994,341 884,946 943,300 616,428 405,882 973,203 Claims on nonresidents 2,085,400 1,966,470 1,930,578 1,529,245 1,400,700 1,900,792 less: Liabilities to nonresidents 1,091,059 1,081,525 987,278 912,817 994,818 927,589 Domestic claims (a+b) 7,393,122 8,162,093 8,790,052 9,686,875 10,452,419 10,548,833 a-Net Claims on general government (1+2) 3,763,479 4,327,919 4,833,265 5,838,299 6,192,850 6,199,440 1- Net claims on central government 3,894,252 4,354,482 5,018,661 5,908,846 6,504,297 6,444,423 Claims on central government 4,339,309 4,879,646 5,518,845 6,423,601 6,992,868 7,308,310 less: Liabilities to central government 445,057 525,164 500,183 514,755 488,571 863,887 2-Net claims on provincial governments (130,774) (26,564) (185,396) (70,546) (311,448) (244,983) Claims on provincial governments 195,071 282,025 189,118 273,008 184,574 279,333 less: Liabilities to provincial governments 325,845 308,589 374,515 343,555 496,022 524,316 b-Claims on other sectors 3,629,644 3,834,174 3,956,787 3,848,576 4,259,570 4,349,392 Other financial corporations 132,475 228,487 153,967 147,582 133,778 140,391 Public non financial corporations 184,260 377,943 407,987 422,419 523,009 547,620 Other non financial corporations 2,623,886 2,537,990 2,676,858 2,556,965 2,888,390 2,947,859 Other resident sectors 689,023 689,754 717,975 721,609 714,392 713,523 Broad money liabilities (a+b+c+d) 6,852,402 7,426,821 8,019,284 8,660,752 9,200,350 9,770,870 a. Currency outside depository corporations 1,585,720 1,667,243 1,826,742 1,929,786 2,078,587 2,169,068 b.Transferable deposits 3,482,924 3,859,185 4,223,926 4,742,622 5,020,982 5,515,089 Other financial corporations 72,350 73,306 80,903 85,626 106,949 102,368 Public non financial corporations 125,295 149,237 146,368 170,753 201,603 220,079 Other non financial corporations 1,263,336 1,375,288 1,489,724 1,677,522 1,732,874 1,929,952 Other resident sectors 2,021,943 2,261,354 2,506,931 2,808,721 2,979,556 3,262,690 less: Central bank float - - - - - - c. Other Deposits 1,783,699 1,900,313 1,968,534 1,988,340 2,100,771 2,086,703 Other financial corporations 40,438 39,540 60,463 49,843 63,718 30,321 Public non financial corporations 296,784 290,350 273,431 248,424 290,588 261,327 Other non financial corporations 596,067 646,445 687,144 723,720 760,513 721,660 Other resident sectors 850,409 923,979 947,495 966,354 985,952 1,073,394 d. Securities other than shares included in broad money 59 80 83 3 10 10 Other financial corporations 2 3 6 - 7 7 Public non financial corporations - - - - - - Other non financial corporations 57 77 77 3 3 3 Other resident sectors - - - - - - Deposits excluded from broad money 30,898 32,493 32,853 34,574 34,715 38,294 of which: Other financial corporations - - - - - - Securities other than shares excluded from broad money 18,228 16,418 14,714 14,555 13,145 12,457 of which: Other financial corporations 8,278 8,714 7,980 8,687 7,708 7,099 Loans 21,243 19,656 17,332 18,530 21,540 25,081 of which: Other financial corporations 8,830 7,428 5,288 6,669 9,864 13,587 Financial Derivatives 28,080 26,008 13,445 8,617 5,358 14,118 of which: Other financial corporations 317 2,163 - 256 187 62 Trade credit & advances 6 25 18 44 34 33 of which: Other financial corporations - - - - - - Shares & other equity 1,529,052 1,433,937 1,621,342 1,595,658 1,809,038 2,098,841 Other items (net) (92,433) 91,730 14,400 (29,339) (225,810) (437,594) Other liabilities (includes central bank float) 845,621 1,022,820 1,028,408 1,093,484 1,007,272 1,108,187 less: Other assets 907,580 884,511 982,935 962,531 1,004,646 1,298,211 plus: Consolidation adjustment (30,473) (46,579) (31,073) (160,292) (228,435) (247,570)
-
Upload
nguyendien -
Category
Documents
-
view
223 -
download
0
Transcript of 2.1 Depository Corporation’s Survey - sbp.org.pk · Note: Depository Corporations include monthly...
10
2.1 Depository Corporation’s Survey (Million Rupees)
I T E M S 2011 2012 2013 2014
Dec Jun Dec Jun Dec Jun
Net Foreign Assets 994,341 884,946 943,300 616,428 405,882 973,203
Claims on nonresidents 2,085,400 1,966,470 1,930,578 1,529,245 1,400,700 1,900,792
less: Liabilities to nonresidents 1,091,059 1,081,525 987,278 912,817 994,818 927,589
Domestic claims (a+b) 7,393,122 8,162,093 8,790,052 9,686,875 10,452,419 10,548,833
a-Net Claims on general government (1+2) 3,763,479 4,327,919 4,833,265 5,838,299 6,192,850 6,199,440
1- Net claims on central government 3,894,252 4,354,482 5,018,661 5,908,846 6,504,297 6,444,423
Claims on central government 4,339,309 4,879,646 5,518,845 6,423,601 6,992,868 7,308,310
less: Liabilities to central government 445,057 525,164 500,183 514,755 488,571 863,887
2-Net claims on provincial governments (130,774) (26,564) (185,396) (70,546) (311,448) (244,983)
Claims on provincial governments 195,071 282,025 189,118 273,008 184,574 279,333
less: Liabilities to provincial governments 325,845 308,589 374,515 343,555 496,022 524,316
b-Claims on other sectors 3,629,644 3,834,174 3,956,787 3,848,576 4,259,570 4,349,392
Other financial corporations 132,475 228,487 153,967 147,582 133,778 140,391
Public non financial corporations 184,260 377,943 407,987 422,419 523,009 547,620
Other non financial corporations 2,623,886 2,537,990 2,676,858 2,556,965 2,888,390 2,947,859
Other resident sectors 689,023 689,754 717,975 721,609 714,392 713,523
Broad money liabilities (a+b+c+d) 6,852,402 7,426,821 8,019,284 8,660,752 9,200,350 9,770,870
a. Currency outside depository corporations 1,585,720 1,667,243 1,826,742 1,929,786 2,078,587 2,169,068
b.Transferable deposits 3,482,924 3,859,185 4,223,926 4,742,622 5,020,982 5,515,089
Other financial corporations 72,350 73,306 80,903 85,626 106,949 102,368
Public non financial corporations 125,295 149,237 146,368 170,753 201,603 220,079
Other non financial corporations 1,263,336 1,375,288 1,489,724 1,677,522 1,732,874 1,929,952
Other resident sectors 2,021,943 2,261,354 2,506,931 2,808,721 2,979,556 3,262,690
less: Central bank float - - - - - -
c. Other Deposits 1,783,699 1,900,313 1,968,534 1,988,340 2,100,771 2,086,703
Other financial corporations 40,438 39,540 60,463 49,843 63,718 30,321
Public non financial corporations 296,784 290,350 273,431 248,424 290,588 261,327
Other non financial corporations 596,067 646,445 687,144 723,720 760,513 721,660
Other resident sectors 850,409 923,979 947,495 966,354 985,952 1,073,394
d. Securities other than shares included in broad money 59 80 83 3 10 10
Other financial corporations 2 3 6 - 7 7
Public non financial corporations - - - - - -
Other non financial corporations 57 77 77 3 3 3
Other resident sectors - - - - - -
Deposits excluded from broad money 30,898 32,493 32,853 34,574 34,715 38,294
of which: Other financial corporations - - - - - -
Securities other than shares excluded from broad money 18,228 16,418 14,714 14,555 13,145 12,457
of which: Other financial corporations 8,278 8,714 7,980 8,687 7,708 7,099
Loans 21,243 19,656 17,332 18,530 21,540 25,081
of which: Other financial corporations 8,830 7,428 5,288 6,669 9,864 13,587
Financial Derivatives 28,080 26,008 13,445 8,617 5,358 14,118
of which: Other financial corporations 317 2,163 - 256 187 62
Trade credit & advances 6 25 18 44 34 33
of which: Other financial corporations - - - - - -
Shares & other equity 1,529,052 1,433,937 1,621,342 1,595,658 1,809,038 2,098,841
Other items (net) (92,433) 91,730 14,400 (29,339) (225,810) (437,594)
Other liabilities (includes central bank float) 845,621 1,022,820 1,028,408 1,093,484 1,007,272 1,108,187
less: Other assets 907,580 884,511 982,935 962,531 1,004,646 1,298,211
plus: Consolidation adjustment (30,473) (46,579) (31,073) (160,292) (228,435) (247,570)
11
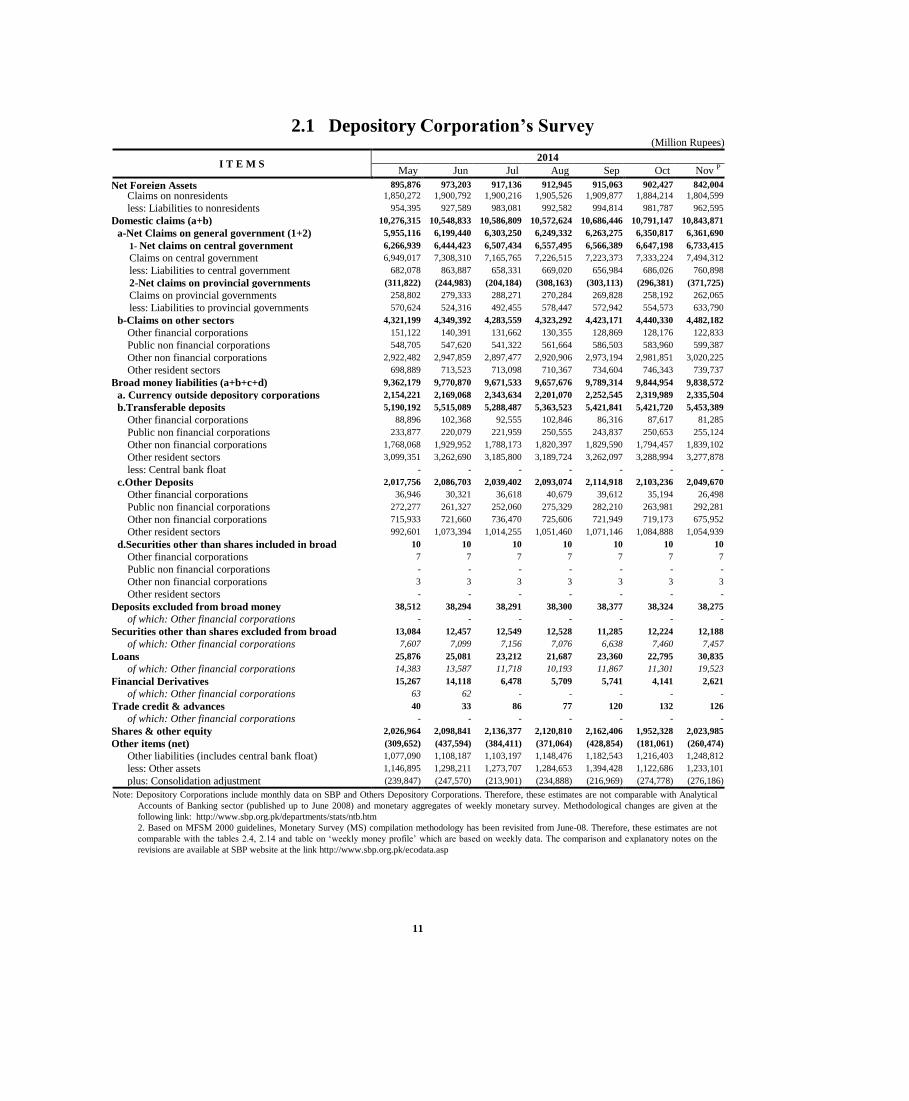
2.1 Depository Corporation’s Survey (Million Rupees)
I T E M S 2014
May Jun Jul Aug Sep Oct Nov P
Net Foreign Assets 895,876 973,203 917,136 912,945 915,063 902,427 842,004
Claims on nonresidents 1,850,272 1,900,792 1,900,216 1,905,526 1,909,877 1,884,214 1,804,599
less: Liabilities to nonresidents 954,395 927,589 983,081 992,582 994,814 981,787 962,595
Domestic claims (a+b) 10,276,315 10,548,833 10,586,809 10,572,624 10,686,446 10,791,147 10,843,871
a-Net Claims on general government (1+2) 5,955,116 6,199,440 6,303,250 6,249,332 6,263,275 6,350,817 6,361,690
1- Net claims on central government 6,266,939 6,444,423 6,507,434 6,557,495 6,566,389 6,647,198 6,733,415
Claims on central government 6,949,017 7,308,310 7,165,765 7,226,515 7,223,373 7,333,224 7,494,312
less: Liabilities to central government 682,078 863,887 658,331 669,020 656,984 686,026 760,898
2-Net claims on provincial governments (311,822) (244,983) (204,184) (308,163) (303,113) (296,381) (371,725)
Claims on provincial governments 258,802 279,333 288,271 270,284 269,828 258,192 262,065
less: Liabilities to provincial governments 570,624 524,316 492,455 578,447 572,942 554,573 633,790
b-Claims on other sectors 4,321,199 4,349,392 4,283,559 4,323,292 4,423,171 4,440,330 4,482,182
Other financial corporations 151,122 140,391 131,662 130,355 128,869 128,176 122,833
Public non financial corporations 548,705 547,620 541,322 561,664 586,503 583,960 599,387
Other non financial corporations 2,922,482 2,947,859 2,897,477 2,920,906 2,973,194 2,981,851 3,020,225
Other resident sectors 698,889 713,523 713,098 710,367 734,604 746,343 739,737
Broad money liabilities (a+b+c+d) 9,362,179 9,770,870 9,671,533 9,657,676 9,789,314 9,844,954 9,838,572
a. Currency outside depository corporations 2,154,221 2,169,068 2,343,634 2,201,070 2,252,545 2,319,989 2,335,504
b.Transferable deposits 5,190,192 5,515,089 5,288,487 5,363,523 5,421,841 5,421,720 5,453,389
Other financial corporations 88,896 102,368 92,555 102,846 86,316 87,617 81,285
Public non financial corporations 233,877 220,079 221,959 250,555 243,837 250,653 255,124
Other non financial corporations 1,768,068 1,929,952 1,788,173 1,820,397 1,829,590 1,794,457 1,839,102
Other resident sectors 3,099,351 3,262,690 3,185,800 3,189,724 3,262,097 3,288,994 3,277,878
less: Central bank float - - - - - - -
c.Other Deposits 2,017,756 2,086,703 2,039,402 2,093,074 2,114,918 2,103,236 2,049,670
Other financial corporations 36,946 30,321 36,618 40,679 39,612 35,194 26,498
Public non financial corporations 272,277 261,327 252,060 275,329 282,210 263,981 292,281
Other non financial corporations 715,933 721,660 736,470 725,606 721,949 719,173 675,952
Other resident sectors 992,601 1,073,394 1,014,255 1,051,460 1,071,146 1,084,888 1,054,939
d.Securities other than shares included in broad
money
10 10 10 10 10 10 10
Other financial corporations 7 7 7 7 7 7 7
Public non financial corporations - - - - - - -
Other non financial corporations 3 3 3 3 3 3 3
Other resident sectors - - - - - - -
Deposits excluded from broad money 38,512 38,294 38,291 38,300 38,377 38,324 38,275
of which: Other financial corporations - - - - - - -
Securities other than shares excluded from broad
money
13,084 12,457 12,549 12,528 11,285 12,224 12,188
of which: Other financial corporations 7,607 7,099 7,156 7,076 6,638 7,460 7,457
Loans 25,876 25,081 23,212 21,687 23,360 22,795 30,835
of which: Other financial corporations 14,383 13,587 11,718 10,193 11,867 11,301 19,523
Financial Derivatives 15,267 14,118 6,478 5,709 5,741 4,141 2,621
of which: Other financial corporations 63 62 - - - - -
Trade credit & advances 40 33 86 77 120 132 126
of which: Other financial corporations - - - - - - -
Shares & other equity 2,026,964 2,098,841 2,136,377 2,120,810 2,162,406 1,952,328 2,023,985
Other items (net) (309,652) (437,594) (384,411) (371,064) (428,854) (181,061) (260,474)
Other liabilities (includes central bank float) 1,077,090 1,108,187 1,103,197 1,148,476 1,182,543 1,216,403 1,248,812
less: Other assets 1,146,895 1,298,211 1,273,707 1,284,653 1,394,428 1,122,686 1,233,101
plus: Consolidation adjustment (239,847) (247,570) (213,901) (234,888) (216,969) (274,778) (276,186)
Note: Depository Corporations include monthly data on SBP and Others Depository Corporations. Therefore, these estimates are not comparable with Analytical
Accounts of Banking sector (published up to June 2008) and monetary aggregates of weekly monetary survey. Methodological changes are given at the
following link: http://www.sbp.org.pk/departments/stats/ntb.htm
2. Based on MFSM 2000 guidelines, Monetary Survey (MS) compilation methodology has been revisited from June-08. Therefore, these estimates are not
comparable with the tables 2.4, 2.14 and table on ‘weekly money profile’ which are based on weekly data. The comparison and explanatory notes on the
revisions are available at SBP website at the link http://www.sbp.org.pk/ecodata.asp

12
2.2 Analytical Accounts of State Bank of Pakistan
(Million Rupees)
I T E M S 2012 2012 2013 2014
Dec Jun Dec Jun Dec Jun
Net Foreign Assets 778,349 704,228 664,666 376,067 158,094 753,616
Claims on nonresidents 1,734,736 1,594,266 1,477,722 1,123,268 948,932 1,471,491
a) Monetary Gold, Coin and Bullion 285,126 313,077 333,563 246,097 262,159 269,308
b) Holdings of SDRs 94,499 91,354 89,732 85,256 90,020 82,071
c) Foreign currency 54,224 4,983 3,956 3,848 15,916 7,452
d) Deposits 870,715 732,545 491,866 313,505 273,645 754,740
e) Securities other than shares (Foreign) 281,095 297,543 395,693 314,957 132,869 194,156
f) Loans - - - - - -
g) Financial derivatives 359 - 1,498 280 650 -
h) Other 148,717 154,764 161,414 159,326 173,673 163,764
Of which: Quota-IMF 142,779 148,440 154,767 154,087 168,173 157,895
less: Liabilities to nonresidents 956,387 890,037 813,057 747,201 790,838 717,875
a) Deposits 90,310 85,325 87,731 80,271 84,887 69,938
b) Securities other than shares 693,181 636,238 559,244 427,996 422,182 389,000
c) Loans 36,762 27,084 18,056 10,251 5,617 2,628
d) Financial derivatives - 73 - 81,615 116,968 105,512
e) Other 136,135 141,316 148,026 147,068 161,184 150,798
Claims on Other Depository Corporations 539,397 417,477 926,351 663,242 648,578 516,127
Net claims on General Government 1,292,921 1,682,122 1,465,067 2,190,302 2,651,432 2,386,763
Net claims on Central Government 1,353,209 1,686,714 1,558,525 2,223,612 2,808,354 2,549,551
Claims on Central Government 1,444,461 1,807,282 1,647,530 2,323,931 2,891,820 2,937,955
a) Securities other than Shares 1,441,721 1,804,542 1,644,790 2,321,191 2,889,080 2,935,215
b) Other claims 2,740 2,740 2,740 2,740 2,740 2,740
less: Liabilities to Central Government 91,252 120,568 89,005 100,319 83,466 388,404
a) Deposits 91,252 120,568 89,005 100,319 83,466 388,404
b) Other liabilities - - - - - -
Net claims on Provincial Governments (60,289) (4,592) (93,458) (33,310) (156,922) (162,788)
Claims on Provincial and Local Governments 3,087 31,244 - 16,787 - -
a) Securities other than Shares - - - - - -
b) Other claims 3,087 31,244 - 16,787 - -
less: Liabilities to Provincial and Local Governments 63,376 35,836 93,458 50,097 156,922 162,788
a) Deposits 63,376 35,836 93,458 50,097 156,922 162,788
b) Other liabilities - - - - - -
Claims on other sectors 30,589 30,864 32,364 29,633 29,407 29,626
a) Other financial corporations 14,427 13,882 14,008 11,764 11,763 11,763
b) Public non-financial corporations 7 7 7 7 8 9
c) Other non-financial corporations - - - - - -
d) Other resident sectors 16,156 16,975 18,349 17,861 17,636 17,855
Monetary base (1+2+3+4) 2,068,948 2,175,665 2,415,684 2,519,782 2,708,666 2,842,815
1) Currency in Circulation 1,694,829 1,776,962 1,958,437 2,041,361 2,212,092 2,309,127
2) Liabilities to Other Depository Corporations 369,236 395,296 452,293 473,645 491,968 529,201
Reserve deposits 369,236 395,296 452,293 473,645 491,968 529,201
Other liabilities - - - - - -
13
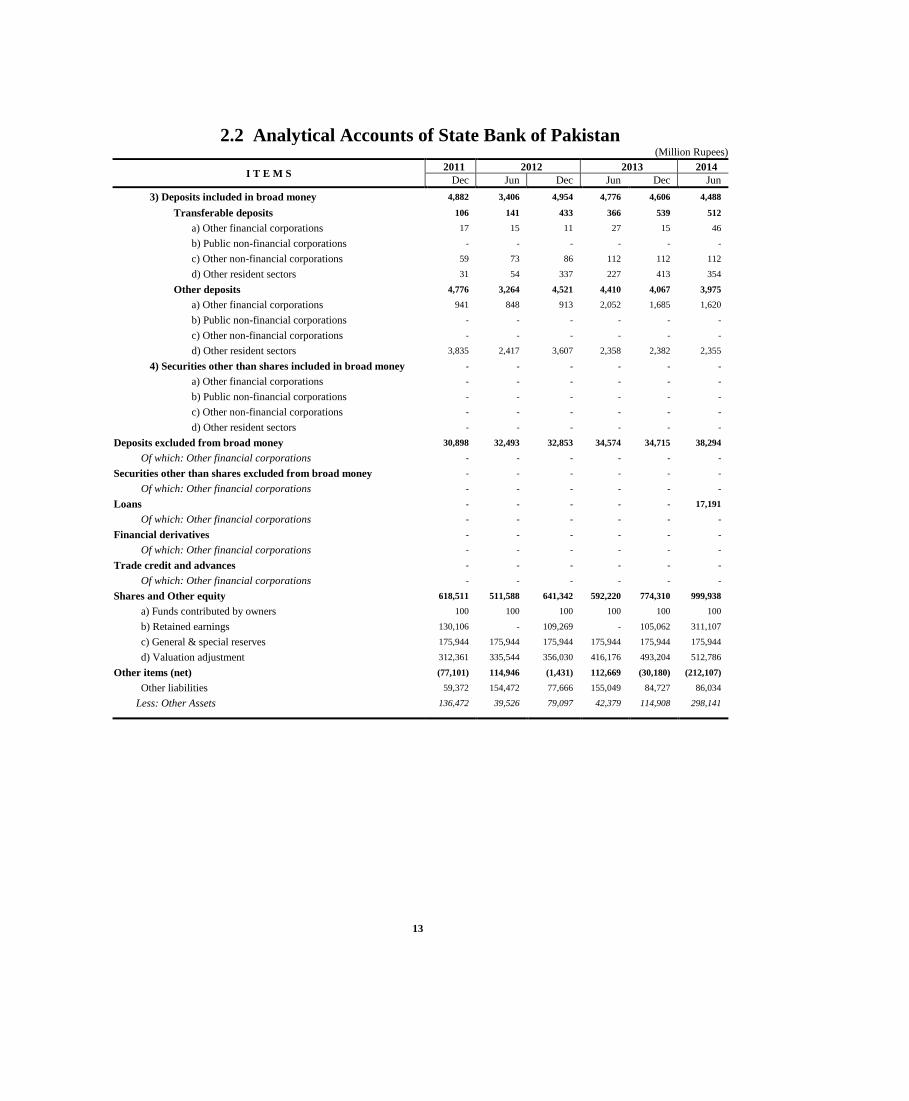
2.2 Analytical Accounts of State Bank of Pakistan
(Million Rupees)
I T E M S 2011 2012 2013 2014
Dec Jun Dec Jun Dec Jun
3) Deposits included in broad money 4,882 3,406 4,954 4,776 4,606 4,488
Transferable deposits 106 141 433 366 539 512
a) Other financial corporations 17 15 11 27 15 46
b) Public non-financial corporations - - - - - -
c) Other non-financial corporations 59 73 86 112 112 112
d) Other resident sectors 31 54 337 227 413 354
Other deposits 4,776 3,264 4,521 4,410 4,067 3,975
a) Other financial corporations 941 848 913 2,052 1,685 1,620
b) Public non-financial corporations - - - - - -
c) Other non-financial corporations - - - - - -
d) Other resident sectors 3,835 2,417 3,607 2,358 2,382 2,355
4) Securities other than shares included in broad money - - - - - -
a) Other financial corporations - - - - - -
b) Public non-financial corporations - - - - - -
c) Other non-financial corporations - - - - - -
d) Other resident sectors - - - - - -
Deposits excluded from broad money 30,898 32,493 32,853 34,574 34,715 38,294
Of which: Other financial corporations - - - - - -
Securities other than shares excluded from broad money - - - - - -
Of which: Other financial corporations - - - - - -
Loans - - - - - 17,191
Of which: Other financial corporations - - - - - -
Financial derivatives - - - - - -
Of which: Other financial corporations - - - - - -
Trade credit and advances - - - - - -
Of which: Other financial corporations - - - - - -
Shares and Other equity 618,511 511,588 641,342 592,220 774,310 999,938
a) Funds contributed by owners 100 100 100 100 100 100
b) Retained earnings 130,106 - 109,269 - 105,062 311,107
c) General & special reserves 175,944 175,944 175,944 175,944 175,944 175,944
d) Valuation adjustment 312,361 335,544 356,030 416,176 493,204 512,786
Other items (net) (77,101) 114,946 (1,431) 112,669 (30,180) (212,107)
Other liabilities 59,372 154,472 77,666 155,049 84,727 86,034
Less: Other Assets 136,472 39,526 79,097 42,379 114,908 298,141
14
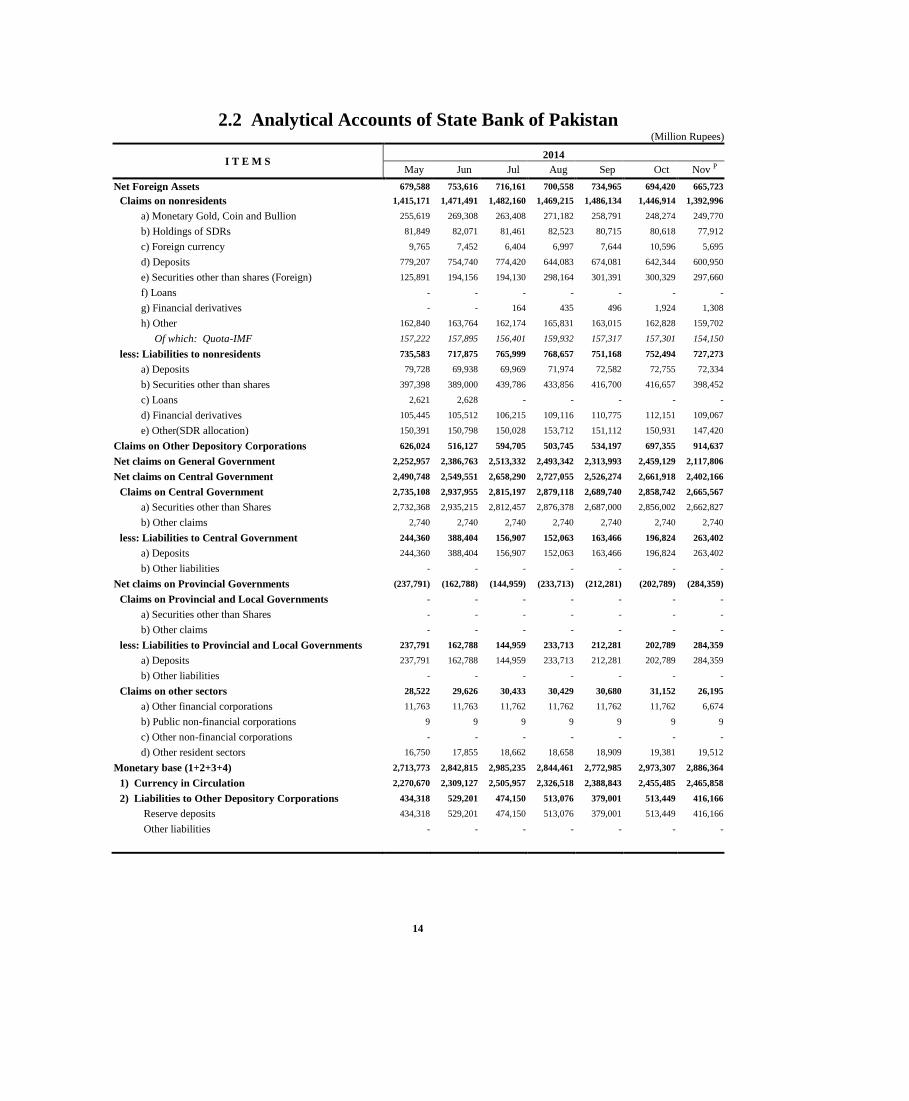
2.2 Analytical Accounts of State Bank of Pakistan (Million Rupees)
I T E M S 2014
May Jun Jul Aug Sep Oct Nov P
Net Foreign Assets 679,588 753,616 716,161 700,558 734,965 694,420 665,723
Claims on nonresidents 1,415,171 1,471,491 1,482,160 1,469,215 1,486,134 1,446,914 1,392,996
a) Monetary Gold, Coin and Bullion 255,619 269,308 263,408 271,182 258,791 248,274 249,770
b) Holdings of SDRs 81,849 82,071 81,461 82,523 80,715 80,618 77,912
c) Foreign currency 9,765 7,452 6,404 6,997 7,644 10,596 5,695
d) Deposits 779,207 754,740 774,420 644,083 674,081 642,344 600,950
e) Securities other than shares (Foreign) 125,891 194,156 194,130 298,164 301,391 300,329 297,660
f) Loans - - - - - - -
g) Financial derivatives - - 164 435 496 1,924 1,308
h) Other 162,840 163,764 162,174 165,831 163,015 162,828 159,702
Of which: Quota-IMF 157,222 157,895 156,401 159,932 157,317 157,301 154,150
less: Liabilities to nonresidents 735,583 717,875 765,999 768,657 751,168 752,494 727,273
a) Deposits 79,728 69,938 69,969 71,974 72,582 72,755 72,334
b) Securities other than shares 397,398 389,000 439,786 433,856 416,700 416,657 398,452
c) Loans 2,621 2,628 - - - - -
d) Financial derivatives 105,445 105,512 106,215 109,116 110,775 112,151 109,067
e) Other(SDR allocation) 150,391 150,798 150,028 153,712 151,112 150,931 147,420
Claims on Other Depository Corporations 626,024 516,127 594,705 503,745 534,197 697,355 914,637
Net claims on General Government 2,252,957 2,386,763 2,513,332 2,493,342 2,313,993 2,459,129 2,117,806
Net claims on Central Government 2,490,748 2,549,551 2,658,290 2,727,055 2,526,274 2,661,918 2,402,166
Claims on Central Government 2,735,108 2,937,955 2,815,197 2,879,118 2,689,740 2,858,742 2,665,567
a) Securities other than Shares 2,732,368 2,935,215 2,812,457 2,876,378 2,687,000 2,856,002 2,662,827
b) Other claims 2,740 2,740 2,740 2,740 2,740 2,740 2,740
less: Liabilities to Central Government 244,360 388,404 156,907 152,063 163,466 196,824 263,402
a) Deposits 244,360 388,404 156,907 152,063 163,466 196,824 263,402
b) Other liabilities - - - - - - -
Net claims on Provincial Governments (237,791) (162,788) (144,959) (233,713) (212,281) (202,789) (284,359)
Claims on Provincial and Local Governments - - - - - - -
a) Securities other than Shares - - - - - - -
b) Other claims - - - - - - -
less: Liabilities to Provincial and Local Governments 237,791 162,788 144,959 233,713 212,281 202,789 284,359
a) Deposits 237,791 162,788 144,959 233,713 212,281 202,789 284,359
b) Other liabilities - - - - - - -
Claims on other sectors 28,522 29,626 30,433 30,429 30,680 31,152 26,195
a) Other financial corporations 11,763 11,763 11,762 11,762 11,762 11,762 6,674
b) Public non-financial corporations 9 9 9 9 9 9 9
c) Other non-financial corporations - - - - - - -
d) Other resident sectors 16,750 17,855 18,662 18,658 18,909 19,381 19,512
Monetary base (1+2+3+4) 2,713,773 2,842,815 2,985,235 2,844,461 2,772,985 2,973,307 2,886,364
1) Currency in Circulation 2,270,670 2,309,127 2,505,957 2,326,518 2,388,843 2,455,485 2,465,858
2) Liabilities to Other Depository Corporations 434,318 529,201 474,150 513,076 379,001 513,449 416,166
Reserve deposits 434,318 529,201 474,150 513,076 379,001 513,449 416,166
Other liabilities - - - - - - -
15
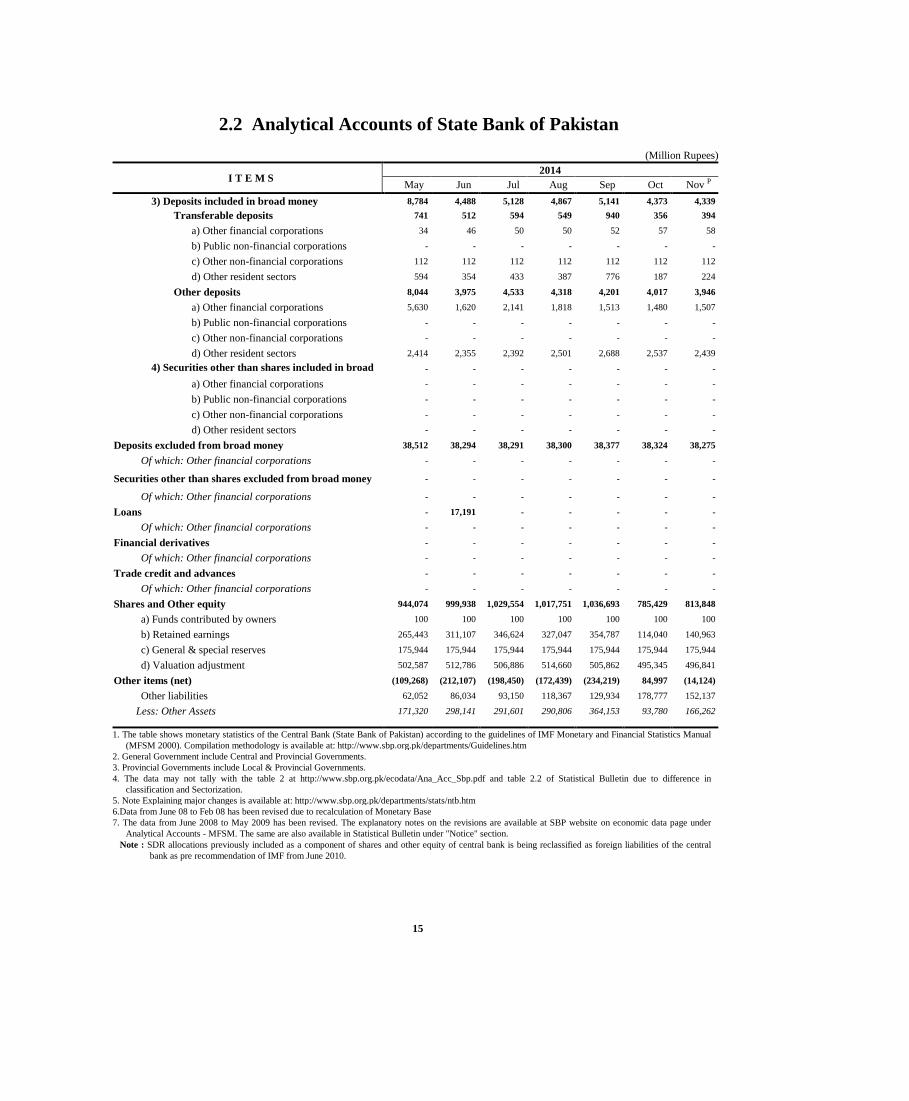
2.2 Analytical Accounts of State Bank of Pakistan
(Million Rupees)
I T E M S 2014
May Jun Jul Aug Sep Oct Nov P
3) Deposits included in broad money 8,784 4,488 5,128 4,867 5,141 4,373 4,339
Transferable deposits 741 512 594 549 940 356 394
a) Other financial corporations 34 46 50 50 52 57 58
b) Public non-financial corporations - - - - - - -
c) Other non-financial corporations 112 112 112 112 112 112 112
d) Other resident sectors 594 354 433 387 776 187 224
Other deposits 8,044 3,975 4,533 4,318 4,201 4,017 3,946
a) Other financial corporations 5,630 1,620 2,141 1,818 1,513 1,480 1,507
b) Public non-financial corporations - - - - - - -
c) Other non-financial corporations - - - - - - -
d) Other resident sectors 2,414 2,355 2,392 2,501 2,688 2,537 2,439
4) Securities other than shares included in broad
money - - - - - - -
a) Other financial corporations - - - - - - -
b) Public non-financial corporations - - - - - - -
c) Other non-financial corporations - - - - - - -
d) Other resident sectors - - - - - - -
Deposits excluded from broad money 38,512 38,294 38,291 38,300 38,377 38,324 38,275
Of which: Other financial corporations - - - - - - -
Securities other than shares excluded from broad money - - - - - - -
Of which: Other financial corporations - - - - - - -
Loans - 17,191 - - - - -
Of which: Other financial corporations - - - - - - -
Financial derivatives - - - - - - -
Of which: Other financial corporations - - - - - - -
Trade credit and advances - - - - - - -
Of which: Other financial corporations - - - - - - -
Shares and Other equity 944,074 999,938 1,029,554 1,017,751 1,036,693 785,429 813,848
a) Funds contributed by owners 100 100 100 100 100 100 100
b) Retained earnings 265,443 311,107 346,624 327,047 354,787 114,040 140,963
c) General & special reserves 175,944 175,944 175,944 175,944 175,944 175,944 175,944
d) Valuation adjustment 502,587 512,786 506,886 514,660 505,862 495,345 496,841
Other items (net) (109,268) (212,107) (198,450) (172,439) (234,219) 84,997 (14,124)
Other liabilities 62,052 86,034 93,150 118,367 129,934 178,777 152,137
Less: Other Assets 171,320 298,141 291,601 290,806 364,153 93,780 166,262
1. The table shows monetary statistics of the Central Bank (State Bank of Pakistan) according to the guidelines of IMF Monetary and Financial Statistics Manual
(MFSM 2000). Compilation methodology is available at: http://www.sbp.org.pk/departments/Guidelines.htm
2. General Government include Central and Provincial Governments.
3. Provincial Governments include Local & Provincial Governments.
4. The data may not tally with the table 2 at http://www.sbp.org.pk/ecodata/Ana_Acc_Sbp.pdf and table 2.2 of Statistical Bulletin due to difference in
classification and Sectorization.
5. Note Explaining major changes is available at: http://www.sbp.org.pk/departments/stats/ntb.htm
6.Data from June 08 to Feb 08 has been revised due to recalculation of Monetary Base
7. The data from June 2008 to May 2009 has been revised. The explanatory notes on the revisions are available at SBP website on economic data page under
Analytical Accounts - MFSM. The same are also available in Statistical Bulletin under "Notice" section.
Note : SDR allocations previously included as a component of shares and other equity of central bank is being reclassified as foreign liabilities of the central
bank as pre recommendation of IMF from June 2010.
16
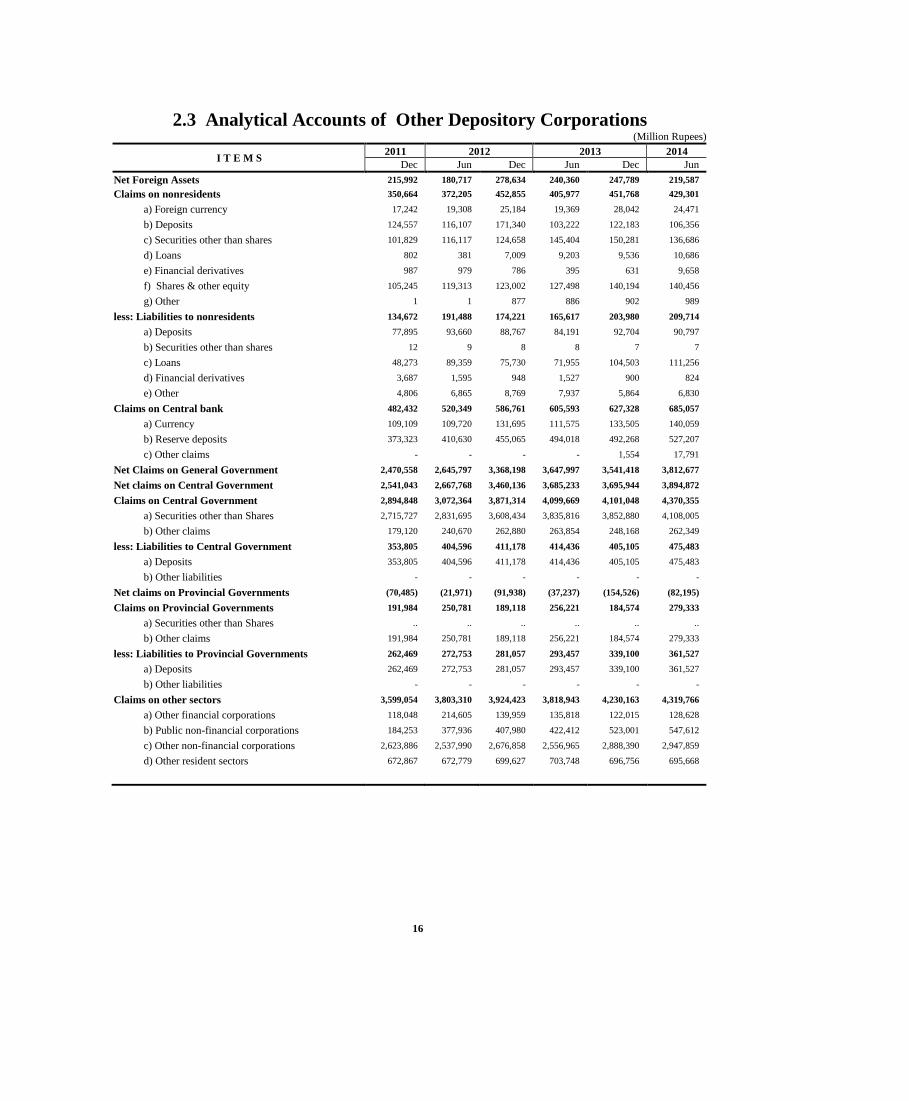
2.3 Analytical Accounts of Other Depository Corporations (Million Rupees)
I T E M S 2011 2012 2013 2014
Dec Jun Dec Jun Dec Jun
Net Foreign Assets 215,992 180,717 278,634 240,360 247,789 219,587
Claims on nonresidents 350,664 372,205 452,855 405,977 451,768 429,301
a) Foreign currency 17,242 19,308 25,184 19,369 28,042 24,471
b) Deposits 124,557 116,107 171,340 103,222 122,183 106,356
c) Securities other than shares 101,829 116,117 124,658 145,404 150,281 136,686
d) Loans 802 381 7,009 9,203 9,536 10,686
e) Financial derivatives 987 979 786 395 631 9,658
f) Shares & other equity 105,245 119,313 123,002 127,498 140,194 140,456
g) Other 1 1 877 886 902 989
less: Liabilities to nonresidents 134,672 191,488 174,221 165,617 203,980 209,714
a) Deposits 77,895 93,660 88,767 84,191 92,704 90,797
b) Securities other than shares 12 9 8 8 7 7
c) Loans 48,273 89,359 75,730 71,955 104,503 111,256
d) Financial derivatives 3,687 1,595 948 1,527 900 824
e) Other 4,806 6,865 8,769 7,937 5,864 6,830
Claims on Central bank 482,432 520,349 586,761 605,593 627,328 685,057
a) Currency 109,109 109,720 131,695 111,575 133,505 140,059
b) Reserve deposits 373,323 410,630 455,065 494,018 492,268 527,207
c) Other claims - - - - 1,554 17,791
Net Claims on General Government 2,470,558 2,645,797 3,368,198 3,647,997 3,541,418 3,812,677
Net claims on Central Government 2,541,043 2,667,768 3,460,136 3,685,233 3,695,944 3,894,872
Claims on Central Government 2,894,848 3,072,364 3,871,314 4,099,669 4,101,048 4,370,355
a) Securities other than Shares 2,715,727 2,831,695 3,608,434 3,835,816 3,852,880 4,108,005
b) Other claims 179,120 240,670 262,880 263,854 248,168 262,349
less: Liabilities to Central Government 353,805 404,596 411,178 414,436 405,105 475,483
a) Deposits 353,805 404,596 411,178 414,436 405,105 475,483
b) Other liabilities - - - - - -
Net claims on Provincial Governments (70,485) (21,971) (91,938) (37,237) (154,526) (82,195)
Claims on Provincial Governments 191,984 250,781 189,118 256,221 184,574 279,333
a) Securities other than Shares .. .. .. .. .. ..
b) Other claims 191,984 250,781 189,118 256,221 184,574 279,333
less: Liabilities to Provincial Governments 262,469 272,753 281,057 293,457 339,100 361,527
a) Deposits 262,469 272,753 281,057 293,457 339,100 361,527
b) Other liabilities - - - - - -
Claims on other sectors 3,599,054 3,803,310 3,924,423 3,818,943 4,230,163 4,319,766
a) Other financial corporations 118,048 214,605 139,959 135,818 122,015 128,628
b) Public non-financial corporations 184,253 377,936 407,980 422,412 523,001 547,612
c) Other non-financial corporations 2,623,886 2,537,990 2,676,858 2,556,965 2,888,390 2,947,859
d) Other resident sectors 672,867 672,779 699,627 703,748 696,756 695,668

17
2.3 Analytical Accounts of Other Depository Corporations (Million Rupees))
I T E M S 2011 2012 2013 2014
Dec Jun Dec Jun Dec Jun
Liabilities to central bank 548,011 421,864 936,066 525,283 449,022 341,127
Deposits included in broad money(1+2) 5,261,740 5,756,092 6,187,506 6,726,186 7,117,147 7,597,305
1) Transferable deposits 3,482,818 3,859,043 4,223,493 4,742,256 5,020,442 5,514,577
a) Other financial corporations 72,333 73,291 80,893 85,599 106,935 102,322
b) Public non-financial corporations 125,295 149,237 146,368 170,753 201,603 220,079
c) Other non-financial corporations 1,263,277 1,375,215 1,489,638 1,677,410 1,732,762 1,929,840
d) Other resident sectors 2,021,912 2,261,300 2,506,594 2,808,493 2,979,143 3,262,336
2) Other deposits 1,778,923 1,897,049 1,964,013 1,983,931 2,096,704 2,082,727
a) Other financial corporations including 39,497 38,692 59,550 47,791 62,034 28,701
b) Public non-financial corporations 296,784 290,350 273,431 248,424 290,588 261,327
c) Other non-financial corporations 596,067 646,445 687,144 723,720 760,513 721,660
d) Other resident sectors 846,575 921,562 943,888 963,996 983,570 1,071,039
Securities other than shares, included in broad money 59 80 83 3 10 10
a) Other financial corporations 2 3 6 - 7 7
b) Public non-financial corporations - - - - - -
c) Other non-financial corporations 57 77 77 3 3 3
d) Other resident sectors - - - - - -
Deposits excluded from broad money - - - - - -
Of which: Other financial corporations - - - - - -
Securities other than shares, excluded from broad
money 18,228 16,418 14,714 14,555 13,145 12,457
Of which: Other financial corporations 8,278 8,714 7,980 8,687 7,708 7,099
Loans 21,243 19,656 17,332 18,530 21,540 25,081
Of which: Other financial corporations 8,830 7,428 5,288 6,669 9,864 13,587
Financial derivatives 28,080 26,008 13,445 8,617 5,358 14,118
Of which: Other financial corporations 317 2,163 - 256 187 62
Trade credit and advances 6 25 18 44 34 33
Of which: Other financial corporations - - - - - -
Shares and other equity 910,541 922,349 979,999 1,003,437 1,034,728 1,098,903
a) Funds contributed by owners 545,402 553,044 560,151 567,258 568,361 579,620
b) Retained earnings 167,153 142,862 167,091 132,441 170,554 188,281
c) General and special reserves 136,954 155,646 163,924 196,930 193,408 203,859
d) Valuation adjustment 61,032 70,797 88,833 106,809 102,404 127,142
Other items (net) (19,859) (12,270) 8,887 16,325 5,781 (51,880)
Other liabilities 786,249 868,348 950,742 938,435 922,544 1,022,153
less: Other assets 771,108 844,985 903,838 920,151 889,738 1,000,070
plus: Consolidation adjustment (35,000) (35,633) (38,017) (1,959) (27,024) (73,963)

18
2.3 Analytical Accounts of Other Depository Corporations (Million Rupees))
I T E M S 2014
May Jun Jul Aug Sep Oct Nov P
Net Foreign Assets 216,288 219,587 200,974 212,387 180,098 208,007 176,281
Claims on nonresidents 435,101 429,301 418,056 436,311 423,743 437,300 411,603
a) Foreign currency 24,491 24,471 23,997 27,864 29,862 27,247 26,779
b) Deposits 112,651 106,356 102,056 122,684 104,622 124,895 96,241
c) Securities other than shares 135,551 136,686 131,381 121,179 123,964 125,092 129,467
d) Loans 11,910 10,686 10,518 9,337 9,503 10,285 9,684
e) Financial derivatives 10,106 9,658 9,487 9,491 8,762 133 360
f) Shares & other equity 139,639 140,456 139,705 144,868 146,169 148,819 147,938
g) Other 755 989 913 888 862 829 1,133
less: Liabilities to nonresidents 218,813 209,714 217,082 223,924 243,646 229,293 235,322
a) Deposits 95,970 90,797 89,962 95,352 95,688 99,130 94,464
b) Securities other than shares 8 7 7 7 7 7 7
c) Loans 115,755 111,256 111,950 113,355 132,512 122,551 132,465
d) Financial derivatives 1,164 824 8,330 8,326 7,949 684 1,243
e) Other 5,916 6,830 6,832 6,885 7,489 6,921 7,143
Claims on Central bank 556,049 685,057 634,400 643,416 519,809 642,719 543,438
a) Currency 116,449 140,059 162,323 125,448 136,298 135,496 130,354
b) Reserve deposits 439,053 527,207 471,437 514,694 380,131 498,471 405,766
c) Other claims 547 17,791 640 3,274 3,380 8,751 7,318
Net Claims on General Government 3,702,160 3,812,677 3,789,919 3,755,990 3,949,282 3,891,688 4,243,883
Net claims on Central Government 3,776,191 3,894,872 3,849,144 3,830,440 4,040,115 3,985,280 4,331,249
Claims on Central Government 4,213,909 4,370,355 4,350,569 4,347,397 4,533,633 4,474,482 4,828,745
a) Securities other than Shares 3,936,938 4,108,005 4,105,333 4,093,222 4,285,794 4,228,363 4,583,460
b) Other claims 276,971 262,349 245,236 254,175 247,838 246,120 245,284
less: Liabilities to Central Government 437,718 475,483 501,424 516,957 493,518 489,202 497,496
a) Deposits 437,718 475,483 501,424 516,957 493,518 489,202 497,496
b) Other liabilities - - - - - - -
Net claims on Provincial Governments (74,031) (82,195) (59,226) (74,450) (90,833) (93,592) (87,365)
Claims on Provincial Governments 258,802 279,333 288,271 270,284 269,828 258,192 262,065
a) Securities other than Shares .. .. .. .. .. .. ..
b) Other claims 258,801 279,333 288,271 270,283 269,828 258,192 262,065
less: Liabilities to Provincial Governments 332,833 361,527 347,496 344,734 360,661 351,784 349,430
a) Deposits 332,833 361,527 347,496 344,734 360,661 351,784 349,430
b) Other liabilities - - - - - - -
Claims on other sectors 4,292,676 4,319,766 4,253,126 4,292,863 4,392,491 4,409,178 4,455,986
a) Other financial corporations 139,359 128,628 119,900 118,593 117,107 116,413 116,159
b) Public non-financial corporations 548,697 547,612 541,313 561,655 586,495 583,951 599,378
c) Other non-financial corporations 2,922,482 2,947,859 2,897,477 2,920,906 2,973,194 2,981,851 3,020,225
d) Other resident sectors 682,139 695,668 694,436 691,709 715,695 726,962 720,225

19
2.3 Analytical Accounts of Other Depository Corporations
(Million Rupees)
I T E M S 2014
May Jun Jul Aug Sep Oct Nov P
Liabilities to Central bank 410,501 341,127 396,612 302,994 331,401 494,426 707,013
Deposits included in broad money (1+2) 7,199,164 7,597,305 7,322,761 7,451,730 7,531,618 7,520,583 7,498,719
1) Transferable deposits 5,189,451 5,514,577 5,287,893 5,362,974 5,420,901 5,421,365 5,452,995
a) Other financial corporations 88,861 102,322 92,506 102,797 86,265 87,560 81,227
b) Public non-financial corporations 233,877 220,079 221,959 250,555 243,837 250,653 255,124
c.) Other non-financial corporations 1,767,956 1,929,840 1,788,061 1,820,285 1,829,478 1,794,345 1,838,990
d) Other resident sectors 3,098,757 3,262,336 3,185,367 3,189,337 3,261,321 3,288,807 3,277,654
2) Other deposits 2,009,713 2,082,727 2,034,869 2,088,756 2,110,717 2,099,219 2,045,724
a) Other financial corporations including 31,316 28,701 34,477 38,861 38,099 33,714 24,991
b) Public non-financial corporations 272,277 261,327 252,060 275,329 282,210 263,981 292,281
c) Other non-financial corporations 715,933 721,660 736,470 725,606 721,949 719,173 675,952
d) Other resident sectors 990,187 1,071,039 1,011,863 1,048,959 1,068,458 1,082,351 1,052,500
Securities other than shares, included in broad money 10 10 10 10 10 10 10
a) Other financial corporations 7 7 7 7 7 7 7
b) Public non-financial corporations - - - - - - -
c) Other non-financial corporations 3 3 3 3 3 3 3
d) Other resident sectors - - - - - - -
Deposits excluded from broad money - - - - - - -
Of which: Other financial corporations - - - - - - -
Securities other than shares, excluded from broad money 13,084 12,457 12,549 12,528 11,285 12,224 12,188
Of which: Other financial corporations 7,607 7,099 7,156 7,076 6,638 7,460 7,457
Loans 25,876 25,081 23,212 21,687 23,360 22,795 30,835
Of which: Other financial corporations 14,383 13,587 11,718 10,193 11,867 11,301 19,523
Financial derivatives 15,267 14,118 6,478 5,709 5,741 4,141 2,621
Of which: Other financial corporations 63 62 - - - - -
Trade credit and advances 40 33 86 77 120 132 126
Of which: Other financial corporations - - - - - - -
Shares and other equity 1,082,890 1,098,903 1,106,823 1,103,058 1,125,713 1,166,900 1,210,137
a) Funds contributed by owners 579,274 579,620 580,424 580,801 582,592 575,655 575,608
b) Retained earnings 170,579 188,281 194,990 194,198 204,604 211,167 229,298
c) General and special reserves 203,723 203,859 203,773 203,771 205,439 215,410 217,438
d) Valuation adjustment 129,313 127,142 127,636 124,288 133,078 164,667 187,793
Other items (net) 20,421 (51,880) 10,060 7,017 12,671 (69,355) (41,809)
Other liabilities 1,015,038 1,022,153 1,010,046 1,030,109 1,052,609 1,037,626 1,096,675
less: Other assets 975,575 1,000,070 982,106 993,847 1,030,275 1,028,905 1,066,839
plus: Consolidation adjustment (19,042) (73,963) (17,881) (29,245) (9,664) (78,076) (71,644)
Note: Other Depository Corporations include the data of Banks, DFIs, MFBs and Deposit Accepting Non Bank Financial Companies.
Therefore, the estimates are not comparable with Analytical Accounts of Banking Sector (up to June 2008) and monetary aggregates of
weekly monetary survey based on data of SBP and Scheduled Banks
2. General Government includes Central and Provincial Government
3. Provincial Governments includes Provincial and Local Governments
4. The data may not tally with the table 3 at http://www.sbp.org.pk/ecodata/Ana_Acc_bkg.pdf and table 2.3 of Statistical Bulletin due to
difference in classification and Sectorization
5. Note Explaining major changes is available at: http://www.sbp.org.pk/departments/stats/ntb.htm
6.The data from June 2008 to May 2009 has been revised. The explanatory notes on the revisions are available at SBP website on
economic data page under Analytical Accounts - MFSM. The same are also available in Statistical Bulletin under "Notice" section. 7.The data from June 2008 to May 2009 has been revised. The explanatory notes on the revisions are available at SBP website on
economic data page under Analytical Accounts - MFSM. The same are also available in Statistical Bulletin under "Notice" section.

20
2.4 Reserve Money
(Million Rupees)
Components
30th June 2013 2014
FY10 FY11 FY12 FY13 FY14 Nov Dec Jan Feb
A. Currency in Circulation 1,295,385 1,501,409 1,673,746 1,938,222 2,177,873 2,134,640 2,086,655 2,137,754 2,137,141
B. Cash in Tills 87,673 104,852 110,055 110,867 139,490 122,083 133,340 117,581 120,244
C. Other Deposits with SBP 1 6,663 10,145 8,899 10,523 13,147 11,433 10,866 10,600 10,661
D. Bank Deposits 289,566 349,427 396,172 475,648 530,746 475,335 493,540 478,681 480,763
Reserve Money (A+B+C+D) 1,679,286 1,965,833 2,188,873 2,535,260 2,861,256 2,743,491 2,724,402 2,744,617 2,748,809
Factor affecting Reserve Money (RM)
A. Government Sector (1+2) 1,224,942 1,222,058 1,727,905 2,235,950 2,432,250 2,690,959 2,696,919 2,667,073 2,421,784
1. Budgetary Borrowings 1,208,651 1,200,658 1,706,008 2,212,910 2,409,795 2,669,686 2,675,725 2,644,162 2,398,626
2. Others 16,291 21,400 21,897 23,040 22,456 21,272 21,194 22,911 23,159
B. Non-Govt. Sector (1+2+3) 306,625 309,837 283,571 442,794 494,563 492,666 526,057 526,883 516,695
1. Claims on Scheduled Banks
(a+b+c+d+e) 312,680 315,181 288,789 448,331 500,041 498,320 531,811 532,546 522,285
a. Agriculture Sector 55,483 53,228 52,131 52,332 51,923 52,161 52,118 52,013 52,007
b. Industrial Sector 42,107 41,943 42,336 41,057 42,833 39,357 39,715 40,496 41,884
c. Export Sector 185,541 190,460 164,768 177,756 160,553 191,756 201,904 201,962 190,321
d. Housing Sector - - - - - - - - -
e. Others 29,549 29,550 29,554 177,186 244,731 215,045 238,075 238,075 238,074
2. Claims on NBFCs 17,628 18,571 18,697 18,537 18,597 18,421 18,320 18,412 18,484
3. Special a/c debt Repayment (23,683) (23,915) (23,915) (24,075) (24,075) (24,075) (24,075) (24,075) (24,075)
C. Other Items (Net) (230,979) (180,060) (216,672) (276,418) (555,200) (326,272) (401,713) (325,965) (163,988)
D. Net Domestic Assets (A+B+C) 1,300,588 1,351,834 1,794,804 2,402,326 2,371,613 2,857,353 2,821,262 2,867,992 2,774,492
E. Net Foreign Assets 378,699 613,998 394,069 132,935 489,643 (113,862) (96,861) (123,375) (25,683)
Reserve Money (D+E) 1,679,286 1,965,833 2,188,873 2,535,260 2,861,256 2,743,491 2,724,402 2,744,617 2,748,809

21
2.4 Reserve Money
(Million Rupees)
Components 2014
Mar Apr May Jun Jul Aug Sep Oct Nov P
A. Currency in Circulation 2,116,884 2,125,530 2,158,947 2,177,873 2,312,992 2,205,677 2,261,802 2,328,532 2,338,976
B. Cash in Tills 137,143 116,883 119,786 139,490 163,246 129,155 135,383 134,652 134,601
C. Other Deposits with SBP 1 10,726 12,839 13,623 13,147 13,198 13,316 13,851 13,078 13,007
D. Bank Deposits 472,541 466,687 439,916 530,746 451,594 516,467 380,463 514,917 417,680
Reserve Money (A+B+C+D) 2,737,295 2,721,939 2,732,272 2,861,256 2,941,030 2,864,615 2,791,499 2,991,180 2,904,264
Factor affecting Reserve Money (RM)
A. Government Sector (1+2) 2,300,997 2,198,790 2,298,976 2,432,250 2,559,021 2,539,392 2,358,827 2,503,978 2,163,013
1. Budgetary Borrowings 2,277,916 2,175,773 2,276,278 2,409,795 2,537,861 2,520,413 2,338,664 2,483,292 2,142,385
2. Others 23,081 23,017 22,699 22,456 21,160 18,979 20,163 20,686 20,627
B. Non-Govt. Sector (1+2+3) 525,673 521,265 510,926 494,563 501,903 465,227 499,753 531,869 544,453
1. Claims on Scheduled Banks
(a+b+c+d+e) 531,310 526,799 516,432 500,041 507,774 471,067 505,393 537,484 550,139
a. Agriculture Sector 51,977 51,935 51,974 51,923 51,820 51,792 51,752 51,709 51,636
b. Industrial Sector 44,146 43,802 43,544 42,833 42,733 42,109 42,260 43,819 43,427
c. Export Sector 181,190 177,065 166,915 160,553 168,491 132,434 163,057 193,633 206,752
d. Housing Sector - - - - - - - - -
e. Others 253,998 253,998 253,998 244,731 244,731 244,731 248,324 248,324 248,324
2. Claims on NBFCs 18,438 18,541 18,569 18,597 18,204 18,235 18,436 18,460 18,389
3. Special a/c debt Repayment (24,075) (24,075) (24,075) (24,075) (24,075) (24,075) (24,075) (24,075) (24,075)
C. Other Items (Net) (163,359) (250,992) (507,600) (555,200) (574,622) (574,221) (548,696) (496,969) (223,768)
D. Net Domestic Assets (A+B+C) 2,663,312 2,469,064 2,302,303 2,371,613 2,486,302 2,430,398 2,309,884 2,538,878 2,483,698
E. Net Foreign Assets 73,983 252,875 429,969 489,643 454,727 434,217 481,614 452,302 420,565
Reserve Money (D+E) 2,737,295 2,721,939 2,732,272 2,861,256 2,941,030 2,864,615 2,791,499 2,991,180 2,904,264
P Provisional
1. Excluding IMF A/c Nos. 1 & 2, SAF loan account, counterpart funds, deposits of foreign central banks, foreign governments, international organizations and deposit money banks.
Note:-
i - Data is based on weekly returns. The quarterly data covers the period up to the last working day of the month and others months data up to the last working day of last week.
ii - Compilation of M1 based on weekly data has been discontinued and being compiled on monthly basis given in Table 2.1. The comparison of weekly and monthly compilation
methodologies is available link http://www.sbp.org.pk/ecodata.asp.

22
2.5 Monetary Aggregates
(Million Rupees)
Assets / Liabilities
30th June 2013 2014
FY10 FY11 FY12 FY13 FY14 Nov Dec Jan Feb
A
. Factors Affecting Money Supply ( M2)
1 Public Sector 2,440,941 3,020,510 4,257,951 5,737,134 6,064,253 6,086,141 6,117,599 6,151,020 6,093,956
a Budgetary support 2,011,459 2,601,622 3,799,917 5,246,387 5,549,358 5,666,134 5,718,107 5,761,633 5,724,005
b Commodity operations 413,191 397,488 436,137 467,707 492,439 398,735 378,298 366,476 346,792
c Effect of Zakat fund etc. 16,291 21,400 21,897 23,040 22,456 21,272 21,194 22,911 23,159
2 Credit to Non-Government Sector (a+b+c) 3,388,800 3,547,345 3,652,248 3,663,984 4,102,033 3,867,755 4,039,417 4,028,811 4,030,570
a Credit to Private Sector 3,019,822 3,141,151 3,376,392 3,357,352 3,728,727 3,526,715 3,678,665 3,656,348 3,655,699
i. Commercial Banks 2,902,658 3,025,809 3,257,120 3,234,795 3,596,604 3,402,318 3,552,666 3,530,235 3,528,002
ii. Specialized Banks 117,164 115,341 119,272 122,556 132,123 124,396 125,999 126,112 127,697
b Credit to Public Sector Enterprises (PSEs) 351,350 387,623 257,159 288,096 354,709 322,620 342,432 354,052 356,388
i. Autonomous bodies 70,479 68,283 83,987 106,960 130,283 133,957 133,659 133,342 136,261
ii. Others 304,554 343,255 197,087 205,210 248,501 212,737 232,847 244,785 244,201
iii. PSEs Special Account-Debt Repayment with SBP (23,683) (23,915) (23,915) (24,075) (24,075) (24,075) (24,075) (24,075) (24,075)
c Other Financial Institutions (SBP credit to NBFCs) 17,628 18,571 18,697 18,537 18,597 18,421 18,320 18,412 18,484
3 Other Items (net) (597,788) (652,914) (800,536) (812,138) (799,244) (883,092) (824,998) (916,425) (948,782)
4 Domestic Credit Expansion (1+2+3) 5,231,953 5,914,941 7,109,663 8,588,980 9,367,042 9,070,804 9,332,018 9,263,406 9,175,744
a. SBP 987,908 1,036,654 1,506,015 1,953,994 1,871,572 2,359,033 2,289,451 2,335,446 2,252,206
b. Scheduled Banks 4,244,045 4,878,287 5,603,649 6,634,986 7,495,470 6,711,771 7,042,567 6,927,961 6,923,538
5 Foreign Assets (Net) 545,281 780,253 532,131 268,832 600,999 20,089 53,674 16,194 121,346
a. SBP 378,699 613,998 394,069 132,935 489,643 (113,862) (96,861) (123,375) (25,683)
b. Scheduled Banks 166,582 166,255 138,063 135,897 111,356 133,951 150,534 139,569 147,029
6 Monetary Expansion (4+5) 5,777,234 6,695,194 7,641,795 8,857,812 9,968,041 9,090,894 9,385,691 9,279,600 9,297,091
B
. Components of M2
1 Currency in Circulation 1,295,385 1,501,409 1,673,746 1,938,222 2,177,873 2,134,640 2,086,655 2,137,754 2,137,141
2 Other Deposits with SBP* 6,663 10,145 8,899 10,523 13,147 11,433 10,866 10,600 10,661
3 Total Private & PSE Deposits 4,475,186 5,183,640 5,959,150 6,909,066 7,777,021 6,944,821 7,288,170 7,131,246 7,149,289
of which : RFCDs 345,438 374,945 440,130 514,988 599,384 604,618 594,895 591,842 594,551
Money Supply (1+2+3) 5,777,234 6,695,194 7,641,795 8,857,812 9,968,041 9,090,894 9,385,691 9,279,600 9,297,091
C
. Memorandum Items
Accrued Profit on SBP holdings of MRTBs 37,206 46,120 43,935 44,959 82,070 56,454 64,636 77,871 64,589
Outstanding amount of MTBs (realized value in auction) 1,063,045 1,542,553 1,835,265 2,529,412 1,525,175 2,548,663 2,649,070 2,564,589 2,585,238
Net Government Budgetary Borrowing for Budgetary
Support
(Estimated on Cash basis as done in government budget)
From Banking System 1,934,553 2,523,300 3,667,246 5,124,762 5,448,425 5,566,360 5,608,077 5,640,186 5,611,441
From SBP 1,171,445 1,154,539 1,662,073 2,167,951 2,327,725 2,613,232 2,611,089 2,566,292 2,334,037
From Scheduled Banks 763,107 1,368,762 2,005,173 2,956,811 3,120,700 2,953,128 2,996,988 3,073,894 3,277,404
23
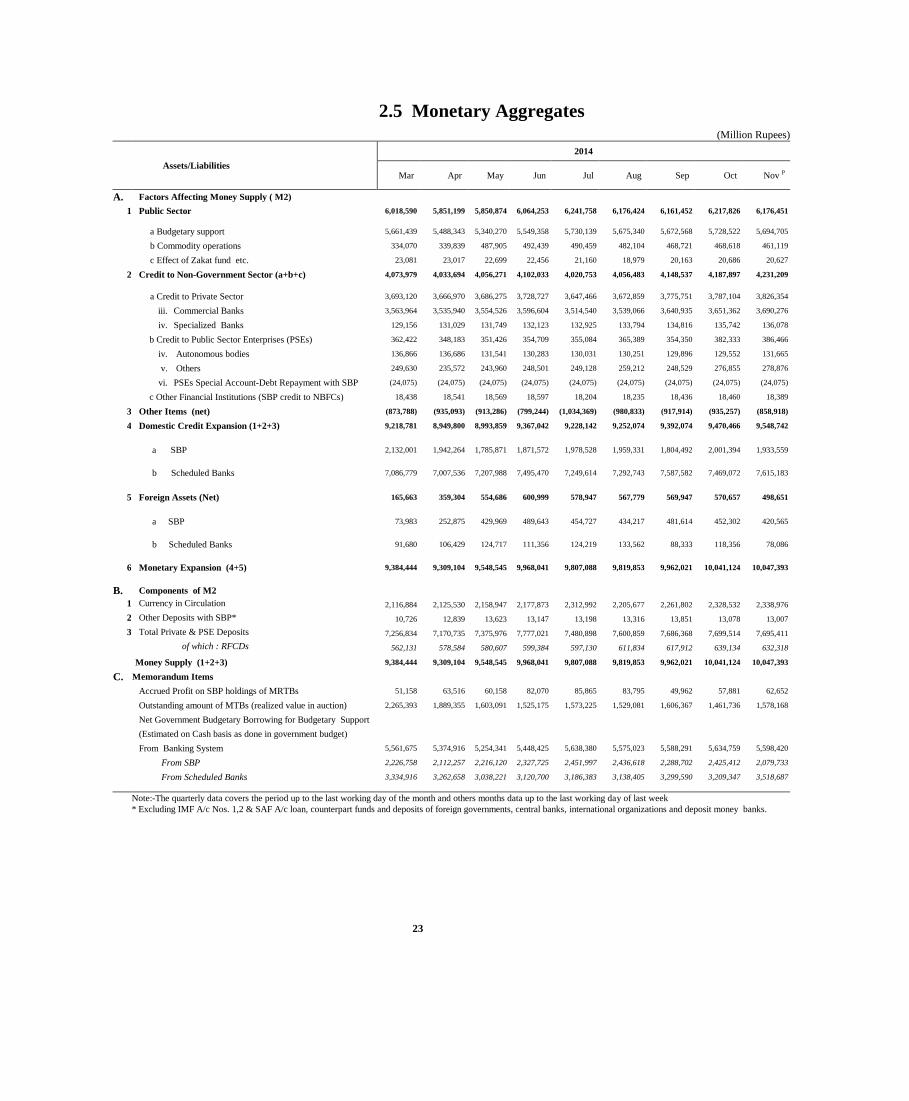
2.5 Monetary Aggregates
(Million Rupees)
Assets/Liabilities
2014
Mar Apr May Jun Jul Aug Sep Oct Nov P
A. Factors Affecting Money Supply ( M2) 1 Public Sector 6,018,590 5,851,199 5,850,874 6,064,253 6,241,758 6,176,424 6,161,452 6,217,826 6,176,451
a Budgetary support 5,661,439 5,488,343 5,340,270 5,549,358 5,730,139 5,675,340 5,672,568 5,728,522 5,694,705
b Commodity operations 334,070 339,839 487,905 492,439 490,459 482,104 468,721 468,618 461,119
c Effect of Zakat fund etc. 23,081 23,017 22,699 22,456 21,160 18,979 20,163 20,686 20,627
2 Credit to Non-Government Sector (a+b+c) 4,073,979 4,033,694 4,056,271 4,102,033 4,020,753 4,056,483 4,148,537 4,187,897 4,231,209
a Credit to Private Sector 3,693,120 3,666,970 3,686,275 3,728,727 3,647,466 3,672,859 3,775,751 3,787,104 3,826,354
iii. Commercial Banks 3,563,964 3,535,940 3,554,526 3,596,604 3,514,540 3,539,066 3,640,935 3,651,362 3,690,276
iv. Specialized Banks 129,156 131,029 131,749 132,123 132,925 133,794 134,816 135,742 136,078
b Credit to Public Sector Enterprises (PSEs) 362,422 348,183 351,426 354,709 355,084 365,389 354,350 382,333 386,466
iv. Autonomous bodies 136,866 136,686 131,541 130,283 130,031 130,251 129,896 129,552 131,665
v. Others 249,630 235,572 243,960 248,501 249,128 259,212 248,529 276,855 278,876
vi. PSEs Special Account-Debt Repayment with SBP (24,075) (24,075) (24,075) (24,075) (24,075) (24,075) (24,075) (24,075) (24,075)
c Other Financial Institutions (SBP credit to NBFCs) 18,438 18,541 18,569 18,597 18,204 18,235 18,436 18,460 18,389
3 Other Items (net) (873,788) (935,093) (913,286) (799,244) (1,034,369) (980,833) (917,914) (935,257) (858,918)
4 Domestic Credit Expansion (1+2+3) 9,218,781 8,949,800 8,993,859 9,367,042 9,228,142 9,252,074 9,392,074 9,470,466 9,548,742
a SBP 2,132,001 1,942,264 1,785,871 1,871,572 1,978,528 1,959,331 1,804,492 2,001,394 1,933,559
b Scheduled Banks 7,086,779 7,007,536 7,207,988 7,495,470 7,249,614 7,292,743 7,587,582 7,469,072 7,615,183
5 Foreign Assets (Net) 165,663 359,304 554,686 600,999 578,947 567,779 569,947 570,657 498,651
a SBP 73,983 252,875 429,969 489,643 454,727 434,217 481,614 452,302 420,565
b Scheduled Banks 91,680 106,429 124,717 111,356 124,219 133,562 88,333 118,356 78,086
6 Monetary Expansion (4+5) 9,384,444 9,309,104 9,548,545 9,968,041 9,807,088 9,819,853 9,962,021 10,041,124 10,047,393
B. Components of M2
1 Currency in Circulation 2,116,884 2,125,530 2,158,947 2,177,873 2,312,992 2,205,677 2,261,802 2,328,532 2,338,976
2 Other Deposits with SBP* 10,726 12,839 13,623 13,147 13,198 13,316 13,851 13,078 13,007
3 Total Private & PSE Deposits 7,256,834 7,170,735 7,375,976 7,777,021 7,480,898 7,600,859 7,686,368 7,699,514 7,695,411
of which : RFCDs 562,131 578,584 580,607 599,384 597,130 611,834 617,912 639,134 632,318
Money Supply (1+2+3) 9,384,444 9,309,104 9,548,545 9,968,041 9,807,088 9,819,853 9,962,021 10,041,124 10,047,393
C. Memorandum Items
Accrued Profit on SBP holdings of MRTBs 51,158 63,516 60,158 82,070 85,865 83,795 49,962 57,881 62,652
Outstanding amount of MTBs (realized value in auction) 2,265,393 1,889,355 1,603,091 1,525,175 1,573,225 1,529,081 1,606,367 1,461,736 1,578,168
Net Government Budgetary Borrowing for Budgetary Support
(Estimated on Cash basis as done in government budget)
From Banking System 5,561,675 5,374,916 5,254,341 5,448,425 5,638,380 5,575,023 5,588,291 5,634,759 5,598,420
From SBP 2,226,758 2,112,257 2,216,120 2,327,725 2,451,997 2,436,618 2,288,702 2,425,412 2,079,733
From Scheduled Banks 3,334,916 3,262,658 3,038,221 3,120,700 3,186,383 3,138,405 3,299,590 3,209,347 3,518,687
Note:-The quarterly data covers the period up to the last working day of the month and others months data up to the last working day of last week
* Excluding IMF A/c Nos. 1,2 & SAF A/c loan, counterpart funds and deposits of foreign governments, central banks, international organizations and deposit money banks.

24
2.6 Liabilities and Assets of State Bank of Pakistan
Issue Department (Million Rupees)
LAST WEEKEND/
LAST WORKING
DAY
L I A B I L I T I E S
Total Liabilities /
Assets
A S S E T S
Gold and Foreign Assets
Notes held in
the Banking
Department
Notes in
Circulation
(1)
Gold Coins and
Bullion
(2)
Approved
Foreign
Exchange
(3)
Indian Notes Total
2009 Jun 129.2 1,231,652.3 1,231,781.4 163,592.7 343,492.3 683.7 507,768.6
Dec 143.1 1,386,195.1 1,386,338.2 203,345.6 463,693.3 727.7 667,766.6
2010 Jun 196.6 1,390,933.9 1,391,130.5 212,737.5 478,236.6 727.7 691,701.8
Dec 179.8 1,631,209.0 1,631,388.7 245,512.0 527,187.8 789.4 773,489.3
2011 Jun 154.6 1,599,833.5 1,599,988.0 267,969.4 407,257.4 827.5 676,054.3
Dec 124.8 1,694,829.2 1,694,954.1 285,126.0 490,136.2 827.5 776,089.8
2012 Jun 160.2 1,776,962.4 1,777,122.6 313,077.4 367,326.8 726.7 681,131.0
Dec 184.1 1,958,437.1 1,958,621.2 333,563.2 202,262.3 726.7 536,552.2
2013 Jun 165.6 2,052,684.9 2,052,850.5 284,698.1 100,266.4 726.7 385,691.3
Dec 182.7 2,286,850.7 2,287,033.4 281,689.0 69,936.1 723.4 352,348.6
2014 Jun 110.9 2,309,127.0 2,309,237.9 269,307.9 338,280.8 707.6 608,296.3
2013 Nov 111.3 2,248,696.3 2,248,807.6 281,689.0 29,983.3 723.4 312,395.8
Dec 182.7 2,286,850.7 2,287,033.4 281,689.0 69,936.1 723.4 352,348.6
2014 Jan 197.4 2,247,401.7 2,247,599.0 273,358.6 42,197.3 723.4 316,279.4
Feb 147.7 2,249,420.1 2,249,567.9 288,264.3 77,966.8 723.4 366,954.6
Mar 160.1 2,250,466.5 2,250,626.6 288,264.3 179,365.7 723.4 468,353.5
Apr 120.5 2,234,402.9 2,234,523.4 263,667.6 229,943.9 723.4 494,335.0
May 199.9 2,270,670.4 2,270,870.3 255,618.7 342,792.6 723.4 599,134.8
Jun 110.9 2,309,127.0 2,309,237.9 269,307.9 338,280.8 707.6 608,296.3
Jul 136.1 2,467,952.6 2,468,088.7 269,307.9 526,721.5 707.6 796,737.0
Aug 142.2 2,326,518.0 2,326,660.2 271,182.1 373,405.3 707.6 645,295.0
Sep 108.9 2,371,920.5 2,372,029.5 271,182.1 375,770.5 707.6 647,660.3
Oct 123.8 2,455,484.9 2,455,608.7 248,274.1 381,354.0 707.6 630,335.7
Nov 130.7 2,465,858.3 2,465,989.0 249,769.9 361,792.7 707.6 612,270.2

25
2.6 Liabilities and Assets of State Bank of Pakistan
Issue Department (Million Rupees)
A S S E T S
Domestic Assets Held with Reserve Bank of India pending transfer to Pakistan
LAST
WEEKEND/
LAST
WORKING DAY
Rupee
Coins
Govt. of
Pakistan
Securities
Internal Bills
of Exchange
& other
Commercial
Papers
Total Gold Coin
and Bullion
Sterling
Securities
Govt. of
India
Securities
Rupee
Coins Total
2009 Jun 2,460.1 718,353.1 78.5 720,891.7 2,653.9 446.5 16.0 4.7 3,121.1
Dec 2,316.8 712,411.6 78.5 714,806.9 3,298.8 443.9 17.1 5.0 3,764.8
2010 Jun 2,309.1 693,124.0 78.5 695,511.6 3,451.2 443.9 17.1 5.0 3,917.2
Dec 2,267.3 851,122.7 78.5 853,468.6 3,982.9 424.1 18.5 5.4 4,430.9
2011 Jun 2,225.3 916,804.5 78.5 919,108.3 4,346.5 453.9 19.4 5.6 4,825.4
Dec 2,091.3 911,590.7 78.5 913,760.5 4,624.8 453.9 19.4 5.6 5,103.7
2012 Jun 1,814.2 1,088,514.1 78.5 1,090,406.8 5,075.8 487.0 17.0 5.0 5,584.8
Dec 1,412.8 1,414,660.7 78.5 1,416,152.1 5,408.0 487.0 17.0 5.0 5,916.9
2013 Jun 926.3 1,661,030.0 78.5 1,662,034.8 4,615.5 487.0 17.0 5.0 5,124.4
Dec 753.8 1,928,840.8 - 1,929,594.6 4,566.6 501.7 17.0 4.9 5,090.2
2014 Jun 417.9 1,695,364.5 - 1,695,782.3 4,363.6 555.7 235.2 4.8 5,159.3
2013 Nov 628.0 1,930,693.6 - 1,931,321.6 4,566.6 501.7 17.0 4.9 5,090.2
Dec 753.8 1,928,840.8 - 1,929,594.6 4,566.6 501.7 17.0 4.9 5,090.2
2014 Jan 719.4 1,925,645.0 - 1,926,364.5 4,431.6 501.7 17.0 4.9 4,955.2
Feb 688.2 1,876,728.2 - 1,877,416.4 4,673.2 501.7 17.0 4.9 5,196.8
Mar 647.0 1,776,205.8 - 1,776,852.8 4,673.2 501.7 240.4 4.9 5,420.3
Apr 643.8 1,734,523.1 - 1,735,166.9 4,274.5 501.7 240.4 4.9 5,021.5
May 590.7 1,666,253.8 - 1,666,844.5 4,144.0 501.7 240.4 4.9 4,891.0
Jun 417.9 1,695,364.5 - 1,695,782.3 4,363.6 555.7 235.2 4.8 5,159.3
Jul 368.7 1,665,823.8 - 1,666,192.4 4,363.6 555.7 235.2 4.8 5,159.3
Aug 340.1 1,675,835.4 - 1,676,175.5 4,393.9 555.7 235.2 4.8 5,189.6
Sep 309.4 1,718,870.1 - 1,719,179.5 4,393.9 555.7 235.2 4.8 5,189.6
Oct 288.6 1,820,165.8 - 1,820,454.5 4,022.8 555.7 235.2 4.8 4,818.5
Nov 268.9 1,848,607.1 - 1,848,876.1 4,047.0 555.7 235.2 4.8 4,842.7
1 Gold is valued at end financial year (June ) on the basis of closing London Market Rate. Source: Finance Department SBP
2. Approved Foreign Exchanges includes SDR held with IMF w.e.f June 2004
3. Receivable from Reserve Bank of India.
26
.
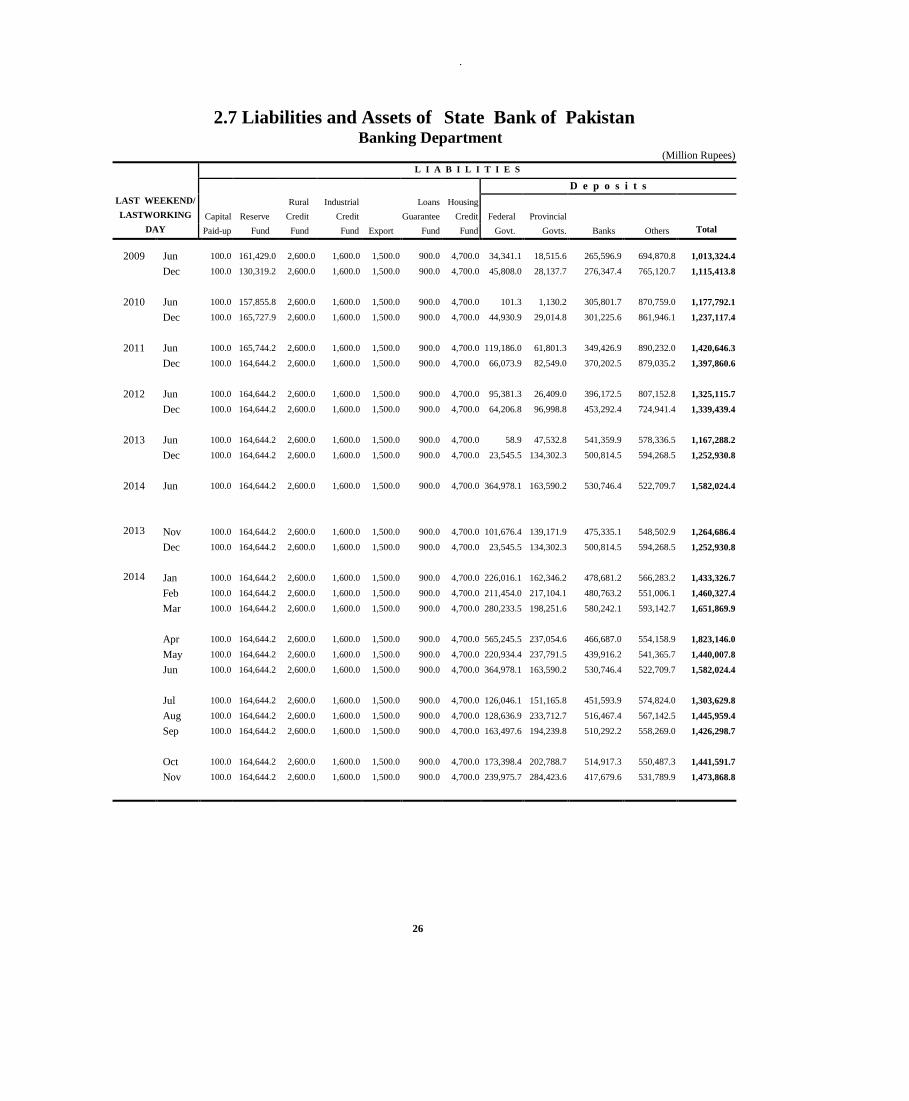
2.7 Liabilities and Assets of State Bank of Pakistan Banking Department
(Million Rupees)
L I A B I L I T I E S
D e p o s i t s
LAST WEEKEND/
Rural Industrial
Loans Housing
LASTWORKING Capital Reserve Credit Credit
Guarantee Credit Federal Provincial
DAY Paid-up Fund Fund Fund Export Fund Fund Govt. Govts. Banks Others Total
2009 Jun 100.0 161,429.0 2,600.0 1,600.0 1,500.0 900.0 4,700.0 34,341.1 18,515.6 265,596.9 694,870.8 1,013,324.4
Dec 100.0 130,319.2 2,600.0 1,600.0 1,500.0 900.0 4,700.0 45,808.0 28,137.7 276,347.4 765,120.7 1,115,413.8
2010 Jun 100.0 157,855.8 2,600.0 1,600.0 1,500.0 900.0 4,700.0 101.3 1,130.2 305,801.7 870,759.0 1,177,792.1
Dec 100.0 165,727.9 2,600.0 1,600.0 1,500.0 900.0 4,700.0 44,930.9 29,014.8 301,225.6 861,946.1 1,237,117.4
2011 Jun 100.0 165,744.2 2,600.0 1,600.0 1,500.0 900.0 4,700.0 119,186.0 61,801.3 349,426.9 890,232.0 1,420,646.3
Dec 100.0 164,644.2 2,600.0 1,600.0 1,500.0 900.0 4,700.0 66,073.9 82,549.0 370,202.5 879,035.2 1,397,860.6
2012 Jun 100.0 164,644.2 2,600.0 1,600.0 1,500.0 900.0 4,700.0 95,381.3 26,409.0 396,172.5 807,152.8 1,325,115.7
Dec 100.0 164,644.2 2,600.0 1,600.0 1,500.0 900.0 4,700.0 64,206.8 96,998.8 453,292.4 724,941.4 1,339,439.4
2013 Jun 100.0 164,644.2 2,600.0 1,600.0 1,500.0 900.0 4,700.0 58.9 47,532.8 541,359.9 578,336.5 1,167,288.2
Dec 100.0 164,644.2 2,600.0 1,600.0 1,500.0 900.0 4,700.0 23,545.5 134,302.3 500,814.5 594,268.5 1,252,930.8
2014 Jun 100.0 164,644.2 2,600.0 1,600.0 1,500.0 900.0 4,700.0 364,978.1 163,590.2 530,746.4 522,709.7 1,582,024.4
2013 Nov 100.0 164,644.2 2,600.0 1,600.0 1,500.0 900.0 4,700.0 101,676.4 139,171.9 475,335.1 548,502.9 1,264,686.4
Dec 100.0 164,644.2 2,600.0 1,600.0 1,500.0 900.0 4,700.0 23,545.5 134,302.3 500,814.5 594,268.5 1,252,930.8
2014 Jan 100.0 164,644.2 2,600.0 1,600.0 1,500.0 900.0 4,700.0 226,016.1 162,346.2 478,681.2 566,283.2 1,433,326.7
Feb 100.0 164,644.2 2,600.0 1,600.0 1,500.0 900.0 4,700.0 211,454.0 217,104.1 480,763.2 551,006.1 1,460,327.4
Mar 100.0 164,644.2 2,600.0 1,600.0 1,500.0 900.0 4,700.0 280,233.5 198,251.6 580,242.1 593,142.7 1,651,869.9
Apr 100.0 164,644.2 2,600.0 1,600.0 1,500.0 900.0 4,700.0 565,245.5 237,054.6 466,687.0 554,158.9 1,823,146.0
May 100.0 164,644.2 2,600.0 1,600.0 1,500.0 900.0 4,700.0 220,934.4 237,791.5 439,916.2 541,365.7 1,440,007.8
Jun 100.0 164,644.2 2,600.0 1,600.0 1,500.0 900.0 4,700.0 364,978.1 163,590.2 530,746.4 522,709.7 1,582,024.4
Jul 100.0 164,644.2 2,600.0 1,600.0 1,500.0 900.0 4,700.0 126,046.1 151,165.8 451,593.9 574,824.0 1,303,629.8
Aug 100.0 164,644.2 2,600.0 1,600.0 1,500.0 900.0 4,700.0 128,636.9 233,712.7 516,467.4 567,142.5 1,445,959.4
Sep 100.0 164,644.2 2,600.0 1,600.0 1,500.0 900.0 4,700.0 163,497.6 194,239.8 510,292.2 558,269.0 1,426,298.7
Oct 100.0 164,644.2 2,600.0 1,600.0 1,500.0 900.0 4,700.0 173,398.4 202,788.7 514,917.3 550,487.3 1,441,591.7
Nov 100.0 164,644.2 2,600.0 1,600.0 1,500.0 900.0 4,700.0 239,975.7 284,423.6 417,679.6 531,789.9 1,473,868.8

27
2.7 Liabilities and Assets of State Bank of Pakistan Banking Department
(Million Rupees)
L I A B I L I T I E S
A S S E T S
Allocation
Bills Purchased and Discounted
LAST WEEKEND/ of Special
Total Notes Internal
LASTWORKING Drawing Bills Re-valuation Other Liabilities/ and Exports
DAY Rights Payable Account Liabilities Assets Coins1 Sector Others Total
2009 Jun 1,526.0 349.0 162,919.7 285,621.0 1,636,569.2 129.2 3.6 33.4 37.0
Dec 107,372.8 491.1 203,317.6 240,694.1 1,809,008.6 143.1 3.6 33.4 37.0
2010 Jun 107,372.8 1,164.3 212,861.7 356,645.1 2,025,091.8 196.6 3.6 33.4 37.0
Dec 129,648.2 595.1 246,168.0 192,290.6 1,982,947.2 179.8 3.6 33.4 37.0
2011 Jun 135,825.8 780.2 268,947.6 83,658.4 2,087,002.5 154.6 3.6 33.4 37.0
Dec 136,093.7 989.0 286,382.5 223,375.3 2,220,745.3 124.8 3.6 33.4 37.0
2012 Jun 141,285.6 587.5 309,565.4 167,653.4 2,120,251.9 160.2 3.6 33.4 37.0
Dec 148,008.8 1,298.8 330,051.2 221,817.3 2,216,659.8 184.1 3.6 33.4 37.0
2013 Jun 147,051.9 605.4 281,170.3 441,173.6 2,213,333.5 165.6 3.6 33.4 37.0
Dec 160,025.8 468.4 489,705.6 300,270.4 2,379,445.2 182.7 3.6 33.4 37.0
2014 Jun 150,772.9 642.1 469,605.0 303,949.6 2,683,038.1 110.9 3.6 33.4 37.0
2013 Nov 164,446.7 420.7 463,727.2 367,394.1 2,436,719.4 111.3 3.6 33.4 37.0
Dec 160,025.8 468.4 489,705.6 300,270.4 2,379,445.2 182.7 3.6 33.4 37.0
2014 Jan 160,053.5 693.9 504,403.2 333,577.7 2,608,099.2 197.4 3.6 33.4 37.0
Feb 159,940.8 507.3 519,308.9 356,868.9 2,672,997.5 147.7 3.6 33.4 37.0
Mar 149,608.3 446.2 519,308.9 382,709.1 2,879,986.7 160.1 3.6 33.4 37.0
Apr 150,040.3 457.8 510,635.7 433,269.1 3,093,593.3 120.5 3.6 33.4 37.0
May 150,391.3 789.9 502,586.8 465,948.2 2,735,768.2 199.9 3.6 33.4 37.0
Jun 150,772.9 642.1 469,605.0 303,949.6 2,683,038.1 110.9 3.6 33.4 37.0
Jul 150,029.5 552.8 469,605.0 323,961.3 2,423,822.5 136.1 3.6 33.4 37.0
Aug 153,711.9 505.0 471,479.2 331,457.6 2,579,157.3 142.2 3.6 33.4 37.0
Sep 151,438.2 423.9 471,479.2 367,394.0 2,593,078.1 108.9 3.6 33.4 37.0
Oct 150,931.0 871.3 452,163.5 439,933.7 2,661,535.5 123.8 3.6 33.4 37.0
Nov 147,419.6 384.9 453,659.3 457,312.6 2,708,689.5 130.7 3.6 33.4 37.0
1 Includes all coins of various denominations
28
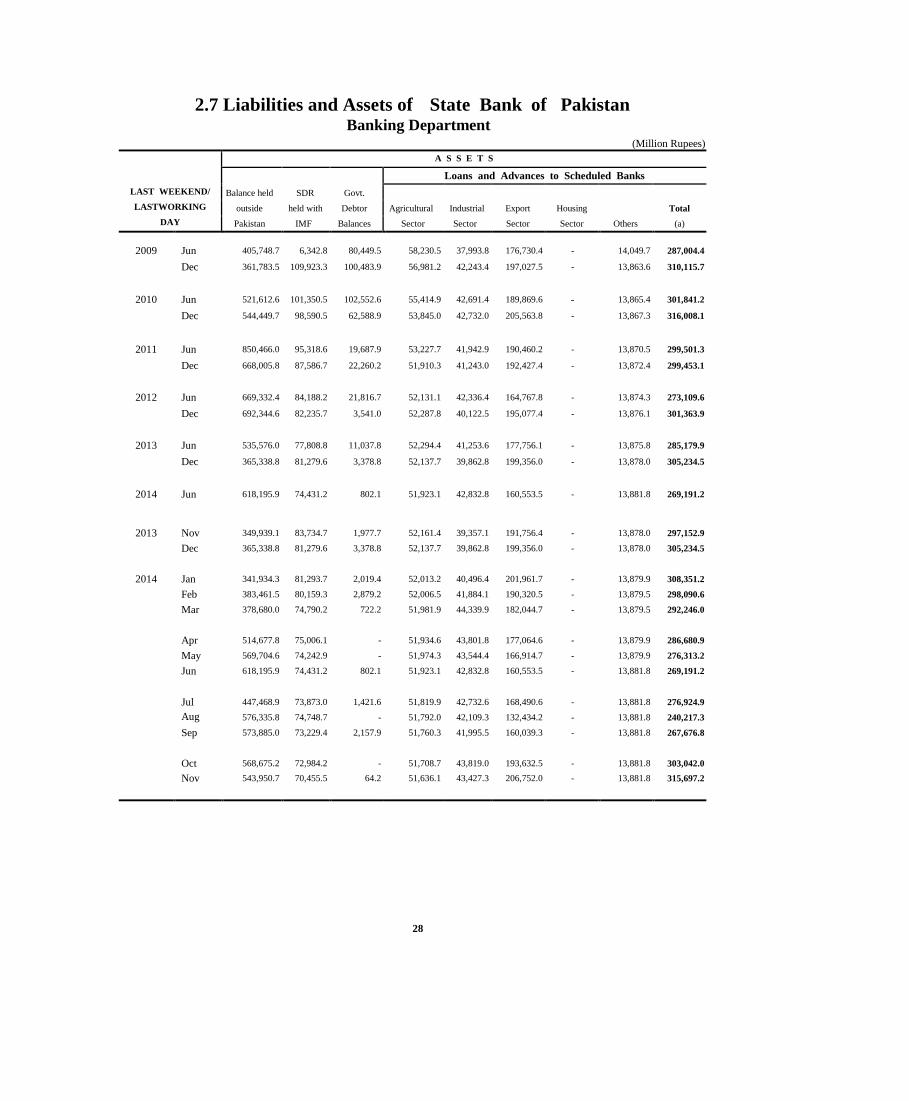
2.7 Liabilities and Assets of State Bank of Pakistan Banking Department
(Million Rupees)
A S S E T S
Loans and Advances to Scheduled Banks
LAST WEEKEND/ Balance held SDR Govt.
LASTWORKING outside held with Debtor Agricultural Industrial Export Housing
Total
DAY Pakistan IMF Balances Sector Sector Sector Sector Others (a)
2009 Jun 405,748.7 6,342.8 80,449.5 58,230.5 37,993.8 176,730.4 - 14,049.7 287,004.4
Dec 361,783.5 109,923.3 100,483.9 56,981.2 42,243.4 197,027.5 - 13,863.6 310,115.7
2010 Jun 521,612.6 101,350.5 102,552.6 55,414.9 42,691.4 189,869.6 - 13,865.4 301,841.2
Dec 544,449.7 98,590.5 62,588.9 53,845.0 42,732.0 205,563.8 - 13,867.3 316,008.1
2011 Jun 850,466.0 95,318.6 19,687.9 53,227.7 41,942.9 190,460.2 - 13,870.5 299,501.3
Dec 668,005.8 87,586.7 22,260.2 51,910.3 41,243.0 192,427.4 - 13,872.4 299,453.1
2012 Jun 669,332.4 84,188.2 21,816.7 52,131.1 42,336.4 164,767.8 - 13,874.3 273,109.6
Dec 692,344.6 82,235.7 3,541.0 52,287.8 40,122.5 195,077.4 - 13,876.1 301,363.9
2013 Jun 535,576.0 77,808.8 11,037.8 52,294.4 41,253.6 177,756.1 - 13,875.8 285,179.9
Dec 365,338.8 81,279.6 3,378.8 52,137.7 39,862.8 199,356.0 - 13,878.0 305,234.5
2014 Jun 618,195.9 74,431.2 802.1 51,923.1 42,832.8 160,553.5 - 13,881.8 269,191.2
2013 Nov 349,939.1 83,734.7 1,977.7 52,161.4 39,357.1 191,756.4 - 13,878.0 297,152.9
Dec 365,338.8 81,279.6 3,378.8 52,137.7 39,862.8 199,356.0 - 13,878.0 305,234.5
2014 Jan 341,934.3 81,293.7 2,019.4 52,013.2 40,496.4 201,961.7 - 13,879.9 308,351.2
Feb 383,461.5 80,159.3 2,879.2 52,006.5 41,884.1 190,320.5 - 13,879.5 298,090.6
Mar 378,680.0 74,790.2 722.2 51,981.9 44,339.9 182,044.7 - 13,879.5 292,246.0
Apr 514,677.8 75,006.1 - 51,934.6 43,801.8 177,064.6 - 13,879.9 286,680.9
May 569,704.6 74,242.9 - 51,974.3 43,544.4 166,914.7 - 13,879.9 276,313.2
Jun 618,195.9 74,431.2 802.1 51,923.1 42,832.8 160,553.5 - 13,881.8 269,191.2
Jul 447,468.9 73,873.0 1,421.6 51,819.9 42,732.6 168,490.6 - 13,881.8 276,924.9
Aug
Jul
576,335.8 74,748.7 - 51,792.0 42,109.3 132,434.2 - 13,881.8 240,217.3
Sep 573,885.0 73,229.4 2,157.9 51,760.3 41,995.5 160,039.3 - 13,881.8 267,676.8
Oct 568,675.2 72,984.2 - 51,708.7 43,819.0 193,632.5 - 13,881.8 303,042.0
Nov 543,950.7 70,455.5 64.2 51,636.1 43,427.3 206,752.0 - 13,881.8 315,697.2

29
2.7 Liabilities and Assets of State Bank of Pakistan
Banking Department
(Million Rupees)
A S S E T S
Loans and Advances to Non-Bank Other I n v e s t m e n t s
LAST WEEKEND/ Financial Companies Loans and
Non-Bank
LAST WORKING Agriculture Industrial Housing
Total Advances Scheduled Financial Govt.
Other
DAY Sector Sector Sector Others (b) (a+b) Banks Companies Securities Others Total Assets
2009 Jun - 1,240.0 11,242.3 - 12,482.3 299,486.7 16,066.2 3,813.4 481,448.1 1,068.4 502,396.1 341,979.2
Dec - 439.8 11,242.3 - 11,682.1 321,797.8 16,066.0 4,313.4 472,670.1 1,068.4 494,117.9 420,722.3
2010 Jun - 1,674.9 11,242.3 - 12,917.2 314,758.4 15,565.9 4,748.9 559,629.0 1,070.8 581,014.6 403,569.5
Dec - 2,475.9 11,242.3 - 13,718.2 329,726.3 15,565.9 4,748.9 631,758.7 1,076.6 653,150.2 294,225.1
2011 Jun 184.2 2,395.3 11,242.3 - 13,821.8 313,323.1 15,563.8 4,748.9 449,052.8 1,093.9 470,459.4 337,556.0
Dec 171.0 3,090.1 11,242.3 - 14,503.4 313,956.5 15,563.8 4,748.9 531,514.1 1,106.5 552,933.3 575,840.9
2012 Jun 157.8 2,585.0 11,242.3 - 13,985.1 287,094.7 15,563.8 4,711.4 717,347.4 1,114.6 738,737.1 318,885.5
Dec 144.7 2,612.4 11,242.3 - 13,999.4 315,363.2 15,563.8 4,711.4 231,282.5 1,127.0 252,684.7 870,269.6
2013 Jun 131.5 3,188.8 11,242.3 - 14,562.6 299,742.5 15,563.8 4,711.4 660,143.5 1,112.2 681,530.9 607,435.0
Dec 118.4 2,990.0 11,242.3 - 14,350.6 319,585.2 201,129.8 3,974.3 1,050,016.0 797.8 1,255,917.9 353,725.3
2014 Jun 120.3 3,260.0 11,242.3 - 14,622.5 283,813.7 230,812.5 3,974.3 1,241,210.4 814.8 1,476,812.0 228,835.3
2013 Nov 118.4 3,086.3 11,242.3 - 14,447.0 311,599.9 201,129.8 3,974.3 976,974.9 797.3 1,182,876.3 506,443.5
Dec 118.4 2,990.0 11,242.3 - 14,350.6 319,585.2 201,129.8 3,974.3 1,050,016.0 797.8 1,255,917.9 353,725.3
2014 Jan 105.2 3,089.9 11,242.3 - 14,437.5 322,788.6 224,157.8 3,974.3 1,104,330.6 803.2 1,333,265.8 526,562.9
Feb 105.2 3,162.3 11,242.3 - 14,509.8 312,600.5 224,157.8 3,974.3 947,293.8 803.1 1,176,229.1 717,483.4
Mar 105.2 3,119.5 11,242.3 - 14,467.0 306,713.0 224,157.8 3,974.3 1,052,637.7 803.2 1,281,573.0 837,311.2
Apr 105.2 3,219.0 11,242.3 - 14,566.5 301,247.4 240,081.3 3,974.3 1,243,125.6 807.3 1,487,988.5 714,515.9
May 105.2 3,247.6 11,242.3 - 14,595.2 290,908.4 240,081.3 3,974.3 1,068,009.5 805.1 1,312,870.2 487,805.3
Jun 120.3 3,260.0 11,242.3 - 14,622.5 283,813.7 230,812.5 3,974.3 1,241,210.4 814.8 1,476,812.0 228,835.3
Jul 107.1 2,879.9 11,242.3 - 14,229.3 291,154.1 230,812.5 3,974.3 1,145,546.0 814.8 1,381,147.6 228,584.3
Aug
Jul 106.3 2,911.9 11,242.3 - 14,260.5 254,477.8 230,812.5 3,974.3 1,202,464.2 814.8 1,438,065.8 235,350.0
Sep 106.3 3,122.4 11,242.3 - 14,471.0 282,147.9 230,812.5 3,974.3 1,032,078.1 814.8 1,267,679.7 393,832.4
Oct 106.3 3,137.2 11,242.3 - 14,485.8 317,527.8 234,404.9 3,974.3 1,029,800.5 821.0 1,269,000.7 425,763.6
Nov 105.5 3,066.7 11,242.3 - 14,414.4 330,111.6 234,404.9 3,974.3 815,965.4 821.0 1,055,165.6 708,774.2
Source: Finance Department SBP

30
2.8 Scheduled Bank’s Consolidated Position
Based on weekly position Liabilities & Assets (All Banks)
(Million Rupees)
FINANCIAL POSITION
2011 2012 2013 2014
Jun Dec Jun Dec Jun Dec Jun
ASSETS
Cash & Balances with Treasury Banks 523,410 578,843 606,664 625,863 732,343 694,547 685,570
Balances with other Banks 141,318 161,090 128,208 170,720 138,208 155,046 149,403
Lending to Financial Institutions 191,624 176,863 134,985 140,010 274,872 218,284 346,851
Investments 2,547,524 2,970,283 3,171,006 3,888,987 4,128,917 4,069,798 4,360,507
Advances – Net of Provision 3,139,041 3,112,996 3,338,280 3,442,950 3,453,296 3,647,790 3,851,990
Gross Advances 3,504,663 3,492,596 3,739,942 3,856,831 3,868,692 4,071,465 4,285,955
Less: Provision for Non- Performing Advances 365,622 379,600 401,662 413,882 415,396 423,675 433,965
Operating Fixed Assets 225,277 230,858 238,669 241,666 247,940 255,922 260,372
Deferred Tax Assets 71,091 73,890 75,114 70,700 67,470 74,149 73,758
Other Assets 455,531 472,288 510,637 539,683 600,374 561,853 692,733
TOTAL ASSETS 7,294,815 7,777,112 8,203,562 9,120,578 9,643,420 9,677,390 10,421,185
LIABILITIES Bills Payable 78,713 83,567 100,033 107,832 160,953 136,599 209,410
Borrowings 548,170 670,295 490,325 1,014,699 804,341 654,751 692,015
Deposits and other Accounts 5,599,098 5,874,689 6,402,735 6,682,648 7,316,341 7,529,370 8,082,412
Sub-ordinated Loans 49,499 50,578 51,158 49,289 42,710 28,926 30,452
Liabilities Against Assets Subject to Finance Lease 163 126 95 62 49 49 33
Deferred Tax Liabilities 6,294 7,076 7,799 11,142 13,869 14,685 9,595
Other Liabilities 288,765 295,611 337,862 359,181 373,523 357,088 407,984
TOTAL LIABILITIES 6,570,703 6,981,943 7,390,007 8,224,853 8,711,785 8,721,469 9,431,901
NET ASSETS 724,112 795,169 813,555 895,725 931,635 955,922 989,283
REPRESENTED BY:
Paid up Capital / Head Office Capital Account 368,113 450,647 458,968 462,776 469,353 480,630 497,119
Reserves 182,920 123,057 138,304 145,528 167,016 165,935 160,761
Un-appropriated / Un-remitted Profit 110,590 160,043 145,524 180,932 175,179 188,879 207,192
Surplus/ (Deficit) on Revaluation of Assets 62,489 61,422 70,759 106,490 120,087 120,477 124,212
TOTAL 724,112 795,169 813,555 895,725 931,635 955,922 989,283

31
2.8 Scheduled Bank’s Consolidated Position*
Based on weekly position Liabilities & Assets (All Banks)
(Million Rupees)
FINANCIAL POSITION 2014
Apr May Jun Jul Aug Sep Oct Nov P
ASSETS
Cash & Balances with Treasury Banks 627,778 628,584 685,570 683,722 717,856 676,003 719,922 613,894
Balances with other Banks 126,115 159,517 149,403 120,559 149,553 145,663 152,609 115,719
Lending to Financial Institutions 255,369 265,655 346,851 310,603 286,836 294,307 378,952 358,607
Investments 4,466,656 4,221,013 4,360,507 4,406,077 4,375,348 4,468,963 4,492,817 4,832,103
Advances – Net of Provision 3,667,350 3,833,327 3,851,990 3,805,985 3,812,650 3,849,205 3,882,965 3,963,385
Gross Advances 4,087,607 4,255,979 4,285,955 4,240,101 4,247,249 4,282,669 4,317,135 4,398,758
Less: Provision for Non-Performing
Advances 420,257 422,652 433,965 434,117 434,599 433,464 434,170 435,373
Operating Fixed Assets 258,928 259,436 260,372 260,947 262,675 265,042 264,188 265,214
Deferred Tax Assets 73,682 72,196 73,758 71,601 71,869 71,583 70,745 68,922
Other Assets 590,958 631,058 692,733 596,450 606,768 610,015 701,897 719,278
TOTAL ASSETS 10,066,837 10,070,786 10,421,185 10,255,943 10,283,557 10,380,780 10,664,095 10,937,121
LIABILITIES
Bills Payable 128,686 138,988 209,410 140,250 139,266 148,581 152,051 151,784
Borrowings 928,861 717,632 692,015 732,703 617,855 756,362 854,737 1,060,676
Deposits and other Accounts 7,585,540 7,803,077 8,082,412 7,980,033 8,132,458 8,036,547 8,160,094 8,150,407
Sub-ordinated Loans 32,543 32,308 30,452 34,661 33,981 31,169 37,802 37,528
Liabilities Against Assets Subject to Finance
Lease 33 33 33 33 32 26 45 44
Deferred Tax Liabilities 10,824 9,989 9,595 8,589 8,330 8,486 10,613 12,462
Other Liabilities 381,521 388,932 407,984 366,833 366,333 389,374 401,710 433,793
TOTAL LIABILITIES 9,068,008 9,090,959 9,431,901 9,263,102 9,298,256 9,370,546 9,617,052 9,846,694
NET ASSETS 998,829 979,827 989,283 992,841 985,301 1,010,234 1,047,043 1,090,428
REPRESENTED BY:
Paid up Capital / Head Office Capital Account 496,092 497,115 497,119 497,215 497,319 497,358 491,995 491,959
Reserves 160,719 159,956 160,761 161,720 164,532 164,842 169,113 170,263
Un-appropriated / Un-remitted Profit 193,929 189,339 207,192 206,729 206,305 219,956 223,482 242,564
Surplus/ (Deficit) on Revaluation of Assets 148,088 133,418 124,212 127,178 117,145 128,079 162,453 185,641
TOTAL 998,829 979,827 989,283 992,841 985,301 1,010,234 1,047,043 1,090,428
* Month End Source: Off-Site Supervision & Enforcement Department SBP
32
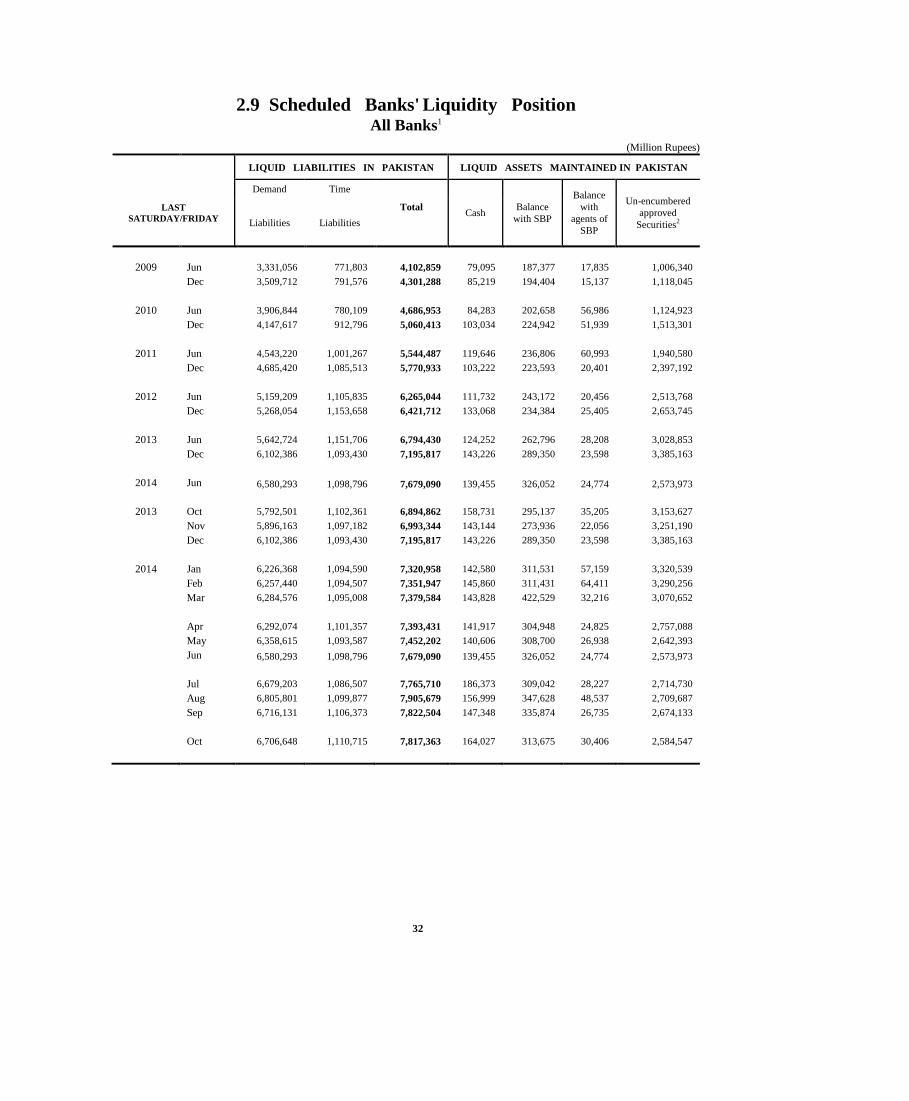
2.9 Scheduled Banks' Liquidity Position All Banks1
(Million Rupees)
LIQUID LIABILITIES IN PAKISTAN LIQUID ASSETS MAINTAINED IN PAKISTAN
LAST
SATURDAY/FRIDAY
Demand Time
Total
Cash
Balance
with SBP
Balance
with
agents of
SBP
Un-encumbered
approved
Securities2 Liabilities Liabilities
2009 Jun 3,331,056 771,803 4,102,859 79,095 187,377 17,835 1,006,340
Dec 3,509,712 791,576 4,301,288 85,219 194,404 15,137 1,118,045
2010 Jun 3,906,844 780,109 4,686,953 84,283 202,658 56,986 1,124,923
Dec 4,147,617 912,796 5,060,413 103,034 224,942 51,939 1,513,301
2011 Jun 4,543,220 1,001,267 5,544,487 119,646 236,806 60,993 1,940,580
Dec 4,685,420 1,085,513 5,770,933 103,222 223,593 20,401 2,397,192
2012 Jun 5,159,209 1,105,835 6,265,044 111,732 243,172 20,456 2,513,768
Dec 5,268,054 1,153,658 6,421,712 133,068 234,384 25,405 2,653,745
2013 Jun 5,642,724 1,151,706 6,794,430 124,252 262,796 28,208 3,028,853
Dec 6,102,386 1,093,430 7,195,817 143,226 289,350 23,598 3,385,163
2014 Jun 6,580,293 1,098,796 7,679,090 139,455 326,052 24,774 2,573,973
2013 Oct 5,792,501 1,102,361 6,894,862 158,731 295,137 35,205 3,153,627
Nov 5,896,163 1,097,182 6,993,344 143,144 273,936 22,056 3,251,190
Dec 6,102,386 1,093,430 7,195,817 143,226 289,350 23,598 3,385,163
2014 Jan 6,226,368 1,094,590 7,320,958 142,580 311,531 57,159 3,320,539
Feb 6,257,440 1,094,507 7,351,947 145,860 311,431 64,411 3,290,256
Mar 6,284,576 1,095,008 7,379,584 143,828 422,529 32,216 3,070,652
Apr 6,292,074 1,101,357 7,393,431 141,917 304,948 24,825 2,757,088
May 6,358,615 1,093,587 7,452,202 140,606 308,700 26,938 2,642,393
Jun 6,580,293 1,098,796 7,679,090 139,455 326,052 24,774 2,573,973
Jul 6,679,203 1,086,507 7,765,710 186,373 309,042 28,227 2,714,730
Aug 6,805,801 1,099,877 7,905,679 156,999 347,628 48,537 2,709,687
Sep 6,716,131 1,106,373 7,822,504 147,348 335,874 26,735 2,674,133
Oct 6,706,648 1,110,715 7,817,363 164,027 313,675 30,406 2,584,547
33
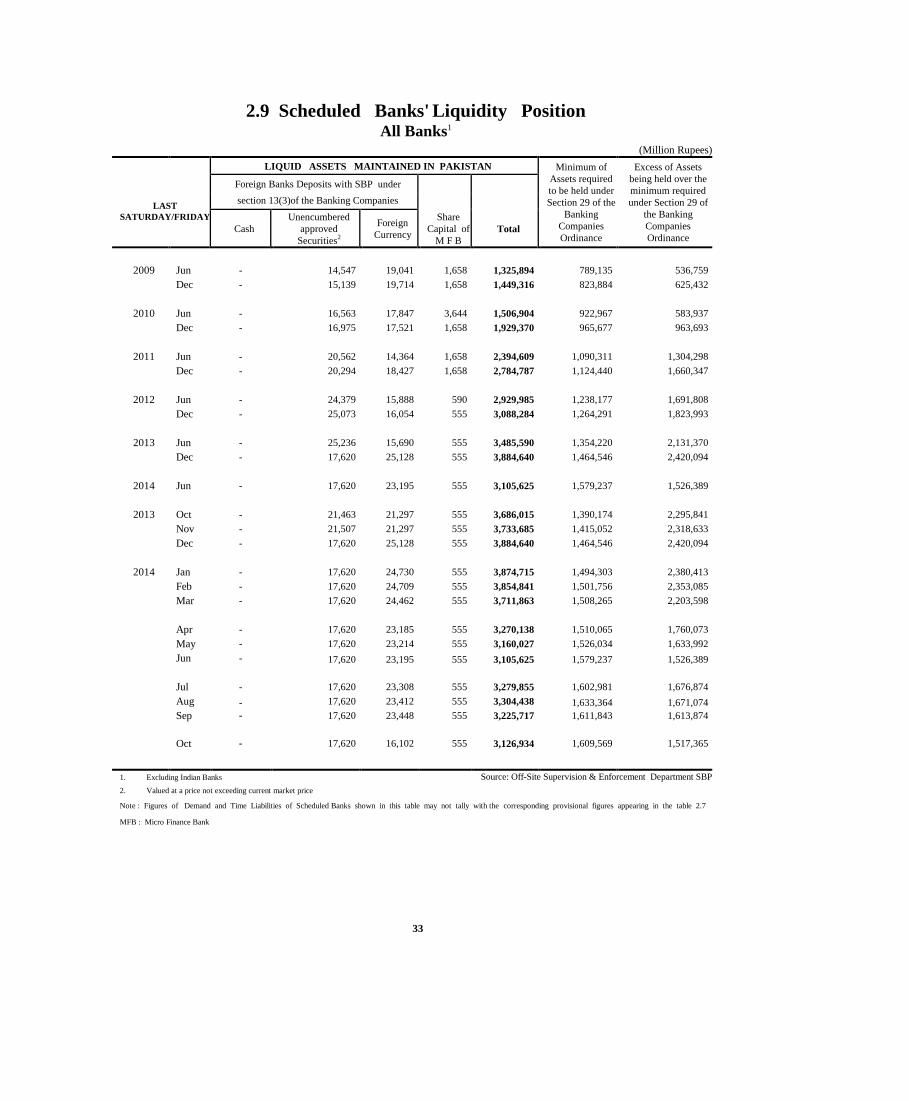
2.9 Scheduled Banks' Liquidity Position All Banks1
(Million Rupees)
LIQUID ASSETS MAINTAINED IN PAKISTAN Minimum of
Assets required
to be held under
Section 29 of the
Banking
Companies
Ordinance
Excess of Assets
being held over the
minimum required
under Section 29 of
the Banking
Companies
Ordinance
LAST
SATURDAY/FRIDAY
Foreign Banks Deposits with SBP under
section 13(3)of the Banking Companies
Ordinance
Cash
Unencumbered
approved
Securities2
Foreign
Currency
Share
Capital of
M F B
Total
2009 Jun - 14,547 19,041 1,658 1,325,894 789,135 536,759
Dec - 15,139 19,714 1,658 1,449,316 823,884 625,432
2010 Jun - 16,563 17,847 3,644 1,506,904 922,967 583,937
Dec - 16,975 17,521 1,658 1,929,370 965,677 963,693
2011 Jun - 20,562 14,364 1,658 2,394,609 1,090,311 1,304,298
Dec - 20,294 18,427 1,658 2,784,787 1,124,440 1,660,347
2012 Jun - 24,379 15,888 590 2,929,985 1,238,177 1,691,808
Dec - 25,073 16,054 555 3,088,284 1,264,291 1,823,993
2013 Jun - 25,236 15,690 555 3,485,590 1,354,220 2,131,370
Dec - 17,620 25,128 555 3,884,640 1,464,546 2,420,094
2014 Jun - 17,620 23,195 555 3,105,625 1,579,237 1,526,389
2013 Oct - 21,463 21,297 555 3,686,015 1,390,174 2,295,841
Nov - 21,507 21,297 555 3,733,685 1,415,052 2,318,633
Dec - 17,620 25,128 555 3,884,640 1,464,546 2,420,094
2014 Jan - 17,620 24,730 555 3,874,715 1,494,303 2,380,413
Feb - 17,620 24,709 555 3,854,841 1,501,756 2,353,085
Mar - 17,620 24,462 555 3,711,863 1,508,265 2,203,598
Apr - 17,620 23,185 555 3,270,138 1,510,065 1,760,073
May - 17,620 23,214 555 3,160,027 1,526,034 1,633,992
Jun - 17,620 23,195 555 3,105,625 1,579,237 1,526,389
Jul - 17,620 23,308 555 3,279,855 1,602,981 1,676,874
Aug - 17,620 23,412 555 3,304,438 1,633,364 1,671,074
Sep - 17,620 23,448 555 3,225,717 1,611,843 1,613,874
Oct - 17,620 16,102 555 3,126,934 1,609,569 1,517,365
1. Excluding Indian Banks Source: Off-Site Supervision & Enforcement Department SBP
2. Valued at a price not exceeding current market price
Note : Figures of Demand and Time Liabilities of Scheduled Banks shown in this table may not tally with the corresponding provisional figures appearing in the table 2.7
MFB : Micro Finance Bank
34
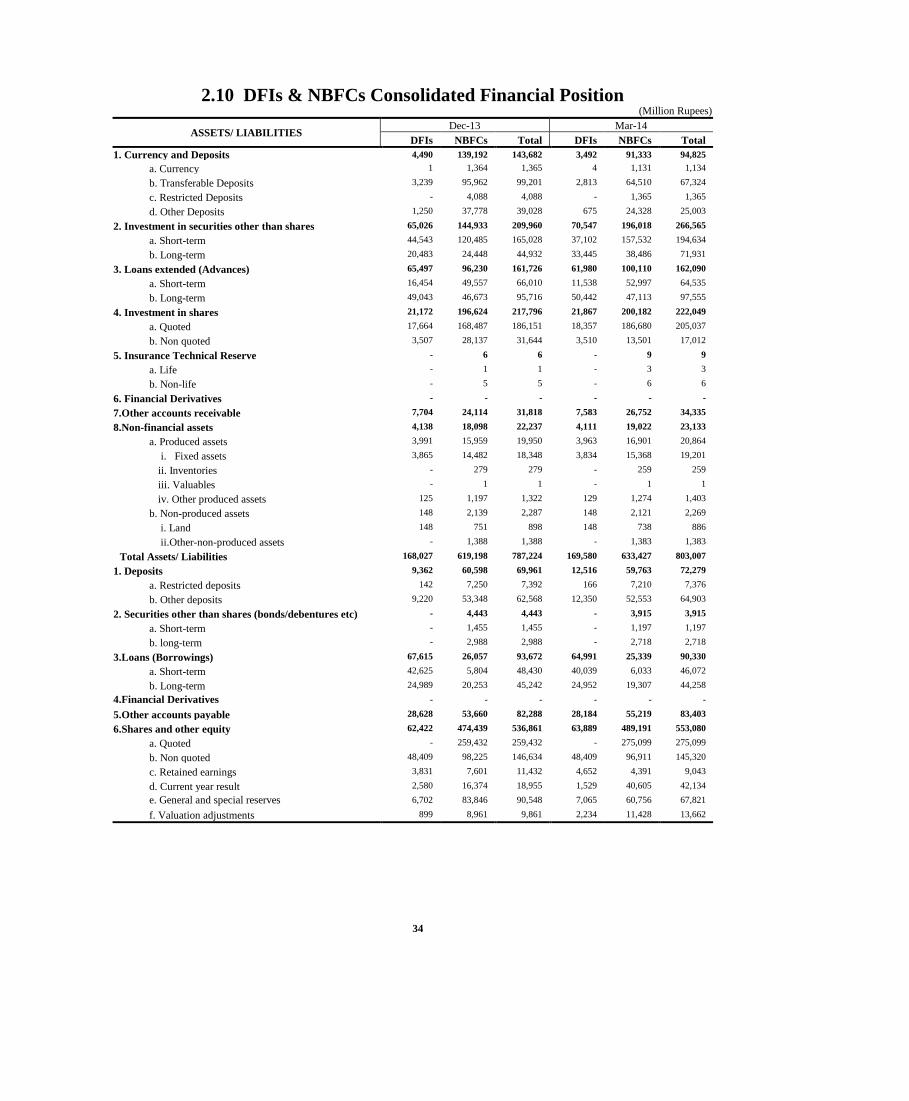
2.10 DFIs & NBFCs Consolidated Financial Position (Million Rupees)
ASSETS/ LIABILITIES Dec-13 Mar-14
DFIs NBFCs Total DFIs NBFCs Total
1. Currency and Deposits 4,490 139,192 143,682 3,492 91,333 94,825
a. Currency 1 1,364 1,365 4 1,131 1,134
b. Transferable Deposits 3,239 95,962 99,201 2,813 64,510 67,324
c. Restricted Deposits - 4,088 4,088 - 1,365 1,365
d. Other Deposits 1,250 37,778 39,028 675 24,328 25,003
2. Investment in securities other than shares 65,026 144,933 209,960 70,547 196,018 266,565
a. Short-term 44,543 120,485 165,028 37,102 157,532 194,634
b. Long-term 20,483 24,448 44,932 33,445 38,486 71,931
3. Loans extended (Advances) 65,497 96,230 161,726 61,980 100,110 162,090
a. Short-term 16,454 49,557 66,010 11,538 52,997 64,535
b. Long-term 49,043 46,673 95,716 50,442 47,113 97,555
4. Investment in shares 21,172 196,624 217,796 21,867 200,182 222,049
a. Quoted 17,664 168,487 186,151 18,357 186,680 205,037
b. Non quoted 3,507 28,137 31,644 3,510 13,501 17,012
5. Insurance Technical Reserve - 6 6 - 9 9
a. Life - 1 1 - 3 3
b. Non-life - 5 5 - 6 6
6. Financial Derivatives - - - - - -
7.Other accounts receivable 7,704 24,114 31,818 7,583 26,752 34,335
8.Non-financial assets 4,138 18,098 22,237 4,111 19,022 23,133
a. Produced assets 3,991 15,959 19,950 3,963 16,901 20,864
i. Fixed assets 3,865 14,482 18,348 3,834 15,368 19,201
ii. Inventories - 279 279 - 259 259
iii. Valuables - 1 1 - 1 1
iv. Other produced assets 125 1,197 1,322 129 1,274 1,403
b. Non-produced assets 148 2,139 2,287 148 2,121 2,269
i. Land 148 751 898 148 738 886
ii.Other-non-produced assets - 1,388 1,388 - 1,383 1,383
Total Assets/ Liabilities 168,027 619,198 787,224 169,580 633,427 803,007
1. Deposits 9,362 60,598 69,961 12,516 59,763 72,279
a. Restricted deposits 142 7,250 7,392 166 7,210 7,376
b. Other deposits 9,220 53,348 62,568 12,350 52,553 64,903
2. Securities other than shares (bonds/debentures etc) - 4,443 4,443 - 3,915 3,915
a. Short-term - 1,455 1,455 - 1,197 1,197
b. long-term - 2,988 2,988 - 2,718 2,718
3.Loans (Borrowings) 67,615 26,057 93,672 64,991 25,339 90,330
a. Short-term 42,625 5,804 48,430 40,039 6,033 46,072
b. Long-term 24,989 20,253 45,242 24,952 19,307 44,258
4.Financial Derivatives - - - - - -
5.Other accounts payable 28,628 53,660 82,288 28,184 55,219 83,403
6.Shares and other equity 62,422 474,439 536,861 63,889 489,191 553,080
a. Quoted - 259,432 259,432 - 275,099 275,099
b. Non quoted 48,409 98,225 146,634 48,409 96,911 145,320
c. Retained earnings 3,831 7,601 11,432 4,652 4,391 9,043
d. Current year result 2,580 16,374 18,955 1,529 40,605 42,134
e. General and special reserves 6,702 83,846 90,548 7,065 60,756 67,821
f. Valuation adjustments 899 8,961 9,861 2,234 11,428 13,662

35
2.10 DFIs & NBFCs Consolidated Financial Position (Million Rupees)
ASSETS/ LIABILITIES Jun-14 Sep-14 P
DFIs NBFCs* Total DFIs NBFCs* Total
1. Currency and Deposits 4,464 142,693 147,157 3,997 108,595 112,592
a. Currency 3 1,487 1,490 5 1,522 1,526
b. Transferable Deposits 3,405 103,718 107,123 3,347 77,173 80,520
c. Restricted Deposits - 2,994 2,994 - 3,364 3,364
d. Other Deposits 1,056 34,494 35,551 645 26,536 27,182
2. Investment in securities other than shares 77,329 145,513 222,842 84,467 166,574 251,042
a. Short-term 27,923 89,481 117,404 25,273 107,029 132,303
b. Long-term 49,406 56,032 105,438 59,194 59,545 118,739
3. Loans extended (Advances) 65,037 99,032 164,069 61,741 99,913 161,653
a. Short-term 11,531 52,717 64,247 6,872 53,355 60,226
b. Long-term 53,506 46,315 99,821 54,869 46,558 101,427
4. Investment in shares 27,547 205,901 233,448 27,719 207,832 235,551
a. Quoted 22,677 190,591 213,269 22,784 192,227 215,011
b. Non-quoted 4,870 15,310 20,179 4,935 15,605 20,540
5. Insurance Technical Reserve - 7 7 - 4 4
a. Life - 2 2 - 2 2
b. Non-life - 4 4 - 2 2
6. Financial Derivatives - - - - - -
7.Other accounts receivable 8,695 33,508 42,202 8,529 33,519 42,048
8.Non-financial assets 3,985 19,237 23,222 4,145 19,388 23,532
a. Produced assets 3,837 17,189 21,026 3,997 17,110 21,107
i. Fixed assets 2,354 15,532 17,886 3,868 15,424 19,292
ii . Inventories - 329 329 - 366 366
iii. Valuables 136 1 137 - 1 1
iv. Other produced assets 1,347 1,327 2,675 129 1,319 1,448
b. Non-produced assets 148 2,048 2,196 148 2,278 2,425
i. Land 148 733 881 148 733 881
ii. Other-non-produced assets - 1,315 1,315 - 1,544 1,544
Total Assets/ Liabilities 187,057 645,890 832,947 190,598 635,825 826,423
1. Deposits 11,549 66,027 77,576 13,268 64,285 77,553
a. Restricted deposits 159 9,894 10,053 168 8,027 8,195
b. Other deposits 11,390 56,133 67,523 13,100 56,258 69,359
2. Securities other than shares (bonds/debentures etc) - 3,805 3,805 - 3,449 3,449
a. Short-term - 1,240 1,240 - 1,044 1,044
b. long-term - 2,565 2,565 - 2,405 2,405
3.Loans (Borrowings) 75,969 26,082 102,051 77,335 26,482 103,817
a. Short-term 50,668 6,179 56,847 53,207 5,689 58,896
b. Long-term 25,301 19,903 45,204 24,127 20,793 44,921
4.Financial Derivatives - - - - - -
5.Other accounts payable 29,819 74,068 103,887 29,232 58,547 87,779
6.Shares and other equity 69,720 475,909 545,629 70,762 483,062 553,825
a. Quoted - 273,890 273,890 - 277,557 277,557
b. Non-quoted 48,409 90,705 139,114 48,409 94,893 143,302
c. Retained earnings 10,441 (5,543) 4,899 9,924 8,533 18,456
d. Current year result 2,099 24,597 26,696 3,602 7,133 10,735
e. General & special reserves 7,125 81,975 89,101 7,351 83,661 91,012
f. Valuation adjustments 1,645 10,284 11,929 1,477 11,286 12,762
*: Including Microfinance Banks
NBFCs Non Bank Financial Companies
DFIs Development Finance Institutions
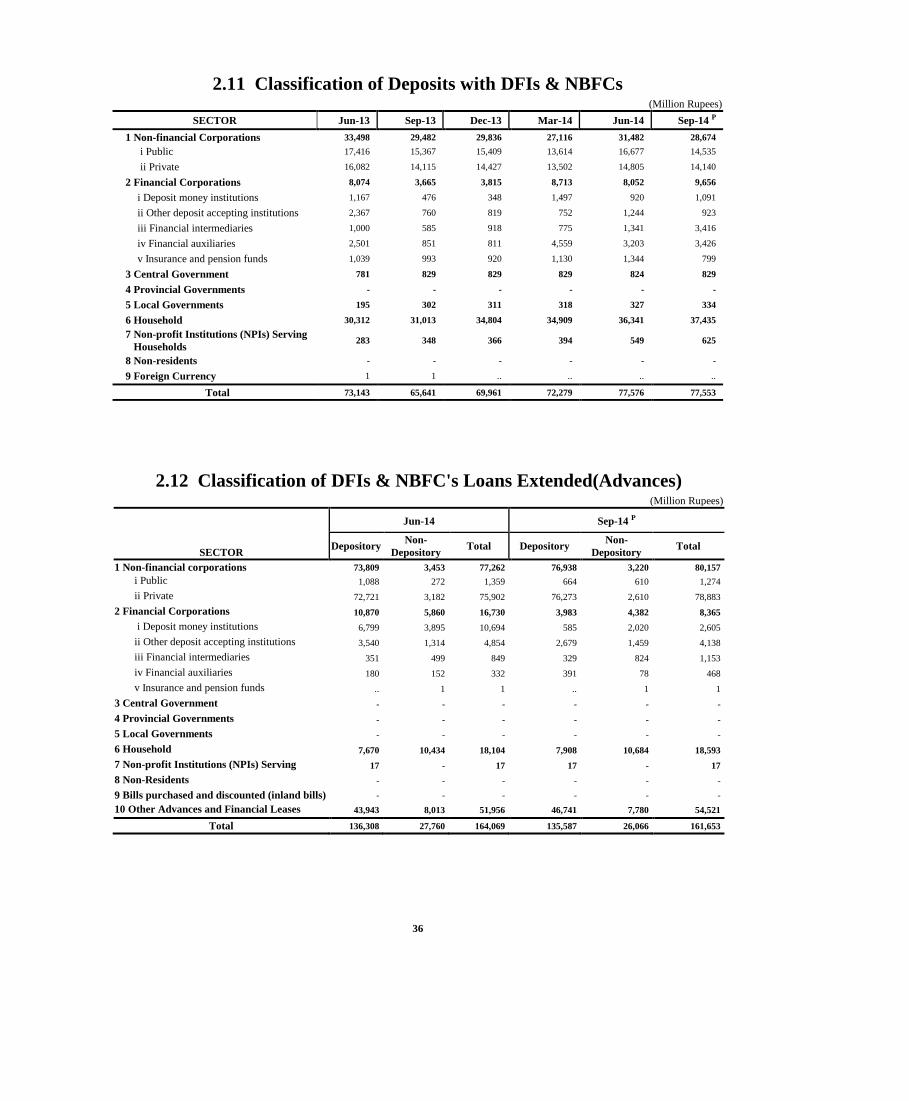
36
2.12 Classification of DFIs & NBFC's Loans Extended(Advances) (Million Rupees)
Jun-14 Sep-14 P
SECTOR Depository
Non-
Depository Total Depository
Non-
Depository Total
1 Non-financial corporations 73,809 3,453 77,262 76,938 3,220 80,157
i Public 1,088 272 1,359 664 610 1,274
ii Private 72,721 3,182 75,902 76,273 2,610 78,883
2 Financial Corporations 10,870 5,860 16,730 3,983 4,382 8,365
i Deposit money institutions 6,799 3,895 10,694 585 2,020 2,605
ii Other deposit accepting institutions 3,540 1,314 4,854 2,679 1,459 4,138
iii Financial intermediaries 351 499 849 329 824 1,153
iv Financial auxiliaries 180 152 332 391 78 468
v Insurance and pension funds .. 1 1 .. 1 1
3 Central Government - - - - - -
4 Provincial Governments - - - - - -
5 Local Governments - - - - - -
6 Household 7,670 10,434 18,104 7,908 10,684 18,593
7 Non-profit Institutions (NPIs) Serving
Households 17 - 17 17 - 17
8 Non-Residents - - - - - -
9 Bills purchased and discounted (inland bills) - - - - - -
10 Other Advances and Financial Leases 43,943 8,013 51,956 46,741 7,780 54,521
Total 136,308 27,760 164,069 135,587 26,066 161,653
2.11 Classification of Deposits with DFIs & NBFCs
(Million Rupees)
SECTOR Jun-13 Sep-13 Dec-13 Mar-14 Jun-14 Sep-14 P
1 Non-financial Corporations 33,498 29,482 29,836 27,116 31,482 28,674
i Public 17,416 15,367 15,409 13,614 16,677 14,535
ii Private 16,082 14,115 14,427 13,502 14,805 14,140
2 Financial Corporations 8,074 3,665 3,815 8,713 8,052 9,656
i Deposit money institutions 1,167 476 348 1,497 920 1,091
ii Other deposit accepting institutions 2,367 760 819 752 1,244 923
iii Financial intermediaries 1,000 585 918 775 1,341 3,416
iv Financial auxiliaries 2,501 851 811 4,559 3,203 3,426
v Insurance and pension funds 1,039 993 920 1,130 1,344 799
3 Central Government 781 829 829 829 824 829
4 Provincial Governments - - - - - -
5 Local Governments 195 302 311 318 327 334
6 Household 30,312 31,013 34,804 34,909 36,341 37,435
7 Non-profit Institutions (NPIs) Serving
Households 283 348 366 394 549 625
8 Non-residents - - - - - -
9 Foreign Currency 1 1 .. .. .. ..
Total 73,143 65,641 69,961 72,279 77,576 77,553

37
2.13 Classification of DFIs & NBFC's Investments
in Securities and Shares
(Million Rupees)
SECURITIES
Jun-14 Sep-14 P
Depository Non-
Depository Total Depository
Non-
Depository Total
A. Securities 81,159 141,682 222,842 89,994 161,048 251,042
1 Non-financial Corporations 11,411 8,330 19,740 11,632 11,006 22,638
i Public 234 2,018 2,252 275 4,302 4,578
ii Private 11,177 6,311 17,488 11,357 6,704 18,060
2 Financial Corporations 7,992 13,333 21,325 7,190 15,238 22,429
i Deposit money institutions 7,037 4,181 11,218 6,156 3,982 10,139
ii Other deposit accepting institutions 835 4,408 5,243 995 6,305 7,300
iii Financial intermediaries 120 4,696 4,816 40 4,902 4,941
iv Financial auxiliaries - - - - - -
v Insurance and pension funds - 48 48 - 49 49
3 Central Government 61,749 120,019 181,769 71,164 134,003 205,167
4 Provincial Governments - - - - - -
5 Local Governments - - - - - -
6 Household - - - - - -
7 Non-profit institutions (NPIs) Serving Households - - - - - -
8 Non-Residents - - - - - -
9 Foreign Currency 8 - 8 8 800 808
B. Shares 31,671 201,777 233,448 31,916 203,635 235,551
1 Non-financial Corporations 11,005 184,195 195,200 10,865 186,482 197,346
i Public 1,721 150,310 152,031 1,764 154,330 156,094
ii Private 9,284 33,885 43,169 9,101 32,151 41,252
2 Financial Corporations 18,965 17,341 36,306 19,253 16,929 36,182
i Deposit money institutions 8,449 8,286 16,735 8,460 6,375 14,835
ii Other deposit accepting institutions 1,482 1,379 2,861 1,462 1,612 3,075
iii Financial intermediaries 7,768 6,470 14,238 7,912 7,494 15,406
iv Financial auxiliaries 289 4 292 289 2 290
v Insurance and pension funds 978 1,201 2,179 1,130 1,446 2,575
3 Central Government - - - - - -
4 Provincial Governments - - - - - -
5 Local Governments - - - - - -
6 Household - - - - - -
7 Non-profit institutions (NPIs) Serving Households - - - - - -
8 Non-residents 1,701 241 1,943 1,798 224 2,022
Total (A+B) 112,831 343,459 456,290 121,910 364,682 486,592

38
2.14 Currency in Circulation
( Million Rupees )
Year/Month1
Five Rupee
Bills & Above
One Rupee
Coins and above
Subsidiary
Coins
Total
( 1+2+3 )
Held by
Banking
Department
of SBP
Held by Issue
Department of
SBP
Currency in
tills of
Scheduled
Banks
Currency in
Circulation
(4-5-6-7)
1 2 3 4 5 6 7 8
2009 Jun 1,223,521 7,685 665 1,231,871 196 2,496 77,006 1,152,173
Dec 1,368,144 7,683 665 1,376,492 194 2,317 77,070 1,296,911
2010 Jun 1,377,277 7,606 665 1,385,548 117 2,373 87,673 1,295,385
Dec 1,595,122 7,594 665 1,603,381 106 2,306 86,095 1,514,875
2011 Jun 1,599,833 8,142 665 1,608,641 155 2,225 104,852 1,501,409
Dec 1,694,829 8,112 665 1,703,607 125 2,091 110,188 1,591,203
2012 Jun 1,776,962 8,148 665 1,785,775 160 1,814 110,055 1,673,746
Dec 1,958,437 8,172 665 1,967,274 184 1,413 131,265 1,834,412
2013 Jun 2,041,361 8,131 665 2,050,158 143 925 110,867 1,938,222
Dec 2,212,092 8,125 665 2,220,882 137 749 133,340 2,086,655
2014 Jun 2,309,127 8,099 666 2,317,891 111 418 139,490 2,177,873
2013 Nov 2,248,696 8,099 666 2,257,462 111 628 122,083 2,134,640
Dec 2,212,092 8,125 665 2,220,882 137 749 133,340 2,086,655
2014 Jan 2,247,402 8,185 666 2,256,252 197 719 117,581 2,137,754
Feb 2,249,420 8,135 666 2,258,221 148 688 120,244 2,137,141
Mar 2,246,020 8,093 666 2,254,779 106 646 137,143 2,116,884
Apr 2,234,403 8,108 666 2,243,177 121 644 116,883 2,125,530
May 2,270,670 8,188 666 2,279,524 200 591 119,786 2,158,947
Jun 2,309,127 8,099 666 2,317,891 111 418 139,490 2,177,873
Jul 2,467,953 8,124 666 2,476,742 136 369 163,246 2,312,992
Aug 2,326,518 8,130 666 2,335,314 142 340 129,155 2,205,677
Sep 2,388,843 8,177 666 2,397,685 189 311 135,383 2,261,802
Oct 2,455,485 8,112 - 2,463,597 124 289 134,652 2,328,532
Nov P 2,465,858 8,119 - 2,473,977 131 269 134,601 2,338,976
1:- The quarter end data relates to last working day whereas monthly data are of last Friday of the month.
Note: i - Totals may not tally due to separate rounding off.
ii -Data is based on weekly returns. Therefore, these estimates are not comparable with the monthly data given in table 2.1. The comparison
of weekly and monthly compilation methodologies is available the link : http://www.sbp.org.pk/ecodata.asp

39
2.15 Government Budgetary Borrowing from Banks
(Million Rupees)
ITEMS
Stocks Monetary Impact During
30-Jun-14 30-Jun-13
1st Jul 14
to
28st Nov 14
1st Jul13
to
29th Nov 13
1. Central Government (a+b) 6,059,496 5,561,994 251,932 522,446
a. Scheduled Banks 3,491,821 3,320,870 400,155 (36,242)
T-Bills and Securities 3,963,610 3,728,627 419,317 (69,295)
Less:
Government Deposits 471,789 407,757 19,162 (33,053)
b. State Bank 2,567,674 2,241,124 (148,223) 558,688
T-bills and Securities etc. Debtor Balances 2,937,130 2,323,269 (272,002) 584,954
(Excluding Zakat Fund)
Less:
Government Deposits 383,571 96,260 (124,445) 26,267
(Excluding Zakat and Privatization Fund)
Others (14,116) (14,115) 666 ..
2. Provincial Governments (c+d) (510,138) (315,607) (106,584) (102,698)
c. Scheduled Banks (352,258) (287,393) 12,601 (787)
Government Securities and Others 1,024 1,024 - -
Less:
Government Deposits 353,282 288,417 (12,601) 787
d. State Bank (157,880) (28,214) (119,186) (101,911)
Government Securities - - - -
Debtor Balances 802 13,715 (738) (11,738)
(Excluding Zakat Fund)
Less:
Government Deposits 158,682 41,930 118,448 90,174
(Excluding Zakat Fund)
Net Budgetary Borrowing from the Banking System 5,549,358 5,246,387 145,347 419,747
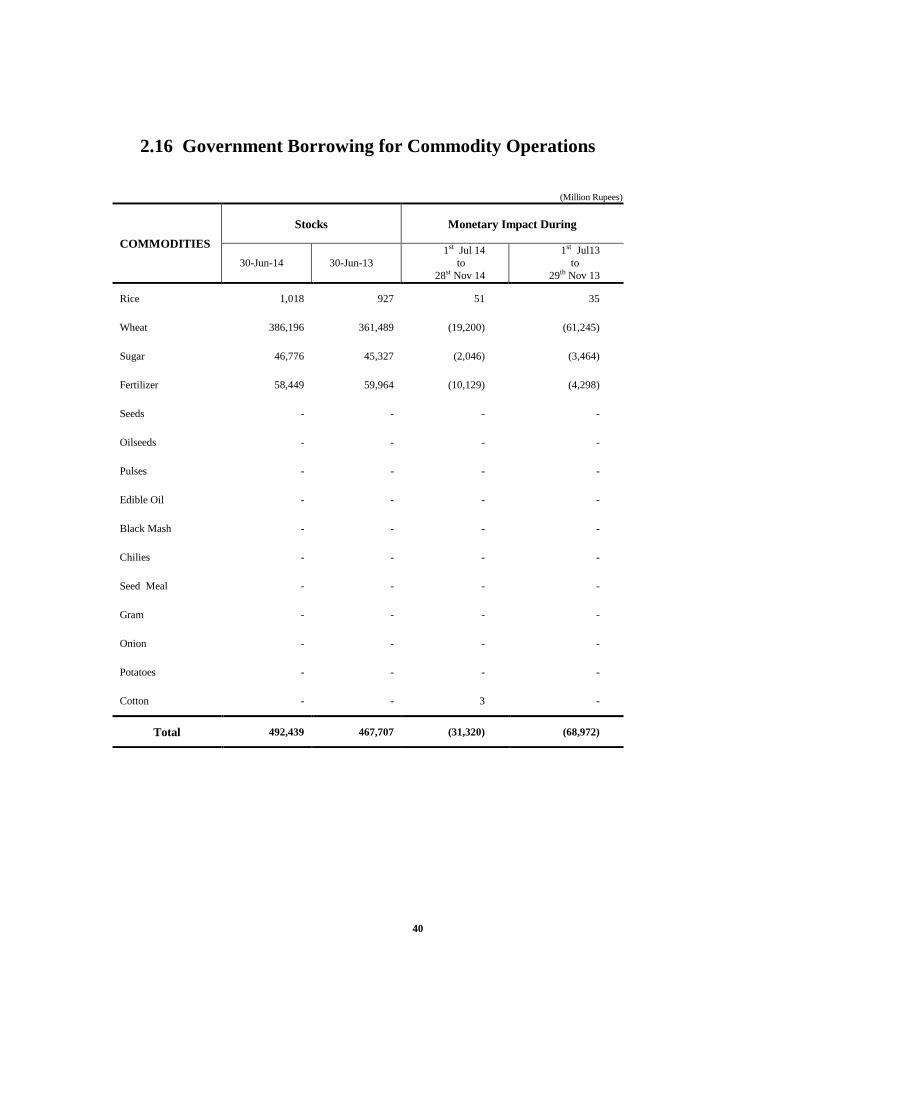
40
2.16 Government Borrowing for Commodity Operations
(Million Rupees)
COMMODITIES
Stocks Monetary Impact During
30-Jun-14 30-Jun-13
1st Jul 14
to
28st Nov 14
1st Jul13
to
29th Nov 13
Rice 1,018 927 51 35
Wheat 386,196 361,489 (19,200) (61,245)
Sugar 46,776 45,327 (2,046) (3,464)
Fertilizer 58,449 59,964 (10,129) (4,298)
Seeds - - - -
Oilseeds - - - -
Pulses - - - -
Edible Oil - - - -
Black Mash - - - -
Chilies - - - -
Seed Meal - - - -
Gram - - - -
Onion - - - -
Potatoes - - - -
Cotton - - 3 -
Total 492,439 467,707 (31,320) (68,972)