2.1 1 INDUSTRIAL PROCESSES SECTOR CGE Hands-on Training Workshop on National Greenhouse Gas...
67
1 2.1 INDUSTRIAL PROCESSES SECTOR CGE Hands-on Training Workshop on National Greenhouse Gas Inventories for the African Region Pretoria, South Africa 18-22 September 2006 PHILIP ACQUAH Director Environmental Protection Agency (EPA). Ghana
-
Upload
adolfo-nead -
Category
Documents
-
view
220 -
download
2
Transcript of 2.1 1 INDUSTRIAL PROCESSES SECTOR CGE Hands-on Training Workshop on National Greenhouse Gas...
1 2.1
INDUSTRIAL PROCESSES SECTOR
CGE Hands-on Training Workshop on National Greenhouse Gas Inventories
for the African Region
Pretoria, South Africa 18-22 September 2006
PHILIP ACQUAHDirector
Environmental Protection Agency (EPA). Ghana
2 2.2
SECTION A Re96gl Approach and Steps
Definition of IP Sector Activities Differentiation Non-energy and Energy-related
Emissions IPCC Source and Sub-source Categories or
Disaggregation Estimation Methods
Choice of Methods Choice of Activity Data Choice of Default Emission Factors
Tools facilitating Choice of EF and Reporting IPCC Emission Factor Database (EFDB) Tools facilitating Reporting

3 2.3
SECTION BGPG 2000 APPROACH AND STEPS
Good Practice Principles Choice of Methods-Tier structure and
selection criteria GPG 2000 Potential key Sources and
Decision Trees

4 2.4
SECTION C Review of Problems Encountered using Re96GL, GPG2000 Options and/or Suggested Approaches
Difficulty in disaggregation of Country relevant Sources
Activity Data (AD) Collection and CBI Emissions Estimation methods and Reporting Inappropriateness of Stoichiometric ratios as
EFs Lack of Emission Factors (2) Lack of AD and EFs
5 2.5
SECTION C Review of Problems Encountered using Re96GL, and Recommendations
n Other Specific Issues and n Use of Notation Keys in Reporting
Tables 1& 2n Activity Data (AD) Collection and
Reportingn Institutional Arrangementsn Recommended capacity building

6 2.6
SECTION D
Re96GL source-category specific problems of AD and EF
GPG 2000 OPTIONS
7 2.7
SECTION E
Inventory Quality Improvement and Uncertainty Reduction
GPG APPROACH- QA/QC
8 2.8
SECTION A
REVISED 1996 IPCC GUIDELINES (Re96GL)
INDUSTRIAL PROCESS SECTOR
Approach and Steps
9 2.9
Re96GL Approach and Steps Definition of IP Sector Activities
Non-energy related physical and chemical processes in production activities leading to transformation of raw materials and emissions of GHG (e.g. decomposition reactions)

10 2.10
Re96GL Approach and Steps Definition of IP Sector Activities
non-energy uses (NEU) of feedstock in process reactions or stage processes that do not only release heat but also act predominantly as reducing agent (e.g. metallurgical coke in the smelting of ores in metal production)
11 2.11
Re96GL Approach and Steps Definition of IP Sector Activities
Feedstock delivered to petrochemical plants and used for manufacture of other products and not for energy purposes (e.g. use of natural gas or other fossils in the manufacture of ammonia)
12 2.12
Re96GL Approach and Steps Definition of IP Sector Activities
Production-related emissions NOT classified under IP but under energy sector are GHGs released from fuel combustion of feedstock in production activities as sources of energy/ form of energy ( i.e. heat, process steam or electricity generation).

13 2.13
Re96GL Approach and Steps Differentiation Non-energy and
Energy-related Emissions in Re96GL Vol.3 Cement production Section 2.3.1 Lime production , 2.4.1 Soda ash production and Use 2.6.1 Ammonia production 2.8.1 and 2.8.2 Silicon carbide 2.11.1 Calcium Carbide 2.11.2 Iron and Steel 2.13.3.2 Ferro alloys 2.13.5.1 Aluminum 2.13.5.1

14 2.14
Illustration of non-energy and energy related emissions from Re96GL Vol. 3
(Reference Manual)
Differentiation of Non-Energy and Energy Related Emissions in IP sector

15 2.15
Re96GL Approach and Steps IPCC Source and Sub-source Categories or Disaggregation
Tools for classification: The IPCC inventory software
(electronic version of IPCC worksheet)
Emission Factor data Base ‘EFDB
16 2.16
Illustration with EFDB and Software
Re96GL Sources and Subsource Categories/Disaggregation
17 2.17
GHGs from IP sector(a) CO2, CH4, N2O,(b) HFCs, PFCs, SF6,(c) SO2,CO, Nox, NMVOCs
Relevant Source Categories (ref. Software long summary

18 2.18
Re96GL Approach and StepsGeneral Estimation Methodology
General EquationTOTALij = AD j x EF ij
where: TOTAL ij = process emission (tonne) of
gas i from industrial sector j AD j = amount of activity or production of
process material (Activity Data) in industrial sector j (tonne/yr)
EF ij = emission factor (EF) associated with gas i per unit of activity in industrial sector j (tonne/tonne)
19 2.19
Re96GL Approach and Steps
Choice of Methods
For certain industrial processes, more than one estimation methodology is presented. These are: Simplified approach
referred to as Tier 1 More detailed methodology
referred to as Tier 2.
20 2.20
Re96GL Approach and Steps
Choice of Methods
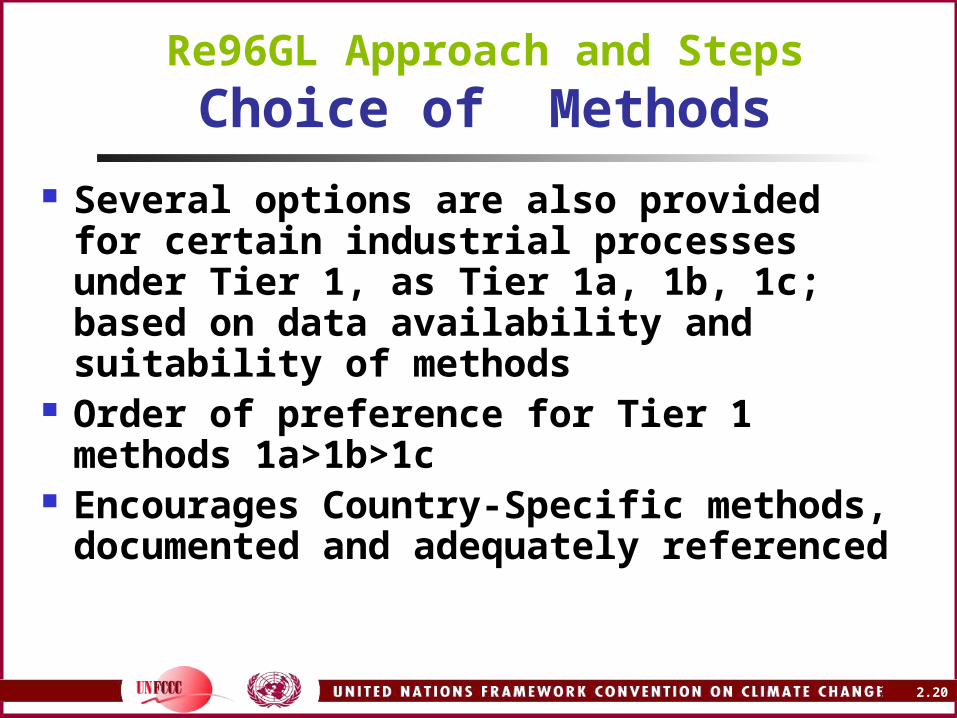
Several options are also provided for certain industrial processes under Tier 1, as Tier 1a, 1b, 1c; based on data availability and suitability of methods
Order of preference for Tier 1 methods 1a>1b>1c
Encourages Country-Specific methods, documented and adequately referenced
21 2.21
Re96GL Approach and StepsSample Tiers by Sub-source Categories
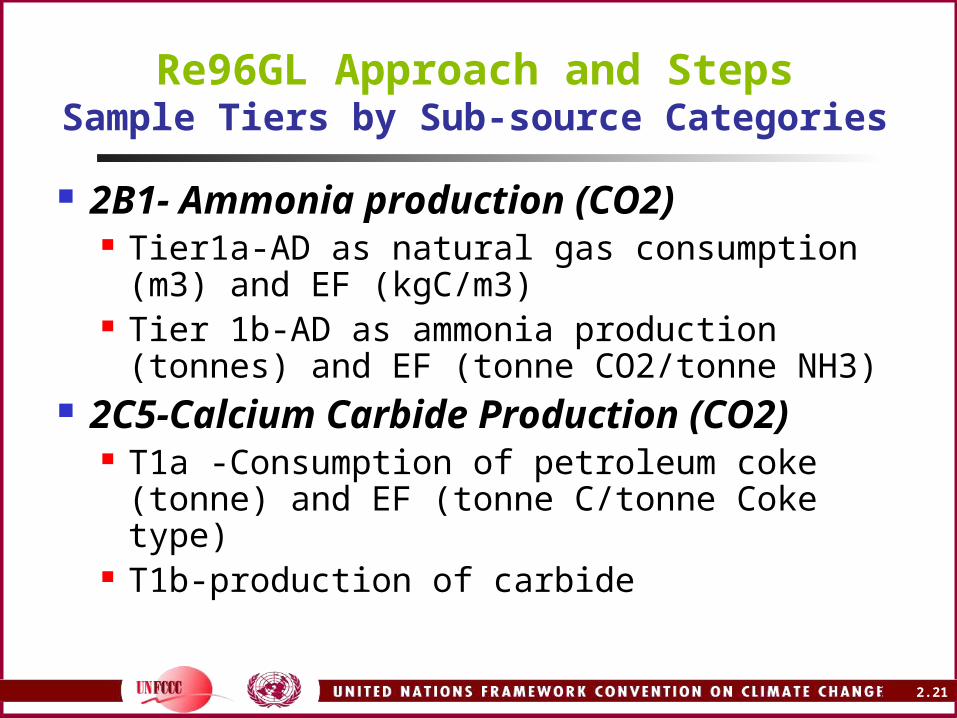
2B1- Ammonia production (CO2) Tier1a-AD as natural gas consumption (m3)
and EF (kgC/m3) Tier 1b-AD as ammonia production (tonnes)
and EF (tonne CO2/tonne NH3) 2C5-Calcium Carbide Production (CO2)
T1a -Consumption of petroleum coke (tonne) and EF (tonne C/tonne Coke type)
T1b-production of carbide

22 2.22
Re96GL Approach and StepsTiers by Sub-source Categories
2C-Metal production (Iron and Steel, Al, Ferro-alloys) Tier 1a-consumption of reducing agent
(tonne) and EF (tonne C/tonne reducing agent)
Tier 1b-production of the metal (tonnes) and EF (tonne CO2/tonne metal)
23 2.23
Re96GL Approach and Steps Tiers by Sub-source Categories
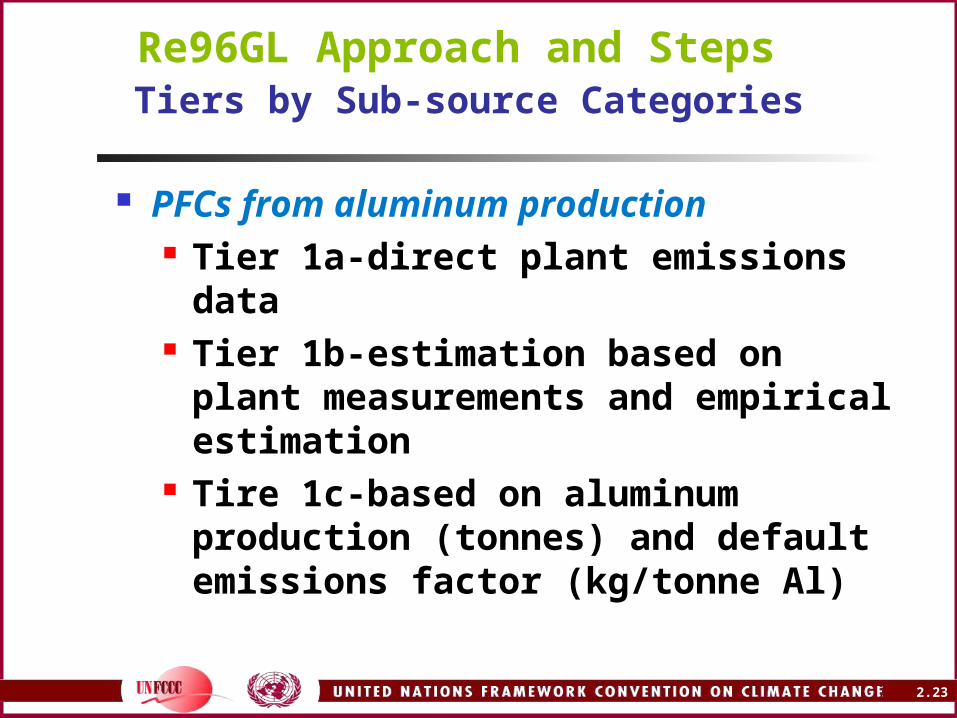
PFCs from aluminum production Tier 1a-direct plant emissions data Tier 1b-estimation based on plant
measurements and empirical estimation
Tire 1c-based on aluminum production (tonnes) and default emissions factor (kg/tonne Al)
24 2.24
Re96GL Approach and Steps
Tiers by Sub-source Categories
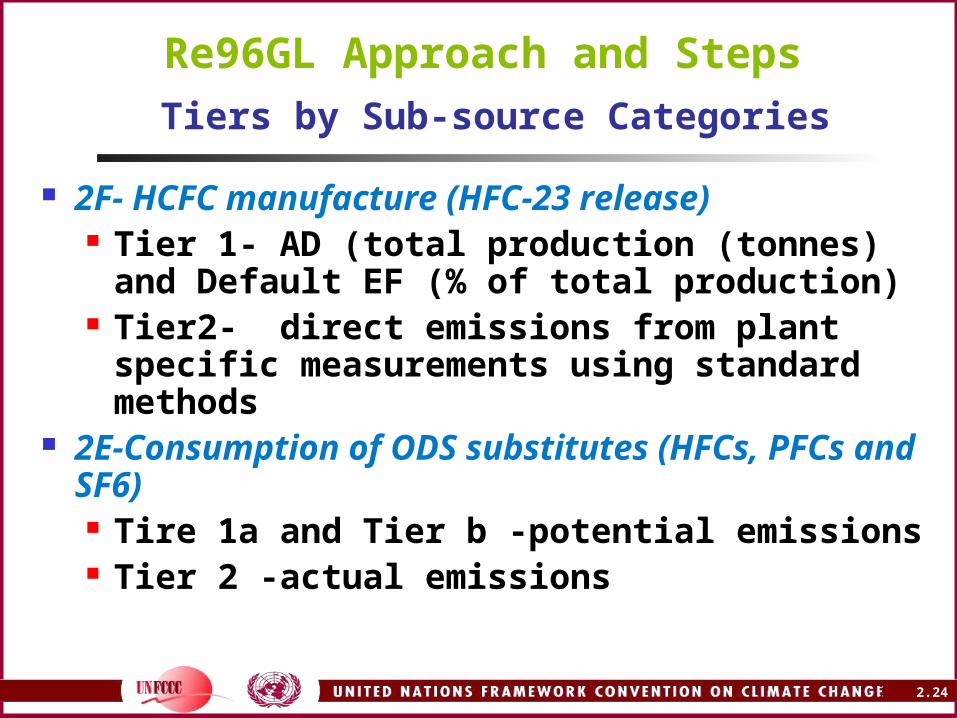
2F- HCFC manufacture (HFC-23 release) Tier 1- AD (total production (tonnes) and
Default EF (% of total production) Tier2- direct emissions from plant specific
measurements using standard methods 2E-Consumption of ODS substitutes (HFCs,
PFCs and SF6) Tire 1a and Tier b -potential emissions Tier 2 -actual emissions
25 2.25
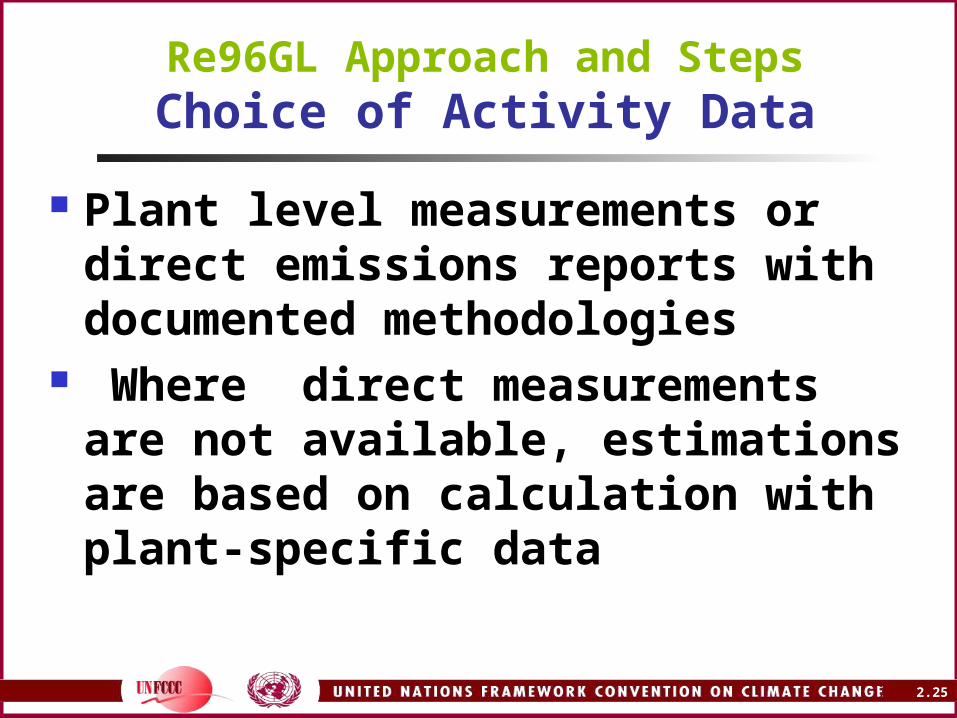
Re96GL Approach and StepsChoice of Activity Data
Plant level measurements or direct emissions reports with documented methodologies
Where direct measurements are not available, estimations are based on calculation with plant-specific data
26 2.26
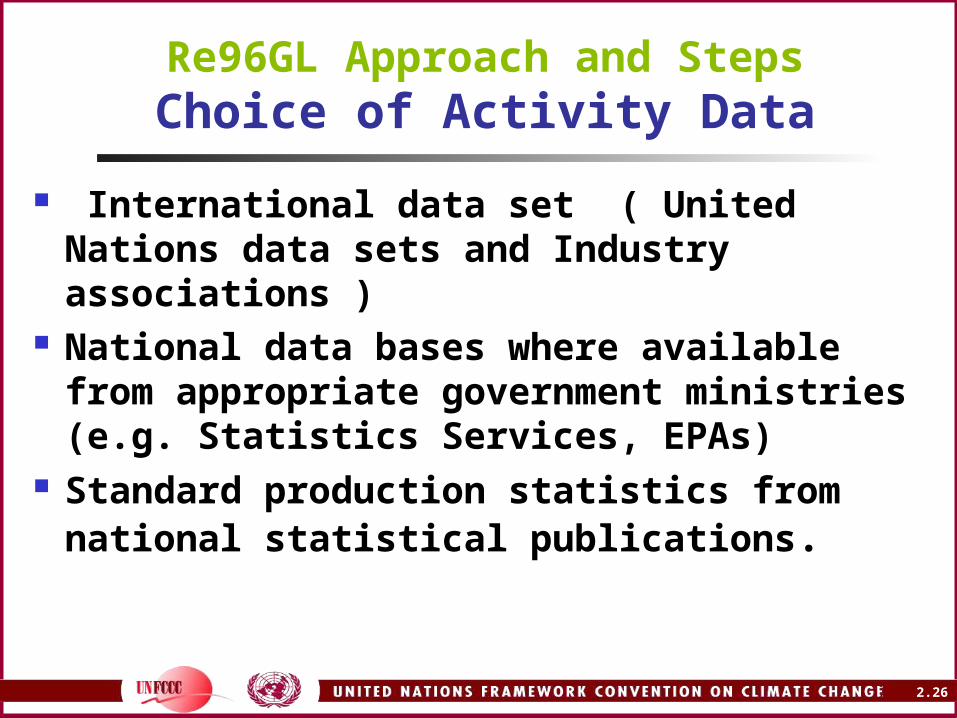
Re96GL Approach and StepsChoice of Activity Data
International data set ( United Nations data sets and Industry associations )
National data bases where available from appropriate government ministries (e.g. Statistics Services, EPAs)
Standard production statistics from national statistical publications.

27 2.27
Re96GL Approach and StepsChoice of Default Emission Factors
Process reaction-based EFs (Stoichiometric Ratios)
Production-based emission factors Technology-specific emission
Factors Reported Country/Region-specific plant-level
measurements IPCC Emission Factors Data Base (EFDB), a
summary for process reaction-based and technology-based EFs
28 2.28
ILLUSTRATE USE OF EMISSION FACTOR DATABASE (EFDB)
FOR IP SECTOR
Re96GL Approach and Steps

29 2.29
Comparability of IPCC Technology-based Default EF
and good practice Plant-level EF
The case of Aluminum production inventory in Ghana
30 2.30
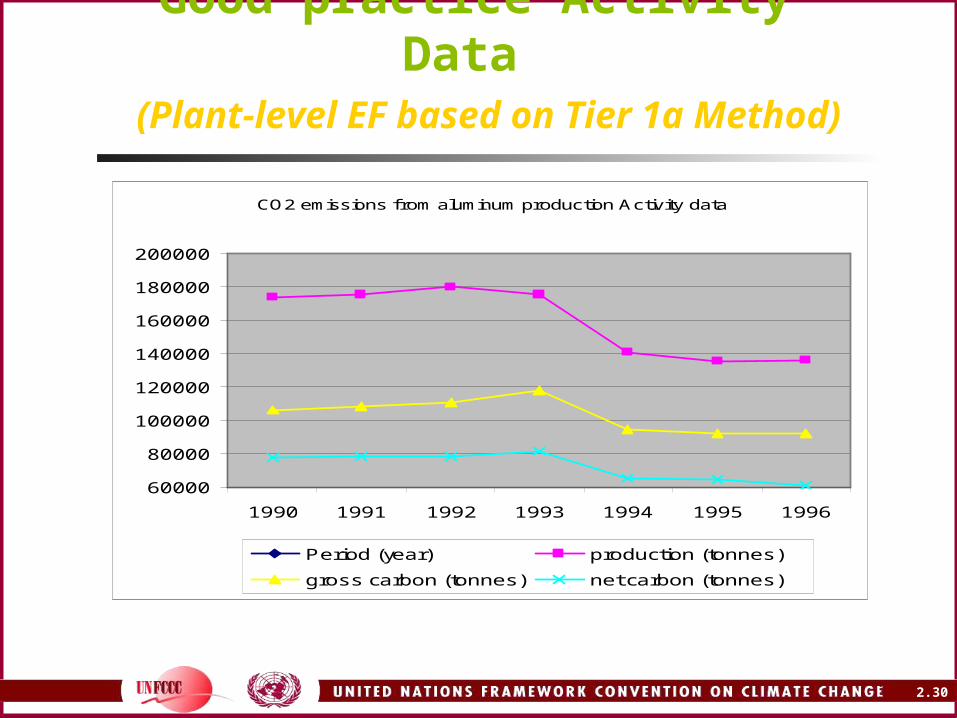
Good practice Activity Data (Plant-level EF based on Tier 1a Method)
CO2 emissions from aluminum production Activity data
60000
80000
100000
120000
140000
160000
180000
200000
1990 1991 1992 1993 1994 1995 1996
Period (year) production (tonnes)
gross carbon (tonnes) net carbon (tonnes)
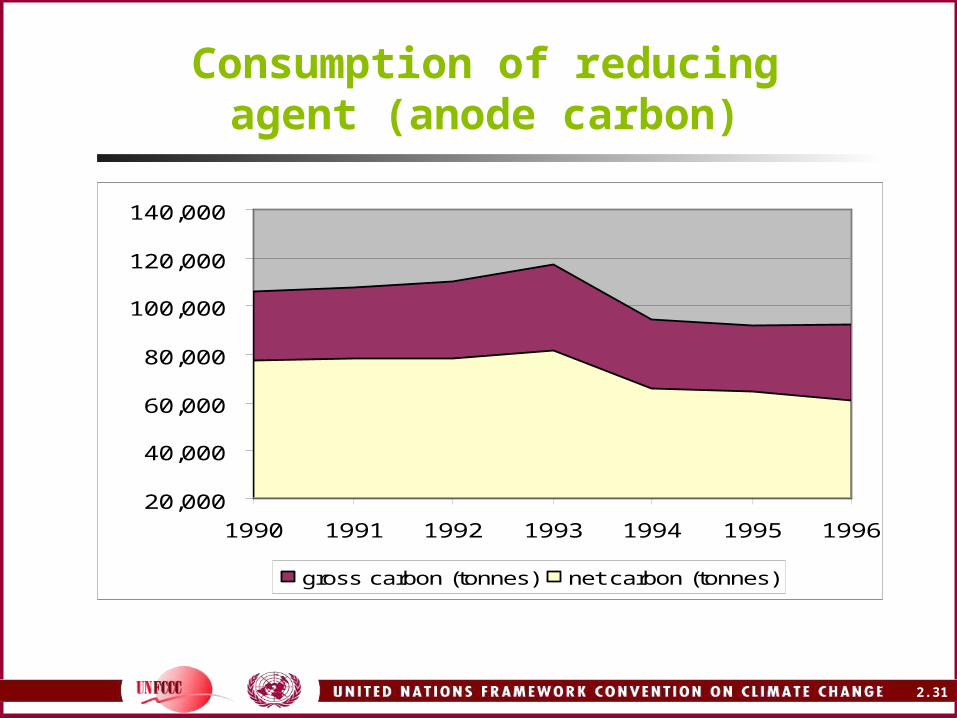
31 2.31
Consumption of reducing agent (anode carbon)
20,000
40,000
60,000
80,000
100,000
120,000
140,000
1990 1991 1992 1993 1994 1995 1996
gross carbon (tonnes) net carbon (tonnes)

32 2.32
Net carbon consumption
0.050
0.100
0.150
0.200
0.250
0.300
0.350
0.400
0.450
0.500
1990 1991 1992 1993 1994 1995 1996
production (megatonnes)
net carbon tonne/tonne al
3 per. Mov. Avg. (net carbon tonne/tonne al)

33 2.33
Comparability of good practice plant level and IPCC Default
Process Parameter
Country Specific (Plant level Tier 2) 7-year average
IPCC Default including baking emissions (5%)
Net Carbon consumption assuming 98% purity of anode carbon tonne C/tonne
0.445
Emission factor (tonne CO2/tonne Al.)
1.63
1.58
% Difference +3.5%
34 2.34
Emissions Estimation and Reporting
Use of IPCC Electronic Inventory Software
Re96GL Approach and Steps

35 2.35
REPORTING TABLES
Long Summary and Short summary
(Reference : IPCC Inventory Software)
36 2.36
SECTION BSECTION B
IP SECTOR INVENTORIES
GPG 2000 APPROACH AND STEPS
37 2.37
GGPG 2000 Approach and StepsGood Practice Principles
To produce inventories, which neither over/under estimate emissions so far as can be judged based on the principle of TCCCA, namely:Transparency; Consistency over
time; Completeness, Comparability, Accuracy

38 2.38
GPG 2000 Approach and StepsGood Practice Principles
To use limited resources more efficiently for key sources
To reduce level of Uncertainties To improve reporting and documentation To apply quality assurance and quality
control (QA/QC) and improve transparency
39 2.39
GGPG 2000 Approach and StepsChoice of Methods
Identifies potential IP sector key source categories
Provides Decision Tree analysis for the selected sources
Describes source category-specific good practice methods in adapting Re96GL to country-specific circumstances

40 2.40
GGPG 2000 Approach and StepsChoice of Methods
Defines Tier numbers for alternative names of methods described in Re96GL but are not numbered
Provides good practice guidance for various Tier levels of assessment (Tier 1, 2, 3) for selected source categories

41 2.41
GPG 2000 Approach and StepsGPG 2000 Potential key Sources Identified
2A1-CO2 Emissions from Cement Production 2A2-CO2 Emissions from Lime Production 2C1-CO2 Emissions from the Iron and Steel
Industry 2B3 & 2B4 N2O Emissions from Adipic Acid and
Nitric Acid Production 2C3-PFCs Emissions from Aluminum Production 2C4-Sulfur hexafluoride (SF6) emissions from
Magnesium Production 2E1-HFC-23 Emissions from HCFC-22
Manufacture

42 2.42
GPG 2000 Approach and StepsGPG 2000 Potential key Sources Identified
2F(1-5)- Emissions from Substitutes for Ozone Depleting Substances (ODS substitutes) from HFCs and PFCs used in refrigeration, air-conditioning, foam blowing, fire extinguishers, aerosols, solvents )
2F7-SF6 Emissions from Electrical Equipment 2F8-SF6 Emissions from Other Sources of SF6 2E3-SF6 Emissions from Production of SF6 2F6-PFC, HFC, and SF6 Emissions from
Semiconductor Manufacturing.

43 2.43
GPG 2000 Approach and Steps
Decision Trees, and Selection criteria for Methods and Structured
Tier levels

44 2.44
GPG 2000 Approach and Steps Decision Trees, and selection criteria for methods and Tier levels
2A1-Cement production CO2 Figure 3.1 pg 3.11
2C1- Iron and Steel Production (CO2) Figure 3.2 pg 3.21
2B1 &2B2 Nitric Acid and Adipic Acid (NO2)
2C1-Aluminum production (PFC)
Figure 3.4 pg 3.32
Figure 3.5 pg 3.40
2C-Use of SF6 in magnesium production (SF6)
Figure 3.6 pg 3.49
2E &2F- ODS Substitutes Figure 3.11 pg 3.80
45 2.45
GPG 2000 Approach and Steps
SAMPLE ILLUSTRATIONS OF TIER LEVEL METHODS IN ADAPTING RE96GL BASED ON
NATIONAL CIRCUMSTANCES
Reference Annex 3 Table 3 IP Handbook
46 2.46
SECTION C
REVIEW OF PROBLEMS ENCOUNTERED IN USING
Re96GL and GPG 2000 OPTIONS

47 2.47
Potential problems in preparing IP Sector Inventory
Difficulty in disaggregation of Country relevant Sources into IPCC categories particularly sub-source categories not listed in Re96GL.

48 2.48
mapping national industry classification with IPCC Source
categories
49 2.49
Potential problems in preparing IP Sector Inventory
Activity Data (AD) Collection and CBI
Direct reporting of emissions without AD and/or EF to national institutions responsible for data collection because of Confidential Business Information (CBI),
50 2.50
Potential problems in preparing IP Sector Inventory
Emissions Estimation methods and Reporting
The reporting of industrial process emissions from non-energy use (NEU) of feedstock produced in combination with fuel combustion under Energy Sector due to the difficulty in differentiation and possible double counting of CO2.
51 2.51
Potential problems in preparing IP Sector Inventory
Emissions Estimation methods and Reporting
Direct plant level measurement and reporting of industrial process emissions of CO2 from chemical processes or stage processes in combination with fuel combustion emissions from energy uses of feedstock (e.g. CO2 emissions from CaCO3 decomposition and metallurgical coke oxidation in Solvay process).

52 2.52
Potential problems in preparing IP Sector Inventory
Inappropriateness of Stoichiometric ratios as EFs
Where technology-specific or plant-level data are not available, EF(D) are based on stoichiometric ratios of process reactions..

53 2.53
Potential problems in preparing IP Sector Inventory
Lack of Emission Factors (2)
lack of development of plant-level EFs, which leads to the estimation of EFs based on top -down ratios calculated as EF= Emissions / Aggregate AD).

54 2.54
Re96GL source-category specific Problems GPG 2000 Tier1 good practice Options
Sample Source Category Estimations 2.A.1Cement Production 2.A.2 Lime Production 2.A.1 Limestone and Dolomite Use 2.C.1 Iron and Steel
Reference Table 2 IP Handbook

55 2.55
Other specific problems encountered in the use of
Re96GL
SUGGESTED APPROACHES/OPTIONS

56 2.56
Potential problems in preparing IP Sector Inventory -
Use of Notation Keys in Reporting Tables 1& 2
Inappropriate use and/or limited use of notation keys (“NO”, “NE”, “NA”, “IE”, “NE”) in UNFCCC reporting Table 1 and Table 2.
57 2.57
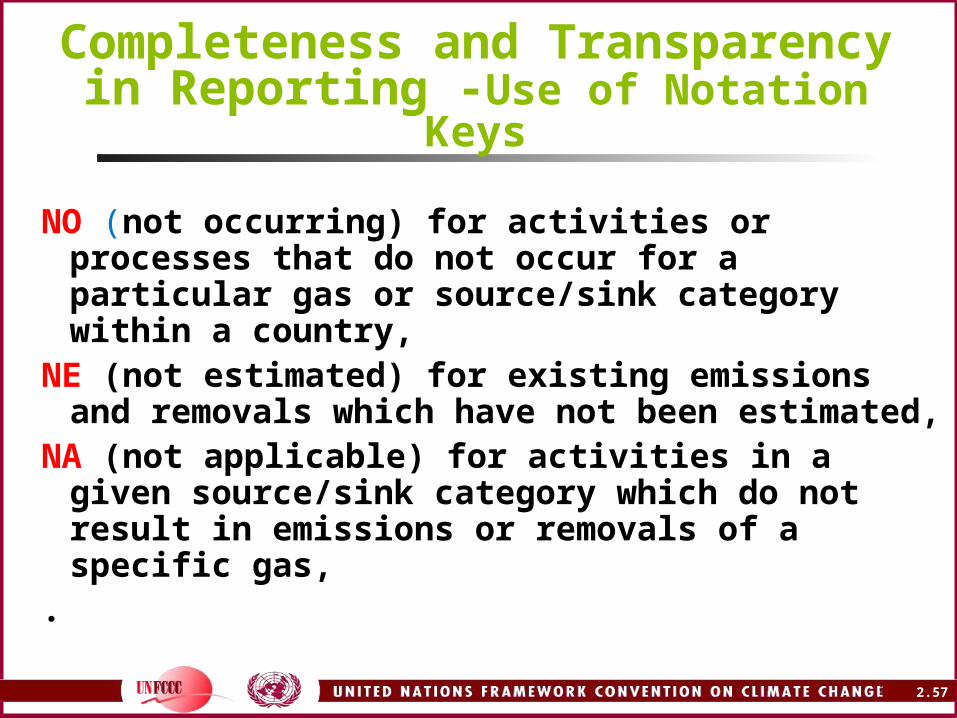
NO (not occurring) for activities or processes that do not occur for a particular gas or source/sink category within a country,
NE (not estimated) for existing emissions and removals which have not been estimated,
NA (not applicable) for activities in a given source/sink category which do not result in emissions or removals of a specific gas,
.
Completeness and Transparency in
Reporting -Use of Notation Keys
58 2.58
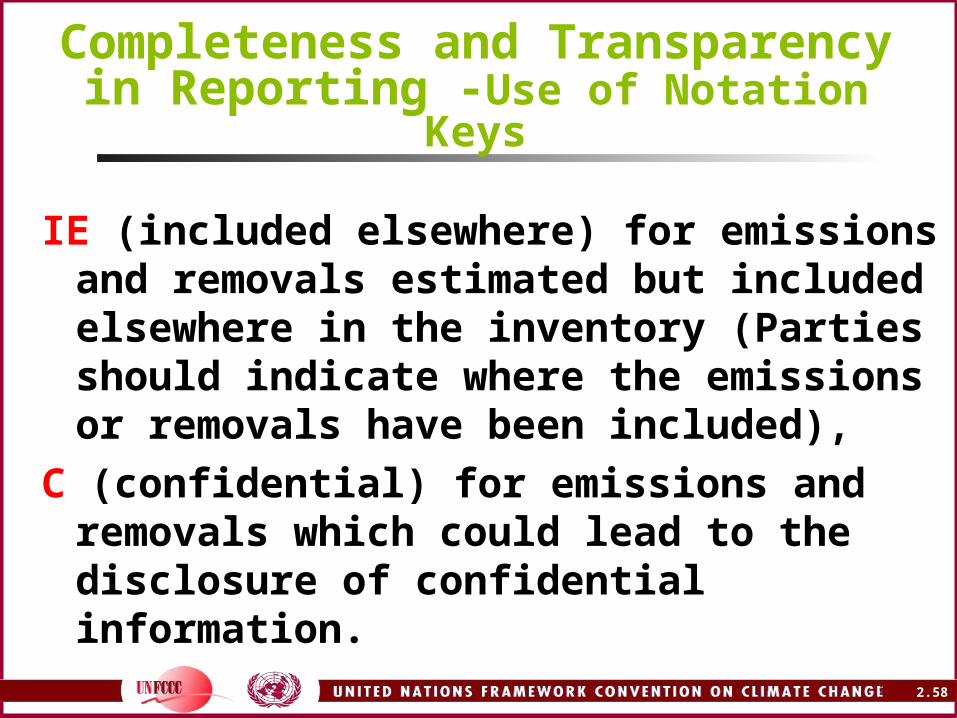
IE (included elsewhere) for emissions and removals estimated but included elsewhere in the inventory (Parties should indicate where the emissions or removals have been included),
C (confidential) for emissions and removals which could lead to the disclosure of confidential information.
Completeness and Transparency in
Reporting -Use of Notation Keys

59 2.59
Potential problems in preparing IP Sector Inventory
Activity Data (AD) Collection and Reporting
Production data on large point sources may be available in various national institutions in data sets that are not easily converted to GGI data
Where available, mandatory or voluntary plant-level data are reported as total emissions without relevant AD and EF
60 2.60
Potential problems in preparing IP Sector Inventory Lack of Emission Factors (1)
Mandatory industry reports (e.g. annual environmental reports) provide only emissions estimates without AD and/or EF.
Lack of IPCC D-EFs due to differences in IPCC source and sub-source categories and disaggregation of country-relevant sources,
61 2.61
Potential problems in preparing IP Sector Inventory
Institutional Arrangements
National institutions and industry association collect and present data in formats not appropriate for GHG estimation because they are normally aggregated in data sets relevant for the purposes for which they are collected.
Limited awareness among industry/industry associations of opportunities under the Convention and therefore not motivated to develop capacity for reporting GHG inventories.
62 2.62
Potential problems in preparing IP Sector Inventory
Institutional Arrangement
Lack of institutional arrangement and clarity over roles and responsibilities of experts carrying out the technical studies.
Lack of legal and institutional authority to demand data from industry to carry out the inventories- (reporting is basically voluntary)

63 2.63
Potential problems in preparing IP Sector Inventory
Institutional Arrangement
Non-involvement of universities and/or research centres on CC issues that can evolve a more sustainable inventory system.
Lack of mainstreaming CC data collection by national statistical services and industry associations in data collection.
Lack of QA/QC and uncertainty analysis by data collection institutions
64 2.64
Intuitional Arrangement ProblemsRecommended capacity building
Institute a national working group of relevant stakeholders for plant level verification and peer review of the inventory report
Organise a capacity building seminar for all institutions and relevant GHG contributing industries to disseminate the IP inventory data sets, the need of QA/QC and plant specific good practice for development and reporting AD and EFs in GGI data sets
65 2.65
Intuitional Arrangement ProblemsRecommended capacity building
Adapt Re96GL and GPG2000 and develop country specific workbooks documenting methods, Ads, EFs to increase transparency and preserve institutional memory
Disseminate the opportunities of emissions reduction under the Convention and the Financing Mechanisms under the Protocol in the capacity building workshop to motivate industry participation

66 2.66
Review and Assessment of Activity data and Emission Factors
Data status and Options
67 2.67
GPG 2000 Approach and Steps
Inventory Quality Improvement and Uncertainty Reduction
QA/QC APPROACH