
20th ICCRTS - Squarespace · PDF file20th ICCRTS “C2, Cyber, and Trust” ......
77
1 20th ICCRTS “C2, Cyber, and Trust” Title of Paper COMMAND AND CONTROL IN THE INFORMATION AGE (014) Topic(s) Topic 1: Concepts, Theory, and Policy Topic 2: Approaches and Organization Topic 5: Modeling and Simulation Name of Author(s) Marvin L. Simpson, Jr. -Optech Inc. Resit Unal, Ph.D. -Old Dominion University Paul W. Phister, Jr., Ph.D. - Retired Chuck Keating, Ph.D - Old Dominion University C. Ariel Pinto, Ph.D - Old Dominion University Point of Contact Marvin L. “Lenard” Simpson, Jr. [email protected] 757-243-7037 Address: 11212 Shelter Cove Smithfield Va. 23430
Transcript of 20th ICCRTS - Squarespace · PDF file20th ICCRTS “C2, Cyber, and Trust” ......

1
20th ICCRTS
“C2, Cyber, and Trust”
Title of Paper
COMMAND AND CONTROL IN THE INFORMATION AGE (014)
Topic(s)
Topic 1: Concepts, Theory, and Policy
Topic 2: Approaches and Organization
Topic 5: Modeling and Simulation
Name of Author(s)
Marvin L. Simpson, Jr. -Optech Inc.
Resit Unal, Ph.D. -Old Dominion University
Paul W. Phister, Jr., Ph.D. - Retired
Chuck Keating, Ph.D - Old Dominion University
C. Ariel Pinto, Ph.D - Old Dominion University
Point of Contact
Marvin L. “Lenard” Simpson, Jr.
757-243-7037
Address:
11212 Shelter Cove
Smithfield Va. 23430

2
Abstract (014)
As operations command structures change, it is important to be able to explore and understand their fundamental
nature; researchers should unearth the gestalt of the operational nodes. Thus, it is necessary to develop
understanding of effectiveness of the technical network and the people using the system as a whole.
The purpose of this paper is to report on the analysis of a Command and Control node, using a repeatable
deterministic method, and present the results. We posit that there is a recognizable (and discoverable) relationship
between the social (human) network and technical supporting network. By examining the system under a range of
circumstances, we gained an understanding of this relationship.
This research produces four significant contributions to C2 and Engineering Management disciplines. First, social
networking theory is combined with information theory into a single lens for evaluation. By using this concept, we
were able to conduct a quantitative evaluation creating a fundamentally new research method. Second, both
information theory and social networking concepts are used in a non-traditional setting. Third, this research could
start the process required to gain the knowledge to achieve a future C2 structure. Fourth, this research suggests
directions for future research to understand core C2 concepts.
Key Words: Air Operations Center (AOC); Operational Air Power, Information Flow, Social Networking,
ELICIT

3
COMMAND AND CONTROL IN THE INFORMATION AGE (014)
Table of Contents
TITLE OF PAPER .......................................................................................................................................... 1
ABSTRACT (014) .......................................................................................................................................... 2
TABLE OF CONTENTS ................................................................................................................................ 3
1.0 INTRODUCTION ..................................................................................................................................... 5
1.2 Basic AOC organization ............................................................................................................................ 5
1.3 Statement of the Problem .......................................................................................................................... 6
1.4 Nature of the Study.................................................................................................................................... 7
1.5 Introduction to ELICIT ............................................................................................................................. 7
1.6 Chapter Summary ...................................................................................................................................... 8
2.0 CURRENT C2 THOUGHT ...................................................................................................................... 8
3.0 DEFINING SYSTEM FRAGMENTATION ............................................................................................ 9
4.0 HUMAN LIMITATIONS ....................................................................................................................... 10
5.0 THE SYSTEM ........................................................................................................................................ 11
6.0 DATA FLOW MODEL .......................................................................................................................... 13
8.0 RESEARCH TECHNIQUE .................................................................................................................... 14
8.1 Conceptual Model ................................................................................................................................... 15
8.2 Physical Model Manipulation, Data Collection....................................................................................... 17
8.2.1 Configuration File ............................................................................................................................ 17
8.2.2 Factoid file ....................................................................................................................................... 17
8.3 Data Capture ............................................................................................................................................ 18
8.4 Data Analysis .......................................................................................................................................... 18
9.0 ORGANIZATIONS ................................................................................................................................ 19
9.1 Results from ELICIT (all data available upon request) ........................................................................... 19
9.2 Master Data Chart ................................................................................................................................... 19
10.0 MOVE TOWARDS SYSTEM OF SYSTEMS ENGINEERING (SOSE) ............................................ 20
11.0 CONCLUSION ..................................................................................................................................... 22
11.1 ELICIT .................................................................................................................................................. 24
11.2 Future Research Recommendations ...................................................................................................... 24
REFERENCES .............................................................................................................................................. 26
APPENDIX A - MODIFICATION OF MAYKISH ..................................................................................... 36
APPENDIX B - GENERIC AOC ORGANIZATION .................................................................................. 37
APPENDIX C - NOTIONAL COD .............................................................................................................. 38
APPENDIX D - EXAMPLE OF FRAGMENTATION ................................................................................ 39
APPENDIX E- INTERWOVEN SITUATIONAL AWARENESS .............................................................. 40
APPENDIX F - NETWORK DIAGRAM ..................................................................................................... 41
APPENDIX G - NETWORK MATRIX ....................................................................................................... 42
APPENDIX H - INFORMATION MATCHING MODEL ........................................................................... 43
APPENDIX I - MEASURES OF SOCIAL NETWORKING ....................................................................... 44
APPENDIX J - SOMMERHOFF FIVE VARIABLES ................................................................................. 46
APPENDIX K - ARCHITECTURE OF STOS ............................................................................................. 47
APPENDIX Q –CONFIGURATION FILES ................................................................................................ 49
APPENDIX R – INFORMATION MODEL ................................................................................................. 50
APPENDIX S- ELICIT CONFIGURATION FILE ...................................................................................... 52
APPENDIX T – C2 VARIABLES ................................................................................................................ 54
APPENDIX U – ELICIT MEASURES ........................................................................................................ 55

4
APPENDIX U1 - ELICIT RUNS .................................................................................................................. 58
APPENDIX V- ELICIT EDGE AND NOMINAL ORGANIZATIONS ...................................................... 59
APPENDIX W- ELICIT ANALYSIS TOOL OUTPUT EXAMPLE ........................................................... 63
APPENDIX X- MASTER DATA CHART .................................................................................................. 67
APPENDIX Y – LIMITATION/DELIMITATION OF THE STUDY ......................................................... 76
Figures
Figure 1 - Relationship between Purpose and Question .................................................................................. 7
Figure 2 - The AOC by Systems ................................................................................................................... 10
Figure 3 - Generic AOC Organization .......................................................................................................... 37
Figure 4 - Notional Combat Ops Division..................................................................................................... 38
Figure 5 - Modification of Sonnenwald & Pierce. Interwoven Situational Awareness ................................. 40
Figure 6 - An example of a network diagram (Modification of Hanneman & Riddle). ................................ 41
Figure 7 - An example of a network matrix (Modification of Hanneman & Riddle). ................................... 42
Figure 8 - Information Matching Model........................................................................................................ 43
Figure 9 - Modification of Sommerhoff's Five Variables, Summerhoff, G. (1950). ..................................... 46
Figure 10 - The architecture of STOs (Modification of Joslyn and Rocha). ................................................. 47
Figure 11 - ELICIT Configuration file Screen .............................................................................................. 49
Figure 12 - Modification of Kim, Soong, & Poong ....................................................................................... 51
Figure 13 - Edge organization structure ........................................................................................................ 59
Figure 14 - Visual depiction of Edge Organization Structure ....................................................................... 60
Figure 15 - Nominal Organization Structure ................................................................................................. 61
Figure 16 Visual depiction of Nominal Organization Structure .................................................................... 62
Figure 17 - Edge 1X System Fragmentation (number of correct ID's) .......................................................... 63
Figure 18 - Nominal 1X System Fragmentation (Number of correct IDs) .................................................... 63
Figure 19 - Edge 1X System Fragmentation (Quality of ID's) ...................................................................... 64
Figure 20- Nominal 1X System Fragmentation (Quality of IDs) .................................................................. 64
Figure 21 - ELICIT Analysis tool Color Definition ...................................................................................... 65
Figure 22 - Edge 1X System Fragmentation (Self Synchronization (cognitive)) .......................................... 65
Figure 23 - Nominal 1X System Fragmentation (Self-Synchronization (cognitive)) .................................... 66
Tables
Table 1- Modification of Maykish (2014) ..................................................................................................... 36
Table 2 - Definition of the transformed information ..................................................................................... 48
Table 3 - C2 Variables................................................................................................................................... 54
Table 4- ELICIT General Measurements ...................................................................................................... 55
Table 5 - ELICIT Social Measurements ........................................................................................................ 55
Table 6 - ELICIT Informational Measurements ............................................................................................ 56
Table 7 - ELICIT Shared Awareness Critical Measurements ....................................................................... 57
Table 8 - Nominal C2 and Edge C2 Runs ..................................................................................................... 58
Table 9 - Edge Organization Results ............................................................................................................. 60
Table 10 - Nominal Organization Results ..................................................................................................... 62
Table 11 - Master Data Chart (EDGE) .......................................................................................................... 71
Table 12 - Master Data Chart (Nominal)....................................................................................................... 75
5
COMMAND AND CONTROL IN THE INFORMATION AGE
1.0 INTRODUCTION
A precise answer to the wrong question can be more harmful than an eclectic answer to the right question. The
wrong question to ask about the Command and Control (C2) domain is how to best line up all the computer systems and
applications to achieve the reality promised in the marketing phrase, ‘the right information, at the time, and at the right
location in the right format.’ This phrase is misleading on three counts: the sales pitch defines a priori information as
equivalent to a posteriori information; this carnival worker’s call implies global data coupling in which all information has
the same pedigree (level of validity, level of security, level of availability, level reciprocity, etc.); and that data will be shared
ubiquitously. Information age warfare will be different from industrial age warfare:
The war, as any other human activity, is a product of its age, its weapons and strategies permanently evolved in the
same time with the technology development. The future war in the “information age” embeds the unique
characteristics of this period, thus being different than the other types of war previously conducted and affecting the
operation capabilities and the nature of the conflict environment. (OPERAN, 2012)
The difference may be as great or even greater than the difference between agrarian age warfare and industrial age
warfare. Air power and ground power have combined to achieve the operational objectives in the last five US wars.
Command and Control is the glue that holds it all together.
An actual air power C2 system exists only when engaging an adversary. The actual system is a combination of the
people and infrastructure in place accomplishing an actual military mission. An Air Operations Center (AOC) is a
Knowledge Management C2 entity in which humans either analyze or synthesize inflowing data. Data flows into the
organizations, which are an abstraction of the actual world, and requires processing in such a manner that output influences
the actual world. We posit there is a recognizable (and discoverable) relationship between the social network and technical
network operating in an AOC. By examining the system under change, that relationship can become understandable.
Changes in the technical network will result in changes in the social network, and changes in the social network will result in
a measurable difference in utilization of the technical network.
In the AOC, two separate networks exist with limited touch points. One set of connections is a technical network
that conveys data, and the other is a human command network that manipulates data, transforms it into information, and
produces decisions that result in output. To achieve an epistemic understanding of the totality of the node, both networks
require harmonization of understanding by determining how an action in one network affects the other network. If the AOC
node is understandable, then there is a high probability that the knowledge can extend to other organizations. A classic
scientific research approach implies qualitative research as the prerequisite needed to accomplish quantitative evaluation; this
paper is initial qualitative research. This case is designed to maximize knowledge acquisition during the time period, and
within the given resource constraints. Exploratory case studies have been used by others, such as the 1997 RAND Weapons
Mixed and Exploratory Analysis by Arthur Brookes, Steve Bankes, and Bart Bennett.
As Sutton (1986) points out, a common definition of C2 will most likely never congeal. Just because something does
not carry a universally recognized moniker does not mean it cannot be thought about or measured, or made better. Between
C2 theory and C2 operations stands C2 Systems. According to Maykish (2014), “C2 history shows that C2 theorists
navigated megatrend-type changes while gaining insight into C2 fundamentals at the same time.” His supposition results the
chart in Appendix A.
The unique contribution of this paper is to begin to sort through the Uncertainty that currently defines Maykish Stage 6.
1.2 Basic AOC organization
The AOC weapon system (WS) is the operational level warfighting command center for air, space, and cyberspace
forces. Like any military command node, the AOC can be represented as a task model because positional functions are well
understood. This organization allows creation of operation sequence diagrams for deeper analysis. The (AN/USQ-163)
6
Falconer AOC is the senior element of the Theater Air Control System (TACS) and provides centralized command, planning,
direction, control, and coordination of air, space and cyberspace operations. The five divisions of the AOC are made up of
numerous smaller teams: plan, control, assess air, space, and cyberspace operations. If other Services or nations provide air,
space, or cyber forces to a joint or coalition operation or campaign, the overall commander will normally designate a
Combined/Joint Force Air Component Commander (C/JFACC) to control such forces. The fundamental tenet of this system
is centralized planning and control through the AOC with decentralized execution by subordinate forces.
The primary function of the divisions of the AOC is to produce and execute an Air Tasking Order (ATO) and
associated documents like the Airspace Control Order (ACO). The Air Force has fielded five permanent Falconers worldwide
to meet continuing air power challenges. In any operation involving air power, a single commander is designated the
responsible member for all air power forces assigned and attached. In a theater-size military campaign, as many as 2,500
people inside the Combined/Joint AOC (C/JAOC) move massive amounts of information across multiple communication
networks at various security levels. The CAOC provides the Commander the capability to direct the activities of assigned,
supporting, or attached forces and monitor the actions of both enemy and friendly forces; the core processes remain the same.
Appendix B depicts a typical AOC, presented for reference only.
This project evaluates only the Combat Operations Division (COD). The COD, (Appendix C), executes the current
ATO (e.g., the 24 hours encompassing the effective period). It is divided into four teams: Offensive Operations, Defensive
Operations, Interface Control, and Senior Intelligence Duty Officer (SIDO). Time Sensitive Targeting (TST) and Combat
Search and Rescue (CSAR) are two key processes that require immediate attention on the COD floor. Various
specialty/support personnel are also embedded in the COD.
1.3 Statement of the Problem As previously stated, in any Command and Control (C2) node including an Air Operations Center (AOC), there are
two separate networks that have limited touch points. Nevertheless, in an information age, these networks must work together
to be efficient.
In most cases, people dealing with events occurring closer to “now” will synthesize more and analyze less. In effect,
the internal human system and the external system become one homogeneous mass. One of the difficulties swiftly
encountered in researching C2 is high variability in the quality of literature about the subject, as the writings express the
authors’ cogitative concepts about a wide range of subjects. Many writings are articulated with thoughts that are an ‘inch
deep and a mile wide’ in quantitative or qualitative facts, leading to the near impossibility of repeatability as validation.
Therefore, the purpose of this research is to conduct a comparison analysis of a representative Air Power Operational C2
node using a case study design to elicit fundamental understanding. The goal of the research is to face the future and
compare a representative C2 node to a differently constructed C2 node, and not to compare the results to an actual C2 node
using historical evidence.
Any electronically stored, transmitted, or recorded data is neither information nor knowledge. Humans must give
these mathematically defined and physically manipulated voltages context. At the same time, the language of data,
information, and knowledge can convey an appropriate extraction of reality. Therefore any military Corp or above
organization, such as an AOC, is a knowledge management entity. The AOC is not the only command node in the human
control that relies on an artificial representation of reality to make decisions and provide life changing outputs. The
operations center of a Nuclear Power Plant (NPP) has similarities with the Combat Operation divisions of an AOC.
The nature of war historically adapts to the technology available. Metaphorically, ancient military operations were
more like solid mechanics, whereas fluid mechanics could well represent industrial age combat. The term that best applies to
knowledge age combat is ‘Cloud’ centric, in which a small world of knowledge drives the understanding of truth. A diagram
of the relationship between the purpose and the research questions would be as follows:

7
Figure 1 - Relationship between Purpose and Question
1.4 Nature of the Study
This case study is to see how the AOC C2 system changes when varying noise and system fragmentation using a
representative C2 model. The goal is to extract fundamental understanding of Air Power C2 operating in an information age
environment establishing a baseline and using a repeatable method. This new approach does offer new insights into the
detection and analysis required for the understanding many of complex C2 systems.
The AOC is not the only command node under human control that relies on an artificial representation of reality to
make decisions and provide life-changing outputs. The following proposed model based on Kim, Soong, and Poong’s 2003
(Appendix R) work will be used as a reference point.
Using cross-disciplinary tools of social networking and information flow to evaluate the AOC provides a proven
repeatable quantitative measure.
Air Power Command and Control (C2) have unique characteristics. Air Power actions execute extremely quickly,
and any coordination required to meet a new need (change in an ATO) has to happen well before the planned event occurs.
Subsequently, the larger the change implemented, in turn, requires more coordination. There are general rules for the time
required for planning an event, but they are coarse grain at best. There has been very little research using a repeatable
method design specifically to understand core operational Air Power C2 issues. Successful heuristics exist in the crucible of
combat, but it is best not to rely solely only on this method as the risk to mission accomplishment or loss of life can be
extreme. Therefore, a human validated C2 model will function as the research milieu.
1.5 Introduction to ELICIT
Researching whether a model should be created, or if an appropriate C2 model was available, took several months.
The Experimental Laboratory for Investigation Collaboration, Information-sharing and Trust (ELICIT) is a tool for modeling
the behaviors of individuals in various organizational networks. Sponsored by a project within the Office of the Assistant
Secretary of Defense (OASD) Networks and Information Integration (NII), ELICIT has an online multi-user software
platform for conducting experiments and demonstrations in information-sharing and trust. Developers have reworked and
refined ELICIT over a period of eight years. Direct development investment by the Command and Control Research Project
(CCRP) has been greater than $2 million. Researchers have provided significant additional resources (including human
participants) directly. An international group of researchers has vetted and refined ELICIT. The software agents were
developed and tuned based on data and experience with live participants. It is rare to have a research platform that supports
both human and agent participants. The ELICIT software platform allows researchers and instructors to precisely model
specific Command and Control (C2) processes, as well as edge organization processes and to fully instrument all interactions.
The original project objective was to enable a series of online experiments to compare the relative efficiency and
effectiveness of various organization types, traditional C2 vs. self-organizing, peer-based edge (E) organizational forms, in
performing tasks that require decision-making and collaboration. ELICIT supports configurable task scenarios. The original

8
baseline experiment task is to identify the ‘who, what, where, and when’ of an adversary attack based on information factoids
that become known to individuals in a team or group of teams. The independent variable for the baseline experiment is
whether a team is organized using traditional C2 vs. Edge organization principles. The software agent-based version of
ELICIT (abELICIT) uses software agents whose behavior is defined by over 50 variables, which can be configured to model
various social and cognitive behaviors, and operations and performance delays.
To date, both military and civilian institutions have run ELICIT with both human and software agent participants
internationally. The agent behavior was modeled upon and validated against the actual behavior of human participants in
ELICIT exercises. For this work, developers enhanced the existing tool to meet an emerging need. The original ELICIT tasks
are intelligence scenarios. The ELICIT model was extended to handle a more complex operational scenario. ELICIT is
modified to model the operational task of an Air Operations Center (AOC) issuing an Air Tasking Order (ATO) Change
Order. The assumption is that the modified agent-based tool maintained its validation as compared to a human-based tool.
Additional research could validate this assumption.
1.6 Chapter Summary
When discussions associated with C2 became cantankerous and non-productive, one of my past supervisors would
always ask, ‘What is a pound of C2 worth?’ Contingency theory states that there is no best way to organize; not all ways to
organize are equally effective. The theory states qualitative rules observed through research on how companies organize in
specific contexts, and how organizations with different structures perform in those contexts. For example, empirical research
found companies engaged in routine predictable work perform better if they are more centralized and tightly controlled,
whereas companies whose tasks have a higher level of uncertainty need to be decentralized and loosely controlled. In 1973,
Jay Galbraith introduced an information processing view of organizations. The model abstracts work as simply as the
quantity of information to be processed, and argues that the greater the uncertainty of the task, the greater the amount of
information must be processed to complete it. Galbraith defines uncertainty as “the difference between the amount of
information required to perform the task and the amount of information already possessed by the organization” (1973).
Researching C2 must be more about seeking a holistic synthesis of contemplation rather than a comprehensive
analysis of mankind’s follies and triumphs. By seeking to understand the potential benefit of cross correlating two major
themes of thought (Social Networking and Information Theory), one may place a framework on a single command node
within a single physical domain. The resulting investigating has allowed an extraction of truths.
2.0 Current C2 Thought In 1995 the Command and Control Research Program (CCRP), within the Office of the Secretary of Defense, was
created. During the 1970s, the Office of Naval Research and the Massachusetts Institute of Technology brought together
interested researchers to exchange ideas on C2 and the impact of information revolution on the process. The first few
conference meetings started out with only a few non-U.S. participants. Now more than 20 nations contribute.
Within the Office of the Assistant Secretary of Defense (NII), CCRP focuses upon improving both the state of the
art and the state of the practice of Command and Control (C2) which enhances DoD's understanding of the national security
implications of the Information Age. The CCRP pursues a broad program of research and analysis in Command and Control
(C2) theory, doctrine, applications, systems, the implications of emerging technology, and C2 experimentation. It also
develops new concepts for C2 in joint, combined, and coalition operations in the context of both traditional and non-
traditional missions (Military Operations Other Than War (MOOTW)).
Key C2 concepts pioneered by CCRP include:
Network Centric Warfare (NCW)/Network-Centric Operations (NCO)/ Network Enabled Capability (NEC)
Power to the Edge
Co-Evolution of Mission Capability Packages
Domains: Physical, Informational, Cognitive, Social
Effects Based Operations (EBO) and Effects Based Approach to Operations (EBAO)
Campaigns of Experimentation (concept-based)
C2 Approach Space

9
C2 Maturity Models
Model-Experiment-Model Paradigm
Agility: Robust, Resilient, Responsive, Innovative, Flexible, and Adaptive
C2 and Complexity
Focus and Convergence
One of the seminal authors on current command and control is Dr. Richard E. Hayes (Alberts, Hayes, 1995, 2001,
2002, 2006, Hayes et al., 1993, 2001, 2006)
3.0 Defining System Fragmentation
System Fragmentation is the “ugly baby” in the room that is C2; very few want to think intelligently about it.
System theory points to the fact that all systems, as they change over time, will move in the direction of fragmentation and
differentiation (Kast & Rosenzeig, 1985). When differentiation is one’s strategy for success, fragmentation will happen. In
natural systems, we see this process happening in bees or ants or in the evolution of an entire species. In man-designed
systems, the process is replicated; one need only observe the many different one-off, spinoffs, rip-offs and other-off’s of any
truly uniquely beneficial design, product, service or concept. System theory also tells us that all systems will experience a
counterbalancing imperative to seek integration and convergence to cover the common principles that underline their
functioning. (Katz & Kahn, 1978). System fragmentation/specialization can have benefits, like lower nodal cost, but at the
same time it brings a range of complicating problems. System fragmentation is the “ugly baby” in C2, not because it going to
happen, but because no one knows how best to management it in a knowledge age. Industrial Age systems were divided
along the specialty functions; the army got the tanks and the navy got the ships. Should that same philosophy be used in
knowledge intensive management organization? In the AOC, should each of the 5 divisions, or maybe even all of the
specialty teams, have their own systems, or be supported by multiple systems? If a single large system, it should be
remembered that in 1991 a single mistyped character in a single line of code knocked offline 12 million customers of AT&T.
The AOC systems are divided along two primary system fragmentation lines. The first fragmentation line is formed
by the Management Information Systems (MIS) that at their underpinning rely on commercial standards, and are often
defined as Commercial-of-the-Shelf (COTS). The other line of fragmentation is defined by C2 systems that are built on
government/Mil-Standards and are often defined as Government-of-the Shelf (GOTS). An example of an MIS system would
be e-mail and example of a Mil-STD system would be Link -16. Over time many AOC C2 systems have acquired at their
core COTS technology. An example would be Theater Battle Management Core System (TBMCS). TBMCS is used to build
the ATO (a mil standard message), but has an Oracle database to store the data and sends the ATO to other units using
Simple Mail Transfer Protocol (SMTP) (a COTS standard).
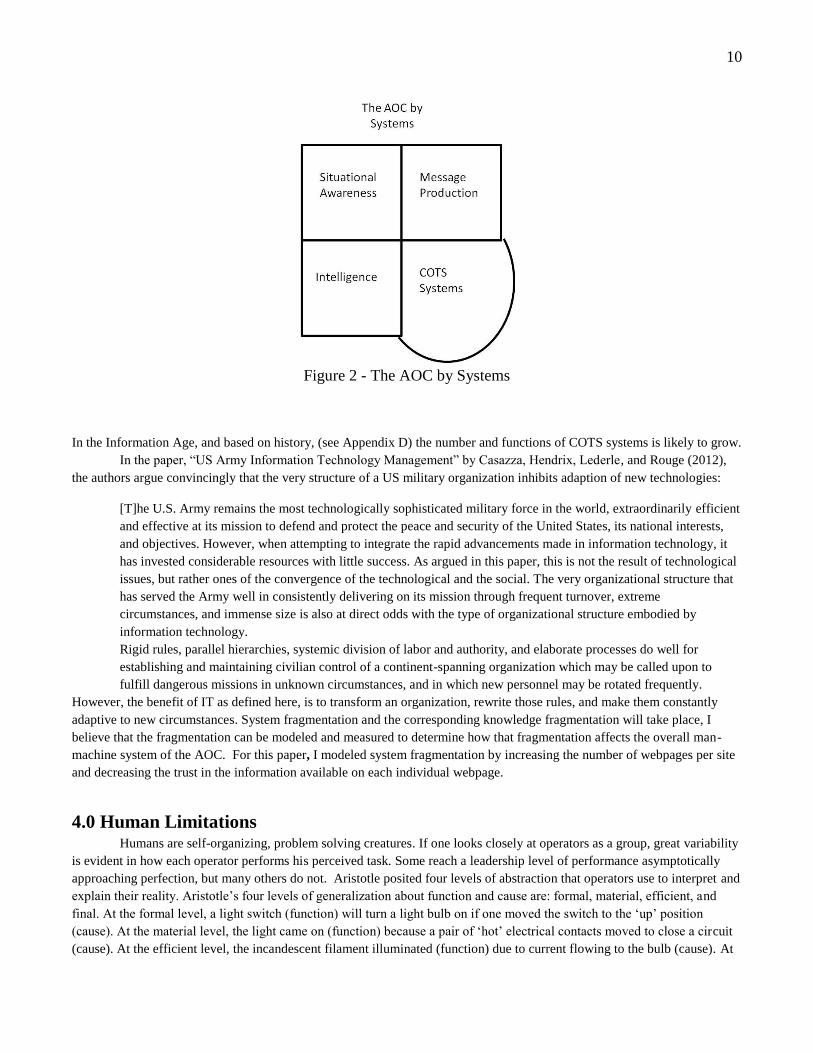
The AOC can be divided in many different ways to be observed, as can any complex system. One way to look at the
AOC is to quarter the AOC by systems. The upper left quarter would be systems that provide Situational Awareness (mostly
GOTS). The upper right would be systems that produce messages like the ATO and ACO (mostly GOTS). The lower left
would be systems that provide/produce Intelligence (again mostly GOTS). The lower right would be made up of the
explosion of COTS products from web-pages, to e-mail, to VTC, to digital phones, and the most newfangled toy.
10
Figure 2 - The AOC by Systems
In the Information Age, and based on history, (see Appendix D) the number and functions of COTS systems is likely to grow. In the paper, “US Army Information Technology Management” by Casazza, Hendrix, Lederle, and Rouge (2012),
the authors argue convincingly that the very structure of a US military organization inhibits adaption of new technologies:
[T]he U.S. Army remains the most technologically sophisticated military force in the world, extraordinarily efficient
and effective at its mission to defend and protect the peace and security of the United States, its national interests,
and objectives. However, when attempting to integrate the rapid advancements made in information technology, it
has invested considerable resources with little success. As argued in this paper, this is not the result of technological
issues, but rather ones of the convergence of the technological and the social. The very organizational structure that
has served the Army well in consistently delivering on its mission through frequent turnover, extreme
circumstances, and immense size is also at direct odds with the type of organizational structure embodied by
information technology.
Rigid rules, parallel hierarchies, systemic division of labor and authority, and elaborate processes do well for
establishing and maintaining civilian control of a continent-spanning organization which may be called upon to
fulfill dangerous missions in unknown circumstances, and in which new personnel may be rotated frequently.
However, the benefit of IT as defined here, is to transform an organization, rewrite those rules, and make them constantly
adaptive to new circumstances. System fragmentation and the corresponding knowledge fragmentation will take place, I
believe that the fragmentation can be modeled and measured to determine how that fragmentation affects the overall man-
machine system of the AOC. For this paper, I modeled system fragmentation by increasing the number of webpages per site
and decreasing the trust in the information available on each individual webpage.
4.0 Human Limitations Humans are self-organizing, problem solving creatures. If one looks closely at operators as a group, great variability
is evident in how each operator performs his perceived task. Some reach a leadership level of performance asymptotically
approaching perfection, but many others do not. Aristotle posited four levels of abstraction that operators use to interpret and
explain their reality. Aristotle’s four levels of generalization about function and cause are: formal, material, efficient, and
final. At the formal level, a light switch (function) will turn a light bulb on if one moved the switch to the ‘up’ position
(cause). At the material level, the light came on (function) because a pair of ‘hot’ electrical contacts moved to close a circuit
(cause). At the efficient level, the incandescent filament illuminated (function) due to current flowing to the bulb (cause). At
11
the final level, someone turned the light on (function) because it was getting dark (cause). Human short-term working
memory ranges from approximately 7 + or – 2 objects at any given time. The higher the abstraction an operator uses, the
lower the number of objects about which he must think. For example, it is easier to think about a car then it is to think about
the parts in a drive train, or all the parts in an engine, or what is happening in each cylinder on each stroke. Moving up the
abstraction level reduces workload and facilitates transmission of concepts to other individuals operating at a similar level.
Accurate higher-level abstractions form in formal training or through experience as one-to-one and many-to-one mappings
are made. One does not need to understand what is going on under the hood when a car makes a ‘funny’ sound. The driver
and the mechanic do not possess a one-to-one mapping of function to cause, and trying to communicate to the mechanic that
lower level detail soon becomes nearly impossible, meaning the mechanic and the non-knowledgeable driver never achieve
successful communication and each must ineffectually move forward. The mechanic’s job would be easier if the driver used
words like the ‘the mechanical lifters are knocking under a heavy load.’ The driver would not be so shocked at the bill if the
mechanic had not had to explore three or four possible problems before stumbling into the actual issue. Just because two
people share a common root language does not mean each participant achieves an exchange of ideas. Higher levels of
abstraction are homomorphs of lower levels. In other words, a high level generalization preserves the causal relationship, but
with loss of detail. For this research, I will extract information only to the highest level. Differing level of abstraction of
concepts point to why a strict quantitative analysis approach does not provide complete understanding on many C2 issues.
5.0 The System
The AOC is not the only command node in the human condition that relies on an artificial representation of reality
to make decisions and provide life-altering outputs. The operations center of a nuclear power plant (NPP) or any other
directing organizational node takes from reality a subset of facts and begins the decision making process based on them. The
challenge in the cognitive organizational design process is to recognize and anticipate ‘facts’ that are appropriate, and, if they
are captured, whether they create in the mind of the operator an accurate representation of reality.
There are two basic methods by which the AOC can inject control inputs in attempting to influence reality (Z). One
method is provision of error-control inputs or cause-control inputs. In terms of Operational Air Power, one could define
Error-Control inputs as the number of bombers available to send based on their circular probability of error (CEP). CEP has
decreased from that extent in World War I, and the number of bomb-laden aircraft sent to destroy any given target has
proportionally decreased. The other method is cause-control input. Higher biological organisms have evolved to use more
effectively information about the causes as the source and determiner of their actions. An Air Power example of cause-
control is if a warfighter is assigned airborne Close Air Support (X-CAS) and there is no movement at the primary target, the
warfighter can be rolled into a secondary target. Error-control is a less effective method of air power execution as the entropy
of the outcome Z cannot be reduced to zero: its best success can only be partial. Sommerhoff's macro model (Appendix J)
provides the conceptual underpinning that although our Operational C2 model does not achieve error-control, it does use
cause-control as a recognized throttling technique.
5.1 (Pluralism) Mental Model and Lattice Theories
What is known of the world outside the AOC is not what is depicted in displays on the wall in front of the operators,
but the shared mental model in the minds of the operators. This mental model is formed from basic beliefs and what
operators, as a group, perceive about reality. According to Mathieu et al., “mental models…help people to describe, explain,
and predict events in their environment” (2000). Ever since behavioral psychologist EC Tolman (1948) promulgated the
phrase "cognitive map", this concept has been studied and adapted in disciplines such as cognitive psychology, behavioral
geography, computer science, engineering, and neuropsychology. The term ‘mental map’ or model commonly represents the
internal knowledge base of living data processors. Organization theory describes team mental models in terms of shared
and/or tacit knowledge (Carley, 1997; Klimoski & Mohammed, 1994). Team members in any organization are more effective
when they have the information needed to accomplish their tasks effectively. Individuals who self-identify as members of a
team comprehend that they will only succeed if they are aware of the role and function they perform. While team members
do share some forms of mental model and some harmonizing of situational awareness, they are individuals, and it is unlikely

12
they are carbon copies of each other. Further, each team member has different tacit knowledge, domain expertise, and task
responsibilities, and therefore cannot share the same mental model and do not need identical situational awareness. This
interwoven situational awareness concept was developed and refined by Sonnenwald and Pierce (1998), (See Appendix E)
who suggest C2 teams perform better when members develop an interwoven pattern of awareness of the milieu in which they
operate, mixed with an awareness of what other team members see or ought to see. Sonnenwald developed this concept further. She suggested that interwoven situational awareness may be composed
of three distinct, but mutually reinforcing, types of ‘awareness.’ Environmental awareness involves recognition of the current
state of activity inside the task environment. The task environment in this level of awareness is different for different tasks.
For individuals with a narrow and specific task to perform, environmental awareness would be restricted to that particular
task. For individuals with broader tasks that require them to interact outside a particular setting, environmental awareness
includes both the physical environment and the combat environment in which the AOC is controlling forces. Domain or
content awareness involves the individual team member recognizing something of importance to a particular task or
conceptual area of responsibility. Interpersonal awareness involves an individual’s sensitivity to what teammates think or
feel, how emotions may affect performance on team tasks or processes, or preferred work and communications styles. Raw
data or raw information flowing into the AOC has to be interpreted and understood by at least one person and communicated
to add to overall group knowledge. Team collaborative work requires communication be completed between at least two
individuals. The United States Army has looked at the communication process within teams on at least one occasion. A 1980
research effort studied verbal transmission of information between different echelons in a command group and found the
percentage of information successfully transmitted and received seemed related to personality and position. The study
focused on impact of individual communications style on team performance, but did not fully explore team information
behavior itself (Kaplan, 1980).
In the conceptual work concerning the relationship between mental models, team performance, and situational
awareness, researchers began to realize that, although possession of accurate mental models is a prerequisite for effective
team performance and team situational awareness, it may not be sufficient. Specifically, researchers have argued that while
members must hold accurate mental models, it is the sharing of mutual mental models among members – or shared mental
models – that allows for effective coordinated and adaptive team behavior. Graham (2004) shows that this sharing is
particularly critical if military units are to be adaptive. This sharing may be especially difficult in multinational teams because
cultural differences place obstacles to information exchange that is required to develop these models. For example, a person
from a culture with strong power distance beliefs may not feel comfortable presenting a skill set to a supervisor. Others
(Moray, 1990) have suggested using lattice theory to provide formalism for the knowledge base used as a mental model by
operators. The ordering relation is interpreted as 'is caused by', so the lattice becomes a representation of the operator's causal
hypotheses about the system. One can think of a given system causally in different ways (purposes, mechanics, physical
form, etc.). Each alternative gives rise to a separate lattice. These lattices relate to each other and to an objective description
of the structure and function of the physical system by homomorphic mappings, which is an extension of Aristotle’s levels of
abstraction. Errors arise when nodes on the mental lattices are not connected in the same way as the physical system lattice:
when the latter changes so that the mental lattice no longer provides an accurate map, even as a homomorphism, or when
inverse one-to-many mapping gives rise to ambiguities.
There have been few studies on how organizational knowledge compares to reality. Lattice theory provides a
method to understand the group interaction. An objective lattice description of the real physical relations between the parts of
the system as in engineering specifications expresses the interactions among physical components in reality. This lattice I will
call the physical system lattice (PSL). Insofar as an operator's mental model is isomorphic to the PSL, just to that extent is it a
complete model of the physical system, and just to that extent will the mental model's predictions exactly match the output of
the different parts of the physical system when it is provided with system inputs and parameter values. In general, however,
the operator's knowledge will be imperfect for at least two reasons. First, if the system is large, it may simply be impossible
for the operator to scan and remember the displayed values of the system variables to acquire a perfect knowledge of the
system relations. Second, and more importantly, the abstraction hierarchy suggests that, for many purposes, mental models
will be homomorphs, not isomorphs, of the physical system.
The higher the level of the abstraction hierarchy at which a person thinks about the system, the fewer the elements to
think about. A Group may contain several Squadrons. A Squadron will contain several aircraft. An aircraft may contain

13
several bombs. Thus, it is advantageous for an operator to consider a system as high up the hierarchy as possible to reduce his
mental workload and the amount of data he must carry in his working memory. The higher levels of the abstraction hierarchy
are formed from the lower levels by many-to-one mappings that develop in formal training or informal experience. That is,
higher levels of abstraction are homomorphs of lower levels. They preserve the causal relations between subsystems with a
loss of detail. Suppose that different kinds of causes may give rise to different lattices. Each cause (formal, material, efficient,
or final [that is, purpose]) can provide a complete description of the system in its own terms. These descriptions are
complementary, not mutually exclusive These mental mappings and their effect on flow as described by Shannon, Conant,
Ashby, and Beer are poorly reconciled. These seminal authors use terms like “blockage,” and other qualitative terms to deal
with “abstraction”. Mental model and lattice theory provides understanding as to why the technical picture displayed on the
wall is not what an organization actually understands. It also defines why any human organization should not be assumed to
be populated by automatons and that it will always change and morph, minute to minute and shift to shift. Mental model and
lattice theory strip away a majority of the complexity in humans.
6.0 Data Flow Model
One of the difficulties swiftly encountered in researching C2 is high variability in the quality of literature about the
subject, as the writings may express an author’s cogitative concepts about a wide range of subjects. Many writings are
articulated with thoughts that are an ‘inch deep and a mile wide’ in quantitative or qualitative facts, which leads to near
impossibility of repeatability as validation. Much of Western literature about military C2 is inductive in nature and uses only
the principle of coherence, implying ‘truth’ based on metal ornaments, hard won, on the author’s garments. Like any military
command node, the AOC can be represented as a task model because positional functions are well understood and allow
creation of operation sequence diagrams for deeper analysis. An additional function to understand in the role of the AOC is
the underlying technical network. Understanding of the technical infrastructure requires examination from an information
theory (origination, information flows, IT use, and information-worker productivity) perspective. Studies of IT-productivity
demonstrate new technologies as well as adaptation to a different way of working that allow increased absorption of available
information with a significant effect on individual and overall unit production (Bharadwaj, Bharadwaj, & Konsynski, 1999;
Brynjolfsson & Hitt, 2000; Aral & Weill, 2007) by increasing asynchronous communication (Hinds & Kiesler, 2002).
Information can reduce uncertainty (Cyert & March, 1963) or temper risk aversion behavior (Arrow, 1962; Stiglitz, 2000).
When information is vague, it takes time to verify it by collection of additional data, thus reducing effective decisions
(Hansen, 2002). All these factors point to a measurable chain, in which the initial data can be collected and analyzed.
Information theory treats each human as an information channel, thus minimizing the factor of human variability. Applying
this theory allows one to understand the infrastructure that moves data quantitatively. Is the electric representation of data on
an accessible network? Is the format correct, can it be found, and, if found, retrieved? If retrieved, can it be understood? Does
the additional data improve the effectiveness of the knowledge worker, or can he even use it? How does an information
worker’s understanding compare to that of the decision maker? A goal of this paper is to accomplish information flow
analysis using quantitative data captured from a representative C2 node.
7.0 Social Network
To understand the AOC, it is critical to examine the underlying supporting structure. Social Network Analysis
(SNA) is an appropriate tool to evaluate the human networking side of C2. Social network theory looks at relationships in
terms of links and nodes. Nodes are the individuals and links are a relationship between the individuals. There are many
different ways people can be linked (face-to-face, e-mail, text chat, phone, meetings, etc.) and each interaction has an effect
on the whole. The core assumption is that the relationship is the most important function. Social networking proposes
individuals are less important than their relationships. Those relationships define a structure that can be studied, mapped,
monitored, measured, and evaluated graphically or statistically to improve organizational outputs (Barnes, 1954; Granovetter,
1973; Milgram, 1967). An SNA study can prompt such questions as: “How does the actual organization compare to the
organizational chart on the wall?”; “What paths are available for the information to flow?”; “Why does some information fall
on the floor?”; “Is critical information not available?”; “How does the organizational structure change over time?”; or “Are
increasing available paths resulting in C2 nodes taking on fewer closed-system characteristics?” SNA can provide both a

14
visual and quantitative structure for analysis of complex human systems like the AOC, because it can be organized in
mathematical terms and is grounded in the repeatable analysis of empirical data. These techniques have and can be used to
understand diffusion of information, organizational behavior, the spread of disease, and other phenomena.
“Social Networks” is a term coined by John Barnes in 1954. Social Network Analysis seeks to understand the
human interactions by looking at the people and their relationships within a specified social context. In Social Network
Analysis, the primary data collected are on the relationship between actors (sometimes called points, nodes, or agents) with
actor interactions collected as secondary data (often described as a link, edge, or tie) (Wasserman, 1994). The following
overview is adapted from Hanneman and Riddle (2005). Humans are depicted in the network diagram as a simple node, or
point in space. A line connecting the two points represents an edge, the relational connection of the two people. Ties can be
directional; if a person claims a relationship with the other person, an arrow connects the nodes pointing towards the flow of
information. If both claim a relationship, then the information flow is bi-directional and direction can be annotated on each
end of the edge.
The analysis involves an in-depth evaluation and comparison of edges at various levels: between two actors (also
called a dyad), or among and between groups or clusters of actors (also called cliques), and among all nodes included in the
selected network (See Appendix F). The configuration of the network can influence the outcomes and characteristics of
individual actors because their position in the network provides both opportunities and constraints based on their relationship
and interactions. Changes in the pattern of relationships change the structure of the network and in turn can change the
outcomes.
The data collected may also be used and displayed in a matrix algebra format since the information is sometimes more
understandable than it would be in a graphical form is the mathematical representation in Appendix G. Traditional statistical
measures of social networks are often constructed in an algebraic format for quantitative purposes.
Ties, edges, and links can also have values. Binary data (such as yes/no questions) are represented by the presence
or absence of a tie. Valued data (such as “on a scale of 1 to 7”) gives information on the strength of an edge. A social network
perspective is, inherently a multi-actor perspective. Social Network Analysis can offset the limitations of static organizational
block diagrams (Serrat, 2009). In most cases, the trend will be to have narrow numbers of strong ties and large numbers of
weak ties. This is most likely true because humans have limited amounts of time and energy, and strong relational ties require
continued nurturing. Social structures can also develop a stable framework with only a limited number of strong connections.
Social Networking defines the ability to create different organizational structures that can be compared and
contrasted. If the Social Network structure is static, it then defines the courses and paths that are available for human
information flow. (See Appendix J for traditional measures of Social networking)
8.0 Research Technique
According to Eisenhardt, case study research can be defined as “a research strategy which focuses on understanding
the dynamics present within single settings” (1989). The AOC defines a single setting. Therefore, the use of the case study
method is appropiate to use in researching fundamental airpower C2 issues. Yin (2003) notes case study methods may be
involved in three roles: exploratory/descriptive studies, evaluation studies, and/or hypothesis testing. Exploratory and
descriptive case studies (this paper is nominally binned into this category) look at the characteristics of some sort of
extraction of reality with the hope of developing elicitation of input/output or cause-to-effect affiliations. The evaluation case
study methodology proposes identifying potential explanations for a documented result that has already happened. The result
could be either positive or negative; in either case, the goal is to understand what caused it.
Exploratory case studies have been used by others, such as in the 1997 RAND Weapons Mixed and Exploratory
Analysis by Arthur Brooks, Steve Bankes and Bart Bennett. In the RAND introduction, they define an exploratory analysis
as a method to help comprehend complex systems such as combat models which may have imperfectly known parameters,
decisions, and measures of effectiness. In a model based exploratory case study, the model is run at many different input
levels. In our case the noise and system fragmentation are increased stepwise. Just as in the RAND study, in our exploratory
model, a relatively large set of scenarios and conditions are set and their outcomes are observed. Various communities are
undertaking case study using modeling. When conditions in any community preclude building the target system, modelers
must make assumptions about their systems’ details and interworkings. The resulting model is not a one-for-one

15
representation of the real world, but it can provide insight as to how the world would behave if the modelers’ assumptions are
correct. Computational experimentation case studies are commonplace (Strauss, 1974; Campbell et al., 1985; Rose &
Dobson, 1985; Anderson, 1988; Lipton, Marr & Welsh, 1989).
8.1 Conceptual Model
A conceptual lens of information flow in an AOC provides a sieve to extract from reality the data needed to
accomplish a valid analysis. Information theory work has been accomplished in conjunction with nuclear power plants using
Conant's model as a tool for describing human information processing (Kim, Soong, & Poong, 2003). Understanding paths
and flows of information should give some indication of where there is sharing or blockage of information. The interaction of
the human and technical networks should also suggest where and how knowledge leading to a decision comes about. The
sharing of information could be the result of some path of communication between nodes (individuals/organizations) or
through use of common screens of technically presented information. Only one of the five AOC divisions will be analyzed
due to required resource expenditure.
The Man-Machine Interface (MMI) is where Beer defines the point at which the message crosses a boundary where
it is “translated,” or undergoes transduction to continue to make sense. To meet tomorrow’s challenges requires knowledge,
not only of the physical capacity of individuals and the team, but also cognitive capabilities and tendencies. The
consequences of ignoring the cognitive function of the MMI are evident in failure. The ultimate objective is to model the
cognitive behavior of the operators of the AOC to improve macro system design. To accomplish this analysis, it is important
to develop a very detailed operator model in which operator incongruity can receive particular emphasis. An operator centric
model should suggest several aspects that will be important in designing to maximize human team abilities in accomplishing
complex tasks. Systems like the AOC, which involve loosely coupled IT decision support systems, need to be designed and
maintained to maximize supporting human cognitive skill.
Scholars have debated for years about the capacity of decision makers to make major changes in direction from prior
decisions at both individual and group level. One group of researchers stubbornly assumed the “rational human” actor.
Another argued substantial change is rare, as indicated by the conservative nature of decision-making. In this view, stasis
becomes the characteristic state of organizational and individual decision-making. In this static view, there are strong
disincentives to decisions that depart substantially from the status quo (Lindblom, 1959). In the real world of military
decision–making, disincentives render large departures from the norm rare and dangerous. Those who dispute this stable
argument model often point to examples of changes resulting from ‘basin of stability’ change when the ‘logical human’
argument had some sway. Many government policy areas seem to have experienced large changes; recent examples would
include the space program in the 1960s and military budgets after 9-11. This paper assumes incremental decision-making is
the appropriate model.
Evidence provided that a contextual model is better able to describe overall team dynamic behavior than a sequential
or workflow model. Workflow sequential models have difficulty describing continuous observations with revisions resulting
from unanticipated responses with an uncertain outcome. Most workflow models are unidirectional sequence processes with
stimulus input results in some response output. Conversely, contextual models can show flexibility and emphasize the
comparison between a set sequence of processes and a choice of processing as a function of overall context. L. Bainbridge
(1997) has described the details of the differences between the two models. The model in Appendix R shows a proposed
overview of the information processing model for warfighters in combat operations. In the proposed model, any operator is
represented as an information-processing channel of multiple stages. Three stages will be required for any problem:
Information Acquisition, Identification, and Diagnosis.
The stages of information processing are depicted by rectangular boxes. Circles depict the input or output of
information of the stage. Any input or output actually is to be included at the appropriate stage since the information process
is carried out in the stage (the drawing is constructed as a simple visual conveyance device for the concept). The arrows
represent flow of information (in our case factoids). Arrows show backflow that represents the movement to previous stages.
Backflow arrows do not convey information. In this case, backflow means the operators retrograde to a previous stage and
information already acquired and processed in the current stage is temporarily stored in their working memory or forgotten
(Conant’s term would most likely be blockage). The model shows process sequence as well as the information flow internally
16
processed by the operator. By describing how information is integrated and reduced in stages, the model provides better
elucidation. The same model can represent asymptotic performance or something less than standard without defining
individual failure. The model can also convey various flows created from constrained extraction of the theater air power open
system. In the propose process, inputs are matched with the operator's tacit knowledge or mental model and transformed to
another type of output. Information at this stage could undergo a higher level of abstraction. If the data blob is not matched or
is validated as irrelevant it may just ‘fall on the floor’ (blocked) (See Appendix H) .
To better understand the proposed model, certain terms need to be defined. The definitions in Appendix P should be
used as reference.
Information acquisition is capturing data available at pickup points with the probes that are in place. An example of
this process is Airborne Warning And Control System (AWACS) (pickup point) using airborne radar (probe) to create a COP
track (data displayed in the AOC). The first step captures data available from the external environment. At this time, the
warfighter must correlate raw data (AWACS generated track) to understand the logical and physical variables of their
externally provided inputs that create their perception of reality. Tacit assumptions provide cognitive meaning of the signals
provided. The operators can create many types of information as output. Members of Combat Operations can receive
symmetric communication as a sign from individual computer screens, verbally from another team member, via the Ultra-
high Frequency (UHF)/Very High Frequency (VHF) radio, over one of several telephones, or chat screens. Members of
Combat Operations may also receive asymmetric communication as an e-mail, a message, or another publication. The
operator can transform the signal information to start to describe a problem, a situation, or a cause. (See Appendix R)
provides a visual depiction of information acquisition.
Information monitoring is the result of information acquisition. Monitoring output accrues when normal
(anticipated) or abnormal changes in the milieu cross the level of perception, and should be acknowledged if important
enough. This is the point at which cognitive activity and working memory cross and it is the traditional step after information
acquisition. If the event is not acknowledged, it will often be assumed to be background noise and could easily ‘fall on the
floor,’ or in Conant’s term become ‘blocked.’ Sign information may come from C2 systems, text chat, telephones, or other
operators. Operators may take an immediate action with a known response to a high priority input. Monitoring interprets the
signs from the previous stage and generates symptoms as output. A situation produced by the signs or other operators may
become blocked if the operator perceives the situation is a result of incorrect, uncorrelated, or obsolete information. Based on
the priority of the signal, operators may decide to skip all intermediate steps and go directly to executing an immediate
response or execute an ad hoc search for additional information. (See Appendix R) shows the most likely information flow
pattern in monitoring activities.
Redress occurs when monitoring and a perceived problem (perturbation) accrues. The members staffing Combat
Operations try to determine location and/or cause of the anomalies, faults, or events that are receiving additional scrutiny.
Individuals generate hypotheses based on synthesized information from multiple sources and senses. This stage continues
diagnosis and starts cause analysis. Other operators start to bring to bear their expertise to validate reasoning if needed.
As redress happens, synchronizing will become a necessity. Floor operators will predict how to move back toward
an expected outcome or how to minimize some losses. In synchronizing (coordinating), they will set goals, and procedures
will start to become clear. Often, both goals and procedures will require some level of command decision. Procedures to
respond to a situation are always formulated to achieve a goal. Procedures absolutely depend on the goal and involve the
tasks expected to reach the goal. The goal may come from written guidance in documents like the ATO, Rules of
Engagement (ROE), Air Operations Directive (AOD), or another source. The procedure could be written in the standard
operating procedure (SOP), memorized through experienced and training, or given as oral instruction. The main impetus is to
determine if something needs to be done and start implementation leading to execution.
If implementation (see Appendix R) is accomplished, a schedule action will result as an output task accomplished
using the MMI. The system output may be as simple as pushing the acquired information to another organization to resolve
or scheduling some action to take later. Conversely, the task could be an immediate response requiring all available C2
systems and operators to come together to solve a task. An example of an immediate response would be executing a Time
Sensitive Target (TST) mission.
Total information flow is represented by the sum of the total rate for the subsystems. For convenience of calculation,
assume the input from the environment has a probability approximately ‘off’ and ‘on,’ so each has 1 bit, though in a real

17
situation probabilities about ‘on’ and ‘off’ are not equal, with ‘off’ being most likely. In the case of many-to-one mappings,
assume output will be generated only if all input is ‘on.’ In information acquisition, there is no blockage, as all input is
transferred to the Identification stage. Information blockage accrues when information does not transfer to the next stage
because there is a reduction in the amount of information caused by many-to-one mappings.
The information Flow ‘F’ is the amount of information processed by the individual operator or by the team as
measured by Conant’s method. It is also a measure of the uncertainty of the situation (Shannon). The amount can be
represented as the sum of thru-put, blockage, and coordination (Ashby and Beer). Information processing in any task will be
mapped (or integrated) as a set of input transforming into a set of output, thereby reducing uncertainty. The amount of
process information directly relates to the operator’s workload. If a task demands a load beyond the operator or team's ability,
related errors may arise. Quantitative information analysis could level capacity or determine if a new or improved IT system
provides value to the human network. By defining transformation of information in stages, I can quantify the proposed
model. Each term (thru-put, blockage, and coordination) will be measured and considered as a workload that is designed to
do the required tasks.
8.2 Physical Model Manipulation, Data Collection
To increase understanding of the output generated with the ELICIT model, it is critical to have positive control over
the input. Positive control of dependent variables should allow understanding of independent variables operating in the
ELICIT model. The selected case study method is a comparison. To evaluate the human network we will compare a nominal
AOC organization structure to an AOC in an Edge organization construct. The dependent variable of the human network is
represented by the abELICIT agents; the independent variables are the technical network infrastructure, which we
manipulate.
In ELICIT, organizations are designed with the organizational and agent configuration files and then each agent
processes the factoids received to determine, among other things, whether to share that information with other agents it is
connected to, or to post or pull factoids from a notional website dedicated to a particular aspect of the problem. For
abELICIT, whether and when the agents have solved the problem is determined by processing the log files after the run is
completed. Software agents may be parameterized according to 54 parameters that determine, among other aspects, the way
they process information, build awareness, socialize and identify, whether to share, how often to share, and the propensity to
seek information. These are all examples of agent parameters that can vary. A number of parameters are associated with the
amount of time a particular action takes, e.g., how long it takes to share or post a factoid once the agent determines it will
share or post. Finally, there are a few Boolean (on/off, true/false) parameters, such as whether the agent is a guesser or a
hoarder of factoids.
Using this understanding of AbAgent based ELICIT, there are three primary data input mechanisms into the ELICIT
C2 model that the experimenter can control: 1) the configuration files; the 2) factoid list; and 3) what actions are available.
For this comparison case study, actions available are held constant in both the Nominal and Edge AOC organization
8.2.1 Configuration File
Appendix Q shows how an organization type .csv file can be loaded into the ELICIT server. Support from an
information technology specialist is not required.
8.2.2 Factoid file
By evolving the ELICIT software platform, tools, and procedures, I am able to support conducting ELICIT
experiments using operations tasks. I started with the baseline ELICIT task (Ruddy, 2007), which is an intelligence task.
Periodically during an experiment, ELICIT distributes factoids (i.e., information elements that are pieces of the scenario) to
the participants. Participants can choose to disseminate or not disseminate factoids to others by sharing information directly
with a particular participant or by posting a factoid to a particular information system. However, only by communicating
information can participants achieve sufficient levels of awareness to complete the task.

18
The four original baseline factoid sets each contain 68 factoids (four for each of the 17 participants). These factoids contain
only true information. There is no incorrect or conflicting information.
Each baseline Factoid Set consists of 17 Key or Expertise, 17 Supportive and 34 Noise factoids. Thus, the ratio of
relevant information to noise is 50%.
For purposes of the original experiment design, we took care to treat each participant equally. The factoid scenarios
are anonymized to reduce distractions based on previous experiences.
In this Air Power case study, we started out with 50% noise. For the second run, I added two more noise factoids per
participant, bringing the noise percentage up to 66%. For the final run, there are 6 noise factoids, bringing the noise
percentage up to 75%. Although I did not increase noise enough to choke the system, by choosing these three steps, I was
able to discern any trends. The experiment design is to measure the time needed to arrive at shared awareness across two
different organizational structures (Nominal, Edge) when step increasing two different information flow variables (noise,
system fragmentation). An increasing number of websites represents system fragmentation, and increasing the number of
noise factoids represents noise. At one time, I planned to accomplish system fragmentation by breaking Key and Supporting
factoids into multiple inputs. The technique of breaking Key and Supporting factoids into multiple inputs failed in execution,
as there was no way to determine if resulting system perturbations merely reflected a change in syntaxes and not system
fragmentation.
8.3 Data Capture
The variables expected to be measured by data extracted from the ELICIT datalogs are available in Appendix T.
8.4 Data Analysis
The data measurements expected from the ELICIT datalogs are as depicted in Appendix U:and Appendix U1
As this is a comparison case study, we compared the nominal AOC to the Edge AOC for trends and deviations. The baseline
for both types of AOCs will be 1X System Fragmentation and/or 50% noise.
My research gnaws at the core tenets of C2 in the information age and accomplishes the fundamental research and
validation that needs to take place. Initial research of command and control decision-making have tended to indicate either
that information had little effect on decision-making, or that any effects from information were dominated by variability
between decision makers (Mathieson, 2001; Daniel, Holt, & Mathieson, 2002).
Others researchers call out in loud voices for this type of research. For instance, Tolk, Bair, and Diallo state:
Interoperability of two systems implies mathematical equivalency of their conceptualization. In other words,
interoperability is only given in the intersection of two systems. This is counterintuitive to many current views that
assume that by interoperability the union of the provided capabilities becomes available. We therefore need an
operational frame that helps to orchestrate individual and independent technical solutions. (2012)
This research does not just deal with a US model; it brings in joint and coalition members and looks at the interaction. The
research tries to determine if too much or too little of a good thing (data/information) impacts organizational performance.
By using a pluralist approach, we have epistemologically defined an unexplored relationship between the C2 system and the
people that use them. By increasing noise and system fragmentation in a valid C2 operational model and getting results, we
have proved there is a measurable relationship between C2 systems and the human decision organization, which may be
greater than mere correlation. I pushed the model organization from a Nominal structure to an extreme “Edge” organization.
According to John Scott (1991), one should expect that many weak ties are more likely to introduce new information and
differing perspectives than tightly closed networks with many redundant ties. It other words it is better to have connections to
a variety of networks than many connections in a single network. Robin Dunbar suggested that a human network is perhaps
limited to about 150 members due to the physical capacity of humans. Mark Granovetter (2007) found there are homophilic
tendencies in any clique where each member of the clique knows more or less what the other members know. Was one of
these factors or were hundreds of other factors responsible for the change in my C2 measurements? Future research can
quantitatively decide those relationships. What I have proven is there is a need to seek to understand the fundamentals and
expected key C2 results as we move deeper into the Information Age. The following network results legitimize
organizational structure changes the measurable C2 factors in an AOC.

19
9.0 Organizations
Edge organization structure results are as depicted Appendix V (each 1 represents possible communication path). It is easy to
see how far we have pushed this organization: In my Edge construct, each organization/individual has symmetric
communications with all. This would imply total data sharing. It is the carnie call that total Edge offers.
9.1 Results from ELICIT (all data available upon request)
As this is a comparison case study, the nominal AOC was be compared to the Edge AOC for trends and deviations. The
baseline for both types of AOC’s will be 1X System Fragmentation and/or 50% noise. The ELICIT analysis tool output is as
displayed in Appendix W.
When we look at the Self-Synchronization (cognitive) charts (see Appendix W). the Edge organization synchs early
and late, with the Nominal organization bringing more along earlier. From and analysis some things can be learned. Like C2
is never static, as data becomes available the structure of the organization can influence the decision making resulting in
output reactions. As System Fragmentation an increase, the same pattern emerges the Nominal organization tends to bring all
along in understanding earlier in time. At the same time as system fragmentation rate doubles, not all are even able to
complete understanding in the nominal organization. With our data and double fragmentation the pattern of more people Self-
Synchronization earlier when compared with the Nominal organization. As System Fragmentation becomes obnoxious at 3
times our initial setting, the nominal organization finds the correct answers at even a faster rate. At triple fragmentation, our
Nominal organization still cannot achieve a Quality of ID by all leaders. With triple fragmentation the Quality of ID’s have
shifted to earlier. Continuing to increase system fragmentation has resulted in the Nominal organization experiencing earlier
many more individuals synchronizing, but at a certain time in the process the self-synchronization actually decreases. After
analyzing system fragmentation we looked to analyze how increasing noise is reflected in our two different organizational
structures.
9.2 Master Data Chart
When I first started working with ELICIT there was only one analysis tool. The tool provided quantitative results and in
some cases, I had to manually manipulate the results to display them in a graphic form. The goal all along was to use C2
measurements that had validity in the community. At the end of the project a new ELICIT graphic analysis tool became
available and output of the new tool was already in accepted measurements of C2. The following Master Data chart was the
data captured before the new ELICIT analysis tool (see images starting on Page140) was available. Whether evaluating the
data in the Master Data Chart or evaluating the graphic output provided by the newest ELICIT analysis tool both results point
to the same conclusion: When there is a change in either organizations or C2 systems that support them, there is a measurable
C2 effect. We may never have a common definition of C2, but that should not be a barrier to measuring and making better
the overall socio-technical macro system used to execute combat air power. In the noise baseline the number of Edge
problem solvers are early and late, whereas in the Nominal organization all slowly progress toward the answer in a more
group centric pattern. The CCO quality of ID moves earlier in our baseline noise level event in an Edge organization as
compared to the Nominal organization. The CCO quality of ID (red line) moves earlier in our baseline noise level event in an
Edge organization as compared to the Nominal organization. As noise increases, the Edge organization tends to plane off in
number of correct IDs until the end of the event, whereas the Nominal is always getting better. As noise increases, the JFC is
late to have quality of ID’s in both Edge and Nominal organization. In our AOC example increasing noise seems to have no
effect on either Edge or Nominal in determining self-synchronization. Even when noise moves to the extreme, the nominal
organization continues to bring all in understanding. As compared to system fragmentation the CCO, JFACC and JFC all
have a high quality of ID. The JFC tends to be later in the Edge organization with high noise levels. As noise moves to the
extreme, our Nominal organization and Edge organization both tend to level off in the middle of the event with the Nominal
picking up sooner in being more self-synchronized.
What this exercise has demonstrated is that there is a relationship between the human decision-making structure and
the underlying technical structure. I push the Edge organization to the extreme by having everyone communicate with

20
everyone else, and there are limits to NCW, as not all measures improve moving toward Edge. Instead an endless stream of
ELICIT analysis tool screen shoots the tool output was captured in Appendix X as a single (although large) table.
The nature of war historically adapts to the technology available. Metaphorically, ancient military operations were
more like solid mechanics, and industrial age combat could be well represented by fluid mechanics. Knowledge age combat
will rely on hierarchical silos of systems in which only a few have the full picture of the overall situation because no single
individual or organization has yet to prove they can hold and understand the cacophony of available data. I designed this
research to understand some of the core issues associated with operational Air Power C2 in the information age and to
develop a conceptual framework to analyze improving operational capability. The assumption is the AOC is comprised of
two networks, the technical (data/information flow) and human (defined by social networking where decisions are made),
with limited touch points. One of the goals of this effort was to use ELICIT and artificial software agents to vary AOC data
flow (increasing noise and system fragmentation/network fragmentation) and measure the change with social networking
metrics. Another was to vary organizational structure (Nominal and Edge) to determine the correlation to overall
data/information flow through the system. Using ELICIT is an attempt to move C2 research from a qualitative model towards
a quantitative model with some repeatability as a validation metric.
10.0 Move towards System of Systems Engineering (SoSE)
Powerful and dynamic forces are increasingly relevant to today’s military C2 environment. The advent of ubiquitous
worldwide communications is increasing the rate at which knowledge grows, and is shaping how it flows through our
systems. The inexorable progress of technological innovation creates possibilities as it destroys established processes and
augments current knowledge. Traditional systems engineering pursues creation of an isomorphic engineering model. In
today's dynamic environment, new C2 problems are emerging that resist isomorphic modeling. Traditional systems
engineering approaches are not sufficient. SoSE extends that systemic perspective to find solutions for the problems that
systems of systems create (Kern, 2006). SoSE requires the use of Minimum Critical Specifications (Taylor & Felten, 1996),
which stipulates only essential constraints to achieve overall performance level required by a system. Excessively specific
documents limit flexibility in the operation and the system. Minimal specificity permits integration of the system to produce
consistent levels of performance. The methodology in documentation supports a federation of systems in which no central
authority provides direction and autonomy; thus, heterogeneity and distribution hold the organization in place through
participation, cooperation and collaboration (Krygiel,1999).
Another principle of SoSE is content analysis. Strength of SoSE vice traditional systems engineering is use of
context analysis to address problems with a high degree of contextual influence. The theory of context concerns “relevant
circumstances, factors, conditions, and patterns that both constrain and enable the system solution development, deployment,
operation, and transformation” (Keating et. al, 2003). Methodology that addresses successful context analysis includes a
process for continual evaluation of how context affects analysis, design, and transformation. In SoSE theory, one may expect
that failure to adequately account for context will show a strategic failure of some type for the system (Keating et. al, 2004).
One C2 structure does not fit every C2 problem. Only by understanding the C2 structure within a given context can one
improve the issue. Moving all toward Edge or any other change should be understood within the larger context.
A third SoSE principle is Boundary Establishment and Control. “A boundary separates a system and its
environment. Defining a boundary is tantamount to defining the thing that is to be considered as a ‘system’ and those other
things that are to be considered as the system’s ‘environment” (Leonard & Clemson, 1984). SoSE recognizes the problem
inherent in establishing boundaries and acknowledges that boundaries change over time. In the documentation, boundary
changes should be processed and potential impact mitigated. The AOC does not have to consist of hardware and people in
one fixed location. We self-limit when we define it in those terms.
A salient factor of SoSE is iteration. Iteration in complex systems is recognizing a process that evolves with
additional information and understanding of the system and the environment in which it operates. Failure to iterate a
problematic system solution assumes perfect initial determination of the system – an unworthy assumption for any complex
system (Gibson, 1991). Documents that incorporate iteration assume a changing environment with shifts in condition and
requirements. Iteration should be a continuous reevaluation process with many parallel loops (Bahill et.al, 2002). As the

21
AOC moves forward in time there is not one optimal solution; there is a solution for today and a solution for tomorrow.
This paper attempts to provide additional information and understanding of the ‘problem.’
SoSE recognizes Complementary Law, in which any two perspectives will reveal truths regarding that system that
are neither entirely independent nor entirely compatible (Basic Ideas of General System Theory, 1936). Complementary law
includes multiple views and perspectives, particularly in the formative stage of a SoS effort, to ensure a robust approach and
design. Failure to include multiple perspectives is recognizably limiting to the eventual solution (Clemson, 1984). Using
CST to observe the AOC from both a technical perspective and social perspective incorporates Complementary Law.
A sixth recognized aspect of SoSE is transformation. Only through actual transformation do changes occur:
resources are expended, transformation objectives pursued, and results (intended and unintended) emerge. Adjustments to
strategy, based on intended and unintended results achieved, must maintain the correct trajectory for transformation (Keating
et. al, 2004). Simons agrees any system must plan for moves from stable form to stable form. Complex systems will develop
and evolve within an overall architecture much more rapidly if there are stable intermediate forms (Simon, 1969). Methods
that should be detected in user documents include a process to encourage readjustment to both intended and unintended
results as the SoS moves from one stable form to another. It is not expected to move from a starting point today to some
future ending point without a process to vector the effort continually with planned stable intermediate points.
A seventh principle of SoSE is self-organization, in which complex systems tend to organize themselves, and
characteristic structural and behavioral patterns result from interaction among system parts. Self-organizing reinforces the
homeostasis principle wherein systems survive only as long as all essential variables are maintained within their
physiological limits (Clemson, 1984). Maximizing autonomy (freedom of action and decision) within minimal system level
constraints achieves this status. Constraints are limited to those necessary for system integration.
An eighth principle is System Control. In management structure, the potential to act effectively belongs to that
subset of management that first acquires proper information. Information confers power. Any situation can potentially be
resolved in numerous ways by numerous subsets of the manager. Failure to recognize this potential (or overzealous
adherence to chain of command) robs an organization of creative solutions, ability to recognize crucial facts, trends, and
events, and a large fraction of its overall decision-making capability. Redundancy of potential command increases speed of
response, ability to detect novel events, information, trends, threats, and opportunities, creativity and decision-making, and
comprehensiveness of decision-making (Leonard & Clemson, 1984). Assessing expected information flow in requirements
generation, according to the International Council on System Engineering, does not occur in a vacuum. An essential part of
requirements development is the operations concept, the implicit design concept that accompanies it, and associated
technology demands. System needs cannot be established without checking impact (achievability) on lower level elements.
Information flow and system control is a ‘top-down’ and ‘bottom-up’ iteration and balancing process. “Control for a System
of Systems is achieved by maximizing the autonomy of subsystems. The SoSE methodology must appreciate target designs
that provide for the highest levels of subsystem autonomy. Control is achieved by establishment of subsystem performance
expectations that maximize overall system of systems performance” (Keating et. al, 2004).
The ninth principle is rigorous analysis. According to Keating, et al., the SoSE methodology is intended to provoke
rigorous analysis resulting in the potential for alternative decision, action, and interpretations for evolving complex system of
systems solutions. The SoSE methodology analyzes and frames problems and their context, manages emergent conditions,
and takes decisive action. The methodology provokes higher levels of inquiry, systemic analysis, and advanced
understanding of seemingly intractable problems en route to robust solutions. (Keating et al., 2004)
Rigorous analysis does not rely on simple ‘cut and paste’ or standard ‘cookie cutter’ approaches to problem solving.
The underlying philosophical approach applies core concepts from General System Theory.
The tenth standard and final subset is system outcome achievement. According to Keating, another principle of
SoSE is the ability to produce desirable results:
Metasystem performance must ultimately be judged on whether or not it continues to meet expectations for
positive impact on the problematic situation or continued fulfillment of an identified need/mission. A problem for
SoSE is the concern for shifting expectations of stakeholders that may change fluidly throughout the life of the
system of systems (Keating et al., 2004).
Measures of performance must be established carefully to allow SoSE to focus on output measurement as well as
outcome. By incorporating SoSE principles into designing my AOC, I have an opportunity to move far past the marketing

22
phrase, ‘right information, at the right time, in the right place, in the right format,’ to an engineering solution that actually
has the potential to improve overall capability.
11.0 Conclusion
As we enter the Information Age, history has proven that organizations can be overwhelmed with their exaction of
reality (information) as provided by their own massive technological infrastructure. The United States Navy guided missile
cruiser VINCENNES shot down the 290 passengers and crew of Iran Air Flight 655 when it fired two missiles on July 3,
1988. In his 1990 book Artificial Intelligence at War: An Analysis of the Aegis System in Combat, Chris Gray argues that “the
Aegis gave the Vincennes’ captain and crew the illusion that they knew more than they did.”
The practical issues are not just better computer design, or system design, or how to organize to use all information
that can be provided effectively, or how not to be overwhelmed by information. The issue identified in this paper is to learn
how to understand and discover core C2 concepts by using a quantitative repeatable approach. Van Creveld writes: “The
paradox is that, though nothing is more important than unit of command, it is impossible for one man to know everything.
The larger and more complex the forces that he commands, the more true this becomes” (1991).
One should note that Napoleon used centralized control, and commanded 85,000 men at Austerlitz with great
success; however, he lost control of half his force of 150,000 men at Jena and had no control of his 180,000-man force at
Leipzig (Van Creveld, 1991). John Boyd in his unpublished notes argues convincingly that Napoleon’s military downfall can
be attributed directly to his use of a highly centralized command and control system. Organization uncertainty (entropy) is a
condition subject to the will of all Commanders. Most Commanders, just being human, will desire to drive their entropy
towards zero. Van Creveld believes that while centralization reduces uncertainty (entropy) at the top, it increases that
uncertainty (entropy) at the bottom (1991). Decentralization has just the opposite effect (Snyder, 1993).
How the antagonists of some future war organize, equip, and train has not been set in theoretical “stone.” Confusion
begins with no common lexicon on exactly what is meant by the simple terms ‘command’ and ‘control.’ As Sutton (1986)
points out, a common definition of C2 will most likely never congeal. Just because something does not carry a universally
recognized moniker does not mean it cannot be thought about or measured, or made better. Between C2 theory and C2
operations stands C2 Systems. In his study of airpower in the first Gulf War, James Coyne notes:
Before the age of electronics and aerospace technology, command and control—in the modern sense of the
term—was a comparatively minor element in warfare. Battles were fought, albeit inefficiently and often
ineffectively, independent of the health of supporting communications. (1994)
There is little literature available that validates using any technique to provide elicitation on Command and Control.
In many ways, qualitative research into difficult subjects has been fighting ‘uphill’ against quantitative research for centuries.
Our approach follows Newton’s worked and how he applied the scientific approach to a complex problem: he used his senses
to see the apple fall from the tree. Through inductive reasoning, he was able to formulate that two objects attract each other
(empiricism). His reasoning was a qualitative finding. Only after the reasoning did he gather the data and conduct
experiments to test his expectations/hypothesis. Through his use of both qualitative and quantitative methods, he was able to
produce the Universal Law of Gravitation.
Our technique resulted in refined a model to shows process sequence as well as the information flow internally
processed by the operator. By describing how information is integrated and reduced in stages, the model provides initial
elucidation. We used the same model to represent asymptotic performance or something less than standard without defining
individual failure. The model also conveyed various flows created from constrained extraction of the theater air power open
system. In the propose process, inputs are matched with the operator's tacit knowledge or mental model and transformed to
another type of output. Information at this stage underwent a higher level of abstraction. If the blob of incoming information
was unmatched, or is validated as irrelevant, it just ‘falls on the floor’ (blocked). Using this conceptual model, we took the

23
available measures of C2 and used a physical model (ELICIT) to examine the current theory of C2 (Network Center
Warfare). The theory was salable and will have challenges in execution.
Where to place the grommet on whom, how and where uncertainty (entropy) is minimizes to maximize the utility of
any C2 investment parallels in criticality, informational trends. George Orr uses the term hierarchical organization vise
Nominal organization, but the thought is same; it is as an organization that:
attempts to turn the entire military force into an extension of the commander. Subordinate levels respond in
precise and standardized ways to his orders and provide him with the data necessary to control the entire military
apparatus. The emphasis is upon connectivity hierarchy, upon global information gathering or upon passing locally
obtained information to higher levels, and upon centralized management of the global battle (1983).
At the other end of the spectrum is an Edge organization. In 1983, Orr used the term network vise Edge, but again
the underlying concept is the same. Orr describes his network/edge concept these terms:
views the commander as controlling only in the sense of directing a cooperative problem solving effort.
The emphasis in this style is on autonomous operation at all levels, upon the development of distributed systems and
architectures, upon networking to share the elements needed to detect and resolve possible conflicts, and upon
distributed decision making processes (1983).
Just as in 1983, pushing entropy forward (Edge) organizations gather and process information with the goal that the
information will be equally distributed and made available to all that need it with the assumption that more and rapidly-
transmitted information to all levels of command will improve decision-action. To understand where to logically place the
entropy garment is directly proportional to understanding the relationship between the technical network providing the data
and the human network using the data.
Other researchers perceive there is a relationship between the technical network and the human network in
Command and Control. Cliff Joslyn and Luis M. Rocha write:
Our world is becoming an interlocking collective of Socio-Technical Organizations (STOs): large numbers of
groups of people hyperlinked by information channels and interacting with computer systems, and which themselves
interact with a variety of physical systems in order to maintain them under conditions of good control. Primary
examples of STOs include Command and Control Organizations (CCOs) such as 911/Emergency Response Systems
(911/ERS) and military organizations, as well as utility infrastructures such as power grids, gas pipelines, and the
Internet. The architecture of such systems is shown in Appendix K, where a physical system is controlled by a
computer-based information network, which in turn interacts with a hierarchically structured organization of
semiotic agents.
The vast complexity and quantity of information involved in these systems makes simulation approaches necessary,
and yet the existing formalisms available for simulation are not sufficient to reflect their full characteristics. (2000)
Joslyn and Rocha point to the need for highly reflective models and simulation in some case this may be true. For initial
inquiry, we will point to Macy:
Analysis of very simple and unrealistic models can reveal new theoretical ideas that have broad
applicability, beyond the stylized models that produced them. Pressure to make models more realistic (and agents
more cognitively sophisticated) is misguided if models become so complex that they are as difficult to interpret as
natural phenomena. When researchers must resort to higher order statistical methods to tease apart the underlying
causal processes, the value of simulation is largely undermined (2002).

24
11.1 ELICIT
We can begin to understand the relationship between the human network and the technical network by examining
the system under change. Changes in the technical network should result in changes in the social network, and changes in the
social network should result in a measurable difference in utilization of the technical network. Contingency theory states that
there is no best way to organize; not all ways to organize are equally effective. As we move deeper into the Information Age,
we need to understand Air Power C2 from a scientific approach to maximize its utility.
I modified the ELICIT C2 model to conduct this work. Data can be ‘cherry picked,’ to eliminate that as an
argument against the results ELICIT and the ELICIT analysis tools are predefined. To insure viability, criteria used for
comparison was developed and refined by Marco Manso in his 2012 paper, “N2C2M2 Validation using abELICIT: Design
and Analysis of ELICIT runs using software agents” presented at the 17th ICCRTS. The reliability of this study is based on
following a recognized Case Study research method. The data produced was extensive and required a previously developed
analysis tool and a new analysis tool, custom built, to accomplish data extraction. Both C2 analysis tools work, but there are
no manuals for their use; with the micro academic C2 community supporting the analysis tools, they are best defined as
‘clunky.’ Although the ELICIT model has been validated against humans, the analysis tools have not been validated. C2
modeling to understand complex systems provides one more arrow in the quiver to evaluate operational C2 as compared to
actual warfare, historical studies, field experiments, or just buying more, faster, and ‘better’ sensors and communication
gear. ELICIT was vital to this work. ELICIT is used to determine how a representative AOC C2 system changes, varying
noise and system fragmentation, when in either a Nominal or Edge organizational construct. In some ways (overall early
cognitive self-synchronization), the results show Nominal structure as the better performing organization, though in other
ways, Edge (no loss of cognitive self-synchronization over the entire event) is better. The analysis provides understanding
that the AOC is a socio-technical system of systems, and simple solutions, such as providing more data, may not support
better decision-making, potentially leading to better outcomes.
11.2 Future Research Recommendations
The future of C2 in the Information Age is a conundrum. Command and Control systems for Air Power will most
likely remain warfighters using systems to artificially represent reality, and respond to and influence that reality. Airpower
will provide a critical umbrella of global reach and global strike for most military operations. It should be expected that
something like Air Tasking Order will be the mechanism that is used for self-synchronization and synchronization with other
components. Future research needs to address three C2 subjects utilizing a scientific process. The first research that needs to
be undertaken is to determine the underlying non-changing principles of Air Power C2. The second area of research is to
understand how C2 can be employed as an offensive weapon. Third, we must ask how we can maximize the effectiveness
and efficiency of the macro C2 socio-technical system in an information-saturated milieu.
One cannot help but look upon the social environment and the underlying technological infrastructure we are
constructing for Command and Control without some trepidation. As the macro C2 system evolves, one should expect it to
become more structurally complex, as history has demonstrated. Warfighters and their technology will always have a
symbiotic relationship. Moving forward, this should not be a problem in and of itself. We need to recognize the mismatch
between the optimism brought by science and engineering and the sometimes hidden risk of complex system behavior. In
complex systems, the sum is always greater than the parts. It is well known that any deterministic system will generate
random-seeming behavior given a long enough period of time.
The philosopher Alfred North Whitehead captured the essential character of evolving, adapting systems most elegantly when
in the 1920s he considered the domain of human social organization:
The social history of mankind exhibits great organizations in their alternating functions of conditions for
progress, and of contrivances for stunting humanity. The history of the Mediterranean lands, and of western Europe,
is the history of the blessing and the curse of political organizations, of religious organizations, of schemes of
thought, of social agencies for large purposes. The moment of dominance, prayed for, worked for, sacrificed for, by

25
generations of the noblest spirits, marks the turning point where the blessing passes into the curse. Some new
principle of refreshment is required. The art of progress is to preserve order amid change, and to preserve change
amid order. (1927-28)
Quantitative research (such as this paper) is designed to help people make sense of what is going on in the world
around them (Easterby-Smith et al., 2002). Case study work offers the ontological assumption that the aim of the study is to
represent various views of multiple realities. Every nation state thinks about C2. Every service practices C2 differently. We
hope that what we achieve at the end of the research process is to provide some clarity on the future.
In this paper, we have defined the unique contributions“C2 in the Information Age” brings to the plethora of C2
thought. At the current time, all sorts of organizations, from nuclear control centers, to AOCs, to emergency management
centers, to NASA, seem to have stumbled into the need to understand core C2 principles of the information age. Over time, it
will be easy to judge the winners and loser in this new realm of human activity. The loser will most likely continue to try to
string systems together and complain about the results until they are swept away by the tides of time and a winner
“outthinks” their problems. We have started in Maykish Stage 6 and the goal of this paper to begin to sort through the
Uncertain that currently exists by pushing against the walls of darkness in which mankind eternally struggles.

26
REFERENCES
Abramson, P.R. (1992). A case for case studies. Thousand Islands, CA: Sage.
Alberts, D.S., & Hayes, R.E. (1995). Command arrangements for peace operations. Washington, DC: CCRP.
Alberts, D.S., & Hayes, R.E. (2003). Power to the edge: Command…control…in the information age. Washington,
DC: CCRP.
Alberts, D.S., & Hayes, R.E. (2005). Code of best practice campaigns of experimentation. Washington, DC: CCRP.
Alberts, D.S., & Hayes, R.E. (2006). Understanding command and control. Washington, DC: CCRP.
Alberts, D.S. (2008). Agility, focus, and convergence: The future of command and control. International Command
and Control Journal, (1) 1, 1-30.
Alberts, D.S., Garstka, J.J., Hayes, R.E., & Signori, D.T. (2001). Understanding information age warfare.
Washington, DC: CCRP.
Alberts, D.S., Garstka, J.J., & Stein, F.P. (1999). Network centric warfare: Developing and leveraging information
superiority. Washington, DC: CCRP.
Alberts, D.S., Hayes, R.E., Kirzl, J., Maxwell, D., & Leedom, D. (2002). Code of best practice for experimentation.
Washington, DC: CCRP.
Alberts, D.S. (2011). The agility advantage: A survival guide for complex enterprises and endeavors. Washington,
DC: CCRP.
Anderson, A. (1988). Learning from a computer cat. Nature (331), 657-658.
Organizational Science (18) 5, 1-18.
Arrow, K.J. (1962). The economic implications of learning by doing. Review of Economic Science (29) 3, 155-173.
Ashby, W. R., (1948). Design for a brain. Electronic Engineering (20), 379-383.
Ashby, W.R. (1956). An introduction to cybernetics. London, UK: Chapman & Hall, Ltd.
Ashby, W. R., & Conant, R. (1970). Every good regulator of a system must be a model of the system. International
Journal of Systems Science, (1) 2, 89-97.
Bahill, A.T., & Dean, F.F. (2009). What is systems engineering: A consensus of senior systems engineers. Retrieved
from http://www.sie.arizona.edu/sysengr/whatis/whatis.html
Bainbridge, L. (1997). The change in concepts need to account for human behavior in complex dynamic tasks. IEEE
Transactions on Systems, Man, and Cybernetics (27) 3, 351-359.
Barnes, J. (1954). Class and committees in a Norwegian island parish. Human Relations, 7, 39-58.

27
Beer, S. (1979). The heart of enterprise. London, England, & New York, NY: Wiley.
Beer, S. (1981). Brain of the firm. London, England: Wiley.
Beer, S. (1985). Diagnosing the system for organizations. Chichester, NY: Wiley.
Bharadwaj, A.S., Bharadwaj, S.G., & Konsynski, B.R. (1999). Information technology effects on firm performance
as measured by Tobin’s q. Management Science (45) 7, 1008-1024.
Bogdan, R. C., & Bicklen, S. K. (1982). Qualitative research for education: An introduction to theory and methods.
Boston: Allyn and Bacon.
Boyd, J.R. (1987). Organic design for command and control. In A Discourse on Winning and Losing, unpublished
briefings and essays. Air University Library.
Brillouin, L. (1962). Science and information theory (2nd
ed.). New York, NY: Academic.
Brynjolfsson, E., & Hitt, L. (2000). Beyond computation: Information technology, organizational transformation,
and business performance. Journal of Economic Perspectives (14) 4, 23-28.
Campbell, D., Crutchfield, J., Farmer, D., & Jen, E. (1985). Experimentation mathematics: The role of computation
in nonlinear science. Commun. ACM (28), 374-384.
Campbell, D., & Stanley, J. (1966). Experimental and quasi-experimental designs for research. Chicago, IL: Rand
McNally.
Carlsmith, J.M., Ellsworth, P.C., & Aroson, E. (1976.) Methods of research in social psychology. Reading, MA:
Addison-Wesley.
Cassell, C. & Symon, G. (1994). Qualitative methods in organisational research. London: Sage.
Casti, J.L. (1985). Canonical models and the law of requisite variety. Journal of Optimization Theory and
Applications (46), 455-459.
Casti, J.L. (1989). Alternate realities: Mathematical models of nature and man. New York, NY: Wiley & Sons, Ltd.
Center for Edge Power. (2006). Retrieved from http://www.nps.navy.mil/GSOIS/cep/mission.htm
Clemson, B. & Leonard, A. (1984). Cybernetics: A new management tool. Kent, England: Abacus Press.
Conant, R.C. (1976). Laws of information which govern systems. IEEE Transactions on Systems, Man, and
Cybernetics (6) 4, 240-255.
Cord, J. (2010). Fury ring addresses knowledge management and dynamic information flow process. Army
Communicator (35) 3, 32.
Coyne, J. P. (1992). Airpower in the gulf. Arlington, VA: Air Force Association.

28
Creswell, J. W. (2003). Research design: Qualitative, quantitative, and mixed methods Approaches. (2nd ed.).
Thousand Oaks, CA: Sage.
Casazza, S., Hendrix, S., Lederle, D., & Rouge, E. (2012). US Army information technology management.
Curts, R.J., & Campbell, D.E. (2008, June). Transitioning from “command and control” to “command and trust.”
Paper presented at 13th
International Command and Control Research and Technology Symposium, Bellevue, WA.
Cyert, R.M., & March, J.G. (1963). A behavioral theory of the firm. Malden, MA: Blackwell Publishers.
Daniel, D., Holt, J., & Mathieson, G.L. (2002). What influences a decision. Paper presented at 19th
International
Symposium on Military Operations Research (ISMOR), Oxford, UK.
Defense Acquisition Process Tutorial (2008) Office of the Under Secretary of Defense for Acquisition, Technology
and Logistics (OUSD AT&L), 2008, Systems Engineering Plan Preparation Guide, Washington, DC: Pentagon,
April.
Department of Defense. (2001). Joint Chiefs of Staff (JCS) publication 1.02: The Department of Defense dictionary
of military and associated terms. Washington, DC: United States Joint Chiefs of Staff.
Easterby-Smith, M., Thorpe, R. & Lowe, A. (2002). Management research: An introduction. (2nd
ed.). London:
Sage.
Edmonds, B. (1997, August). Complexity and scientific modelling. Paper presented at the 20th
International
Wittgenstein Symposium, Kirchberg am Wechsel, Austria.
Eisenhardt, K.M. (1989). Building theories from case study research. Academy of Management Review, (14) 4, 532-
550.
Emory, C.W., & Cooper, D.R. (1991). Business research methods. (4th ed.). Boston: Irwin.
Feagin, J., Orum, A., & Sjoberg, G. (Eds.). (1991). A case for case study. Chapel Hill, NC: University of North
Carolina Press.
Flood, R., & Carson, E. (1993). Dealing with complexity: An introduction to the theory and application of systems
science. New York, NY: Plenum.
Gabriel, C. (1990). The validity of qualitative market research. Journal of Marketing Research Society, (32) 4, 507-
519.
Galbraith, J.R. (1973). Designing complex organizations. Boston, MA: Addison-Wesley Longman Publishing Co.,
Inc.
Gibson, J. (1991). How to do systems analysis. Unpublished manuscript.
Granovetter, M. (1973). The strength of weak ties. The American Journal of Sociology, 78 (6), 1360-1380.
Granovetter, M. (2007). Introduction for the French reader. Sociologica, (2), 1–8.

29
Guba, E. G., & Lincoln, Y. S. (1994). Competing paradigms in qualitative research. In N. K. Denzin & Y.S. Lincoln
(Eds.), Handbook of qualitative research (105-117). Thousand Oaks, CA: Sage.
Hanneman, R. A., & Riddle, M. (2005). Introduction to social network methods. Riverside, CA: University of
California, Riverside. Retrived from http://faculty.ucr.edu/~hanneman/
Hansen, M. (2002). Knowledge networks: Explaining effective knowledge sharing in multiunit companies.
Organization Science (13) 3, 232-248.
Hayes, R.E., Layton, R.L., Ross, W.A., Spoor, J.W.S., & Hollis, T.A. (1993). Enhancements to the Army command
and control system. Vienna, VA: EBR.
Hayes, R.E., & Sugarman, K. (2006). Thunder run. In Proceedings of the 11th
International Command and Control,
Research and Technology Symposium (ICCRTS). Vienna, VA: EBR.
Hayes, R.E., & Wheatley, G.F. (2001). The evolution of the Headquarters Effectiveness Assessment Tool (HEAT)
and its applications to joint experimentation. In Proceedings of the 6th
International Command and Control,
Research and Technology Symposium (ICCRTS). Vienna, VA: EBR.
Hill, R. and Dunbar, R. (2002). Social network size in humans. Human Nature, 14 (1), 53-72.
Hinds, P.J., & Kiesler, S. (2002). Distributed work. Cambridge, MA: MIT Press.
Hirschman, E. C. (1986). Humanistic inquiry in marketing research: Philosophy, method, and criteria. Journal of
Marketing Research, (23), 237-249.
Huber, R.K., Richter, S., Römer, J., & Lechner, U. (2008, June). Assessment of C2 maturity against the background
of complexity of disaster relief operations: Two case studies of the tsunami 2004 and Elbe flood 2002. Paper
presented at 13th
ICCRTS: C2 for Complex Endeavors, Seattle, WA.
Jackson, M.C. (1991). Systems methodology for the management sciences. New York, NY: Perseus.
Kaplan, I.T. (1980). Information flow in battalion command groups. Alexandria, VA: U.S. Army Research Institute
for the Behavioral and Social Sciences.
Kast, F.E., & Rosenzwieg, J.E. (1985). Organization and management: A systems and contingency approach (4th
ed.). New York: McGraw-Hill.
Katz, D. & Kahn, R. L. (1978). The social psychology of organizations (2nd
ed.). New York: John Wiley & Sons.
Kazdin, A. E. (1978). History of behavior modification: Experimental foundations of contemporary research.
Baltimore, MD: University Park Press.
Keating, C., Rogers, R., Unal, R., Dryer, D., Sousa-Poza, A., Safford, R., ... & Rabadi, G. (2003). System of
Systems Engineering. Engineering Management Journal, 15(3), 35-44.
Keating, C.B., Unal, R., Sousa-Poza, A., Dryer, D., “System of Systems Engineering”, Engineering Management
Journal: Special Issue on Systems Engineering, August (2003). Charles Keating, Andres Sousa-Poza, Ji Hyon Mun,
2004
Kern, D. (2006). Unpublished manuscript

30
Kim, J.H., Seung, J.L., & Poong, H.S. (2003). Investigation on applicability of information theory to prediction of
operator performance in diagnosis tasks at nuclear power plants. IEEE Transactions on Nuclear Science, (50) 4,
1238-1252.
King, G., Kochrane, R., & Verba, S. (1994). Designing social inquiry: Scientific inference in qualitative research.
Princeton, NJ: Princeton.
Klir, G.J. & Elias, D. (2003). Architecture of systems problem solving. New York, NY: Da Capo Press
Klimoski, R., & Mohammed, S. (1994). Team mental model: Construct or metaphor. Journal of Management (20),
403-437.
Kratochwill, T. R. (Ed.). (1978). Single subject research: Strategies for evaluating change. New York, NY:
Academic Press.
Kuefler, J. (2012). Media fragmentation: 10 things you can do right now. Retrieved from
http://www.callahancreek.com/media-fragmentation-ten-things-you-can-do-right-now-1
Layder, D. (1993). New strategies in social research. Cambridge: Polity Press.
Lincoln,Y. S., & Guba, E. G. (1985). Naturalistic Inquiry. Beverly Hills, CA: Sage.
Lindblom, C.E. (1959). The science of muddling through. Public Administration Review (19), 79-88.
Lipton, R., Marr, T., & Welsh, J.D. (1989). Computation approaches to discovering semantics in molecular biology.
Proc. IEEE (77), 1056-1060.
Manso, M., & Moffat, J. (2011, June). Defining and measuring cognitive-entropy and cognitive self-
synchronization. Paper presented at the 16th
ICCRTS, Quebec City, QC.
Manso, M., & Nunes, P. (2008, June). ELICIT and the future C2: Theoretical foundations for the analysis of ELICIT
experiments. Paper presented at the 13th
ICCRTS, Seattle, WA.
Martin, D.M., & McEver, J.G. (2008, June). Metrics, analysis, and methods for the exploitation of ELICIT
experimental data. Paper presented at the 13th
ICCRTS, Seattle, WA.
Mathieson, G.L. (2001). The impact of information on decision making. Paper presented at 18th
International
Symposium on Military Operations Research (ISMOR), Oxford, UK.
Mathieu, J.E., Heffer, T.S., Goodwin, G.F., Salas, E., & Cannon-Bowers, J.A. (2000). The influence of shared
mental models on team process and performance. Journal of Applied Psychology (85), 273-283.
Maykish Paul J. (2014). C2 rising: A historical view of our critical advantage. Air and Space Power Journal 28 (4),
26-55.
McCrabb, M. (2001). Effect-based operations: An overview. Unpublished PowerPoint slides, United States Air
Force.
McDaniel, C., & Gates, R. (1991). Contemporary market research. St. Paul, MN: West.

31
McEver, J.G., Hayes, R.E., & Martin, D.M. (2007). Operationalizing C2 agility: Approaches to measuring agility in
command and control contexts. Paper presented at the 13th
ICCRTS, Seattle, WA.
Miles, M. B., & Huberman, A. M. (1994). Qualitative data analysis: An expandedsourcebook. Thousand Oaks: Sage
Publications.
Milgram, S. (1967). The small world problem. Psychology Today, (1) 1, 60-67.
Moray, N. (1990). A lattice theory approach to the structure of mental models. Urbana-Champaign, IL: Departments
of Mechanical and Industrial Engineering and of Psychology.
NATO. (2008). Glossary of terms and definitions (standardization agreement no. AAP-6). Brussels, Belgium:
NATO.
Nohria, N. (1998). The emergence of new organizational forms: Is a network perspective a useful way of studying
organizations. In Hickman, G.R. (Ed), Leading organizations: Perspective for a new era (287-301). Thousand Oaks,
CA: SAGE Publication Inc.
Nørretranders, T. (1991). Märk världen: en bok om vetenskap och intuition. Stockholm: ALBA.
Pugh, S. (1991). Total design. Menlo Park, CA: Addison-Wesley.
Resig, J., Dawara, S., Homan, C., & Teredesai, A. (2004). Extracting scoial networks from instant messaging
populations.
Robson, C. (2002). Real world research (2nd
ed.). Oxford, UK: Blackwell.
Rose, D., & Dobson, V. (1985). Methodological solutions for neuroscience. In D. Rose and V. Dobson (Eds.),
Models of the visual cortex (533-560). New York, NY: John Wiley & Sons, Ltd.
Ruddy, M. (2007, June). ELICIT—The Experimental Laboratory for Investigating Collaboration Information-
sharing and Trust. Paper presented at the 12th
ICCRTS, Newport, RI.
Scott, John. (1991). Social network analysis. London: Sage.
Serrat, O. (2009). Social network analysis. Washington, DC: Asian Development Bank.
Shannon, C.E. (1948). A mathematical theory of communication. The Bell Telephone Journal, 29, 309-423.
Shannon, C.E., & Weaver, W. (1949). The mathematical theory of communication. Chicago, IL: University of
Illinois Press.
Shapiro, C., & Varian, H.R. (1998). Information rules: A strategic guide to the network economy. Boston, MA:
Harvard Business School.
Simon, Karl-Heinz. (2009). Critical systems theory. In Francisco Parra-Luna (Ed.), Systems science and cybernetics.
Madrid, Spain: EOLSS.
Simpson, M. (2006). Unpublished manuscript.

32
Singleton, R., Straits, B., & Straits, M. (1993). Approaches to social research. New York, NY: Oxford.
Skyttner, L. (2005). Basic ideas of general system theory. Singapore: World Scientific Publishing Co., Ltd.
Smith, L. M., & Pohland, P. A. (1974). Education, technology, and the rural highlands. In D. Sjogren (Ed.), Four
evaluation examples: Anthropological, economic, narrative and portrayal. Chicago, IL: Rand McNally.
Snyder, A. (1993). The essence of objects: Concepts and terms. IEEE Software (10) 1, 31–42.
Sonnenwald, D.H., & Pierce, L.G. (1998). Interwoven situational awareness, dense social networks, and contested
collaboration in command and control. Unpublished manuscript.
Special issues. (2008). Command and Control Research Program (CCRP). Retrieved from
http://www.dodccrp.org/html4/journal_special.html#call.
Stake, R.E. (1995). The art of case study research. Thousand Oaks, CA: Sage.
Stiglitz, J. (2000). The contributions of the economics of information to twentieth century economics. Quarterly
Journal of Economics (4) 115, 1441-1478.
Strauss, C.M. (1974). Computer-encouraged serendipity in pure mathematics. Proc. IEEE (62), 493-495.
Strauss A. and Corbin J. (1990). Basics of qualitative research: Grounded theory procedures and techniques.
London, UK: Sage.
Summerhof, G. (1950). Analytical biology. London, UK: Oxford University Press.
Sutton, C.G. (1986). Command and control at the operational level. Carlisle Barracks, PA: US Army War College.
Taylor, J.C., & Felton, D.F. (1993). Performance by design: Sociotechnical systems in North America. Englewood
Cliffs, NJ: Prentice-Hall.
Tellis, W. (1997). Introduction to case study. The Qualitative Report (3) 2. Retrieved from
http://www.nova.edu/ssss/QR/QR3-2/tellis1.html
Tolk, A., Bair, L.J., & Diallo, S.Y. (2013). Supporting network enabled capability by extending the levels of
conceptual interoperability model to an interoperability maturity model. Journal of Defense Modeling and
Simulation: Applications, Methodology, Technology, (10) 2, 1-16.
Tolman, E.C. (1948). Cognitive maps in rats and men. Psychological Review (55), 189-208.
Tsoukas, H. (1989). The validity of idiographic research explanations. Academy of Management Review, (14) 4,
551-561.
United States Air Force. (2003). Air Force doctrine document 1. Washington, DC: United States Air Force.
33
Waelchli, F. (1989). The VSM and Ashby’s law as illuminants of historical management thought. In R. Espejo and
R. Harnden (Eds.), The viable system model: Interpretations and applications of Stafford Beer’s VSM. Chichester:
Wiley.
Wasserman, S., & Faust, K. (1994). Social network analysis: Methods and applications. Cambridge: Cambridge
University Press.
Woods, D.D., & Roth, E. (1986). The role of cognitive modeling in nuclear power plant personnel activities: A
feasible study. Washington, DC: NUREG-CR-4523, United States NRC.
Yin, R.K. (1984). Case study research: Design and methods (1st ed.). Beverly Hills, CA: Sage.
Yin, R. K. (1989). Case study research: Design and methods. (Revised 1st ed.). Thousand Oaks, CA: Sage.
Yin, R. K. (1994). Case study research: Design and methods. (2nd
ed.). Thousand Oaks, CA: Sage.
Yin, R.K. (2003). Case study research: Design and methods (3rd
ed.). Thousand Oaks, CA: Sage.
Zikmund, W. (1991). Business research methods. New York, NY: Dryden.
Supplemental Sources Consulted
Bar-Yam, Y. (2002). Large scale engineering and evolutionary change: Useful concepts for implementation of
FORCEnet. Report for contract F30602-02-C-0158, New England Complex Systems Institute, Cambridge, MA.
Bar-Yam, Y. (2003). Complex systems and evolutionary engineering. Concept paper, Air Operations Center
Weapons System Lead Systems Integrator Program, Cambridge, MA.
Brehmer, B. (2007). Understanding the functions of C2 is the key to progress. International Command and Control
Journal, (1) 1, 211-232.
Brookes, A., & Bankes, S., & Bennett, B. (1997). Weapon mix and exploratory analysis: A case study. Washington,
DC: RAND.
Bruner, J. (1990). Acts of meaning. Cambridge, MA: Harvard University Press.
Checkland, P. (1981 and 1999). Systems thinking, systems practice. Chichester, MA: John Wiley & Sons, Ltd.
Checkland, P. (1984). Systems thinking in management: the development of soft systems methodology and its
implications for social science. In H. Ulrich & G.J.B. Probst, Self-organization and management of social systems
(94-104). Berlin, Germany: Springer-Verlag.
Checkland, P. (1988). Soft systems methodology: An overview. J. Appl. Sys. Anal. (15), 27-30.
Checkland, P. (1999). Soft systems methodology: A 30-year retrospective. Chichester, MA: John Wiley & Sons,
Ltd.

34
Cummings, M.L., Bruni, S., Mercier, S., & Mitchell, P.J. (2007). Automation architechture for single operator,
multiple UAV command and control. International Command and Control Journal, (2) 1, 1-24.
Department of Defense. (2005). Test and evaluation guide (5th
ed.). Fort Belvoir, VA: Defense Acquisition
University.
Essens, P., Spaans, M., & Treurniet, W. (2007). Agile networking in command and control. International Command
and Control Journal, (1) 1, 177-210.
Gansler, J.S. (1989). Affording defense. Cambridge, MA: The MIT Press.
Glaser, B.G. (1978). Theoretical sensitivity: Advances in the methodology of grounded theory. Mill Valley, CA:
Sociology Press.
Glaser, B.G. (1998). Doing grounded theory: Issues and discussions. Mill Valley, CA: Sociology Press.
Glaser, B.G., & Strauss, A.L. (1967). The discovery of grounded theory strategies for qualitative research. Chicago,
IL: Aldine.
Hayes, R.E. (2007). It’s an endeavor, not a force. International Command and Control Journal, (1) 1, 145-176.
Huber, R.K., Eggenhofer, P.M., Römer, J., Schäfer, S., & Titze, K. (2007). Effects of individual team characteristics
on the performance of small networked teams. International Command and Control Journal, (1) 1, 113-144.
Keating, C., Rogers, R., Unal, R., Dryer, D., Sousa-Poza, A., Safford, R., ... & Rabadi, G. (2003). System of
Systems Engineering. Engineering Management Journal, 15(3), 35-44.
Kelly, G.A. (1963). A theory of personality: The psychology of personal constructs. New York, NY: W.W. Norton
& Co.
Kuper, S.R., & Giurelli, B.L. (2007). Custom work aids for distributed command and control teams: A key to
enabling highly effective teams. International Command and Control Journal, (2) 1, 25-42.
Malhotra, Y. (1999). Bringing the adopter back into the adoption process: A personal construction framework of
information technology adoption. Journal of High Technology Management Research, 10 (1), 79-104.
Moffet, J. (2007). Modelling human decision-making in simulation models of conflict. International Command and
Control Journal, (1) 1, 31-60.
Morris, C.W. (1938). Foundations of the theory of signs. Chicago, IL: University of Chicago Press.
Nissen, M.E. (2007). Enterprise command, control, and design: Bridging C2 practice and CT research. International
Command and Control Journal, (1) 1, 61-112.
Parasuraman, R., Barnes, M., & Cosenzo, K. (2007). Adaptive automation for human-robot teaming in future
command and control systems. International Command and Control Journal, (2) 1, 42-68.

35
Schade, U., & Hieb, M.R. (2007). Improving planning and replanning: Using a formal grammar to automate
processing of command and control information for decision support. International Command and Control Journal,
(2) 1, 69-90.
Simon, H. A. (1977). The organization of complex systems. In Models of Discovery (pp. 245261). Springer
Netherlands.
Simpson, M. L. (2008, November). Beyond cybernetics (Risk mitigation for a “Flat Earth” information milieu).
Paper presented at 2008 American Society of Engineering Management, West Point, NY.
Stanley, W.L. (2004). Assessing the affordability of fighter aircraft force modernization. In P.K. Davis (Ed.), New
challenges in defense planning: Rethinking how much is enough (pp769-781). Washington, DC: RAND.
Strombach, W. (1986), Information in epistemological and ontological perspective. In C. Mitcha, C. and Huning A
(Eds.), Philosophy and technology II: Information technology and computers in theory and practice. D. Dordecht,
Holland: Reidel Pubishing Co.

36
APPENDIX A - Modification of Maykish
Table 1- Modification of Maykish (2014)
Stages of
Modern C2
Waypoints Navigating
Megatrends
Discovering
Fundamentals
Key C2 Result
Stage 1 Napoleon
(France)
The looming of
industrial-style
warfare
Expanding C2 art
in the single leader,
single battlefield
model
Pushed C2 art
Stage 2 Moltke
(Prussia)
Transportation and
communication
revolutions
A “system of
expedients” over
multiple battlefields
Envisioned
systems
warfare
Stage 3 Tukhachevskii
(Russia)
New operational
level of war and the
front edge of the
aviation age
“Expedients” refined
into clear C2
subfunctions
Made C2
tangible
Stage 4 Dowding
(United
Kingdom)
Range and speed
of the aviation
era in full swing
with increasing
battlespace depths
Sophisticated SA
feeds and teams
of controllers
performing C2
subfunctions
form an
adaptive system for
defense
Systematized
feeds and
teams
Stage 5 Boyd
(America)
Computer-based
data management
and the front edge
of the information
age
Transferring
competition
fundamentals into a
system of “insight”
Incorporated
competition
fundamentals
Stage 6 Uncertain Network-centric
C2 operations and
cyber warfare
Uncertain Uncertain

37
APPENDIX B - Generic AOC Organization
Figure 3 - Generic AOC Organization
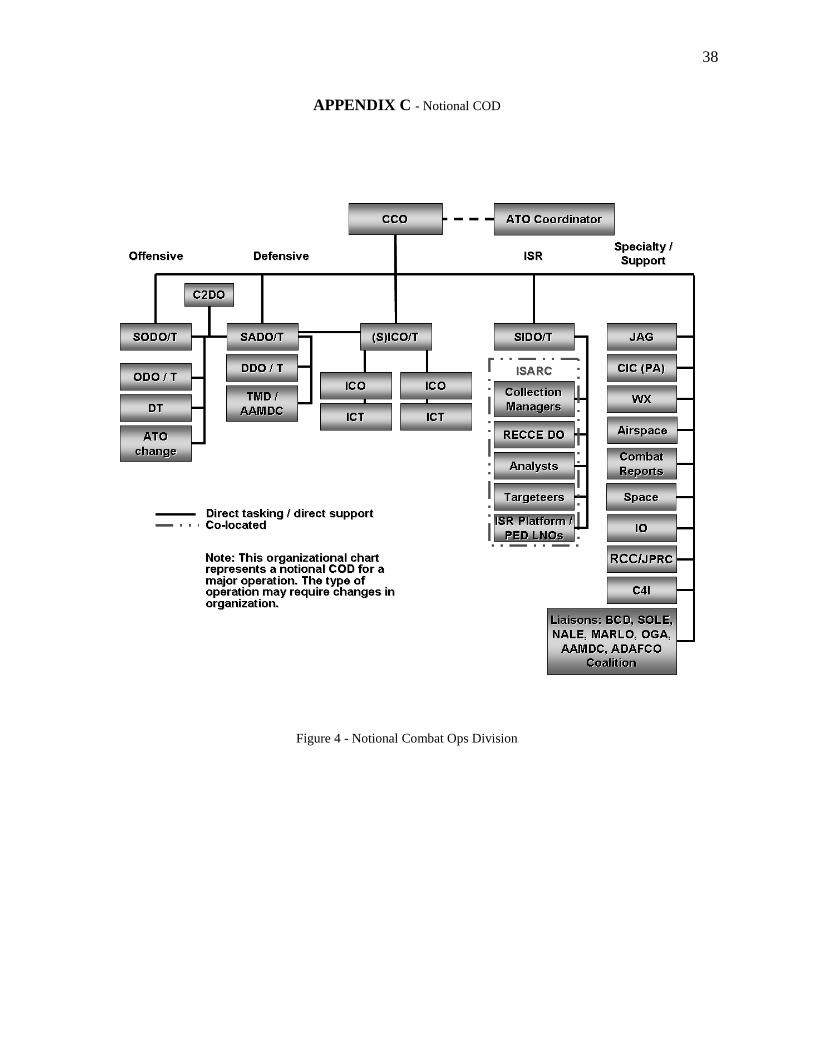
38
APPENDIX C - Notional COD
Figure 4 - Notional Combat Ops Division
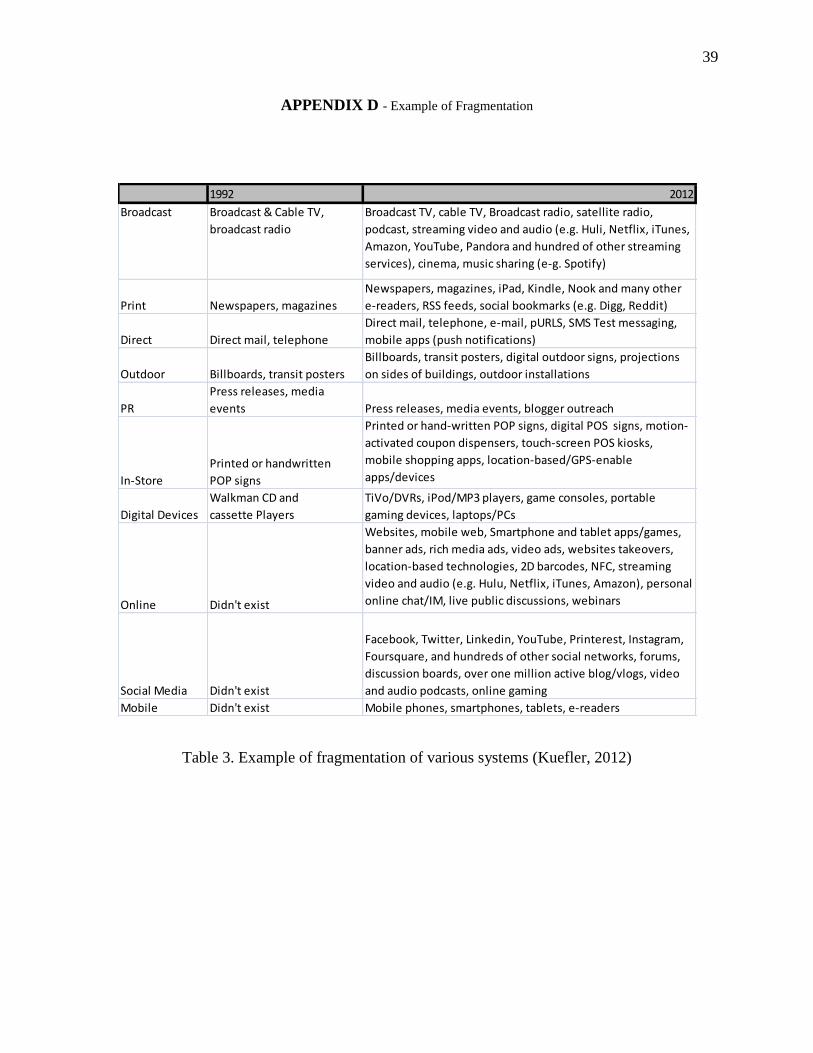
39
APPENDIX D - Example of Fragmentation
Table 3. Example of fragmentation of various systems (Kuefler, 2012)
1992 2012
Broadcast Broadcast & Cable TV,
broadcast radio
Broadcast TV, cable TV, Broadcast radio, satellite radio,
podcast, streaming video and audio (e.g. Huli, Netflix, iTunes,
Amazon, YouTube, Pandora and hundred of other streaming
services), cinema, music sharing (e-g. Spotify)
Print Newspapers, magazines
Newspapers, magazines, iPad, Kindle, Nook and many other
e-readers, RSS feeds, social bookmarks (e.g. Digg, Reddit)
Direct Direct mail, telephone
Direct mail, telephone, e-mail, pURLS, SMS Test messaging,
mobile apps (push notifications)
Outdoor Billboards, transit posters
Billboards, transit posters, digital outdoor signs, projections
on sides of buildings, outdoor installations
PR
Press releases, media
events Press releases, media events, blogger outreach
In-Store
Printed or handwritten
POP signs
Printed or hand-written POP signs, digital POS signs, motion-
activated coupon dispensers, touch-screen POS kiosks,
mobile shopping apps, location-based/GPS-enable
apps/devices
Digital Devices
Walkman CD and
cassette Players
TiVo/DVRs, iPod/MP3 players, game consoles, portable
gaming devices, laptops/PCs
Online Didn't exist
Websites, mobile web, Smartphone and tablet apps/games,
banner ads, rich media ads, video ads, websites takeovers,
location-based technologies, 2D barcodes, NFC, streaming
video and audio (e.g. Hulu, Netflix, iTunes, Amazon), personal
online chat/IM, live public discussions, webinars
Social Media Didn't exist
Facebook, Twitter, Linkedin, YouTube, Printerest, Instagram,
Foursquare, and hundreds of other social networks, forums,
discussion boards, over one million active blog/vlogs, video
and audio podcasts, online gaming
Mobile Didn't exist Mobile phones, smartphones, tablets, e-readers

40
APPENDIX E- Interwoven Situational Awareness
Figure 5 - Modification of Sonnenwald & Pierce. Interwoven Situational Awareness

41
APPENDIX F - Network Diagram
Figure 6 - An example of a network diagram (Modification of Hanneman & Riddle).

42
APPENDIX G - Network Matrix
Figure 7 - An example of a network matrix (Modification of Hanneman & Riddle).
1 2 3 4 5 6 7 8 9 10
1 0 1 0 0 1 0 1 0 1 0
2 1 0 1 1 1 0 1 1 1 0
3 0 1 0 1 1 1 1 0 0 1
4 1 1 0 0 1 0 1 0 0 0
5 1 1 1 1 0 0 1 1 1 1
6 0 0 1 0 0 0 1 0 1 0
7 0 1 0 1 1 0 0 0 0 0
8 1 1 0 1 1 0 1 0 1 0
9 0 1 0 0 1 0 1 0 0 0
10 1 1 1 0 1 0 1 0 0 0
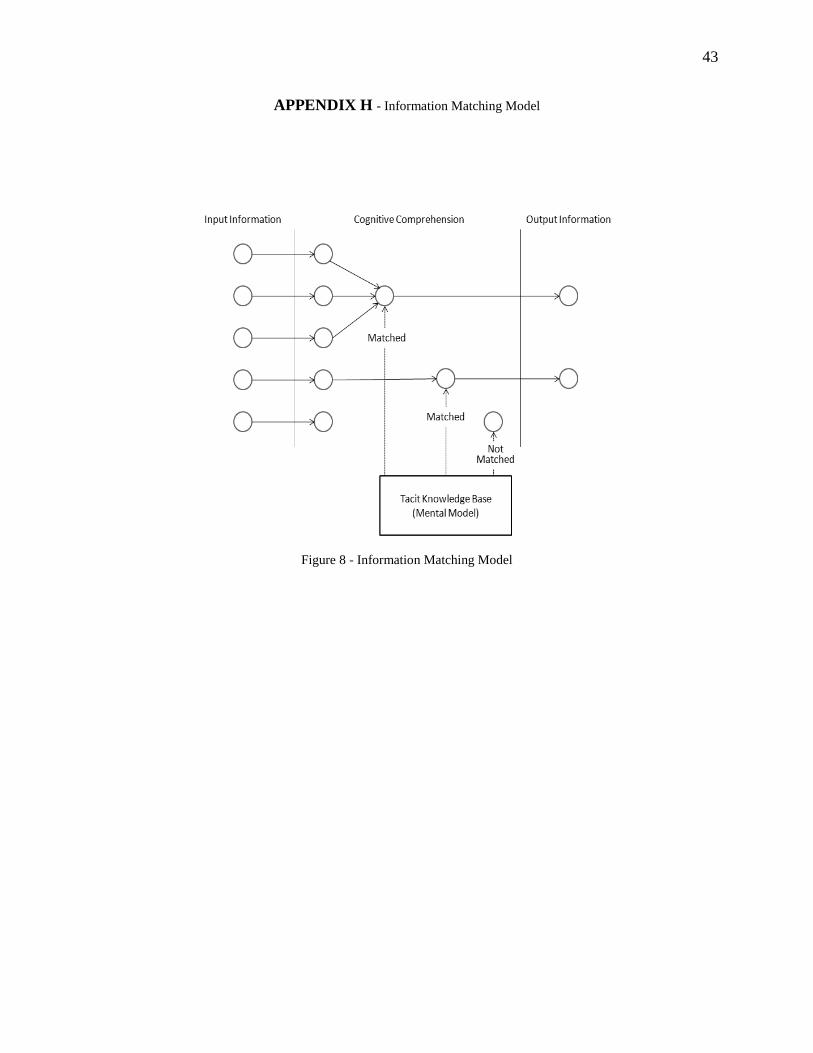
43
APPENDIX H - Information Matching Model
Figure 8 - Information Matching Model

44
APPENDIX I - Measures of Social Networking
Traditional Measures of Social Networking
To understand networks well, the community uses a common set of measurements. Key terms include:
Distance - in a network dij between two nodes (dyads), labeled i and j respectively, is defined as the number
of edges along the shortest path connecting them.
Diameter- the diameter (often described with the term “D”) of a network is the maximal distance among all
distances between any dyads in the network.
Average path length- the average path length “L” of the network is the mean distance between two dyads,
averaged over all pairs of nodes.
Characteristic Path Length (CPL) - the median of the average distance from each node to every other node
in the network, CPL is useful in determining the diffusion rate of the network; the shorter the CPL, the quicker
the information transfers throughout the network. In a social network, for instance, L is the average number of
people existing in the shortest chain connecting two friends. I should note the average path lengths of most real
complex networks are relatively small.
Density – this is the proportion of observed relationships among all possible ties, edges, or the
interconnectedness of a network. A higher density score reflects more ties, which one may interpret as a more
coordinated network with more opportunities for sharing of information and resources among network partners.
Clustering Coefficient--helps describe the clustering of the network. The clustering coefficient, C, is the
average fraction of pairs of neighbors of a node that are also neighbors of each other. Suppose that a node, i, in
the network Ki has edges and they connect this node to other Ki nodes. These nodes are all neighbors of node i.
At most Ki (Ki -1)/2 edges can exist among them, and this only occurs when every neighbor of node i is
connected to every other neighbor of node i. The clustering coefficient Ci of node i is then defined as the ratio
between the number of edges Ei that actually exist among these nodes Ki and the total possible number Ki (Ki -
1)/2, namely, Ci = 2Ei / Ki (Ki -1). The clustering coefficient C of the whole network is the average of Ci over
all i. If and only if the network is globally coupled, which means that every node in the network connects to
every other node, then Ci = 1. Most large-scale real networks have a tendency toward clustering, in the sense
that their clustering coefficients are much greater than 0, although they are still significantly less than one
(namely, far away from being globally connected).
Reciprocity – while density simply measures whether or not a relational tie exists, reciprocity measures the
direction and strength of that tie. For example, A nominates B as a partner with whom they have a strong
relationship, and B may also nominate A as a partner with a strong relationship, indicating reciprocity.
Conversely, B may not have the same view of the relationship and gives a lower rating or does not acknowledge
a relationship with A. If they rate each other similarly, then they will have a high reciprocity score. Scores for
this measure are proportions that range between 0 and 1, which are expressed as percentages in this report.
Indegree Centrality – actors who have more ties have more opportunities because they have more access to
network resources. Indegree centrality is the number of ties an actor has ‘in-coming’ from other actors. These
incoming ties indicate network partners who are seeking a connection with the actor and therefore represent an
actor’s importance in a particular area.
Neutrality rating – a measurement of the amount of additional latent structure in a complex network. This
additional latent structure, where properly configured, is the source of networked effects, adaptability, and
modularity in complex networks.
Nucleus – a region of a social network with the highest concentration of links between nodes.
Fringe – a region of a social network with a low concentration of links between nodes.
Betweenness Centrality – betweenness is a common measure for diffusion of information in a network and
denotes an actor’s value in communication. An actor with a high score lies between other actors and provides

45
the shortest path between those other actors. If an actor with a high betweenness centrality were removed from
the network, it would hinder communication between the remaining actors.

46
APPENDIX J - Sommerhoff five variables
Current AOC organizational realities contain (1) a high degree of technological complexity to manage
massive amounts of data, (2) non-linear, knowledge-intensive work, (3) changing battlespace influencing work
system effectiveness, and (4) turbulent mission requirements. This predicament is a result of the AOC attempt to
monitor and control everything within a complex system scattered over thousands to hundreds of thousands of
square miles. Therefore, Air Power reality has many open-system characteristics.
Sommerhoff (1950) specifies five variables that can represent the macro air power system:
Figure 9 - Modification of Sommerhoff's Five Variables, Summerhoff, G. (1950).
(1) where Z is all events that may occur—intended, untended, some good, some bad (Set Z in Ashby’s (1967)
reformulation in terms of set theory.);
(2) the set G, a sub-set of Z, consisting of ‘good’ events, those that one perceives will result in favorable
outcomes;
(3) the set R of events in the AOC and the resulting outputs;
(4) the set S of events in the rest of the open system, which is reality (e.g., position of aircraft and amount of
fuel in their tanks);
(5) the set D of primary disturbers (Sommerhoff’s ‘coenetic variable’); those that cause the events in the
system S, tend to drive the outcomes out of G: (e.g. weather, higher headquarters, emergencies); and
(6) this formulation has withstood 60 years’ scrutiny and covers a majority of cases. It is also rigorous (Ashby,
1967) and each value (Figure 12) evokes the next:
ǿ : D→S (5)
ρ: D→R (6)
ψ : S × R→Z (7)
then ‘R’ is a good regulator (for goal G, given D, etc., ǿ and ψ)’ is equivalent to
ρ ⊂ [ψ-1
(G )]ǿ. (8)
to which I must add the obvious condition that
ρρ-1
⊂ 1 ⊂ ρ-1
ρ (9)
to ensure that ρ is an actual mapping, and not the empty set. In addition, there is no restriction to laniary.
The criterion of success of the AOC is not whether the outcome, after each interaction of S and R, is
somewhere within G, but whether the outcomes, on some numerical scale, have a root-mean-square vectoring
toward zero.

47
APPENDIX K - Architecture of STOs
Figure 10 - The architecture of STOs (Modification of Joslyn and Rocha).
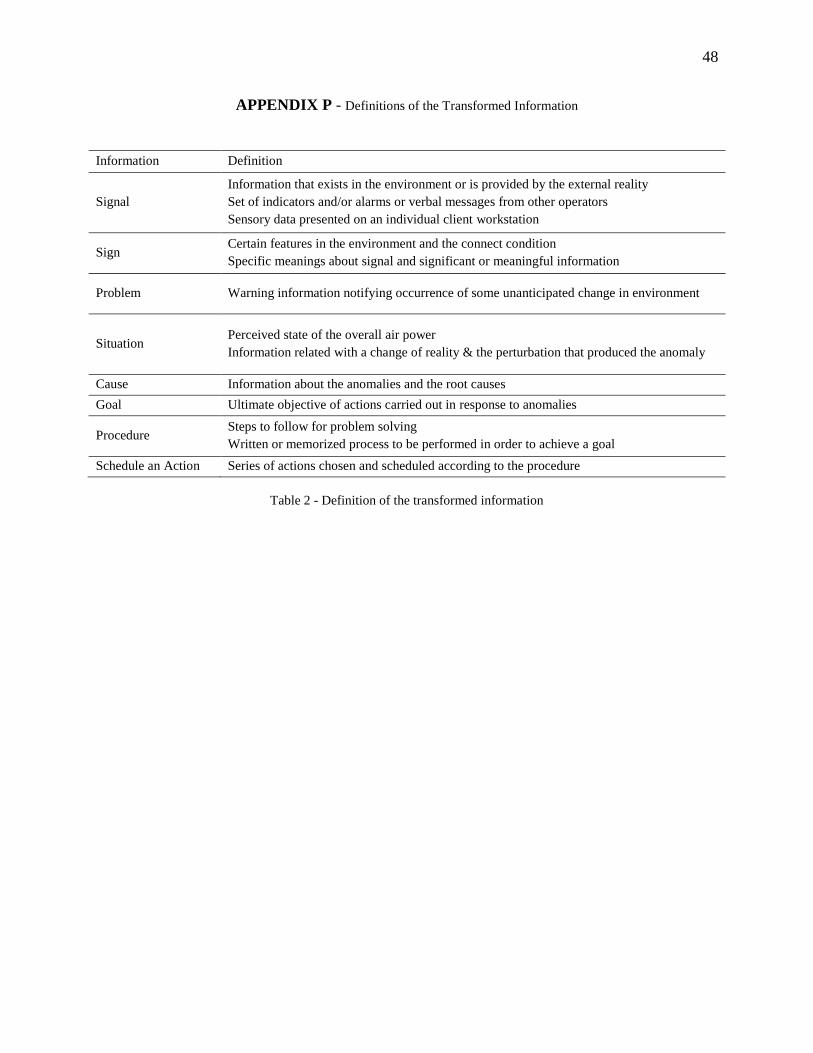
48
APPENDIX P - Definitions of the Transformed Information
Information Definition
Signal
Information that exists in the environment or is provided by the external reality
Set of indicators and/or alarms or verbal messages from other operators
Sensory data presented on an individual client workstation
Sign Certain features in the environment and the connect condition
Specific meanings about signal and significant or meaningful information
Problem Warning information notifying occurrence of some unanticipated change in environment
Situation Perceived state of the overall air power
Information related with a change of reality & the perturbation that produced the anomaly
Cause Information about the anomalies and the root causes
Goal Ultimate objective of actions carried out in response to anomalies
Procedure Steps to follow for problem solving
Written or memorized process to be performed in order to achieve a goal
Schedule an Action Series of actions chosen and scheduled according to the procedure
Table 2 - Definition of the transformed information

49
APPENDIX Q –Configuration Files
Figure 11 - ELICIT Configuration file Screen

50
APPENDIX R – Information Model
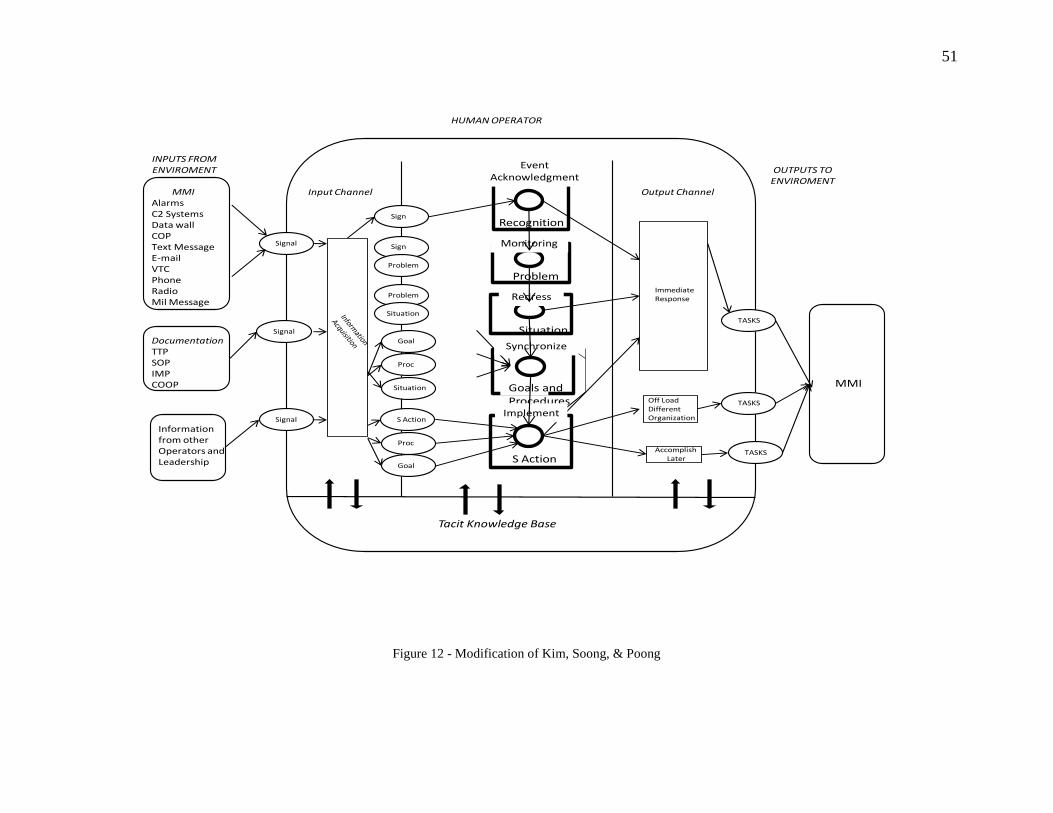
51
Tacit Knowledge Base
MMI
Output Channel
OUTPUTS TOENVIROMENT
Input Channel
ImmediateResponse
TASKS
TASKS
TASKS
Off LoadDifferent Organization
AccomplishLater
Signal
Information from otherOperators andLeadership
INPUTS FROMENVIROMENT
Signal
Signal
DocumentationTTPSOPIMPCOOP
MMIAlarmsC2 SystemsData wallCOPText MessageE-mailVTCPhoneRadioMil Message
Sign
S Action
Proc
Goal
Goal
Proc
Situation
Problem
Situation
Sign
Problem
Working Memory
Recognition
EventAcknowledgment
Problem
Monitoring
Situation
Redress
Goals and Procedures
Synchronize
S Action
Implement
HUMAN OPERATOR
Figure 12 - Modification of Kim, Soong, & Poong

52
APPENDIX S- ELICIT Configuration File
The configuration file is in .csv (comma-delimited) format, which means that the value in each field is separated
with a comma or similar marker. In the ELICIT configuration files, the fields are separated with a vertical bar (|).
A key at the top of the file explains data within. For example, in the organizational file:
n|Role|team|Country|1|2|3|…17|Web site1| Web site2| Web site3| Web site4
beginning on line 5 with the player number, a team member identity, and a country label for that player (if a code of
<country*> is supplied, then the nth entry in the country table specified for the experiment trial is used). The table is
completed with a series of numeral 1’s with a single 0, which is sequentially arrayed across the grid. If there is a 1 in the first
player position, then the player associated with the row can share with the first player. If there is a 0 in the 5th player
position, then the player associated with the row cannot share with the 5th player. In a traditional ELICIT construction, if
there is a 1 in a Web site column, then the player associated with that row can access the Web site. If there is a 0 in a Web
site column, then the player associated with that row cannot access the Web site.
For this case study ELICIT has been modified to allow read (R), write (1), and no access (0) to the various Web pages. In the
following example, the organization file is the ELICIT baseline C2-17.csv (the 17-playerconfiguration file for a C2
organization). In this organization type, the Cross-Team Coordinator and four Team Leaders (who coordinate who, what,
when, and where information), have different access privileges to the Web sites. The Cross-Team Coordinator can access all
four Web sites. The remaining 16 players each can access only one Web site. Line 22 assigns these players to group B, the
C2 organization. The final lines list the names of the Web sites.
n|Role|Team|Country|1|2|3|4|5|6|7|8|9|10|11|12|13|14|15|16|17|website1|
website2|website3|website4|
<begin actual table>
1|Cross Team Coordinator |0|1|1|1|1|1|1|1|1|1|1|1|1|1|1|1|1|1|1|1|1|
2|Team leader|Who|<country1> |1|0|1|1|1|1|1|1|1|1|1|1|1|1|1|1|1|1|0|0|0|
3|Team leader|what|<country2> |1|1|0|1|1|1|1|1|1|1|1|1|1|1|1|1|1|0|1|0|0|
4|Team leader|where|<country3> |1|1|1|0|1|1|1|1|1|1|1|1|1|1|1|1|1|0|0|1|0|
5|Team leader|when|<country4 |1|1|1|1|0|1|1|1|1|1|1|1|1|1|1|1|1|0|0|0|1|
6|Team member|Who|<country1> |1|1|1|1|1|0|1|1|1|1|1|1|1|1|1|1|1|1|0|0|0|
7|Team member|Who|<country1> |1|1|1|1|1|1|0|1|1|1|1|1|1|1|1|1|1|1|0|0|0|
8|Team member|who|<country1> |1|1|1|1|1|1|1|0|1|1|1|1|1|1|1|1|1|1|0|0|0|
9|Team member|what|<country2> |1|1|1|1|1|1|1|1|0|1|1|1|1|1|1|1|1|0|1|0|0|
10|Team member|what|<country2> |1|1|1|1|1|1|1|1|1|0|1|1|1|1|1|1|1|0|1|0|0|
11|Team member|what|<country2> |1|1|1|1|1|1|1|1|1|1|0|1|1|1|1|1|1|0|1|0|0|
12|Team member|where|<country3> |1|1|1|1|1|1|1|1|1|1|1|0|1|1|1|1|1|0|0|1|0|
13|Team member|where|<country3> |1|1|1|1|1|1|1|1|1|1|1|1|0|1|1|1|1|0|0|1|0|
14|Team member|where|<country3> |1|1|1|1|1|1|1|1|1|1|1|1|1|0|1|1|1|0|0|1|0|
15|Team member|when|<country4> |1|1|1|1|1|1|1|1|1|1|1|1|1|1|0|1|1|0|0|0|1|
16|Team member|when|<ountry4> |1|1|1|1|1|1|1|1|1|1|1|1|1|1|1|0|1|0|0|0|1|
17|Team member|when|<country4> |1|1|1|1|1|1|1|1|1|1|1|1|1|1|1|1|0|0|0|0|1|
For the case study, I manipulated system fragmentation by increasing the number of websites in a stepwise manner.
The following are the configuration file headers for the case study. The corresponding table and .csv files have been
created at the execution of the case study.
How to read tables:
n|Role|Team|Country|1|2|3|4|5|6|7|8|9|10|11|12|13|14|15|16|17|18|19|20|21|22|23|24|25|26|27|28|website1|website2|website3|we
bsite4|Website5|website6|website7|website8|website9|website10|
The configuration Table was modified to increase system fragmentation in a 3-step process.
First .csv file header row is as follows:

53
n|Role|Team|Country|1|2|3|4|5|6|7|8|9|10|11|12|13|14|15|16|17|18|19|20|21|22|23|24|25|26|27|28|
JFCwebsite1|JFACCwebsite1|CRCwebsite1|WOCwebsite1|ASOCWebsite1|CORPwebsite1|SOCwebsite1|Fleetwebsite1|TA
CCwebsite1|C-CPwebsite1|
Second header row was:
n|Role|Team|Country|1|2|3|4|5|6|7|8|9|10|11|12|13|14|15|16|17|18|19|20|21|22|23|24|25|26|27|28|
JFCwebsite1|JFCwebsite2|JFACCwebsite1|JFACCwebsite2|CRCwebsite1|CRCwebsite2|WOCwebsite1|WOCwebsite2|ASO
CWebsite1|ASOCWebsite2|CORPwebsite1|CORPwebsite2|SOCwebsite1| SOCwebsite2|Fleetwebsite1|
Fleetwebsite2|TACCwebsite1| TACCwebsite2|C-CPwebsite1| C-CPwebsite2|
Third header row is:
n|Role|Team|Country|1|2|3|4|5|6|7|8|9|10|11|12|13|14|15|16|17|18|19|20|21|22|23|24|25|26|27|28|
JFCwebsite1|JFCwebsite2|JFCwebsite3|JFACCwebsite1|JFACCwebsite2|JFACCwebsite3|CRCwebsite1|CRCwebsite2|CRC
website3|WOCwebsite1|WOCwebsite2|WOCwebsite3|ASOCWebsite1|ASOCWebsite2|ASOCWebsite3|CORPwebsite1|COR
Pwebsite2|CORPwebsite3|SOCwebsite1| SOCwebsite2| SOCwebsite3|Fleetwebsite1| Fleetwebsite2|
Fleetwebsite3|TACCwebsite1| TACCwebsite2| TACCwebsite3|C-CPwebsite1| C-CPwebsite2| C-CPwebsite3|

54
APPENDIX T – C2 Variables
Table 3 - C2 Variables
Category Variable Description
Social Interactions Activity Average number of interactions (i.e.,
total shares, posts and pulls) per
subject.
Social Average Network Reach Network reach measures the
percentage of subjects that a specific
subject interacted with.
The average network reach is the
average value
across all organizations and is
measured here as a
percentage.
Information Interactions Activity Average number of interactions (i.e.,
total shares, posts and pulls) per
subject.
Information Relevant Information Reached
(average and per key role)
Relevant conclusion reached:
- average amount and percentage
across both
organizations
- amount per key role (JFC, JFACC,
CCO)
Information Shared Relevant Information Amount of relevant factoids
accessible by all subjects. Measured
as number and percentage of
factoids.
Measure of Merit (Mission) Effectiveness Measures the degree of effectiveness
of the organization, based on the C2
approach (Nominal, Edge)
Measure of Merit (Mission) Time Efficiency Measures the efficiency of the
organization when using time as
indication of cost.
Measure of Merit (Mission) Effort Efficiency Measures the efficiency of the
organization when using effort as
indication of cost.
Measure of Merit Maximum Timeliness The time to first correct and
complete identification by any
participant relative to the time
available (Alberts, 2011).
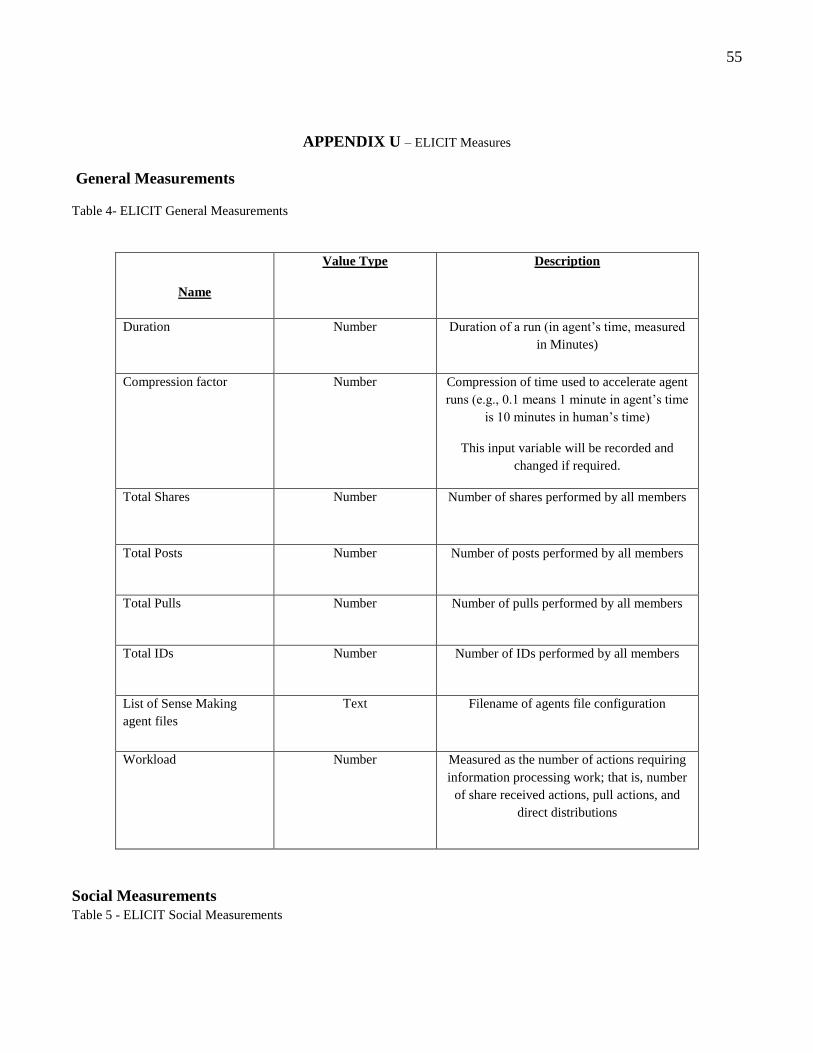
55
APPENDIX U – ELICIT Measures
General Measurements
Table 4- ELICIT General Measurements
Name
Value Type Description
Duration Number Duration of a run (in agent’s time, measured
in Minutes)
Compression factor Number Compression of time used to accelerate agent
runs (e.g., 0.1 means 1 minute in agent’s time
is 10 minutes in human’s time)
This input variable will be recorded and
changed if required.
Total Shares Number Number of shares performed by all members
Total Posts Number Number of posts performed by all members
Total Pulls Number Number of pulls performed by all members
Total IDs Number Number of IDs performed by all members
List of Sense Making
agent files
Text Filename of agents file configuration
Workload Number Measured as the number of actions requiring
information processing work; that is, number
of share received actions, pull actions, and
direct distributions
Social Measurements
Table 5 - ELICIT Social Measurements
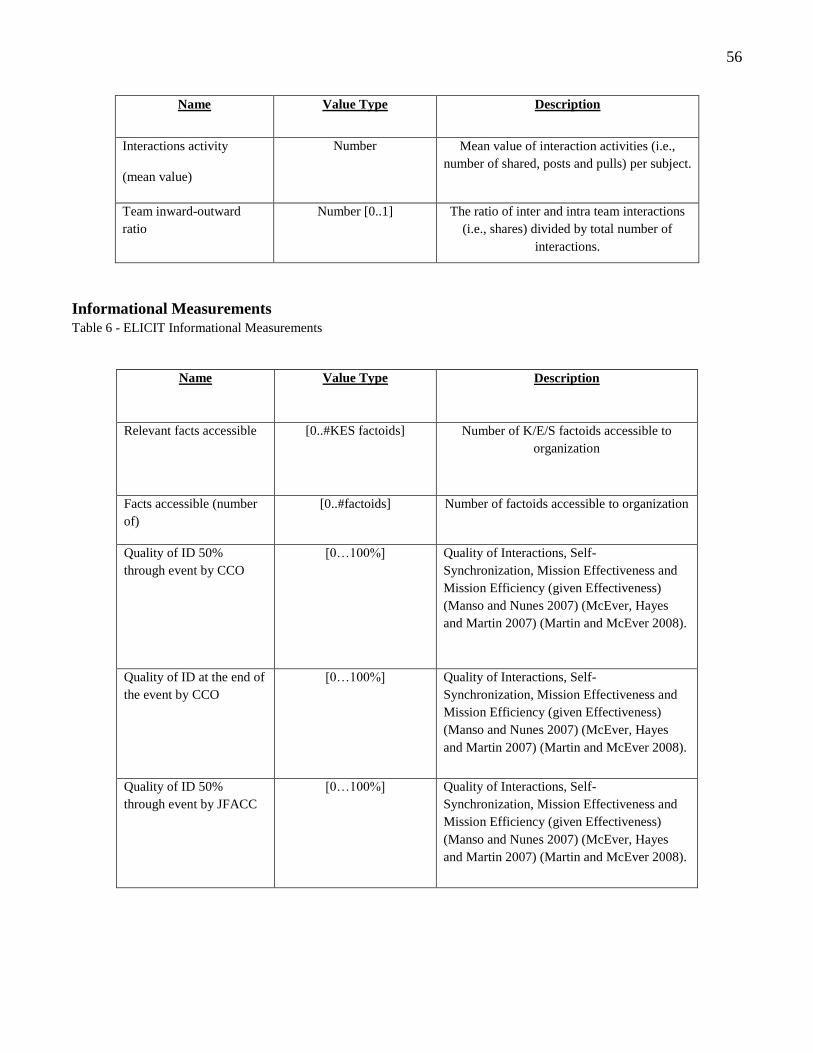
56
Name Value Type Description
Interactions activity
(mean value)
Number Mean value of interaction activities (i.e.,
number of shared, posts and pulls) per subject.
Team inward-outward
ratio
Number [0..1] The ratio of inter and intra team interactions
(i.e., shares) divided by total number of
interactions.
Informational Measurements
Table 6 - ELICIT Informational Measurements
Name Value Type Description
Relevant facts accessible [0..#KES factoids] Number of K/E/S factoids accessible to
organization
Facts accessible (number
of)
[0..#factoids] Number of factoids accessible to organization
Quality of ID 50%
through event by CCO
[0…100%]
Quality of Interactions, Self-
Synchronization, Mission Effectiveness and
Mission Efficiency (given Effectiveness)
(Manso and Nunes 2007) (McEver, Hayes
and Martin 2007) (Martin and McEver 2008).
Quality of ID at the end of
the event by CCO
[0…100%]
Quality of Interactions, Self-
Synchronization, Mission Effectiveness and
Mission Efficiency (given Effectiveness)
(Manso and Nunes 2007) (McEver, Hayes
and Martin 2007) (Martin and McEver 2008).
Quality of ID 50%
through event by JFACC
[0…100%]
Quality of Interactions, Self-
Synchronization, Mission Effectiveness and
Mission Efficiency (given Effectiveness)
(Manso and Nunes 2007) (McEver, Hayes
and Martin 2007) (Martin and McEver 2008).

57
Quality of ID at the end of
the event by JFACC
[0…100%]
Quality of Interactions, Self-
Synchronization, Mission Effectiveness and
Mission Efficiency (given Effectiveness)
(Manso and Nunes 2007) (McEver, Hayes
and Martin 2007) (Martin and McEver 2008).
Quality of ID 50%
through event by JFC
[0…100%]
Quality of Interactions, Self-
Synchronization, Mission Effectiveness and
Mission Efficiency (given Effectiveness)
(Manso and Nunes 2007) (McEver, Hayes
and Martin 2007) (Martin and McEver 2008).
Quality of ID at the end of
the event by JFACC
[0…100%]
Quality of Interactions, Self-
Synchronization, Mission Effectiveness and
Mission Efficiency (given Effectiveness)
(Manso and Nunes 2007) (McEver, Hayes
and Martin 2007) (Martin and McEver 2008).
Shared Awareness Critical Measurements
Table 7 - ELICIT Shared Awareness Critical Measurements
Name Value Type Description
Number of Partially
Correct IDs
[0..4 * nbrSubjects Number of partially correct identifications
provided by subjects
Time of First Correct ID Number The time to first correct and complete
identification by any participant
CSSync (Cognitive Self-
Synchronization)
Number [0..1] Cognitive self-synchronization value (Marco
& Moffat, 2011)
CSSync Uncertainty Number [0..1] Uncertainty measurement associated with
CSSync (Marco & Moffat, 2011)

58
APPENDIX U1 - ELICIT Runs
These quantitative numbers were acquired during 18 different model runs as defined in the following table:
Table 8 - Nominal C2 and Edge C2 Runs
Nominal C2 Edge C2
1X System Fragmentation 1X System Fragmentation
2X System Fragmentation 2X System Fragmentation
3X System Fragmentation
No Noise
3X System Fragmentation
No Noise
50% Noise 50% Noise
66% Noise 66% Noise
75% Noise 75% Noise
1X System Fragmentation + 50% Noise
(Best Case)
1X System Fragmentation + 50% Noise
(Best Case)
3X System Fragmentation + 75% Noise
(Worst Case)
3X System Fragmentation + 75% Noise
(Worst Case)

59
APPENDIX V- ELICIT Edge and Nominal Organizations
Figure 13 - Edge organization structure
The following visual depiction of the same Edge organization:

60
Figure 14 - Visual depiction of Edge Organization Structure
Table 9 - Edge Organization Results
Graph Type Undirected
Vertices 28
Unique Edges 1
Edges With Duplicates 783
Total Edges 784
Self-Loops 1
Nominal organization structure results are (each 1 represents possible communication path):
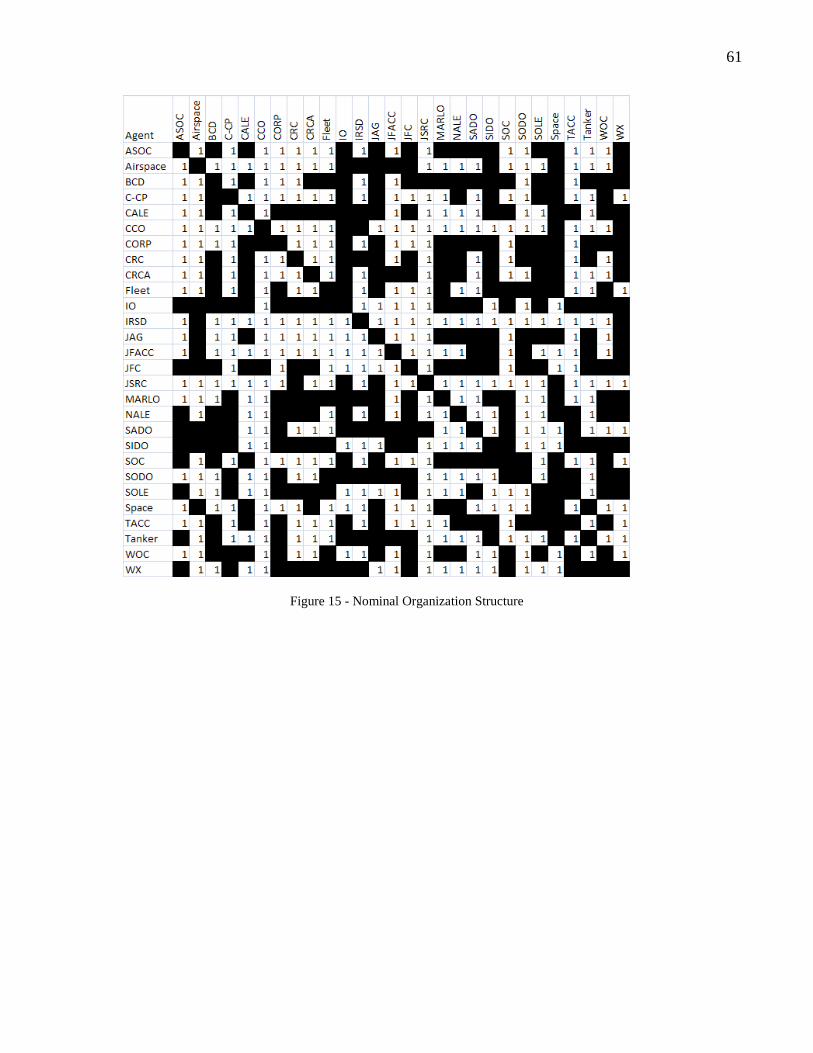
61
Figure 15 - Nominal Organization Structure

62
Figure 16 Visual depiction of Nominal Organization Structure
Table 10 - Nominal Organization Results
Graph Type Undirected
Vertices 28
Unique Edges 85
Edges With Duplicates 352
Total Edges 437
Self-Loops 0

63
APPENDIX W- Elicit Analysis Tool Output Example
1X System Fragmentation Edge as compared to Nominal
Edge:
Figure 17 - Edge 1X System Fragmentation (number of correct ID's)
Nominal:
Figure 18 - Nominal 1X System Fragmentation (Number of correct IDs)

64
Edge and Nominal organizations both find the final solution, but a nominal construct tends for more individuals to determine
the “moving” solution earlier.
Edge:
Figure 19 - Edge 1X System Fragmentation (Quality of ID's)
Nominal
Figure 20- Nominal 1X System Fragmentation (Quality of IDs)

65
Figure 21 - ELICIT Analysis tool Color Definition
(Color definitions)
Using Quality of ID as a yardstick, the Edge organization tends for some individuals to have better understanding early, but
the nominal organization tends to have closer group understanding.
Edge:
Figure 22 - Edge 1X System Fragmentation (Self Synchronization (cognitive))

66
Nominal:
Figure 23 - Nominal 1X System Fragmentation (Self-Synchronization (cognitive))

67
APPENDIX X- Master Data Chart

68
General
Measurements
Name Description Value Type 1X
Syste
m F
rag
men
tati
on
(75%
No
ise)
2X
Syste
m F
rag
men
tati
on
(75%
No
ise)
3X
Syste
m F
rag
men
tati
on
(75%
No
ise)
0%
No
ise
50%
No
ise
66%
No
ise
75%
No
ise
1X
Syste
m F
rag
men
tati
on
+ 5
0%
No
ise
Best
Cast
3X
Syste
m F
rag
men
tati
on
+ 7
5%
No
ise
Wo
rst
Case
Duration Duration of a run (in agent’s
time, measured in Minutes)
Number
(Run-Info)18m 6.852s 18m 0.937s 18m 9.734s 18m 0.38s 18m 0.536s 18m 1.067s 18m 1.872s 18m 0.536s 18m 9.734s
Compression factor
Compression of time used to
accelerate agent runs (e.g.,
0.1 means 1 minute in agents
time is 10 minutes in human’s
time)
Number
(Run-Config) 0.2 0.2 0.2 0.2 0.2 0.2 0.2 0.2 0.2
Total Shares Number of shares performed
by all members
Number
(Event -Summary)6456 4583 4556 2281 8384 7708 6456 8384 4556
Total Posts Number of posts performed
by all members
Number
(Event -Summary)267 178 258 63 256 267 267 256 258
Total Pulls Number of pulls performed
by all members
Number
(Event -Summary)2503 4838 7662 6318 2996 2784 2524 2996 7662
Total IDs Number of IDs performed
by all members
Number
(Event -Summary)193 185 178 193 164 195 195 164 178
List of Sense Making
agent files
Filename of agents file
configuration
Text
(Run-Config) see Sheet 2see Sheet 2 see Sheet 2 see Sheet 2
Workload
Measured as the number of
actions requiring information
processing work, that is,
number of share received
actions, pull actions and
direct distributions
Number
(Event-Summary-Total)
(all columns except First
Post)
21945 20455 23319 12599 25980 24611 21983 25980 23319
EDGE
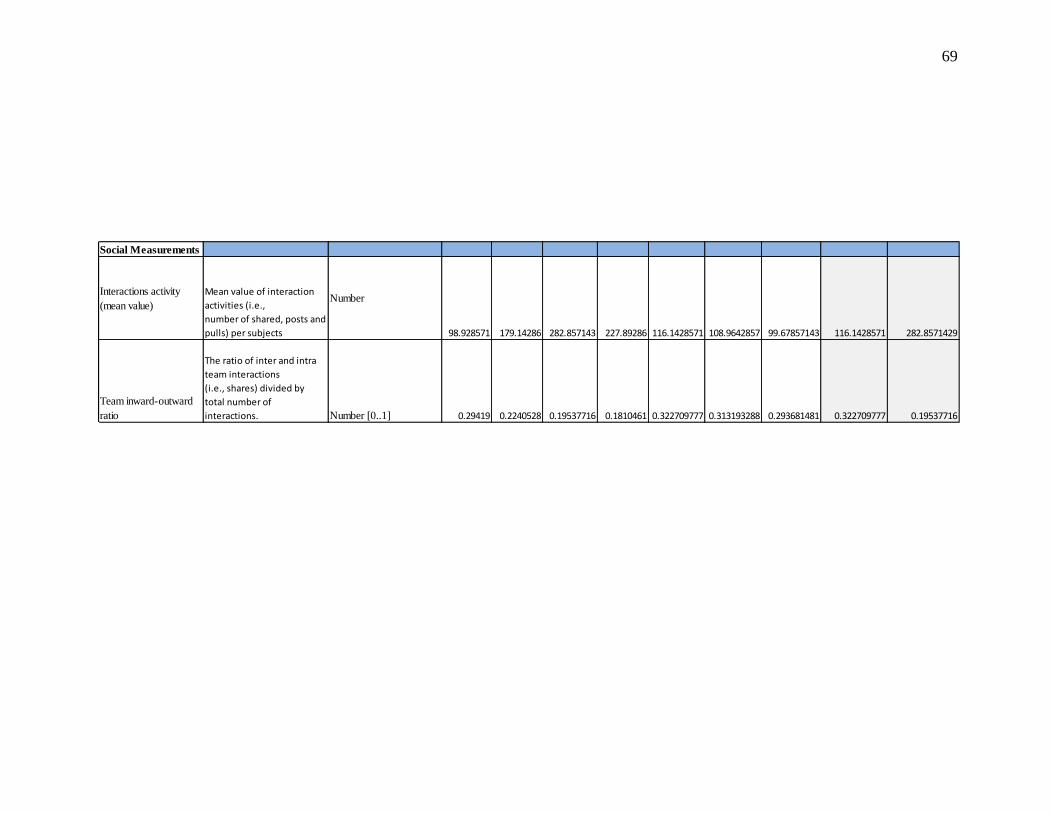
69
Social Measurements
Interactions activity
(mean value)
Mean value of interaction
activities (i.e.,
number of shared, posts and
pulls) per subjects
Number
98.928571 179.14286 282.857143 227.89286 116.1428571 108.9642857 99.67857143 116.1428571 282.8571429
Team inward-outward
ratio
The ratio of inter and intra
team interactions
(i.e., shares) divided by
total number of
interactions. Number [0..1] 0.29419 0.2240528 0.19537716 0.1810461 0.322709777 0.313193288 0.293681481 0.322709777 0.19537716
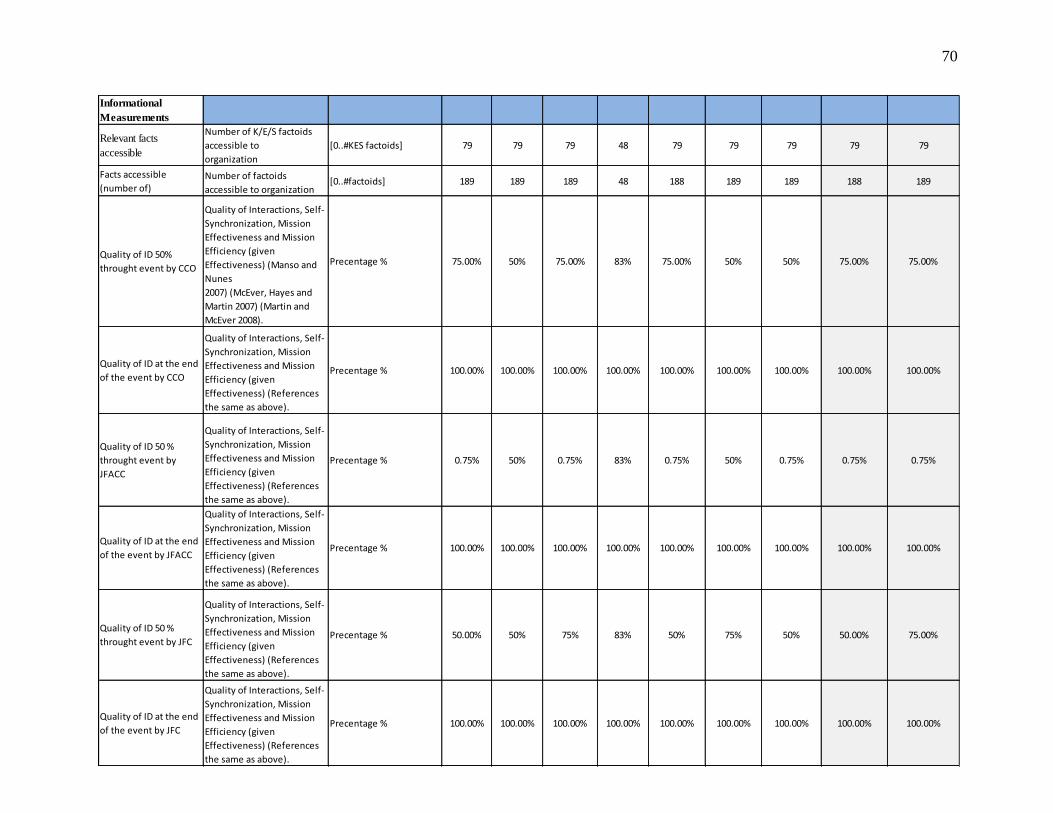
70
Informational
Measurements
Relevant facts
accessible
Number of K/E/S factoids
accessible to
organization
[0..#KES factoids] 79 79 79 48 79 79 79 79 79
Facts accessible
(number of)Number of factoids
accessible to organization[0..#factoids] 189 189 189 48 188 189 189 188 189
Quality of ID 50%
throught event by CCO
Quality of Interactions, Self-
Synchronization, Mission
Effectiveness and Mission
Efficiency (given
Effectiveness) (Manso and
Nunes
2007) (McEver, Hayes and
Martin 2007) (Martin and
McEver 2008).
Precentage % 75.00% 50% 75.00% 83% 75.00% 50% 50% 75.00% 75.00%
Quality of ID at the end
of the event by CCO
Quality of Interactions, Self-
Synchronization, Mission
Effectiveness and Mission
Efficiency (given
Effectiveness) (References
the same as above).
Precentage % 100.00% 100.00% 100.00% 100.00% 100.00% 100.00% 100.00% 100.00% 100.00%
Quality of ID 50 %
throught event by
JFACC
Quality of Interactions, Self-
Synchronization, Mission
Effectiveness and Mission
Efficiency (given
Effectiveness) (References
the same as above).
Precentage % 0.75% 50% 0.75% 83% 0.75% 50% 0.75% 0.75% 0.75%
Quality of ID at the end
of the event by JFACC
Quality of Interactions, Self-
Synchronization, Mission
Effectiveness and Mission
Efficiency (given
Effectiveness) (References
the same as above).
Precentage % 100.00% 100.00% 100.00% 100.00% 100.00% 100.00% 100.00% 100.00% 100.00%
Quality of ID 50 %
throught event by JFC
Quality of Interactions, Self-
Synchronization, Mission
Effectiveness and Mission
Efficiency (given
Effectiveness) (References
the same as above).
Precentage % 50.00% 50% 75% 83% 50% 75% 50% 50.00% 75.00%
Quality of ID at the end
of the event by JFC
Quality of Interactions, Self-
Synchronization, Mission
Effectiveness and Mission
Efficiency (given
Effectiveness) (References
the same as above).
Precentage % 100.00% 100.00% 100.00% 100.00% 100.00% 100.00% 100.00% 100.00% 100.00%

71
Table 11 - Master Data Chart (EDGE)
Shared Awareness
Critical
Measurements
Number of Partially
Correct IDs
Number of partially correct
identifications
provided by subjects
[0..4 * nbrSubjects
(ID-Metrics Details)27.5 27.5 27.5 27.5 27.5 27.5 27.5 27.5 27.5
Time of First Correct ID
The time to first correct and
complete
identification by any
participant.
Number
(ID-Metrics Details) 661.877 637.832 637.832 637.832 637.832 637.832 637.832 637.832 637.832
CSSync (Cognitive Self-
Synchronization) 50%
throught the Event
Cognitive self-
synchronization value
(Marco and Moffat 2011).
Number [0..1] 0.82 0.82 0.82 0.98 0.82 0.82 0.83 0.82 0.82
CSSync Uncertainty 50%
throught Event
Uncertainty measurement
associated with CSSync
(Marco and Moffat 2011).
Number [0..1] 0.16 0.16 0.16 0.00 0.16 0.16 0.61 0.16 0.16
CSSync (Cognitive Self-
Synchronization)
Cognitive self-
synchronization value
(Marco and Moffat 2011).
Number [0..1] 0.98 0.99 0.99 0.98 0.98 0.98 0.98 0.98 0.99
CSSync UncertaintyUncertainty measurement
associated with CSSync
(Marco and Moffat 2011).
Number [0..1] 0.00 0.01 0.01 0.00 0.00 0.00 0.00 0.00 0.01

72
General
Measurements
Name Description Value Type 1X
Syste
m F
rag
men
tati
on
(75%
No
ise)
2X
Syste
m F
rag
men
tati
on
(75%
No
ise)
3X
Syste
m F
rag
men
tati
on
(75%
No
ise)
0%
No
ise
50%
No
ise
66%
No
ise
75%
No
ise
1X
Syste
m F
rag
men
tati
on
+ 5
0%
No
ise B
est
Case
3X
Syste
m F
rag
men
tati
on
+ 7
5%
No
ise W
ors
t C
ase
Duration
Duration of a run (in
agent’s time, measured in
Minutes)
Number
(Run-Info)18m 4.363s18m 12.505s18m 5.322s18m 1.23s 18m 3.010s18m 9.507s18m 5.175s18m 3.010s18m 5.322s
Compression factor
Compression of time used
to accelerate agent runs
(e.g., 0.1 means 1 minute
in agents time is 10 minutes
in human’s time)
Number
(Run-Config) 0.2 0.2 0.2 0.2 0.2 0.2 0.2 0.2 0.2
Total SharesNumber of shares
performed by all members
Number
(Event -Summary)4349 2714 2703 1726 5971 5403 4349 5971 2703
Total PostsNumber of posts
performed by all members
Number
(Event -Summary)267 184 258 63 265 267 267 265 258
Total PullsNumber of pulls performed
by all members
Number
(Event -Summary)2966 8196 11758 6450 3365 3179 2934 3365 11758
Total IDsNumber of IDs performed
by all members
Number
(Event -Summary)194 182 182 183 186 194 189 186 182
List of Sense Making
agent files
Filename of agents file
configuration
Text
(Run-Config)
Workload
Measured as the number
of actions requiring
information processing
work, that is, number of
share received actions, pull
actions and direct
distributions
Number
(Event-Summary-Total)
(all columns except First
Post)
19477 19587 23978 11818 22504 21482 19739 22504 23978
NONIMAL

73
Social Measurements
Interactions activity
(mean value)
Mean value of interaction
activities (i.e.,
number of shared, posts
and pulls) per subjects
Number
115.4643 299.2857 429.1429 232.6071 129.6429 123.0714 114.3214 129.6429 429.1429
Team inward-outward
ratio
The ratio of inter and intra
team interactions
(i.e., shares) divided by
total number of
interactions. Number [0..1] 0.223289 0.138561 0.112728 0.146048 0.265331 0.251513 0.220325 0.265331 0.112728

74
Informational
Measurements
Relevant facts
accessible
Number of K/E/S factoids
accessible to
organization
[0..#KES factoids] 79 79 79 48 79 79 79 79 79
Facts accessible
(number of)Number of factoids
accessible to organization[0..#factoids] 189 189 189 48 189 189 189 189 189
Quality of ID 50%
throught event by CCO
Quality of Interactions,
Self-
Synchronization, Mission
Effectiveness and Mission
Efficiency (given
Effectiveness) (Manso and
Nunes
2007) (McEver, Hayes and
Martin 2007) (Martin and
McEver 2008).
Precentage % 50% 50% 50% 83% 50% 50% 50% 50.00% 50.00%
Quality of ID at the end
of the event by CCO
Quality of Interactions,
Self-
Synchronization, Mission
Effectiveness and Mission
Efficiency (given
Effectiveness)
(References the same as
above).
Precentage % 100.00% 100.00% 100.00% 100.00% 100.00% 100.00% 100.00% 100.00% 100.00%
Quality of ID 50 %
throught event by
JFACC
Quality of Interactions,
Self-
Synchronization, Mission
Effectiveness and Mission
Efficiency (given
Effectiveness)
(References the same as
above).
Precentage % 50% 50% 75% 83% 75% 75% 75% 75.00% 75.00%
Quality of ID at the end
of the event by JFACC
Quality of Interactions,
Self-
Synchronization, Mission
Effectiveness and Mission
Efficiency (given
Effectiveness)
(References the same as
above).
Precentage % 100.00% 83.00% 83.00% 100.00% 100.00% 100.00% 100.00% 100.00% 83.00%
Quality of ID 50 %
throught event by JFC
Quality of Interactions,
Self-
Synchronization, Mission
Effectiveness and Mission
Efficiency (given
Effectiveness)
(References the same as
above).
Precentage % 50% 50% 50% 83% 50% 50% 50% 50.00% 50.00%
Quality of ID at the end
of the event by JFC
Quality of Interactions,
Self-
Synchronization, Mission
Effectiveness and Mission
Efficiency (given
Effectiveness)
(References the same as
above).
Precentage % 100.00% 83.00% 83.00% 100.00% 100.00% 100.00% 100.00% 100.00% 83.00%

75
Table 12 - Master Data Chart (Nominal)
Shared Awareness
Critical
Measurements
Number of Partially
Correct IDs
Number of partially
correct identifications
provided by subjects
[0..4 * nbrSubjects
(ID-Metrics Details)27.5 24.75 24.75 27.5 27.5 27.5 27.5 27.5 24.75
Time of First Correct ID
The time to first correct
and complete
identification by any
participant.
Number
(ID-Metrics Details) 568.974 538.578 509.815 637.832 637.832 637.832 637.832 637.832 509.815
CSSync (Cognitive Self-
Synchronization) 50%
throught the Event
Cognitive self-
synchronization value
(Marco and Moffat 2011).
Number [0..1] 0.82 0.78 0.77 0.91 0.76 0.78 0.76 0.76 0.77
CSSync Uncertainty 50%
throught EventUncertainty measurement
associated with CSSync
(Marco and Moffat 2011).
Number [0..1] 0.16 0.16 0.16 0.05 0.16 0.16 0.16 0.16 0.16
CSSync (Cognitive Self-
Synchronization)
Cognitive self-
synchronization value
(Marco and Moffat 2011).
Number [0..1] 0.98 0.95 0.95 0.98 0.98 0.98 0.98 0.98 0.95
CSSync Uncertainty Uncertainty measurement
associated with CSSync
(Marco and Moffat 2011).
Number [0..1] 0.00 0.01 0.01 0.00 0.00 0.00 0.00 0.00 0.01

76
APPENDIX Y – Limitation/Delimitation of the Study
Limitations of the Study
Limitations of a study are the factors the researcher cannot control. Three factors limit this case study: (1)
the core design of ELICIT; (2) the associated data collection tool; and (3) the data analysis tools. The baseline
ELICIT task (Ruddy, 2007) is an intelligence task. Periodically during an experiment, ELICIT distributes factoids
(i.e., information elements that are pieces of the scenario) to the participants. Participants can choose to disseminate
or not disseminate factoids to others by ‘sharing’ (symmetric data movement) information directly with a particular
participant or by ‘posting’ (asymmetric data movement) a factoid to a particular information system. However, only
by communicating information can participants achieve sufficient levels of awareness to complete the task.
The four original baseline factoid sets each contain 68 factoids (four for each of the 17 participants). These
factoids contain only true information. There is no incorrect or conflicting information.
Each baseline factoid set consists of 17 Key or Expertise, 17 Supportive, and 34 Noise factoids. Thus, the
ratio of relevant information to noise is 50%. In the baseline factoid set, ELICIT distributes the factoids in three
waves. Thus it is not until after that third wave that all the information is available to the participant group to fully
identify the ‘who, what, where and when’ of the adversary attack. The factoids are evenly distributed so that by the
end of the third distribution, each participant has received one Key or Expertise factoid, one supportive factoid, and
two noise factoids. For purposes of the original experiment design, I took care to treat each participant equally. The
factoid scenarios are anonymized to reduce distractions based on previous experiences.
We mapped the access matrix of each group to each information system website and instantiated them in an
ELICIT organization configuration file (See Appendix D). Since some of the systems are ‘read-only’ with respect
to some of the groups, We worked to enhanced the ELICIT organization file structure to support read-only access.
We also configured this organization file to reflect whether point-to-point sharing was possible between the groups.
WE created variations on this structure to determine the efficiency and effectiveness of various intergroup process
flows and procedures.
In addition to creating a new organization file, we also worked with ELICIT to created a new task scenario.
I created a total of 51 Key and Expertise factoids, and mapped their order of precedence into seven sequential waves
of information flow. In addition, we also created and mapped supportive and noise factoids. The operations factoid
set is listed in Appendix D.
‘What’ data made available to the researcher is predetermined by ELICIT. As with any modeling and
simulation base research, it is assumed the model is correctly coded and output data is what the researcher desires.
ELICIT has developed an analysis tool to help the researcher sort through all resulting data. Both available analysis
tools lack complete documentation, and it assumes all columns, rows, buttons, pull-downs and other functions listed
correspond to a common/obvious definition of term supplied by creator of the applications.
Delimitations of the Study
Delimitations are factors of a study the researcher can control. The nature of this air power model based C2
case study may limit its generalizability. The following four delimitations bind this study:
1). This study will consist of only one model, the number of agents will be static, their interactions will be
scripted, and the outcome decision is known as it is provided. Information derived from the study may not be
capable of direct extrapolation to an actual AOC.
2) The rational human actor does not exist in the real world, and how actual combat decisions are made is
well beyond the scope of this paper. Therefore, I made a limiting assumption to assume shared understanding (a
measurable quantity) was equivalent to a decision.
3) The fundamental approach I took in this C2 effort is to map organizations interacting with the AOC to
ELICIT participants and to model the key information flows between these groups as text base word strings.
Required changes are categorized into configuration changes and coding changes. Only 28 groups are identified as

77
related to the AOC Air Tasking Order change operation. In addition, I identified owners of only ten shared
information points (webpages) (asymmetric data holding sites).
Next, we configured 28 ELICIT software agents to represent each of the 28 groups’ collective behaviors
with respect to information flows with the other groups. For example, when a decision is made that a target should
not be hit, the target is added to the no hit target list system. As is typically done with ELICIT agents, their actions
were configured with a series of task process delays so that the time the agent takes to perform a task is mapped to
human time rather than computer time. In configuring the agents, we found a few areas where modifications needed
to be made to support posting of information to website names that were other than the traditional who, what, where
and when names.
4) We derived relationships and organization structures from the best available information, so all
limitations resulting from extraction errors are solely the responsibility of the author.