20mph Research Purpose, Methodology, and Early Findings · Methodology, and Early Findings ......
30
30 th June 2016 1 20mph Research – Purpose, Methodology, and Early Findings 14 th Sep 2016 – PACTS Road Environment Working Party Jane Robinson (Atkins) Atkins, AECOM, Professor Mike Maher
Transcript of 20mph Research Purpose, Methodology, and Early Findings · Methodology, and Early Findings ......

30th June 2016 1
20mph Research – Purpose, Methodology, and Early Findings
14th Sep 2016 – PACTS Road Environment Working Party
Jane Robinson (Atkins)
Atkins, AECOM, Professor Mike Maher

Structure of Presentation
• Study purpose and objectives
• Methodology and evaluation approach
• Early findings
• Current / next stages
2
The findings presented here are based on part of the intended
evidence base for the study only, and will be challenged and
tested as the study progresses. They may change or evolve
over time.
Study Purpose
• Atkins, Aecom and Professor Mike Maher were commissioned by the DfT in
2014 to undertake research into 20mph signed only speed limits.
• Purpose - To address an evidence gap regarding the effectiveness of
20mph speed limit only schemes.
3
Study Objectives
• To evaluate the effectiveness of 20mph speed limits, in a range of settings.
• To examine drivers’ and residents’ perceptions of 20mph limits.
• To assess the relative costs/benefits to vulnerable groups e.g. children,
cyclists, the elderly.
• To evaluate the processes and factors which contribute to the level of
effectiveness of 20mph speed limit schemes.

Project Methodology and Timescales
4
SCOPING PHASE – Detailed Methodology (Oct 2014 – March 2015)
MAIN EVALUATION – Data Collection and Analysis (Apr 2015 – )
FINAL REPORT
• Interviews with national stakeholders (DfT, PACTS, ACPO, ABD, etc.).
• Rapid Evidence Review.
• 15 case study schemes (8 area-wide residential, 2 small-scale
residential schemes, 2 city-centre schemes, 3 no schemes)
• Detailed methodologies for data collection and analysis
• Stakeholder interviews (officers, councillors, police, health, bus operators, etc.)
• Over 3400 questionnaires with drivers and residents
• 12 Focus Groups with specific user groups
• Analysis of speed, flow and accident data
Knowledge
gathering
Evaluation
approach
Method

• Process Evaluation – Why and how are
schemes being delivered?
5
• Support for 20mph speed limits?
• Compliance, speed reduction, and driver behaviour
• Transport outcomes – casualties, perceptions of the quality of the environment
for walking and cycling, increase in active travel, displacement if traffic, etc.
• Wider impacts – health, quality of life, noise and air quality, etc.
• Adverse / unintended impacts
• Impact Evaluation – What impact have schemes
had and why?
Evaluation Themes

Theory of Change – Area-wide Residential
6

7
Process Evaluation - Why and how have schemes been delivered?
Early findings, based on first phase of stakeholder interviews
30th June 2016
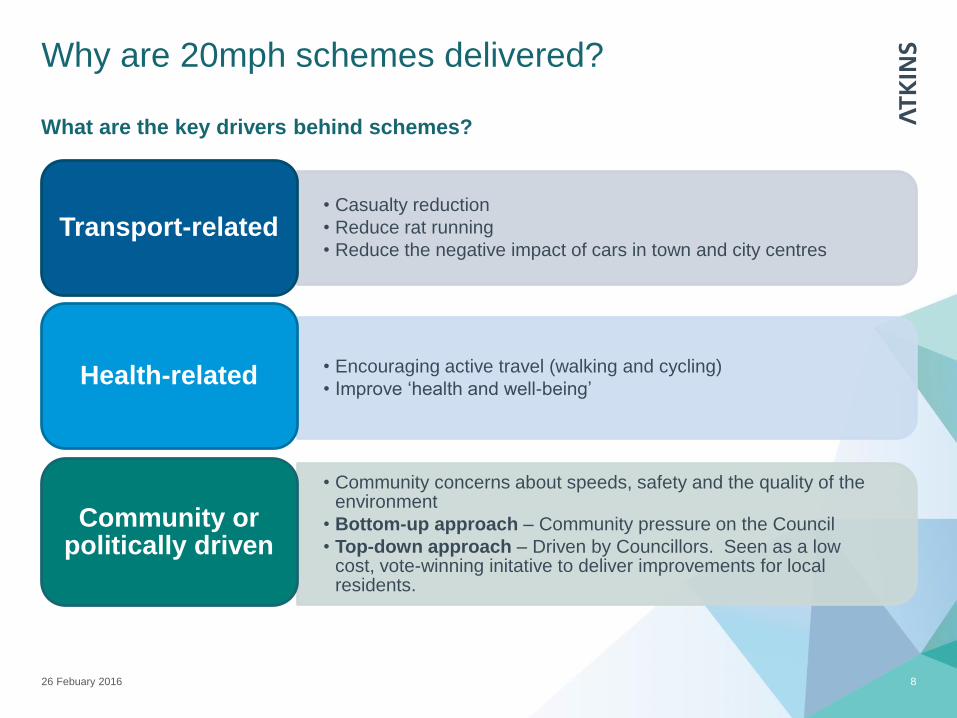
Why are 20mph schemes delivered?
What are the key drivers behind schemes?
26 Febuary 2016 8
• Casualty reduction
• Reduce rat running
• Reduce the negative impact of cars in town and city centres Transport-related
• Encouraging active travel (walking and cycling)
• Improve ‘health and well-being’Health-related
• Community concerns about speeds, safety and the quality of the environment
• Bottom-up approach – Community pressure on the Council
• Top-down approach – Driven by Councillors. Seen as a low cost, vote-winning initative to deliver improvements for local residents.
Community or politically driven

9
Type of objectivesNumber of
case studies
Transport-
related
Community-
related /
Quality of
environment
Health-
related
Reduce casualty numbers and severity 9
Reduce average or excessive speeds / Formalise the
speed at which the majority are already travelling9
Improve quality of environment for walking and
cycling11
Encourage use of active travel modes 12
Improve noise / air quality 3
Improve health and well-being 9
Other - Reduce negative impacts of cars in city
centres (e.g. congestion)2
Other – Improve community cohesion 1
Other – Address concerns about HGV speed limits 1
Other – Support regeneration and improve the public
realm1
Why are 20mph schemes delivered?
What outcomes are 20mph Speed Limits aiming to achieve?

How have 20mph speed limits been implemented?
10
Engagement, education and awareness activities
A range of approaches to inform scheme design and secure public buy-in.
Often as part of the formal Speed Limit / Traffic Regulation Order process.
Scheme design
Road selection.
Specification of signage and road markings. Statutory Speed
Limit / Traffic Regulation Order
(TRO) process
Required to make the new speed limit legally enforceable.
Implementation of signs and road makings
In accordance with the Traffic Signs Regulations and General Directions
(TSRGD) 2002.
Implementation timescales and phasing
approach
Area-wide schemes often implemented in phases of a 2 to 4 year period.
On-going awareness campaign
In some cases.

What barriers and enablers affected scheme
delivery?
11
Barriers Enablers
Limited funding and staffing
resources **
Scheme opposition / anti-scheme
campaign group
Confusion about the enforcement role of
the Police amongst the public and in the
media
Political change
Lack of / confusing evidence regarding
the benefits of 20mph limits
Issues relating to Government
leadership and guidance, needed to
justify schemes
Practical delivery issues
Clear articulation of scheme rationale,
objectives, and outcomes **
Early engagement and buy-in from
stakeholders
A high profile public awareness and
education campaign
Pro-scheme campaign group
Tailoring the scheme to local
circumstances
Guidance and policy documents
Cross-Party support from Councillors
Phased but efficient implementation of
large area-wide schemes
Complementary initiatives
** Most frequently mentioned barrier and enabler.

12
Impact Evaluation – What impact have schemes had and why?
Early findings from residents and drivers questionnaires
Provisional results - Further analysis is currently being undertaken to
explore issues of context, contribution and causality.
30th June 2016

Support for 20mph Limits
13
51%
9%
75%
12%
0%
10%
20%
30%
40%
50%
60%
70%
80%
Supportive Unsupportive
Before implementation
After implementation
Level of support amongst residents
• 20mph limits are generally supported
by residents (and drivers), particularly
once they have been implemented.

Level of awareness
14
Statement: The majority of residents
are aware that a 20mph limit applies
73%
16%
0%
10%
20%
30%
40%
50%
60%
70%
80%
Agree Disagree
• The majority of residents are thought
to be aware of the 20mph limit in their
street.
• However, some residents are
perceived to be unaware and are
therefore unlikely to have changed
driving behaviour or perceived any
benefits.
% agreeing / disagreeing with statement

Perceived impact of 20mph limits on Drivers (1)
15
• Average speed of vehicles – Only 22% of
residents and 32% of drivers thought the
average speed of vehicles had reduced.
• Number of vehicles – Only 7% of drivers
and 4% of residents thought the number of
vehicles using the road had reduced.
However, 8% of drivers said they avoided
driving in 20mph areas.
• Driver consideration of pedestrians and
cyclists - Only a fifth of residents thought the
20mph limit made drivers more considerate
to pedestrians (21%) or cyclists (17%).
22%32%
12%
13%
66%55%
0%
20%
40%
60%
80%
100%
Residents Drivers
Neither agree or disagree
Disagree
Agree
Statement: The average
speed has reduced
% agreeing / disagreeing with statement
20mph limits are perceived to have had
limited impact on driving behaviour:

Perceived impact of 20mph limits on Drivers (2)
16
• Driver awareness of risks and hazards –
Two-thirds of drivers (64%) said 20mph limits
increase awareness of potential risks and
hazards. Although only 42% of residents
agreed with this statement.
• Driver frustration – 48% of drivers said
20mph limits were frustrating for drivers.
Although only 37% of residents had reported
seeing evidence of this.
Statement: The 20mph limit increases drivers’
awareness of potential risks and hazards
% agreeing / disagreeing with statement
42%
64%
Residents Drivers
Agree

Perceived Impact of 20mph Limit on Walking and Cycling
• Are 20mph limits beneficial for cyclists and
pedestrians – 77% of drivers and 69% residents
felt the limit was beneficial for cyclists and
pedestrians.
• Impact on the quality of the walking and cycling
environment – Half of residents felt the 20mph
limit had created a more pleasant environment.
• Perceptions of safety when cycling and walking
– 60% of residents felt that the limit provided a
safer environment.
• Perceived impact on pedestrian and cycle
numbers – Around a tenth of residents thought
more people were walking on their street since the
20mph limit.
• Likelihood of walking or cycling more –
reducing the speed limit to 20mph had encouraged
some residents to walk (16%) or cycle (9%) to local
places rather than use a car.
17
69%
77%
Residents Drivers
Agree
Statement: The 20mph limit
is beneficial for cyclists and
pedestrians
% agreeing / disagreeing with statement
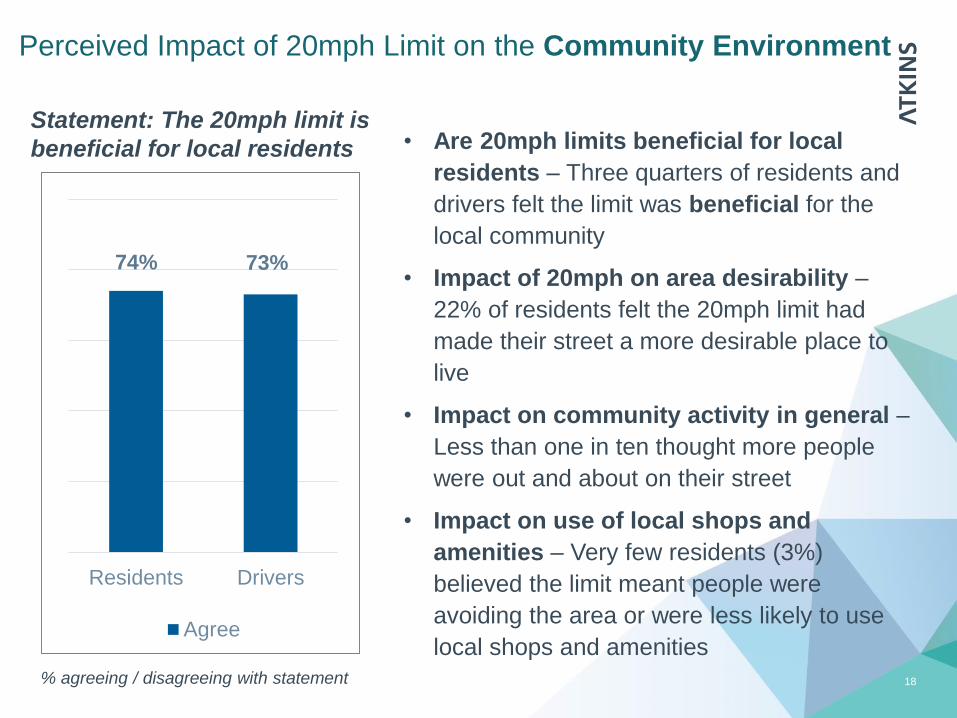
Perceived Impact of 20mph Limit on the Community Environment
• Are 20mph limits beneficial for local
residents – Three quarters of residents and
drivers felt the limit was beneficial for the
local community
• Impact of 20mph on area desirability –
22% of residents felt the 20mph limit had
made their street a more desirable place to
live
• Impact on community activity in general –
Less than one in ten thought more people
were out and about on their street
• Impact on use of local shops and
amenities – Very few residents (3%)
believed the limit meant people were
avoiding the area or were less likely to use
local shops and amenities
18
Statement: The 20mph limit is
beneficial for local residents
74% 73%
Residents Drivers
Agree
% agreeing / disagreeing with statement
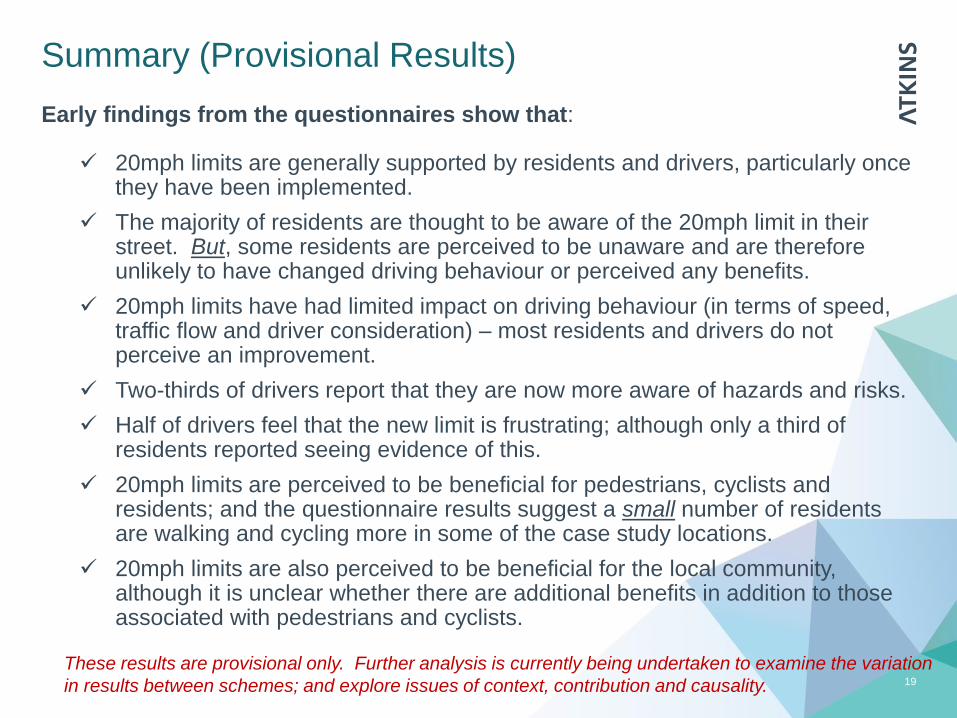
Summary (Provisional Results)
19
Early findings from the questionnaires show that:
20mph limits are generally supported by residents and drivers, particularly once they have been implemented.
The majority of residents are thought to be aware of the 20mph limit in their street. But, some residents are perceived to be unaware and are therefore unlikely to have changed driving behaviour or perceived any benefits.
20mph limits have had limited impact on driving behaviour (in terms of speed, traffic flow and driver consideration) – most residents and drivers do not perceive an improvement.
Two-thirds of drivers report that they are now more aware of hazards and risks.
Half of drivers feel that the new limit is frustrating; although only a third of residents reported seeing evidence of this.
20mph limits are perceived to be beneficial for pedestrians, cyclists and residents; and the questionnaire results suggest a small number of residents are walking and cycling more in some of the case study locations.
20mph limits are also perceived to be beneficial for the local community, although it is unclear whether there are additional benefits in addition to those associated with pedestrians and cyclists.
These results are provisional only. Further analysis is currently being undertaken to examine the variation
in results between schemes; and explore issues of context, contribution and causality.

20
Current / future analysis
30th June 2016

Current / further analysis
Current activities
• Regression analysis of residents and drivers questionnaire results, linked to
theory of change logic maps.
• Speed data analysis focused on 12 case study authorities.
• Follow-up interviews with local authorities to obtain further information on
scheme costs, and locally collected monitoring data.
Upcoming activities (Winter 2016/17)
• Focus groups with specific user groups, to address gaps in the evidence
collected to date, and provide more in-depth information on specific issues.
Later next year
• Analysis of personal injury collision data
• National stakeholders interviews
21

Speed data analysis (1) - Introduction
• Tomtom floating car data from GPS devices has been purchased for each of
the case study areas to enable area-wide comparison of speeds before and
after implementation to be undertaken.
• The dataset comprises the following metrics on a segment by segment
basis (with most residential roads split into a small number of segments):
• Average and median speeds, percentiles and inter-quartile range, max
and min speeds, and sample size and length of segment.
• Data has been purchased for one year before and one year after, with the
after data starting at least 3 months after implementation to allow time for
the scheme to bed in.
22

Speed data analysis (2) - Analysis
23
The analysis will focus on addressing the following hypotheses:
• % compliance – Level of compliance, Relationship between compliance and
before speed, Relationship between compliance and time of day (as proxy
measure for volume of traffic).
• Average speed – Change in average speed, Relationship between before
speed and change in average speed.
• Speed profile – Overall profile, Top and bottom percentile speeds, Proportion
driving at 20mph, 24mph, 30mph (or similar).
• Effectiveness of 20mph limits over time – Portsmouth (1yr vs. 7yrs post).
• Speed displacement impacts – Change in speed compliance on
surrounding roads: i) other residential streets with 30mph limits (ii) strategic
routes. Focusing on areas where not all residential roads are 20mph.
• Impact of road type / function on speeds – Major roads, secondary roads,
local connecting roads, local roads of high / moderate / minor importance.
• Effectiveness of 20mph limits versus 20mph zones – Comparison of
compliance.

Speed data analysis (3) – Strengths, weaknesses
Strengths
• Data available since 2008, so can be used retrospectively.
• Data available for a whole area, rather than spot locations.
• Potential for high sample of GPS data, given number of roads and timespan.
• Data based primarily on GPS devices in private vehicles (rather than freight,
which makes up a high proportion of TrafficMaster data, for example).
Limitations
• Some residential roads may have low sample rates due to the low volumes
of traffic on these links, or low use of sat-navs for local trips. May relate to a
small number of drivers making the same trip every day.
• In less affluent areas there may be fewer vehicles with access to sat-nav
devices.
• Analysis will therefore be undertaken at a case study or pan-case study
level, and will not be disaggregated further. E.g. analysis by functional road
type will be undertaken using data from all case studies. 24

Speed data analysis (4) – Other challenges
• Innovative use of tomtom data.
• No central database identifying the location of 20mph limits or zones.
• No comprehensive or readily available information available on road type,
geometry, land-use, etc.
25

Focus groups - Overview
• Proposing up to 12 focus groups with specific user groups, to address gaps in
the evidence collected to date, and provide more in-depth information on
specific issues.
• Currently proposing to target the following user groups (TBC):
• Existing cyclists using 20mph roads; New and potential cyclists
• Young drivers
• Parents with young children
• Residents – focusing on health and fitness, social interaction, and
community cohesion.
• Focus groups to be undertaken in four case study areas, with the highest and
lowest levels of support; and reflecting different contexts..
26

Focus groups – Potential target groups (1)
27
Potential target
groups
Specific issues to explore
Existing cyclists • Potential for existing cyclists to walk and cycle more for utility purposes.
• Do 20mph limits create a safer environment for cyclists, and in what
circumstances? What types of 20mph / 30mph road environments are
most conducive to more cycling (e.g. narrow 20mph roads vs wide
30mph roads)? Relative benefits of 20mph roads over dedicated cycle
lanes?
• Have existing cyclists changed their routes? E.g. Moved to 20mph
routes or now avoid 20mph routes? Why?
• Cycle behaviour in 20mph areas vs 30mph. Do cyclists consider what
the speed limit is? Are they aware that drivers are frustrated by cyclist
travelling at high speeds?
• Relative benefits / dis-benefits of 20mph limits vs. 20mph zones.
New and potential
cyclists
• Potential for local residents to walk and cycle more for utility purposes.
• Do 20mph limits create a safer environment for cyclists, and in what
circumstances? What types of 20mph / 30mph road environments are
most conducive to more cycling (e.g. narrow 20mph roads vs wide
30mph roads)? Relative benefits of 20mph roads over dedicated cycle
lanes?
• Impact of 20mph designation (only) on perceptions of safety?
• Relative benefits / dis-benefits of 20mph limits vs. 20mph zones.

Focus groups – Potential target groups (2)
28
Potential target
groups
Specific issues to explore
Parents with
young children
• Attitudes towards 20mph limits amongst parents; perceived benefits.
• Change in parents’ views on allowing primary and secondary pupils
to walk or cycle to school, and other destinations.
• Change in parents attitudes to outside play.
• Observations of speed compliance outside schools.
• Role of 20mph limits in choice of school.
Young drivers
(18-20)
• Likelihood of compliance with speed limit, and reasons - Drivers
depth interviews identify different perceptions of compliance amongst
older and younger people.
• Attitudes and behaviour amongst new drivers.
• Levels of frustration / intimidation due to other drivers.

National stakeholder interviews
29
7-8 interviews in total. Potential stakeholders include:
• Police / ACPO / NDORS – Key issues to explore around enforcement, NDORS, use of
average speed cameras, etc.
• UK Network Management Board – Involved in significant discussions with Police on issues
relating to 20mph.
• Motorcycle representative (IAM or Police providers of motorcycle training course).*
• Fleet operator or representative body of van / delivery drivers.*
• 20s Plenty – Good understanding of what’s happening around the country, who is collecting
good data, etc.
• Association of British Drivers*
• Public Health England or National Institute for Health Research.
• Road Safety Great Britain.
• CIHT or ADEPT.
*May be represented directly or indirectly on the DfT’s Motorists Forum.

30
Contact details
30th June 2016