2035 LONG-RANGE TRANSPORTATION PLAN Executive Summarygouda.beloitwi.gov/weblink/0/edoc/60755/SLATS...
23
STATELINE AREA TRANSPORTATION STUDY 2035 LONG-RANGE TRANSPORTATION PLAN Executive Summary The SLATS Long-Range Transportation Plan addresses all modes of publicly-assisted transportation in the StateLine Metropolitan Planning Area. This Executive Summary provides a brief overview of the full Plan’s most important aspects. This Summary is an educational aid and is not intended to be a substitute for, or in any way supersede, the full Plan which was officially adopted by the SLATS Policy Committee on September 11, 2006. This Summary was first publicly released on August 7, 2006. The full Plan is available in printed form and in digital format (pdf) on compact disk or via the SLATS web page ( http://www.ci.beloit.wi.us/ ). Information about the Plan and other SLATS activities can also be obtained by contacting the SLATS Coordinator in the Beloit City Hall, Pubic Works Dept., 100 State Street – 606-364-6690. Federal law requires the Long-Range Plan to be updated every five years. It can be updated or amended at any time.
Transcript of 2035 LONG-RANGE TRANSPORTATION PLAN Executive Summarygouda.beloitwi.gov/weblink/0/edoc/60755/SLATS...

STATELINE AREA TRANSPORTATION STUDY
2035 LONG-RANGE TRANSPORTATION PLAN
Executive Summary
The SLATS Long-Range Transportation Plan addresses
all modes of publicly-assisted transportation in the StateLine Metropolitan Planning Area.
This Executive Summary provides a brief overview of the full Plan’s most important aspects. This Summary is an educational aid and is not intended to be a substitute for, or in any way supersede, the full Plan which was officially adopted by the SLATS Policy Committee on September 11, 2006. This Summary was first publicly released on August 7, 2006. The full Plan is available in printed form and in digital format (pdf) on compact disk or via the SLATS web page ( http://www.ci.beloit.wi.us/ ). Information about the Plan and other SLATS activities can also be obtained by contacting the SLATS Coordinator in the Beloit City Hall, Pubic Works Dept., 100 State Street – 606-364-6690.
Federal law requires the Long-Range Plan to be updated every five years. It can be updated or amended at any time.
SLATS 2035 LRP Executive Summary 9/14//06 Page 2 of 23
THE OVERALL PURPOSE OF THE SLATS LONG-RANGE TRANSPORTATION PLAN (LRP) IS THE COORDINATION TRANSPORTATION DECISIONS THROUGHOUT THE STATELINE AREA. Several public entities design, construct, and maintain surface transportation facilities or services in the Area. Individually, all of these entities strive to make transportation decisions that are in the best interest of their citizens. This Plan prioritizes the local investment decisions from a collective standpoint with spe-cial emphasis on the use of Federal funds. More important, it seeks to steer the decisions such that they result in transportation improvements that are timely, complimentary, conducive to economic development, and minimally disruptive to the natural environment. It seeks transportation im-provements that improve the quality of all life in the Stateline Area.
In addition, the Plan is a federally-required document. It is necessary to qualify the Stateline Area for thousands to mil-lions of dollars in annual Federal and State transportation as-sistance annually. This document is divided into seven chapters plus this Sum-mary. This Summary will present the most important findings and recommendations of each chapter. Hopefully, this Sum-mary will encourage citizens to become involved in the local transportation planning process. Note that each Chapter of the LRP contains numerous maps, charts and other illustra-tions. People not having the time to read the entire LRP may find it useful to review these illustrations. The full version of the LRP may be viewed and downloaded from the SLATS website ( http://www.ci.beloit.wi.us/ ). Printed copies will be available at area libraries or can be reviewed at the SLATS headquarters in the Beloit City Hall. Chapter 1, the Introduction, describes the geographic area covered by the LRP, the participants responsible for its development, the broad scope the LRP is intended to encompass, how the planning process is funded and con-
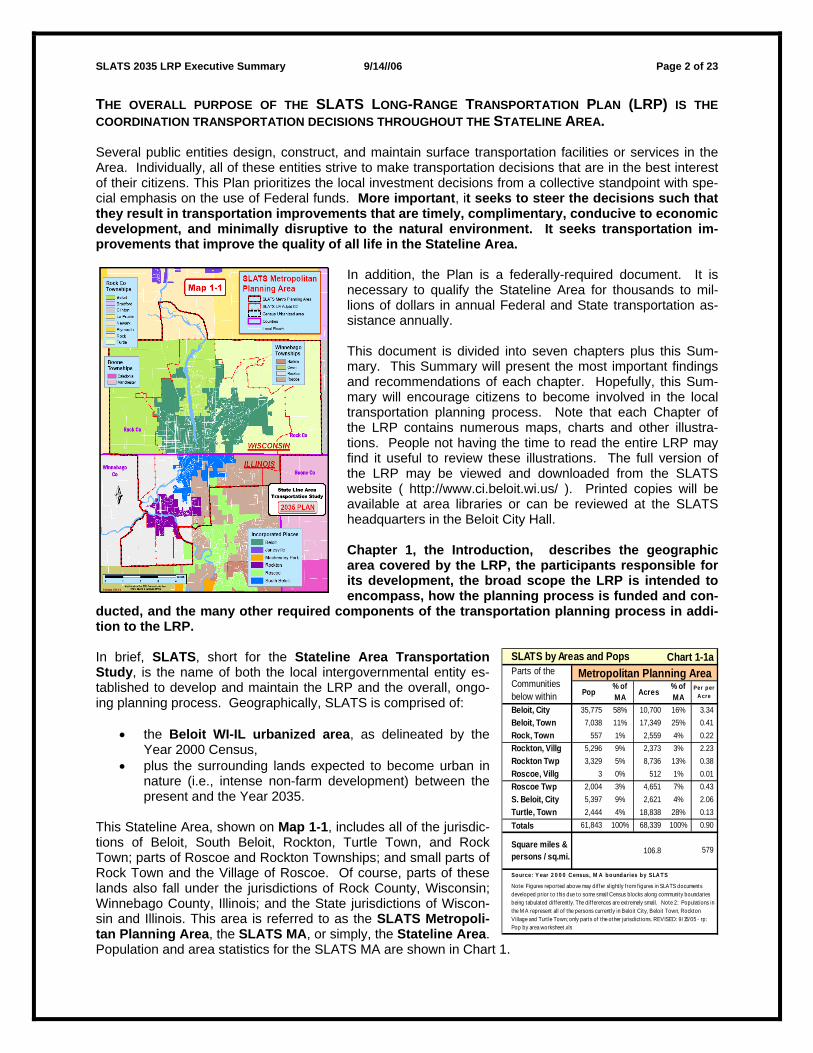
ducted, and the many other required components of the transportation planning process in addi-tion to the LRP. In brief, SLATS, short for the Stateline Area Transportation Study, is the name of both the local intergovernmental entity es-tablished to develop and maintain the LRP and the overall, ongo-ing planning process. Geographically, SLATS is comprised of:
• the Beloit WI-IL urbanized area, as delineated by the Year 2000 Census,
• plus the surrounding lands expected to become urban in nature (i.e., intense non-farm development) between the present and the Year 2035.
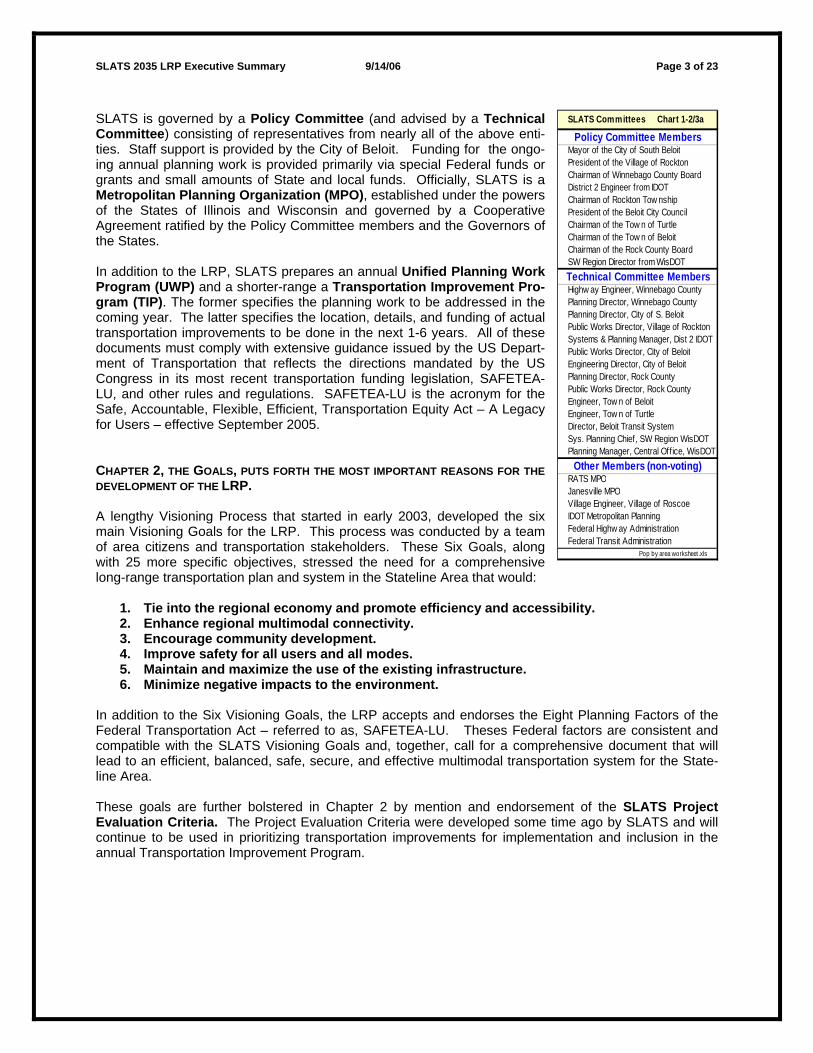
This Stateline Area, shown on Map 1-1, includes all of the jurisdic-tions of Beloit, South Beloit, Rockton, Turtle Town, and Rock Town; parts of Roscoe and Rockton Townships; and small parts of Rock Town and the Village of Roscoe. Of course, parts of these lands also fall under the jurisdictions of Rock County, Wisconsin; Winnebago County, Illinois; and the State jurisdictions of Wiscon-sin and Illinois. This area is referred to as the SLATS Metropoli-tan Planning Area, the SLATS MA, or simply, the Stateline Area. Population and area statistics for the SLATS MA are shown in Chart 1.
Chart 1-1a
Pop% of MA Acres
% of MA
Per per A cre
Beloit, City 35,775 58% 10,700 16% 3.34 Beloit, Town 7,038 11% 17,349 25% 0.41 Rock, Town 557 1% 2,559 4% 0.22 Rockton, Villg 5,296 9% 2,373 3% 2.23 Rockton Twp 3,329 5% 8,736 13% 0.38 Roscoe, Villg 3 0% 512 1% 0.01 Roscoe Twp 2,004 3% 4,651 7% 0.43 S. Beloit, City 5,397 9% 2,621 4% 2.06 Turtle, Town 2,444 4% 18,838 28% 0.13 Totals 61,843 100% 68,339 100% 0.90
Square miles & persons / sq.mi. 106.8
Parts of the Communities below within
Metropolitan Planning Area SLATS by Areas and Pops
579
Source: Y ear 2 0 0 0 C ensus, M A bo und aries b y SLA T S
Note: Figures reported above may dif fer slight ly f rom f igures in SLATS documents developed prior to this due to some small Census blocks along community boundaries being tabulated dif ferent ly. The dif ferences are extremely small. Note 2: Populat ions in the M A represent all of the persons current ly in Beloit City, Beloit Town, Rockton Village and Turt le Town; only parts of the other jurisdict ions. REVISED: 9/15/05 - rp: Pop by area worksheet.xls
SLATS 2035 LRP Executive Summary 9/14/06 Page 3 of 23
SLATS is governed by a Policy Committee (and advised by a Technical Committee) consisting of representatives from nearly all of the above enti-ties. Staff support is provided by the City of Beloit. Funding for the ongo-ing annual planning work is provided primarily via special Federal funds or grants and small amounts of State and local funds. Officially, SLATS is a Metropolitan Planning Organization (MPO), established under the powers of the States of Illinois and Wisconsin and governed by a Cooperative Agreement ratified by the Policy Committee members and the Governors of the States. In addition to the LRP, SLATS prepares an annual Unified Planning Work Program (UWP) and a shorter-range a Transportation Improvement Pro-gram (TIP). The former specifies the planning work to be addressed in the coming year. The latter specifies the location, details, and funding of actual transportation improvements to be done in the next 1-6 years. All of these documents must comply with extensive guidance issued by the US Depart-ment of Transportation that reflects the directions mandated by the US Congress in its most recent transportation funding legislation, SAFETEA-LU, and other rules and regulations. SAFETEA-LU is the acronym for the Safe, Accountable, Flexible, Efficient, Transportation Equity Act – A Legacy for Users – effective September 2005. CHAPTER 2, THE GOALS, PUTS FORTH THE MOST IMPORTANT REASONS FOR THE DEVELOPMENT OF THE LRP. A lengthy Visioning Process that started in early 2003, developed the six main Visioning Goals for the LRP. This process was conducted by a team of area citizens and transportation stakeholders. These Six Goals, along with 25 more specific objectives, stressed the need for a comprehensive long-range transportation plan and system in the Stateline Area that would:
1. Tie into the regional economy and promote efficiency and accessibility. 2. Enhance regional multimodal connectivity. 3. Encourage community development. 4. Improve safety for all users and all modes. 5. Maintain and maximize the use of the existing infrastructure. 6. Minimize negative impacts to the environment.
In addition to the Six Visioning Goals, the LRP accepts and endorses the Eight Planning Factors of the Federal Transportation Act – referred to as, SAFETEA-LU. Theses Federal factors are consistent and compatible with the SLATS Visioning Goals and, together, call for a comprehensive document that will lead to an efficient, balanced, safe, secure, and effective multimodal transportation system for the State-line Area. These goals are further bolstered in Chapter 2 by mention and endorsement of the SLATS Project Evaluation Criteria. The Project Evaluation Criteria were developed some time ago by SLATS and will continue to be used in prioritizing transportation improvements for implementation and inclusion in the annual Transportation Improvement Program.
SLATS Committees Chart 1-2/3a
Policy Committee MembersMayor of the City of South BeloitPresident of the Village of RocktonChairman of Winnebago County BoardDistrict 2 Engineer from IDOTChairman of Rockton Tow nshipPresident of the Beloit City CouncilChairman of the Tow n of TurtleChairman of the Tow n of BeloitChairman of the Rock County BoardSW Region Director from WisDOTTechnical Committee MembersHighw ay Engineer, Winnebago CountyPlanning Director, Winnebago CountyPlanning Director, City of S. BeloitPublic Works Director, Village of RocktonSystems & Planning Manager, Dist 2 IDOTPublic Works Director, City of BeloitEngineering Director, City of BeloitPlanning Director, Rock CountyPublic Works Director, Rock CountyEngineer, Tow n of BeloitEngineer, Tow n of TurtleDirector, Beloit Transit SystemSys. Planning Chief, SW Region WisDOTPlanning Manager, Central Office, WisDOT
Other Members (non-voting)RATS MPOJanesville MPOVillage Engineer, Village of RoscoeIDOT Metropolitan PlanningFederal Highw ay AdministrationFederal Transit Administration
Pop by area worksheet.xls
SLATS 2035 LRP Executive Summary 9/14//06 Page 4 of 23
Chapter 2 also stresses broader regional plan-ning issues facing the Stateline Area. Cited is the need to coordinate with the Janesville MPO and the RATS MPO, north and south of the Stateline Area. Two traffic simulation models have been recently developed are noted as ex-amples of an already high level of intergovern-mental cooperation. Together, these models cover all of Boone and Winnebago Counties in Illinois and all of Rock County in Wisconsin. They provide a useful tool for forecasting future traffic and evaluating transportation alternatives as the region merges into a continuous metropo-lis, extending all the way from north of Janesville, south through Beloit and Rockford, and east through Belvidere and large parts of Boone County. Finally, the question is posed whether the trans-portation systems in this merging metropolis can best be adequately coordinated by enhanced communication among the separate MPOs (RATS, SLATS, and Janesville) or would be bet-ter facilitated by merging the three into a single MPO? For now, better communication is ac-cepted as the answer to that question. However, the question could be revisited as part of the next major LRP update.
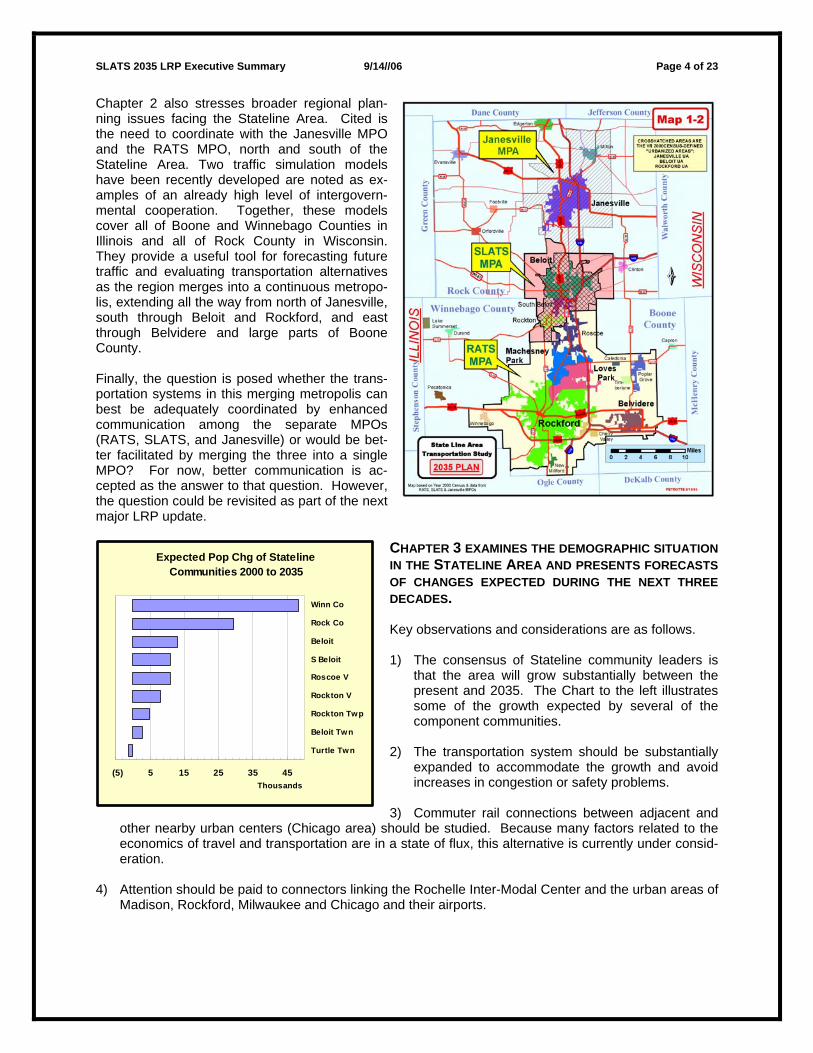
CHAPTER 3 EXAMINES THE DEMOGRAPHIC SITUATION IN THE STATELINE AREA AND PRESENTS FORECASTS OF CHANGES EXPECTED DURING THE NEXT THREE DECADES. Key observations and considerations are as follows. 1) The consensus of Stateline community leaders is
that the area will grow substantially between the present and 2035. The Chart to the left illustrates some of the growth expected by several of the component communities.
2) The transportation system should be substantially
expanded to accommodate the growth and avoid increases in congestion or safety problems.
3) Commuter rail connections between adjacent and
other nearby urban centers (Chicago area) should be studied. Because many factors related to the economics of travel and transportation are in a state of flux, this alternative is currently under consid-eration.
4) Attention should be paid to connectors linking the Rochelle Inter-Modal Center and the urban areas of
Madison, Rockford, Milwaukee and Chicago and their airports.
Expected Pop Chg of Stateline Communities 2000 to 2035
(5) 5 15 25 35 45
Turtle Twn
Beloit Twn
Rockton Twp
Rockton V
Roscoe V
S Beloit
Beloit
Rock Co
Winn Co
Thousands
SLATS 2035 LRP Executive Summary 9/14/06 Page 5 of 23
5) The large and growing numbers of very young and old people in the Stateline area implies a need for public transit services and alternative modes for those people who don’t drive automo-biles. Growing anecdotal evidence substantiates the need for increased paratransit services, es-pecially south of the State line.
6) The increasing number of people living in subur-
ban communities in the Illinois part of the State-line Area implies a need to examine the safety and capacity of the limited road system serving those areas.
7) A positive observation is the level of racial and
ethnic integration of people living in the Stateline Area. Similarly, income distribution does not ex-
hibit large concentration or “ghetto-like” pockets of low-income household in the Stateline Area. However, the distribution of racial, ethnic and low-income populations is not entirely homogenous. Therefore, as the transportation system is enlarged and enhanced, care must be taken to treat these groups equitably. They should derive fair shares of the positive benefits of the improvements and should not be disproportionately burdened with the negative impacts of the improvements.
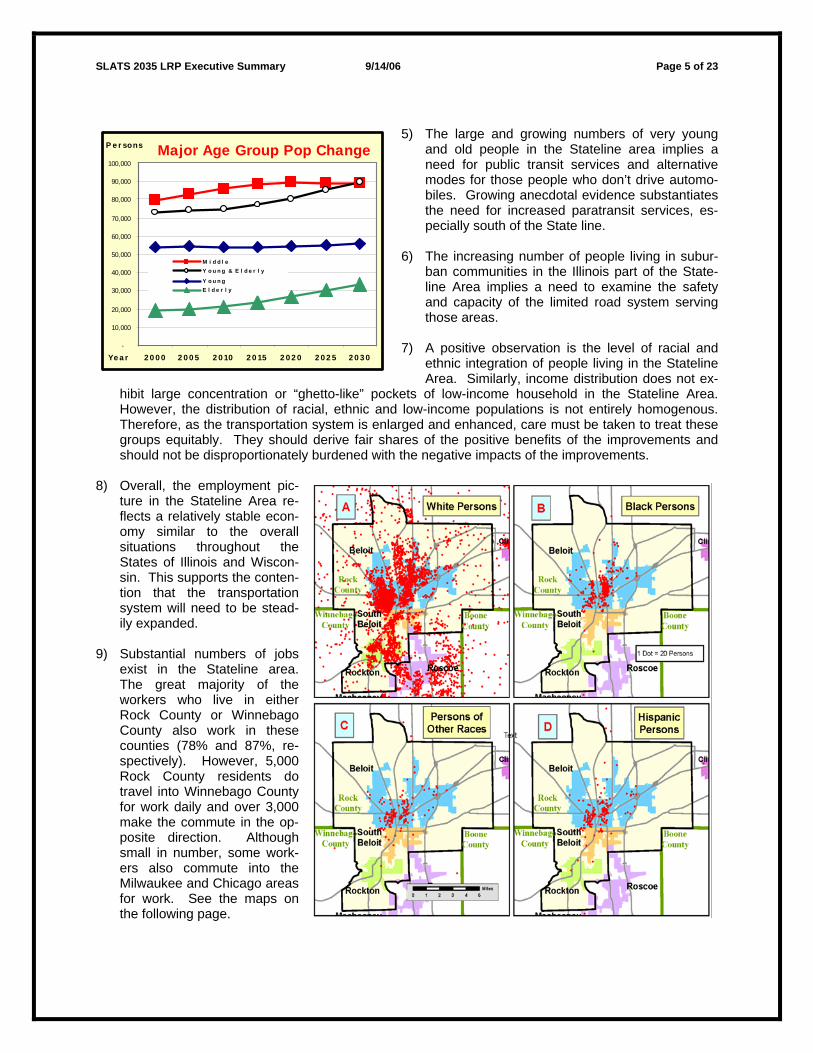
8) Overall, the employment pic-
ture in the Stateline Area re-flects a relatively stable econ-omy similar to the overall situations throughout the States of Illinois and Wiscon-sin. This supports the conten-tion that the transportation system will need to be stead-ily expanded.
9) Substantial numbers of jobs
exist in the Stateline area. The great majority of the workers who live in either Rock County or Winnebago County also work in these counties (78% and 87%, re-spectively). However, 5,000 Rock County residents do travel into Winnebago County for work daily and over 3,000 make the commute in the op-posite direction. Although small in number, some work-ers also commute into the Milwaukee and Chicago areas for work. See the maps on the following page.
Major Age Group Pop Change
-
10,000
20,000
30,000
40,000
50,000
60,000
70,000
80,000
90,000
100,000
2 0 0 0 2 0 0 5 2 0 10 2 0 15 2 0 2 0 2 0 2 5 2 0 3 0Ye a r
P e r sons
M i d d l eY o u n g & E l d e r l y
Y o u n gE l d e r l y
SLATS 2035 LRP Executive Summary 9/14//06 Page 6 of 23
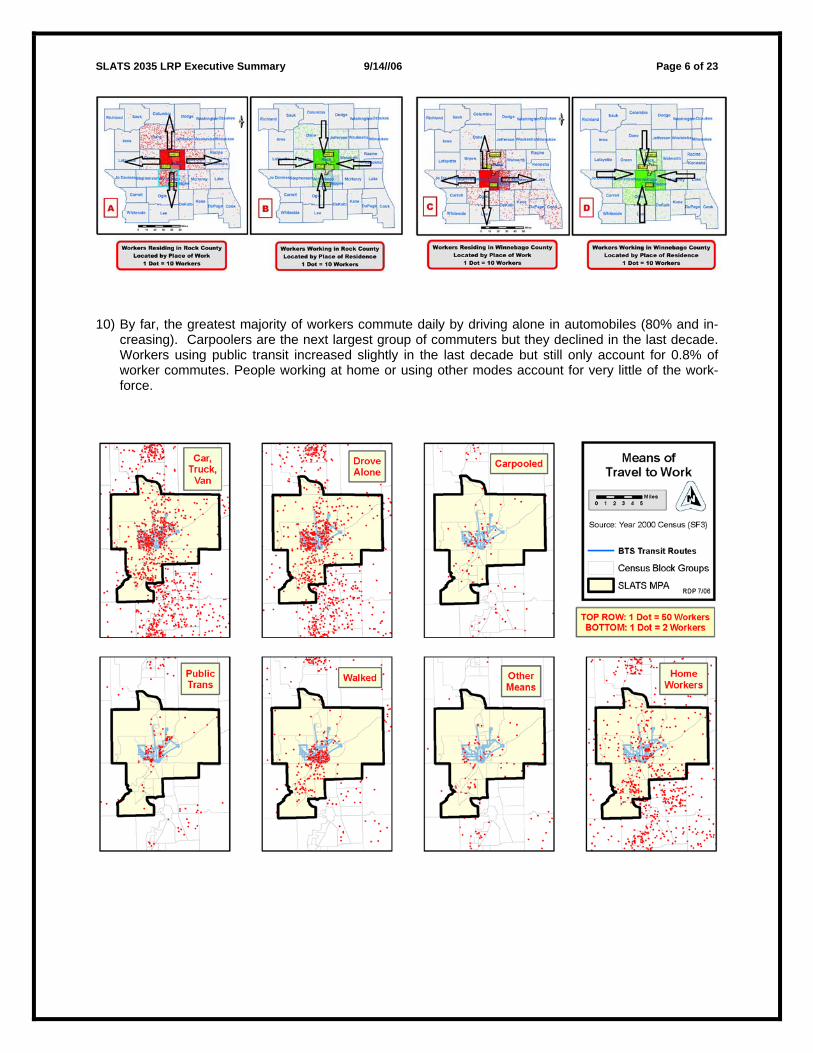
10) By far, the greatest majority of workers commute daily by driving alone in automobiles (80% and in-
creasing). Carpoolers are the next largest group of commuters but they declined in the last decade. Workers using public transit increased slightly in the last decade but still only account for 0.8% of worker commutes. People working at home or using other modes account for very little of the work-force.

SLATS 2035 LRP Executive Summary 9/14/06 Page 7 of 23
11) Disturbingly, worker commute travel times
increased over the last decade in Winne-bago, Rock and Boone Counties – by 2.4 minutes or 13% in the three counties combined. Rock County had the smallest increase (1.6 minutes). Boone County had the largest increase, accounted for by rising numbers of workers establishing residence in that county but working in Chicago or the collar counties.
CHAPTER 4 EXAMINES THE MASS TRANSPORTATION NEEDS AND SERVICES OF THE STATELINE AREA IN DETAIL. Even though less than 1% of all people commuting to and from work in the Stateline Area do so by mass transportation, there is significant need and justification for such service in the area. People use mass transportation (taxis, buses, paratransit services) rather than automobiles for three main reasons:
• they do not have driving privileges, • they cannot afford an automobile, or • they prefer mass transit.
Some of these situations are temporary and some are permanent -- but there is always a sizable numbers of people in the Stateline Area in these situations. Moreover, because the area’s population is growing, ageing, and incur-ring infusions of immigrants, the need for mass transportation is also always growing. It is in the best interest of the Stateline Area to pro-vide a balance of mass transportation service and traditional highway transportation. A bal-anced system is needed to harmoniously ad-dress the economic and social needs of all sec-tors of the Stateline community. Mass transportation is provided in the Stateline Area via a combination of public and private ventures. The primary public services are pro-vided by the Beloit Transit System (BTS) and Rock County Specialized Transportation. BTS provides fixed-route bus service in the City of Beloit and nearby areas. Rock County pro-vides curb-to-curb, demand response paratran-sit (smaller buses where people share rides) throughout all of Rock County. Currently there is no fixed-route transit service in the Stateline
Area on the Illinois side. The Rockford Mass Transit District service currently extends northward to Ma-chesney Park but does not serve Roscoe, Rockton or South Beloit. The only public service south of the State Line is limited partransit service funded by the three municipalities and contractually provided by private companies.
SLATS 2035 LRP Executive Summary 9/14//06 Page 8 of 23
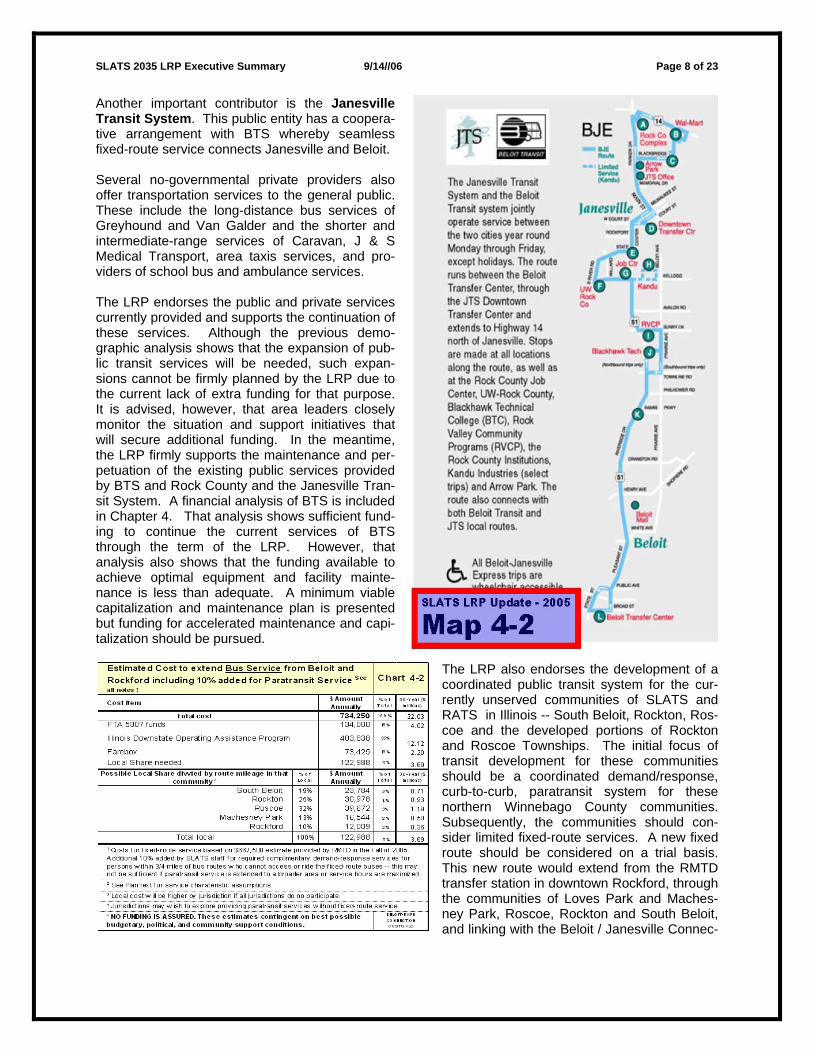
Another important contributor is the Janesville Transit System. This public entity has a coopera-tive arrangement with BTS whereby seamless fixed-route service connects Janesville and Beloit. Several no-governmental private providers also offer transportation services to the general public. These include the long-distance bus services of Greyhound and Van Galder and the shorter and intermediate-range services of Caravan, J & S Medical Transport, area taxis services, and pro-viders of school bus and ambulance services. The LRP endorses the public and private services currently provided and supports the continuation of these services. Although the previous demo-graphic analysis shows that the expansion of pub-lic transit services will be needed, such expan-sions cannot be firmly planned by the LRP due to the current lack of extra funding for that purpose. It is advised, however, that area leaders closely monitor the situation and support initiatives that will secure additional funding. In the meantime, the LRP firmly supports the maintenance and per-petuation of the existing public services provided by BTS and Rock County and the Janesville Tran-sit System. A financial analysis of BTS is included in Chapter 4. That analysis shows sufficient fund-ing to continue the current services of BTS through the term of the LRP. However, that analysis also shows that the funding available to achieve optimal equipment and facility mainte-nance is less than adequate. A minimum viable capitalization and maintenance plan is presented but funding for accelerated maintenance and capi-talization should be pursued.
The LRP also endorses the development of a coordinated public transit system for the cur-rently unserved communities of SLATS and RATS in Illinois -- South Beloit, Rockton, Ros-coe and the developed portions of Rockton and Roscoe Townships. The initial focus of transit development for these communities should be a coordinated demand/response, curb-to-curb, paratransit system for these northern Winnebago County communities. Subsequently, the communities should con-sider limited fixed-route services. A new fixed route should be considered on a trial basis. This new route would extend from the RMTD transfer station in downtown Rockford, through the communities of Loves Park and Maches-ney Park, Roscoe, Rockton and South Beloit, and linking with the Beloit / Janesville Connec-

SLATS 2035 LRP Executive Summary 9/14/06 Page 9 of 23
tion route. This new route would provide a seamless or nearly seamless connection throughout the backbone of the central Rock River Valley. The LRP also recognizes that the paratransit services, public and private, throughout the central Rock River Valley (i.e., throughout Rock and Winnebago Counties) should be better coordinated so that the paratransit-dependant populations can be better and more cost-effectively served. In compliance with new Federal planning guidance under SAFETEA-LU, the LRP recognizes the need for better coordination of publicly provided transportation in conjunction with other government-funded hu-man services. The LRP puts forth an “Initial Human Services Transportation Plan” with the recommenda-tion that area transportation and human service providers us this “initial” plan as a stepping off point for the development of a more comprehensive effort and plan. CHAPTER 5 OF THE LRP IS DEVOTED TO THE TRANSPORTATION SITUATION OF BICYCLISTS AND PEDESTRIANS. The Chapter is primarily a recapitulation of the Bike and Pedestrian System Plan (BPSP) recently adopted (2004) by SLATS. Developed by SLATS and a consultant and adopted following an extensive public review process, the BPSP put forth five major goals and 21 objectives aimed at improving the Bike and Pedestrian System (B&P System). Shortened, the five goals include:
• Reducing motor vehicle dependency and assuring bike and pedestrian access. • Encouraging local planning that supports walking and cycling. • Integrating the Stateline B&P System with the region. • Following approved standards to create a safe B&P System. • Education and awareness that promotes use of the B&P System.
The BPSP elaborated those five goals into 21 objectives and, further, recommended numerous imple-mentation strategies: 15 pertaining to future overall community design, 15 related to the design of B&P facilities, themselves, and 9 pertaining to education. In summary, the BPSP calls for developing a B&P friendly community, safe B&P facilities, and an educated/aware citizenry and B&P users. In addition to statements in the BPSP, the LRP supports expanding the B&P System and encouraging more walking and biking for several reasons. In particular, compared to other transportation modes bik-ing and walking has advantages:
• More environmentally friendly and non-polluting. • Considerably less costly for both system development and use. • There are impressive health benefits. • In some instances, this mode can actually save travel time.
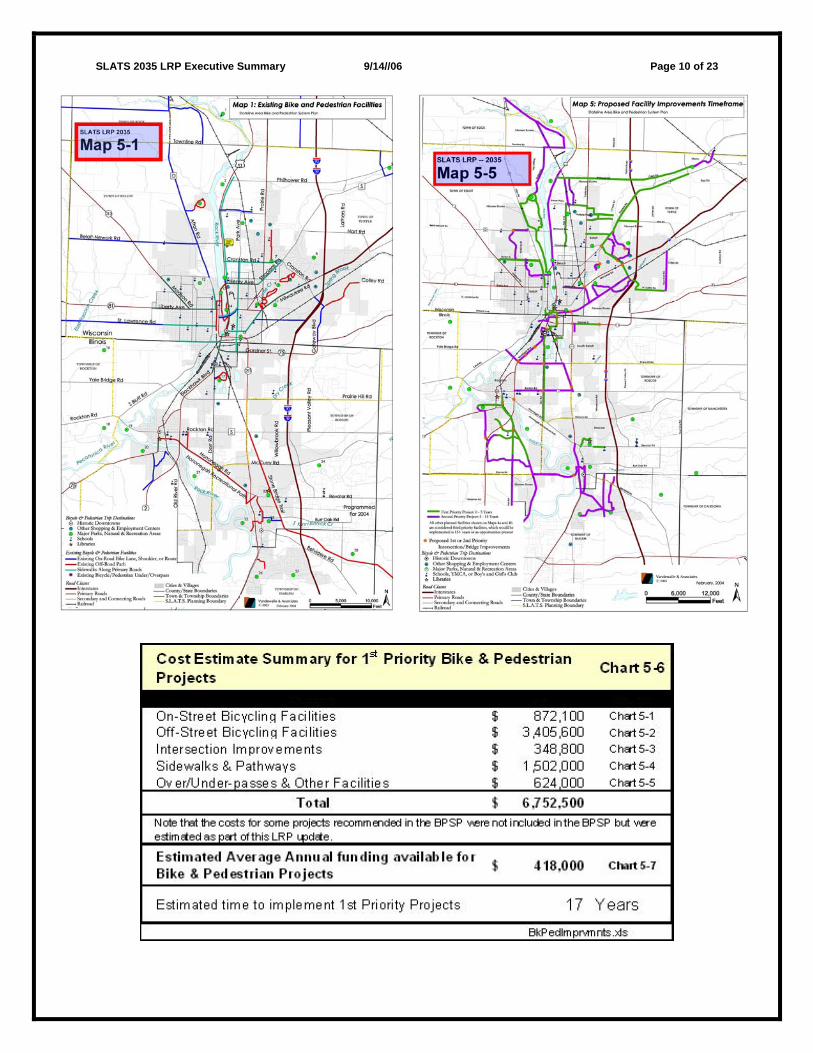
The Stateline Area is not, at present, without considerable B&P facilities, as Map 5-1 on the following page illustrates. The BPSP, however, extensive lists of proposed B&P System improvements and priori-tized the improvements into three groups. The LRP endorses those priorities and recommends imple-menting all three groups, starting with the first priority projects, and proceeding as funding permits. Based on past funding of B&P projects it is estimated that it will take approximately 17 years to complete the first priority projects. Implementation of the second and third priority projects was not forecasted but should be considered during the next LRP update after a better picture of funding availability and the level of community support is gained. For this Plan, the second and third priority projects may be regarded as Illustrative Projects. See Map 5-5 on the following page for an illustration of proposed improvements by priority / timeframe. Additional maps and charts in Chapter 5 provide more details on various aspects of the LRP Bike and Pedestrian proposals. Chart 5-6 summarizes the cost to implement the proposed first priority projects by project type.
SLATS 2035 LRP Executive Summary 9/14//06 Page 10 of 23
SLATS 2035 LRP Executive Summary 9/14/06 Page 11 of 23
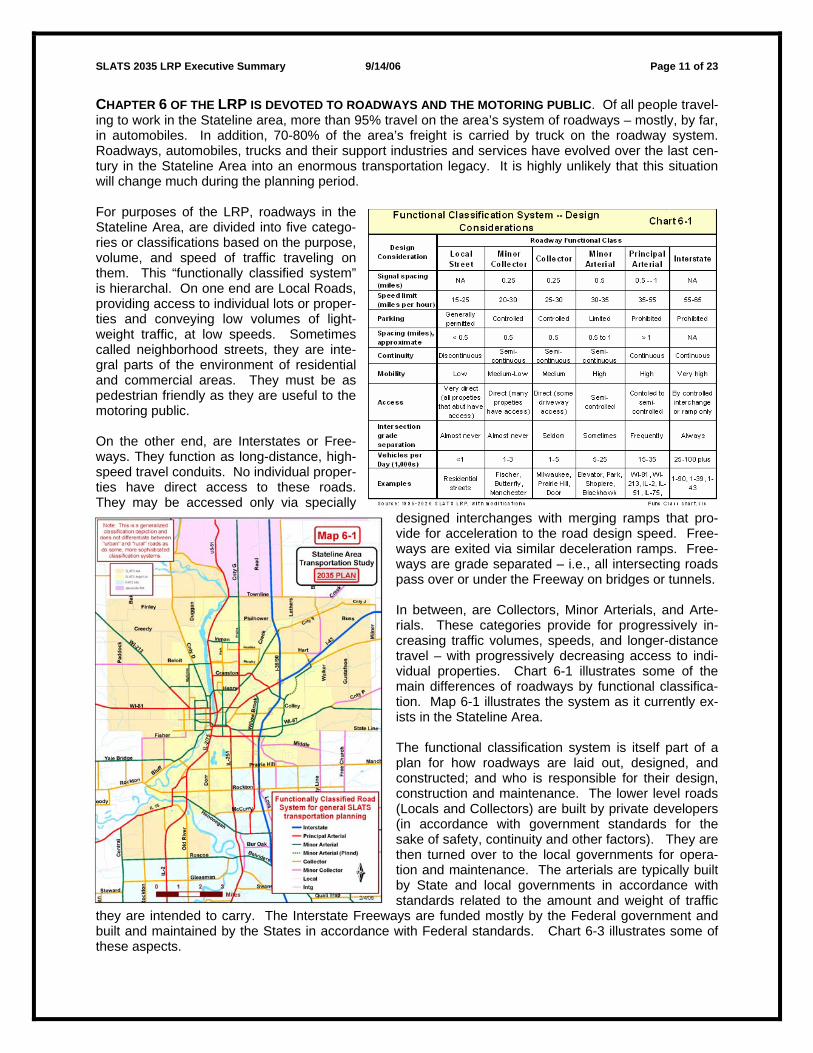
CHAPTER 6 OF THE LRP IS DEVOTED TO ROADWAYS AND THE MOTORING PUBLIC. Of all people travel-ing to work in the Stateline area, more than 95% travel on the area’s system of roadways – mostly, by far, in automobiles. In addition, 70-80% of the area’s freight is carried by truck on the roadway system. Roadways, automobiles, trucks and their support industries and services have evolved over the last cen-tury in the Stateline Area into an enormous transportation legacy. It is highly unlikely that this situation will change much during the planning period. For purposes of the LRP, roadways in the Stateline Area, are divided into five catego-ries or classifications based on the purpose, volume, and speed of traffic traveling on them. This “functionally classified system” is hierarchal. On one end are Local Roads, providing access to individual lots or proper-ties and conveying low volumes of light-weight traffic, at low speeds. Sometimes called neighborhood streets, they are inte-gral parts of the environment of residential and commercial areas. They must be as pedestrian friendly as they are useful to the motoring public. On the other end, are Interstates or Free-ways. They function as long-distance, high-speed travel conduits. No individual proper-ties have direct access to these roads. They may be accessed only via specially
designed interchanges with merging ramps that pro-vide for acceleration to the road design speed. Free-ways are exited via similar deceleration ramps. Free-ways are grade separated – i.e., all intersecting roads pass over or under the Freeway on bridges or tunnels. In between, are Collectors, Minor Arterials, and Arte-rials. These categories provide for progressively in-creasing traffic volumes, speeds, and longer-distance travel – with progressively decreasing access to indi-vidual properties. Chart 6-1 illustrates some of the main differences of roadways by functional classifica-tion. Map 6-1 illustrates the system as it currently ex-ists in the Stateline Area. The functional classification system is itself part of a plan for how roadways are laid out, designed, and constructed; and who is responsible for their design, construction and maintenance. The lower level roads (Locals and Collectors) are built by private developers (in accordance with government standards for the sake of safety, continuity and other factors). They are then turned over to the local governments for opera-tion and maintenance. The arterials are typically built by State and local governments in accordance with standards related to the amount and weight of traffic
they are intended to carry. The Interstate Freeways are funded mostly by the Federal government and built and maintained by the States in accordance with Federal standards. Chart 6-3 illustrates some of these aspects.
SLATS 2035 LRP Executive Summary 9/14//06 Page 12 of 23
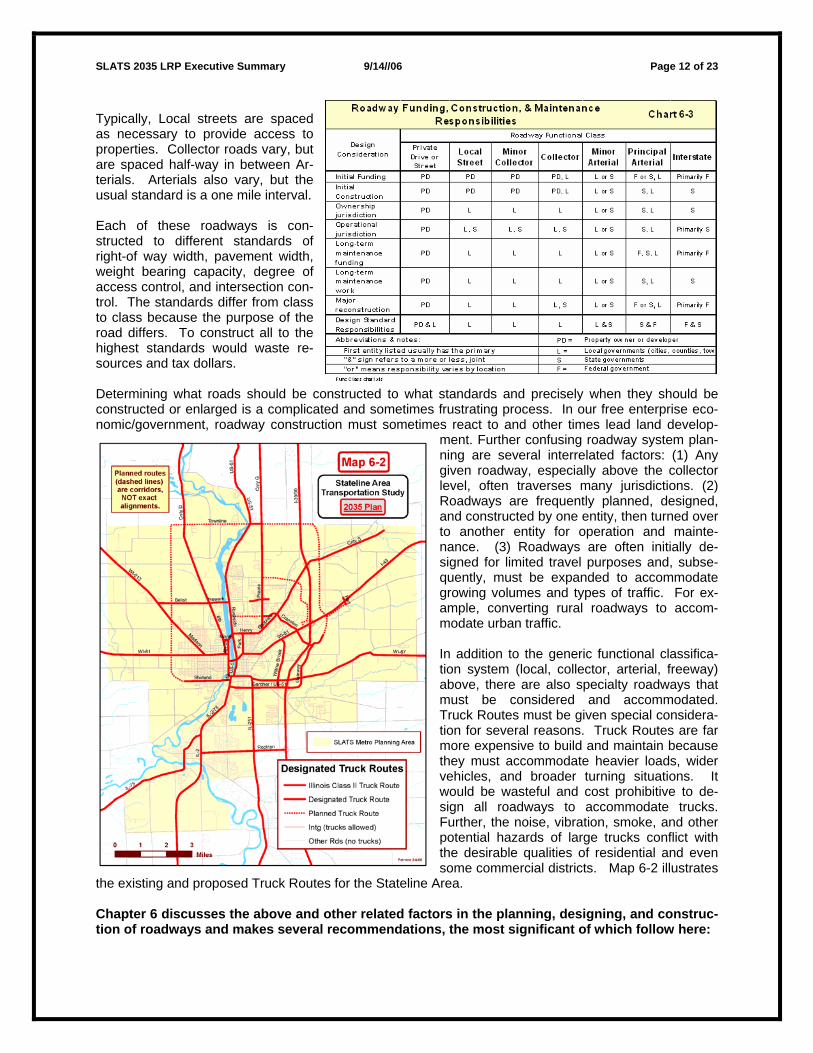
Typically, Local streets are spaced as necessary to provide access to properties. Collector roads vary, but are spaced half-way in between Ar-terials. Arterials also vary, but the usual standard is a one mile interval. Each of these roadways is con-structed to different standards of right-of way width, pavement width, weight bearing capacity, degree of access control, and intersection con-trol. The standards differ from class to class because the purpose of the road differs. To construct all to the highest standards would waste re-sources and tax dollars. Determining what roads should be constructed to what standards and precisely when they should be constructed or enlarged is a complicated and sometimes frustrating process. In our free enterprise eco-nomic/government, roadway construction must sometimes react to and other times lead land develop-
ment. Further confusing roadway system plan-ning are several interrelated factors: (1) Any given roadway, especially above the collector level, often traverses many jurisdictions. (2) Roadways are frequently planned, designed, and constructed by one entity, then turned over to another entity for operation and mainte-nance. (3) Roadways are often initially de-signed for limited travel purposes and, subse-quently, must be expanded to accommodate growing volumes and types of traffic. For ex-ample, converting rural roadways to accom-modate urban traffic. In addition to the generic functional classifica-tion system (local, collector, arterial, freeway) above, there are also specialty roadways that must be considered and accommodated. Truck Routes must be given special considera-tion for several reasons. Truck Routes are far more expensive to build and maintain because they must accommodate heavier loads, wider vehicles, and broader turning situations. It would be wasteful and cost prohibitive to de-sign all roadways to accommodate trucks. Further, the noise, vibration, smoke, and other potential hazards of large trucks conflict with the desirable qualities of residential and even some commercial districts. Map 6-2 illustrates
the existing and proposed Truck Routes for the Stateline Area. Chapter 6 discusses the above and other related factors in the planning, designing, and construc-tion of roadways and makes several recommendations, the most significant of which follow here:
SLATS 2035 LRP Executive Summary 9/14/06 Page 13 of 23
1. Life-cycle costing, the process of identifying and quantifying all costs associated with a structure over its useful life, should be conducted – especially for large expensive projects.
2. Stateline Area governments are encouraged to periodically, collaboratively evaluate their road-
way construction standards and their policies for improvement responsibilities.
a. They should strive for consistency and compatibility – community to community and juris-diction to jurisdiction.
b. They should increase standards where appropriate but try to hold pavement square foot-
age to a minimum. 3. When making improvements to “default” collectors and arterials (legacy roadways not originally
designed to handle the volumes of traffic now traversing them), area planners should attempt to balance traffic movement needs with the need to minimize adverse impacts on adjacent proper-ties – particularly in residential areas.
4. Area planners and engineers should give special attention to the design of Collector Roadways.
To save cost, developers prefer to design these roadways similar to Local streets. In the long term, this creates traffic movement and quality of life conflicts.
5. Local governments should not assume the costs of new Collector roads and some necessary
Arterial road modifications unless there is clear benefit to the general public. Developers should be responsible for, or share responsibility for, situations from which they will profit.
6. All new roadways and roadway improvements should, as appropriate, be designed with recogni-
tion and accommodation of the needs of non-motorized travelers and mass transportation needs. 7. The LRP recognizes numerous roadways in the Stateline Area that have been designed to han-
dle heavy trucks and also proposes a number of additions to this system to make the system more continuous and to address truck movement needs in the future.
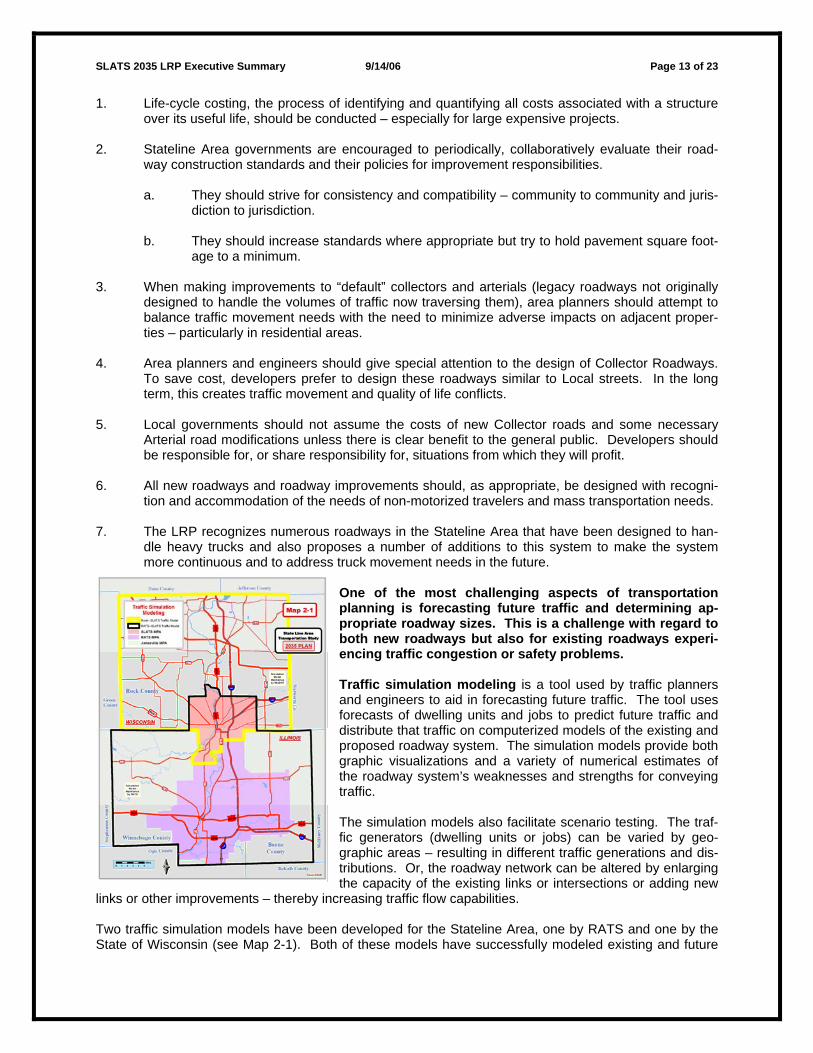
One of the most challenging aspects of transportation planning is forecasting future traffic and determining ap-propriate roadway sizes. This is a challenge with regard to both new roadways but also for existing roadways experi-encing traffic congestion or safety problems. Traffic simulation modeling is a tool used by traffic planners and engineers to aid in forecasting future traffic. The tool uses forecasts of dwelling units and jobs to predict future traffic and distribute that traffic on computerized models of the existing and proposed roadway system. The simulation models provide both graphic visualizations and a variety of numerical estimates of the roadway system’s weaknesses and strengths for conveying traffic. The simulation models also facilitate scenario testing. The traf-fic generators (dwelling units or jobs) can be varied by geo-graphic areas – resulting in different traffic generations and dis-tributions. Or, the roadway network can be altered by enlarging the capacity of the existing links or intersections or adding new
links or other improvements – thereby increasing traffic flow capabilities. Two traffic simulation models have been developed for the Stateline Area, one by RATS and one by the State of Wisconsin (see Map 2-1). Both of these models have successfully modeled existing and future
SLATS 2035 LRP Executive Summary 9/14//06 Page 14 of 23
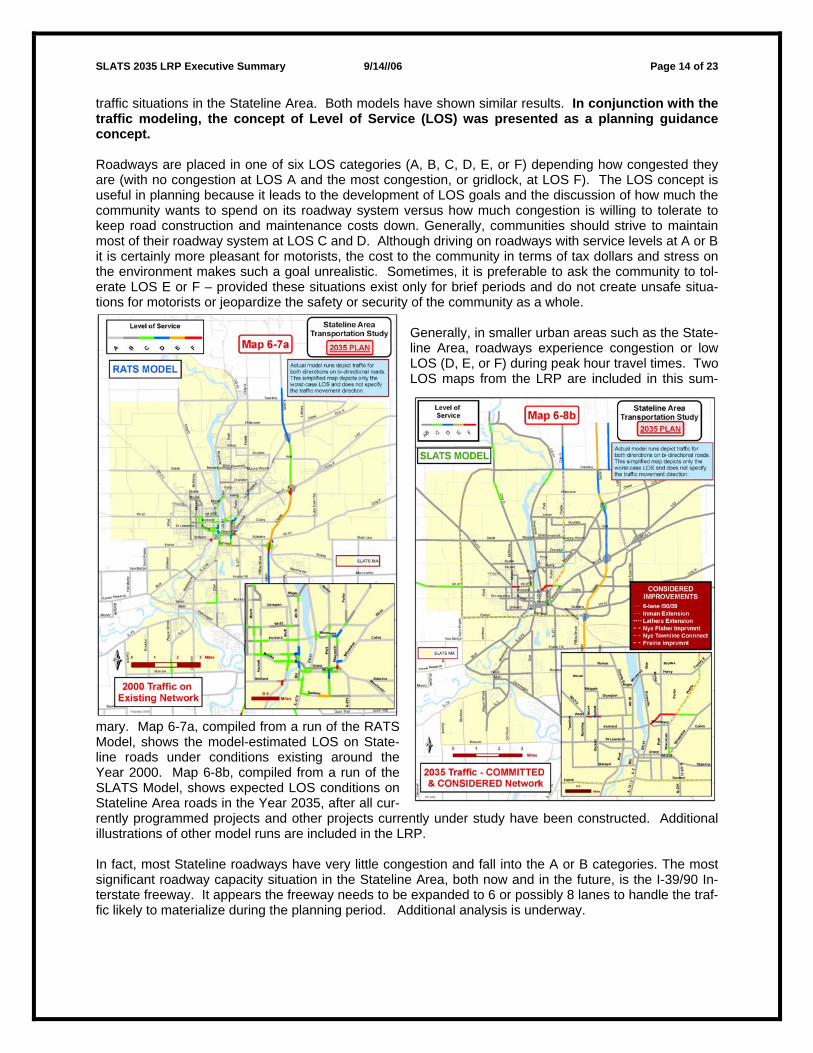
traffic situations in the Stateline Area. Both models have shown similar results. In conjunction with the traffic modeling, the concept of Level of Service (LOS) was presented as a planning guidance concept. Roadways are placed in one of six LOS categories (A, B, C, D, E, or F) depending how congested they are (with no congestion at LOS A and the most congestion, or gridlock, at LOS F). The LOS concept is useful in planning because it leads to the development of LOS goals and the discussion of how much the community wants to spend on its roadway system versus how much congestion is willing to tolerate to keep road construction and maintenance costs down. Generally, communities should strive to maintain most of their roadway system at LOS C and D. Although driving on roadways with service levels at A or B it is certainly more pleasant for motorists, the cost to the community in terms of tax dollars and stress on the environment makes such a goal unrealistic. Sometimes, it is preferable to ask the community to tol-erate LOS E or F – provided these situations exist only for brief periods and do not create unsafe situa-tions for motorists or jeopardize the safety or security of the community as a whole.
Generally, in smaller urban areas such as the State-line Area, roadways experience congestion or low LOS (D, E, or F) during peak hour travel times. Two LOS maps from the LRP are included in this sum-
mary. Map 6-7a, compiled from a run of the RATS Model, shows the model-estimated LOS on State-line roads under conditions existing around the Year 2000. Map 6-8b, compiled from a run of the SLATS Model, shows expected LOS conditions on Stateline Area roads in the Year 2035, after all cur-rently programmed projects and other projects currently under study have been constructed. Additional illustrations of other model runs are included in the LRP. In fact, most Stateline roadways have very little congestion and fall into the A or B categories. The most significant roadway capacity situation in the Stateline Area, both now and in the future, is the I-39/90 In-terstate freeway. It appears the freeway needs to be expanded to 6 or possibly 8 lanes to handle the traf-fic likely to materialize during the planning period. Additional analysis is underway.
SLATS 2035 LRP Executive Summary 9/14/06 Page 15 of 23
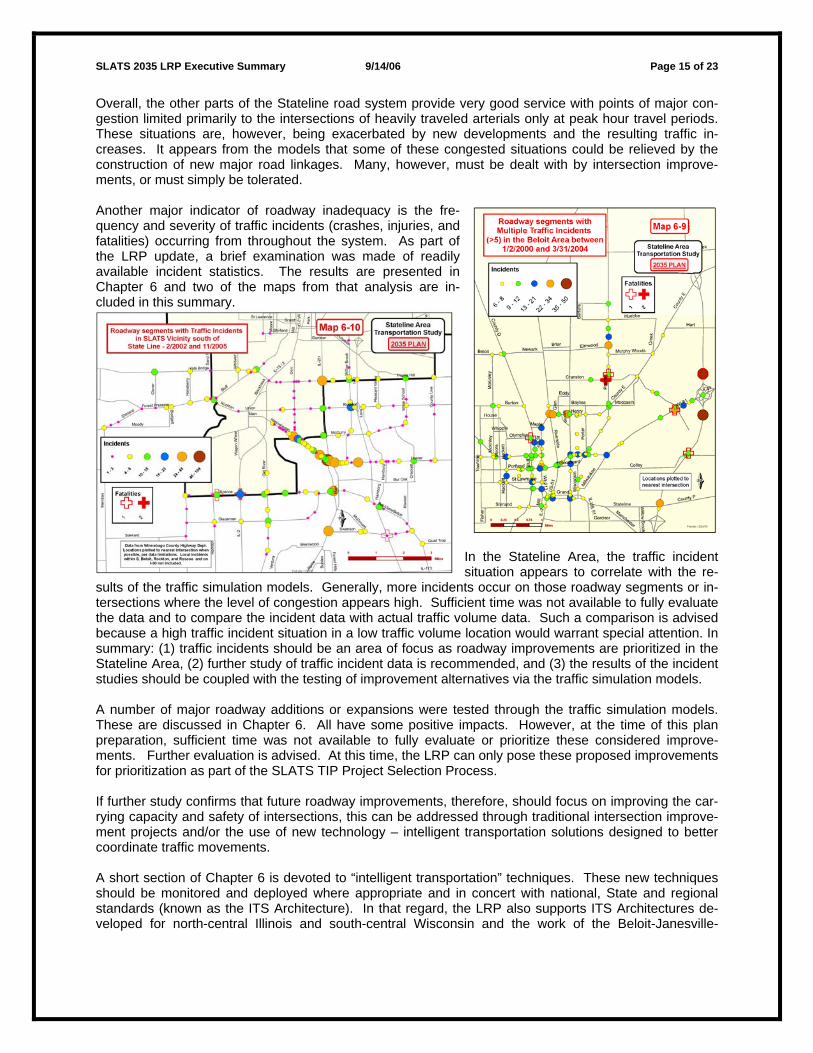
Overall, the other parts of the Stateline road system provide very good service with points of major con-gestion limited primarily to the intersections of heavily traveled arterials only at peak hour travel periods. These situations are, however, being exacerbated by new developments and the resulting traffic in-creases. It appears from the models that some of these congested situations could be relieved by the construction of new major road linkages. Many, however, must be dealt with by intersection improve-ments, or must simply be tolerated. Another major indicator of roadway inadequacy is the fre-quency and severity of traffic incidents (crashes, injuries, and fatalities) occurring from throughout the system. As part of the LRP update, a brief examination was made of readily available incident statistics. The results are presented in Chapter 6 and two of the maps from that analysis are in-cluded in this summary.
In the Stateline Area, the traffic incident situation appears to correlate with the re-
sults of the traffic simulation models. Generally, more incidents occur on those roadway segments or in-tersections where the level of congestion appears high. Sufficient time was not available to fully evaluate the data and to compare the incident data with actual traffic volume data. Such a comparison is advised because a high traffic incident situation in a low traffic volume location would warrant special attention. In summary: (1) traffic incidents should be an area of focus as roadway improvements are prioritized in the Stateline Area, (2) further study of traffic incident data is recommended, and (3) the results of the incident studies should be coupled with the testing of improvement alternatives via the traffic simulation models. A number of major roadway additions or expansions were tested through the traffic simulation models. These are discussed in Chapter 6. All have some positive impacts. However, at the time of this plan preparation, sufficient time was not available to fully evaluate or prioritize these considered improve-ments. Further evaluation is advised. At this time, the LRP can only pose these proposed improvements for prioritization as part of the SLATS TIP Project Selection Process. If further study confirms that future roadway improvements, therefore, should focus on improving the car-rying capacity and safety of intersections, this can be addressed through traditional intersection improve-ment projects and/or the use of new technology – intelligent transportation solutions designed to better coordinate traffic movements. A short section of Chapter 6 is devoted to “intelligent transportation” techniques. These new techniques should be monitored and deployed where appropriate and in concert with national, State and regional standards (known as the ITS Architecture). In that regard, the LRP also supports ITS Architectures de-veloped for north-central Illinois and south-central Wisconsin and the work of the Beloit-Janesville-
SLATS 2035 LRP Executive Summary 9/14//06 Page 16 of 23
Rockford Arterial Management Workgroup (in particular, the Interstate Alternative Route Operations Guide, recently developed). Other ITS-related efforts supported by the Plan include efforts toward:
1. A Traffic Management and Maintenance Control Center to coordinate incident response. 2. An Interstate Traffic Monitoring and Traveler Information system. 3. Advanced Signal Operations/Coordination and Street Traffic Monitoring efforts. 4. Agency Data Sharing. 5. Winter Weather Maintenance Enhancement. 6. Arterial Dynamic Message Signs and Dynamic Trailblazer Signing. 7. Construction Work Zone Safety, Traffic Monitoring and Traveler Information. 8. Advance Rail Crossing Notification System. 9. Supplemental Emergency Vehicle Traffic Signal Preemption.
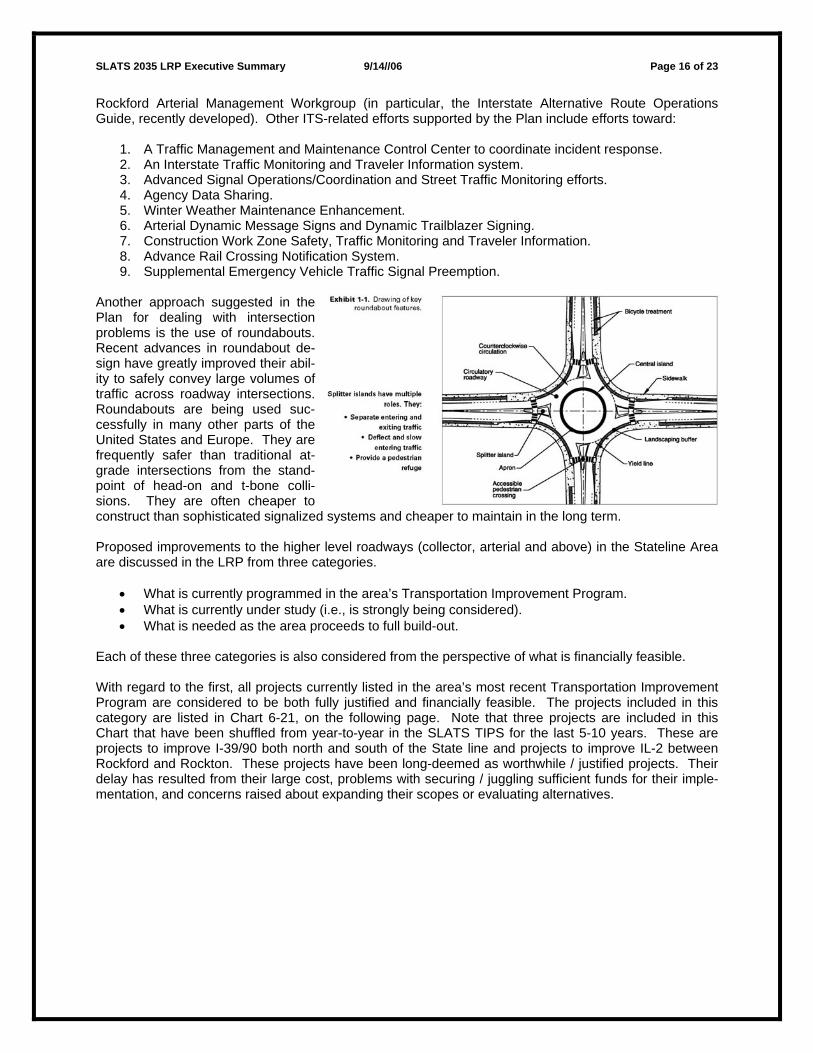
Another approach suggested in the Plan for dealing with intersection problems is the use of roundabouts. Recent advances in roundabout de-sign have greatly improved their abil-ity to safely convey large volumes of traffic across roadway intersections. Roundabouts are being used suc-cessfully in many other parts of the United States and Europe. They are frequently safer than traditional at-grade intersections from the stand-point of head-on and t-bone colli-sions. They are often cheaper to construct than sophisticated signalized systems and cheaper to maintain in the long term. Proposed improvements to the higher level roadways (collector, arterial and above) in the Stateline Area are discussed in the LRP from three categories.
• What is currently programmed in the area’s Transportation Improvement Program. • What is currently under study (i.e., is strongly being considered). • What is needed as the area proceeds to full build-out.
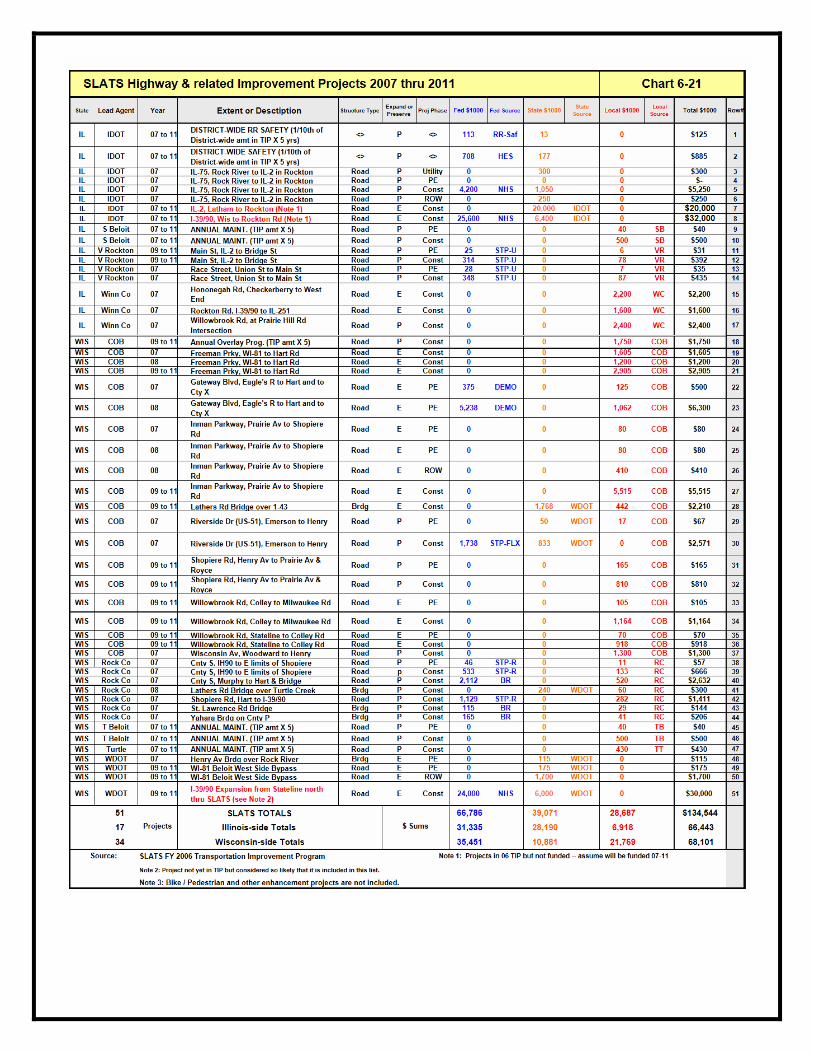
Each of these three categories is also considered from the perspective of what is financially feasible. With regard to the first, all projects currently listed in the area’s most recent Transportation Improvement Program are considered to be both fully justified and financially feasible. The projects included in this category are listed in Chart 6-21, on the following page. Note that three projects are included in this Chart that have been shuffled from year-to-year in the SLATS TIPS for the last 5-10 years. These are projects to improve I-39/90 both north and south of the State line and projects to improve IL-2 between Rockford and Rockton. These projects have been long-deemed as worthwhile / justified projects. Their delay has resulted from their large cost, problems with securing / juggling sufficient funds for their imple-mentation, and concerns raised about expanding their scopes or evaluating alternatives.
SLATS 2035 LRP Executive Summary 9/14/06 Page 17 of 23
SLATS 2035 LRP Executive Summary 9/14//06 Page 18 of 23
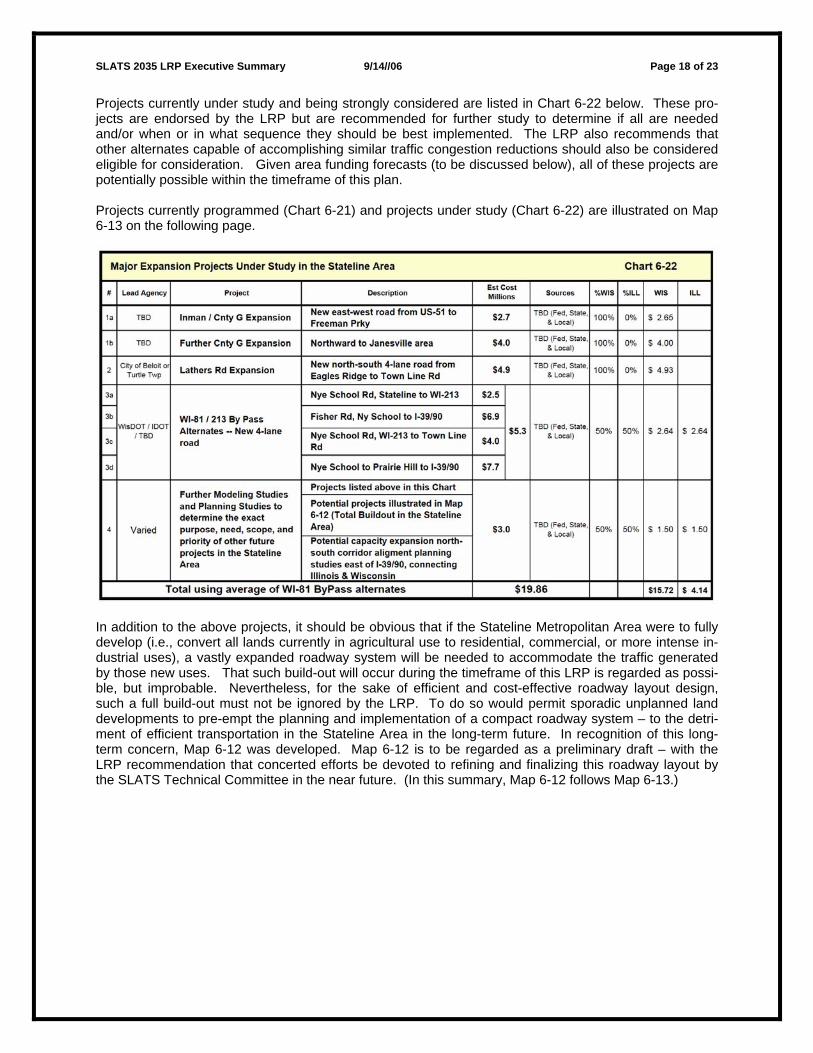
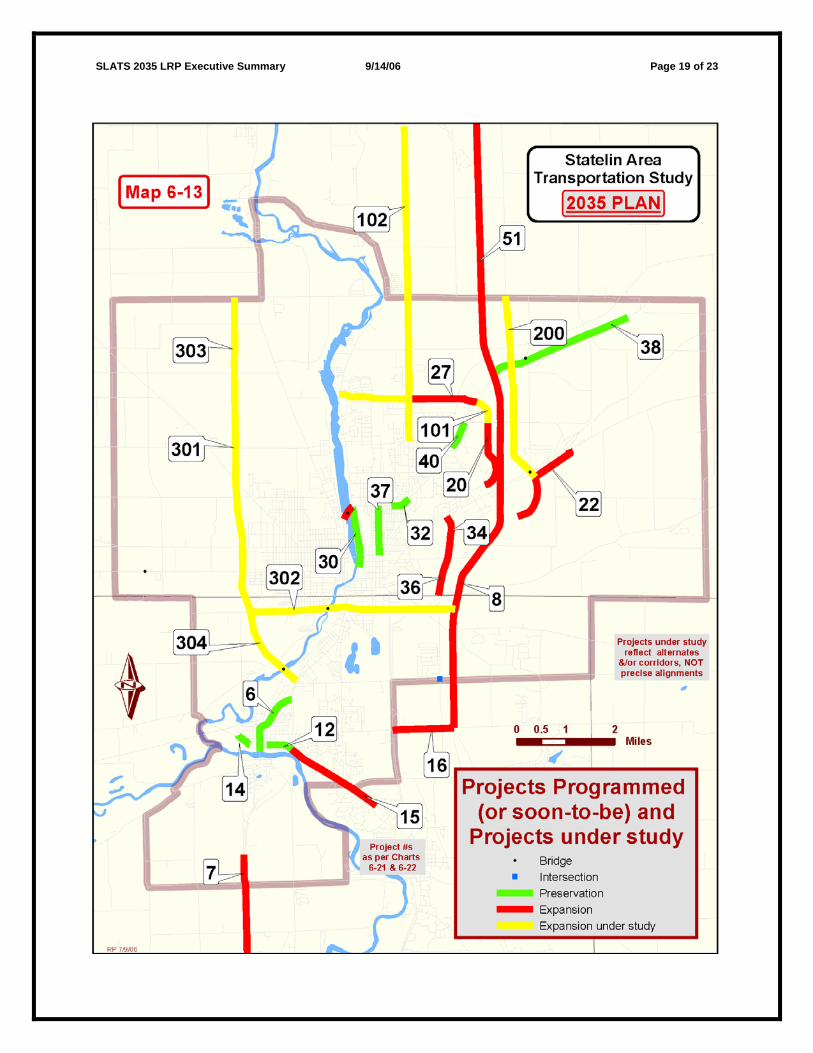
Projects currently under study and being strongly considered are listed in Chart 6-22 below. These pro-jects are endorsed by the LRP but are recommended for further study to determine if all are needed and/or when or in what sequence they should be best implemented. The LRP also recommends that other alternates capable of accomplishing similar traffic congestion reductions should also be considered eligible for consideration. Given area funding forecasts (to be discussed below), all of these projects are potentially possible within the timeframe of this plan. Projects currently programmed (Chart 6-21) and projects under study (Chart 6-22) are illustrated on Map 6-13 on the following page.
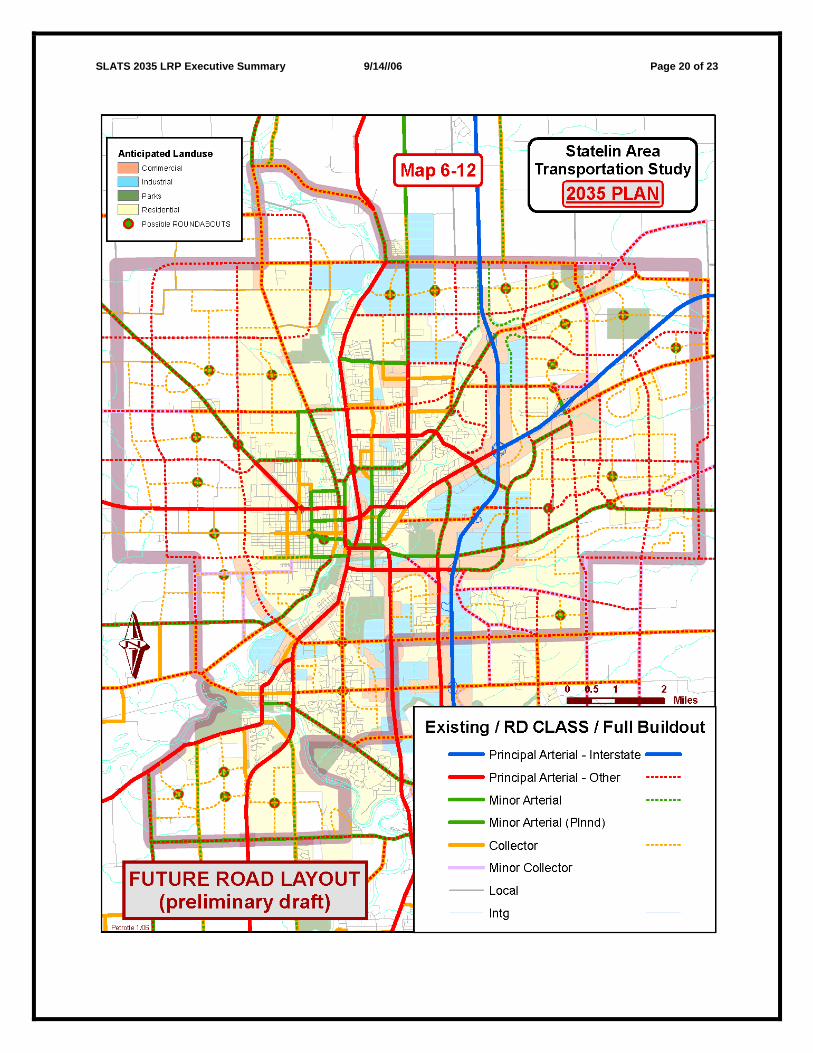
In addition to the above projects, it should be obvious that if the Stateline Metropolitan Area were to fully develop (i.e., convert all lands currently in agricultural use to residential, commercial, or more intense in-dustrial uses), a vastly expanded roadway system will be needed to accommodate the traffic generated by those new uses. That such build-out will occur during the timeframe of this LRP is regarded as possi-ble, but improbable. Nevertheless, for the sake of efficient and cost-effective roadway layout design, such a full build-out must not be ignored by the LRP. To do so would permit sporadic unplanned land developments to pre-empt the planning and implementation of a compact roadway system – to the detri-ment of efficient transportation in the Stateline Area in the long-term future. In recognition of this long-term concern, Map 6-12 was developed. Map 6-12 is to be regarded as a preliminary draft – with the LRP recommendation that concerted efforts be devoted to refining and finalizing this roadway layout by the SLATS Technical Committee in the near future. (In this summary, Map 6-12 follows Map 6-13.)
SLATS 2035 LRP Executive Summary 9/14/06 Page 19 of 23
SLATS 2035 LRP Executive Summary 9/14//06 Page 20 of 23
SLATS 2035 LRP Executive Summary 9/14/06 Page 21 of 23
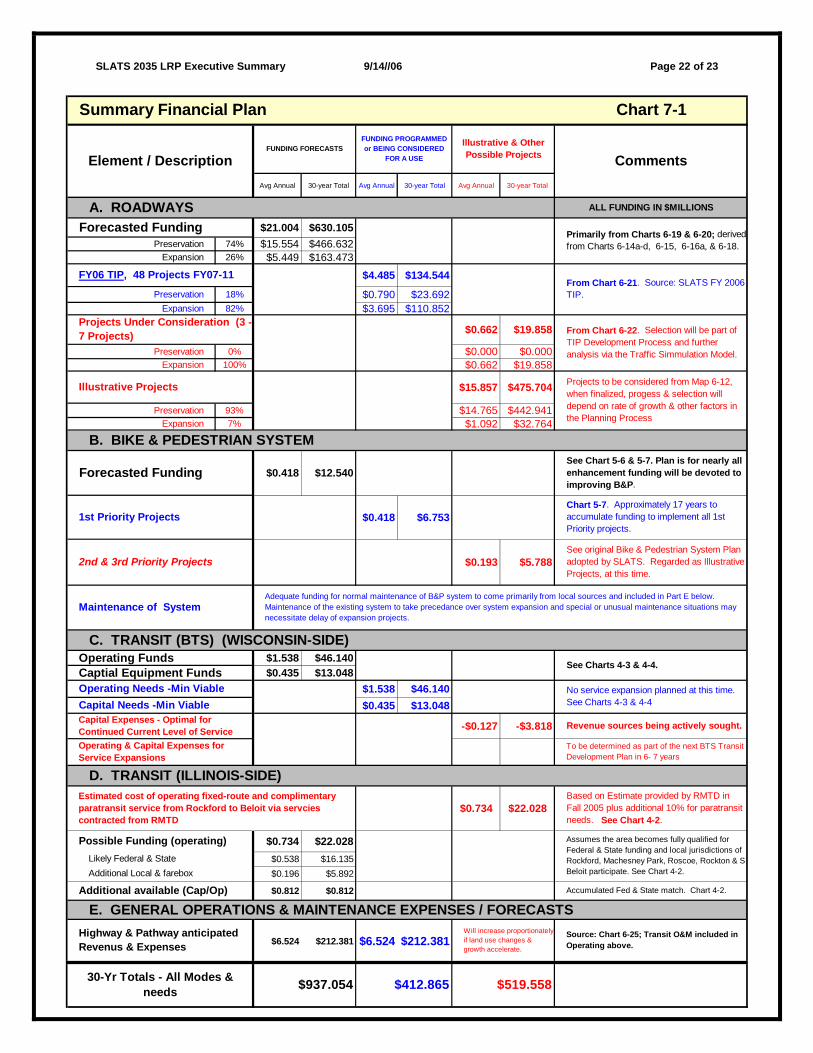
In accordance with Federal guidelines, a Financial Element must be developed that indicates what parts of the LRP are implementable given reasonable expected funding during the term of the plan. Extensive efforts were put forth as part of Chapter 6 to determine the funding likely to be available. This was then compared to the projects programmed and the projects under study. The conclusion of this analysis is that all projects programmed and under study are implementatble. Projects suggested under full build-out (Map 6-12) were not fully scoped or cost-estimated. Many of the build-out projects (at the collector road level) will be borne by developers as part of the cost of development. Additional arterial improve-ments will be scoped and cost-estimated after Map 6-12 is refined and finalized or if and when their need becomes more apparent. It is also important to note that the LRP recognizes the need to adequately and cost-effectively maintain and operated its existing transportation system. Long term maintenance and short-term operation and maintenance are considered to have priority over system expansion. This is reflected in the Summary Financial Plan (on the following page). Also reflected in the Summary Financial Plan are the financial aspects of the Bike & Pedestrian and Transit Elements of the LRP.
SLATS 2035 LRP Executive Summary 9/14//06 Page 22 of 23
Avg Annual 30-year Total Avg Annual 30-year Total Avg Annual 30-year Total
$21.004 $630.105Preservation 74% $15.554 $466.632
Expansion 26% $5.449 $163.473
$4.485 $134.544
Preservation 18% $0.790 $23.692Expansion 82% $3.695 $110.852
$0.662 $19.858
Preservation 0% $0.000 $0.000Expansion 100% $0.662 $19.858
$15.857 $475.704
Preservation 93% $14.765 $442.941Expansion 7% $1.092 $32.764
$0.418 $12.540
$0.418 $6.753
$0.193 $5.788
$1.538 $46.140$0.435 $13.048
$1.538 $46.140$0.435 $13.048
-$0.127 -$3.818
$0.734 $22.028
$0.734 $22.028$0.538 $16.135$0.196 $5.892
$0.812 $0.812
$6.524 $212.381 $6.524 $212.381Will increase proportionately if land use changes & growth accelerate.
Additional available (Cap/Op)Additional Local & farebox
Estimated cost of operating fixed-route and complimentary paratransit service from Rockford to Beloit via servcies contracted from RMTD
Chart 7-1
Accumulated Fed & State match. Chart 4-2.
D. TRANSIT (ILLINOIS-SIDE)
B. BIKE & PEDESTRIAN SYSTEM
C. TRANSIT (BTS) (WISCONSIN-SIDE)
No service expansion planned at this time. See Charts 4-3 & 4-4
Possible Funding (operating) Assumes the area becomes fully qualified for Federal & State funding and local jurisdictions of Rockford, Machesney Park, Roscoe, Rockton & S Beloit participate. See Chart 4-2.
Likely Federal & State
See Charts 4-3 & 4-4.
Based on Estimate provided by RMTD in Fall 2005 plus additional 10% for paratransit needs. See Chart 4-2.
Capital Needs -Min ViableCapital Expenses - Optimal for Continued Current Level of ServiceOperating & Capital Expenses for Service Expansions
To be determined as part of the next BTS Transit Development Plan in 6- 7 years
Revenue sources being actively sought.
Operating Needs -Min Viable
$412.865 $519.558
2nd & 3rd Priority Projects
Captial Equipment Funds
30-Yr Totals - All Modes & needs $937.054
E. GENERAL OPERATIONS & MAINTENANCE EXPENSES / FORECASTSSource: Chart 6-25; Transit O&M included in Operating above.
Highway & Pathway anticipated Revenus & Expenses
See original Bike & Pedestrian System Plan adopted by SLATS. Regarded as Illustrative Projects, at this time.
Maintenance of SystemAdequate funding for normal maintenance of B&P system to come primarily from local sources and included in Part E below. Maintenance of the existing system to take precedance over system expansion and special or unusual maintenance situations may necessitate delay of expansion projects.
Operating Funds
See Chart 5-6 & 5-7. Plan is for nearly all enhancement funding will be devoted to improving B&P.
1st Priority ProjectsChart 5-7. Approximately 17 years to accumulate funding to implement all 1st Priority projects.
Forecasted Funding
Illustrative Projects
FY06 TIP, 48 Projects FY07-11From Chart 6-21. Source: SLATS FY 2006 TIP.
Projects Under Consideration (3 -7 Projects) From Chart 6-22. Selection will be part of
TIP Development Process and further analysis via the Traffic Simmulation Model.
Projects to be considered from Map 6-12, when finalized, progess & selection will depend on rate of growth & other factors in the Planning Process
Comments
A. ROADWAYSForecasted Funding Primarily from Charts 6-19 & 6-20; derived
from Charts 6-14a-d, 6-15, 6-16a, & 6-18.
ALL FUNDING IN $MILLIONS
Summary Financial Plan
Element / DescriptionFUNDING FORECASTS
FUNDING PROGRAMMED or BEING CONSIDERED
FOR A USE
Illustrative & Other Possible Projects
SLATS 2035 LRP Executive Summary 9/14/06 Page 23 of 23
OTHER ITEMS OF THE LRP DESERVING SPECIAL MENTION IN THIS SUMMARY INCLUDE PUBLIC PARTICIPATION, ENVIRONMENTAL JUSTICE, AND ENVIRONMENTAL AWARENESS. While the SLATS Policy and Technical Committees will make the final decisions, these committees ac-tively seek public involvement in the transportation planning process concerning programs, projects, and activities in general. The public is encouraged to be fully integrated into the decision making process, and is given the opportunity for early and continuous participation in the development of the Long-Range Plan and significant strategies and policies.
It is the policy of SLATS through the Public Participation Plan (PIP) adopted March 14, 2005, to assure there is a broad range of public information and participation opportunities available. The PIP addresses:
The dissemination of proposals and alternatives, A process for written and oral comments, Public meetings after official notice, Settings to encourage open discussion, Communication programs incorporating education and outreach activities, Information services, and Consideration of and response to public comments.
The intent of the PIP is to include all the citizens of the region as possible in the process of setting goals, establishing policy, planning long and short-range agendas, and evaluating the achievements of SLATS. As people become more involved by offering ideas, sharing in the development of proposals and pro-grams, and assisting in the decision making process, they will be inclined to accept ownership and under-standing of these policies, plans, programs, and projects. This is what is referred to as “context friendly solutions” and should result in greater public acceptance of the SLATS recommendations and decisions.
As recognized and adopted through the SLATS PIP, federal law requires that the public be: 1) offered the opportunity, and 2) encouraged to become involved in the SLATS planning activities and in particular the development of the Long-Range Plan.
Also, the laws and guidelines pertaining to “Environmental Justice” are recognized and adopted by SLATS in the PIP and the LRP. Programs, policies, and activities that have disproportionately high and adverse human health or environmental impacts on minority and low-income populations are not appro-priate. The projects, programs, and policies of the LRP must also benefit proportionately, over time, the more disadvantaged segments of the population of the Stateline Area.
Proactive public involvement is critical in addressing all these issues since transportation investment de-cisions and policies have far-reaching effects. Planning decisions, such as those found in the SLATS documents including the LRP, require that SLATS considers a wide variety of factors, many of which re-flect community values and are not easily quantifiable. Public input assists the MPO in identifying those community values such as preserving the environment and addressing economic concerns, as well as identifying specific transportation needs and problems.
Public involvement goals and objectives affect the SLATS choice of techniques and the level of public involvement found in this plan. Those choices will, in turn, send a message to the public on how the MPO wants to be seen and viewed as a public body. The Stateline Area Transportation Study involves the par-ticipation of interest groups, organizations, governments, and citizens to build a consensus for addressing area-wide and regional transportation issues. In the near future, the Public Involvement Plan of SLATS will be expanded even further to include all people, groups, and stakeholders recognized by the new Fed-eral guidelines put forth in accordance with SAFETEA-LU. Finally, conservation of the area’s natural resources and natural environment is important to the Stateline community and recognized in the LRP. Preservation of irreplaceable natural resources that are essential parts of the area’s natural ecosystem must be considered in the transportation planning process. Future transportation improvements will not be planned or programmed without consultation with area entities supporting the protection of the natural environment. The selection of transportation projects will consider the effects to the human and natural environment. To address environmental concerns, project scope changes and/or mitigation efforts may be applied.