2023-2031 Regional Housing Needs Assessment (RHNA) Appeal ...
68
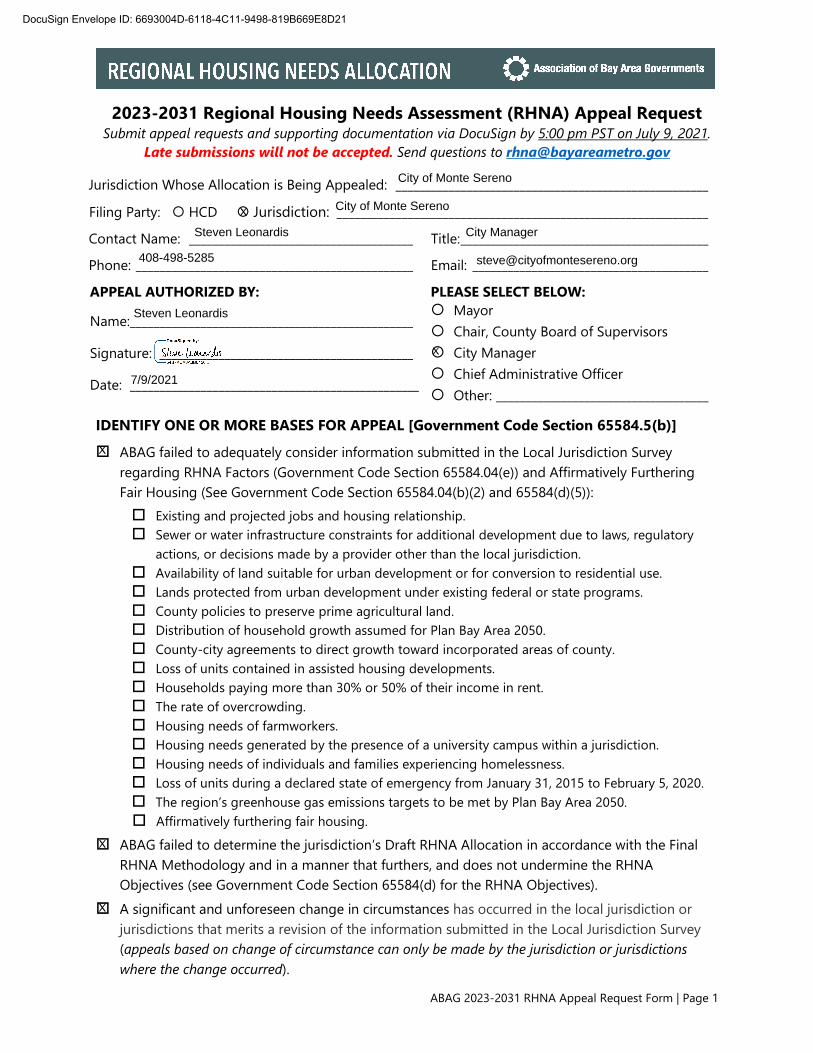
ABAG 2023-2031 RHNA Appeal Request Form | Page 1 2023-2031 Regional Housing Needs Assessment (RHNA) Appeal Request Submit appeal requests and supporting documentation via DocuSign by 5:00 pm PST on July 9, 2021. Late submissions will not be accepted. Send questions to [email protected] Jurisdiction Whose Allocation is Being Appealed: _____________________________________________________ Filing Party: HCD Jurisdiction: _______________________________________________________________ Contact Name: ______________________________________ Title:__________________________________________ Phone: _______________________________________________ Email: ________________________________________ APPEAL AUTHORIZED BY: Name:________________________________________________ Signature: ___________________________________________ Date: _________________________________________________ PLEASE SELECT BELOW: Mayor Chair, County Board of Supervisors City Manager Chief Administrative Officer Other: ____________________________________ IDENTIFY ONE OR MORE BASES FOR APPEAL [Government Code Section 65584.5(b)] ABAG failed to adequately consider information submitted in the Local Jurisdiction Survey regarding RHNA Factors (Government Code Section 65584.04(e)) and Affirmatively Furthering Fair Housing (See Government Code Section 65584.04(b)(2) and 65584(d)(5)): Existing and projected jobs and housing relationship. Sewer or water infrastructure constraints for additional development due to laws, regulatory actions, or decisions made by a provider other than the local jurisdiction. Availability of land suitable for urban development or for conversion to residential use. Lands protected from urban development under existing federal or state programs. County policies to preserve prime agricultural land. Distribution of household growth assumed for Plan Bay Area 2050. County-city agreements to direct growth toward incorporated areas of county. Loss of units contained in assisted housing developments. Households paying more than 30% or 50% of their income in rent. The rate of overcrowding. Housing needs of farmworkers. Housing needs generated by the presence of a university campus within a jurisdiction. Housing needs of individuals and families experiencing homelessness. Loss of units during a declared state of emergency from January 31, 2015 to February 5, 2020. The region’s greenhouse gas emissions targets to be met by Plan Bay Area 2050. Affirmatively furthering fair housing. ABAG failed to determine the jurisdiction’s Draft RHNA Allocation in accordance with the Final RHNA Methodology and in a manner that furthers, and does not undermine the RHNA Objectives (see Government Code Section 65584(d) for the RHNA Objectives). A significant and unforeseen change in circumstances has occurred in the local jurisdiction or jurisdictions that merits a revision of the information submitted in the Local Jurisdiction Survey (appeals based on change of circumstance can only be made by the jurisdiction or jurisdictions where the change occurred). DocuSign Envelope ID: 6693004D-6118-4C11-9498-819B669E8D21 X [email protected] Steven Leonardis 408-498-5285 X City of Monte Sereno City Manager X City of Monte Sereno X Steven Leonardis 7/9/2021 X
Transcript of 2023-2031 Regional Housing Needs Assessment (RHNA) Appeal ...
ABAG 2023-2031 RHNA Appeal Request Form | Page 1
2023-2031 Regional Housing Needs Assessment (RHNA) Appeal Request Submit appeal requests and supporting documentation via DocuSign by 5:00 pm PST on July 9, 2021.
Late submissions will not be accepted. Send questions to [email protected]
Jurisdiction Whose Allocation is Being Appealed: _____________________________________________________
Filing Party: HCD Jurisdiction: _______________________________________________________________
Contact Name: ______________________________________ Title: __________________________________________
Phone: _______________________________________________ Email: ________________________________________
APPEAL AUTHORIZED BY:
Name: ________________________________________________
Signature: ___________________________________________
Date: _________________________________________________
PLEASE SELECT BELOW: Mayor Chair, County Board of Supervisors City Manager Chief Administrative Officer Other: ____________________________________
IDENTIFY ONE OR MORE BASES FOR APPEAL [Government Code Section 65584.5(b)]
ABAG failed to adequately consider information submitted in the Local Jurisdiction Survey regarding RHNA Factors (Government Code Section 65584.04(e)) and Affirmatively Furthering Fair Housing (See Government Code Section 65584.04(b)(2) and 65584(d)(5)): Existing and projected jobs and housing relationship. Sewer or water infrastructure constraints for additional development due to laws, regulatory
actions, or decisions made by a provider other than the local jurisdiction. Availability of land suitable for urban development or for conversion to residential use. Lands protected from urban development under existing federal or state programs. County policies to preserve prime agricultural land. Distribution of household growth assumed for Plan Bay Area 2050. County-city agreements to direct growth toward incorporated areas of county. Loss of units contained in assisted housing developments. Households paying more than 30% or 50% of their income in rent. The rate of overcrowding. Housing needs of farmworkers. Housing needs generated by the presence of a university campus within a jurisdiction. Housing needs of individuals and families experiencing homelessness. Loss of units during a declared state of emergency from January 31, 2015 to February 5, 2020. The region’s greenhouse gas emissions targets to be met by Plan Bay Area 2050. Affirmatively furthering fair housing.
ABAG failed to determine the jurisdiction’s Draft RHNA Allocation in accordance with the Final RHNA Methodology and in a manner that furthers, and does not undermine the RHNA Objectives (see Government Code Section 65584(d) for the RHNA Objectives).
A significant and unforeseen change in circumstances has occurred in the local jurisdiction or jurisdictions that merits a revision of the information submitted in the Local Jurisdiction Survey (appeals based on change of circumstance can only be made by the jurisdiction or jurisdictions where the change occurred).
DocuSign Envelope ID: 6693004D-6118-4C11-9498-819B669E8D21
X
Steven Leonardis
408-498-5285
X City of Monte Sereno
City Manager
X
City of Monte Sereno
X
Steven Leonardis
7/9/2021
X

ABAG 2023-2031 RHNA Appeal Request Form | Page 2
Pursuant to Government Code Section 65584.05, appeals shall be based upon comparable data available for all affected jurisdictions and accepted planning methodology, and supported by adequate documentation, and shall include a statement as to why the revision is necessary to further the intent of the objectives listed in Government Code Section 65584(d). An appeal shall be consistent with, and not to the detriment of, the development pattern in the sustainable communities strategy (Plan Bay Area 2050 Final Blueprint). Number of units requested to be reduced or added to jurisdiction’s Draft RHNA Allocation:
Decrease Number of Units: ___________ Increase Number of Units: __________ Brief description of appeal request and statement on why this revision is necessary to further the intent of the objectives listed in Government Code Section 65584(d) and how the revision is consistent with, and not to the detriment, of the development pattern in Plan Bay Area 2050. Please include supporting documentation for evidence as needed, and attach additional pages if you need more room.
List of supporting documentation, by title and number of pages
1. ___________________________________________________________________________________________________
2. ___________________________________________________________________________________________________
3. ___________________________________________________________________________________________________
The maximum file size is 25MB. To submit larger files, please contact [email protected].
Click here to attach files
DocuSign Envelope ID: 6693004D-6118-4C11-9498-819B669E8D21
(Click here)
97
City of Monte Sereno Appeal of Draft 2023-2031 Regional Housing Needs Assessment Allocation
X
On May 20, 2021, the ABAG Executive Board approved its final regional housing needsallocation (RHNA) methodology and draft RHNA for Bay Area jurisdictions. The methodologyand draft allocation were published in a document entitled: Draft Regional Housing NeedsAllocation (RHNA) Plan: San Francisco Bay Area, 2023-2031 (Association of Bay Area Government,May 2021). According to the draft plan, local jurisdictions may file an appeal to their RHNA inthe summer of 2021.Per Government Code §65584 et. seq., the City of Monte Sereno is hereby appealing its RHNAfor the planning period 2023 through 2031. The primary reason for Monte Sereno’s appeal is asignificant RHNA increase from 61 unit in the 2015-2023 planning period to 193 units in the2023-2031 planning period—an increase of over 300 percent. While Monte Sereno’s housingallocation is the smallest by percent of the total RHNA for all the jurisdictions in Santa ClaraCounty, this more than 300 percent increase is beyond the capabilities of Monte Sereno’s citygovernment to accommodate. Monte Sereno also challenges the methodology used to allocatehousing in that it violates the express purpose of the code to meaningfully increase the stock ofhousing and provide the buildout of low- and moderate-income housing. The full basis forMonte Sereno’s appeal is discussed in the next section.

July 7, 2021
Therese McMillan ABAG/MTC Executive Director Bay Area Metro Center 375 Beale Street San Francisco, CA 94105 Subject: City of Monte Sereno Appeal of Draft 2023-2031 Regional Housing Needs Assessment
Allocation Dear Ms. McMillan:
On behalf of the City of Monte Sereno, the Monte Sereno City Council hereby submits an appeal to the Association of Bay Area Governments (ABAG) of the Draft 2023-2031 Regional Housing Needs Assessment (RHNA) Allocation.
BACKGROUND On May 20, 2021, the ABAG Executive Board approved its final regional housing needs allocation (RHNA) methodology and draft RHNA for Bay Area jurisdictions. The methodology and draft allocation were published in a document entitled: Draft Regional Housing Needs Allocation (RHNA) Plan: San Francisco Bay Area, 2023-2031 (Association of Bay Area Government, May 2021). According to the draft plan, local jurisdictions may file an appeal to their RHNA in the summer of 2021.
Per Government Code §65584 et. seq., the City of Monte Sereno is hereby appealing its RHNA for the planning period 2023 through 2031. The primary reason for Monte Sereno’s appeal is a significant RHNA increase from 61 unit in the 2015-2023 planning period to 193 units in the 2023-2031 planning period—an increase of over 300 percent. While Monte Sereno’s housing allocation is the smallest by percent of the total RHNA for all the jurisdictions in Santa Clara County, this more than 300 percent increase is beyond the capabilities of Monte Sereno’s city government to accommodate. Monte Sereno also challenges the methodology used to allocate housing in that it violates the express purpose of the code to meaningfully increase the stock of
18041 Saratoga-Los Gatos Road Monte Sereno, California 95030-4299
Telephone: 408.354.7635 Fax: 408.395.7653
www.cityofmontesereno.org Shawn Leuthold, Mayor | Javed I. Ellahie, Mayor Pro Tempore | Liz Lawler | Rowena Turner | Bryan Mekechuk
DocuSign Envelope ID: 6693004D-6118-4C11-9498-819B669E8D21

Monte Sereno RHNA Appeal July 7, 2021 Page 2 housing and provide the buildout of low- and moderate-income housing. The full basis for Monte Sereno’s appeal is discussed in the next section.
Table 1, Monte Sereno RHNA Comparison shows ABAG’s RHNA allocation for Monte Sereno in 2015 and 2023.
Table 1: Monte Sereno RHNA Comparison (2015 and 2023)
Category 2015-2023 2023-2031 Percent Change Very Low Income 23 53 230%
Low Income 13 30 230%
Moderate Income 13 31 238%
Above-Moderate Income 12 79 658%
Total 61 193 316%
Source: ABAG/MTC; EMC Planning Group Source: Draft Regional Housing Needs Allocation (RHNA) Plan: San Francisco Bay Area, 2023-2031 and 2015-2023
The City of Monte Sereno requests a 50 percent reduction in its RHNA from 193 units to 97 units, assigned as shown in Table 2, Proposed Revised RHNA.
Table 2: Proposed Revised RHNA
Category Draft RHNA Proposed RHNA Very Low Income 53 27
Low Income 30 15
Moderate Income 31 15
Above-Moderate Income 79 40
Total 193 97
Source: Monte Sereno
BASES FOR APPEAL Per Government Code Section 65584.05, any local jurisdiction may file an appeal to modify its Draft Regional Housing Needs Allocation (RHNA). Monte Sereno is appealing its RHNA allocation on the following bases:
DocuSign Envelope ID: 6693004D-6118-4C11-9498-819B669E8D21
Monte Sereno RHNA Appeal July 7, 2021 Page 3
1. ABAG failed to adequately consider the information submitted as part of the local jurisdiction survey (see Government Code Section 65584.04(b)) including Monte Sereno’s existing and projected jobs and housing relationship and the opportunities and constraints to development of additional housing in Monte Sereno.
2. ABAG failed to determine the jurisdiction’s share of the regional housing needs in accordance with the information described in the Final RHNA Methodology approved by ABAG on May 20, 2021, and in a manner that furthers, and does not undermine the five objectives listed in Government Code Section 65584(d).
3. Significant and unforeseen change in circumstance has occurred in the jurisdiction after February 5, 2020 (the deadline for jurisdictions to submit surveys to ABAG) and merits a revision of the information previously submitted by the local jurisdiction. Appeals on this basis shall only be made by the jurisdiction or jurisdictions where the change in circumstances has occurred.
4. The method of allocating housing needs does not conform to the mandate of California Government Code §65584(a)(2), which spells out “. . . the intent of the Legislature that cities, counties, and cities and counties should undertake all necessary actions to encourage, promote, and facilitate the development of housing to accommodate the entire regional housing need, and reasonable actions should be taken by local and regional governments to ensure that future housing production meets, at a minimum, the regional housing need established for planning purposes.” The allocation should have been made at the regional (i.e., county) level rather that at the city level so as to carry out the intent of the Legislature.
Basis #1: ABAG Failed to Consider Local Planning Factors Unique to Monte Sereno that Limit Development.
This section discusses the failures of ABAG to consider unique local factors that limit Monte Sereno’s ability to develop further.
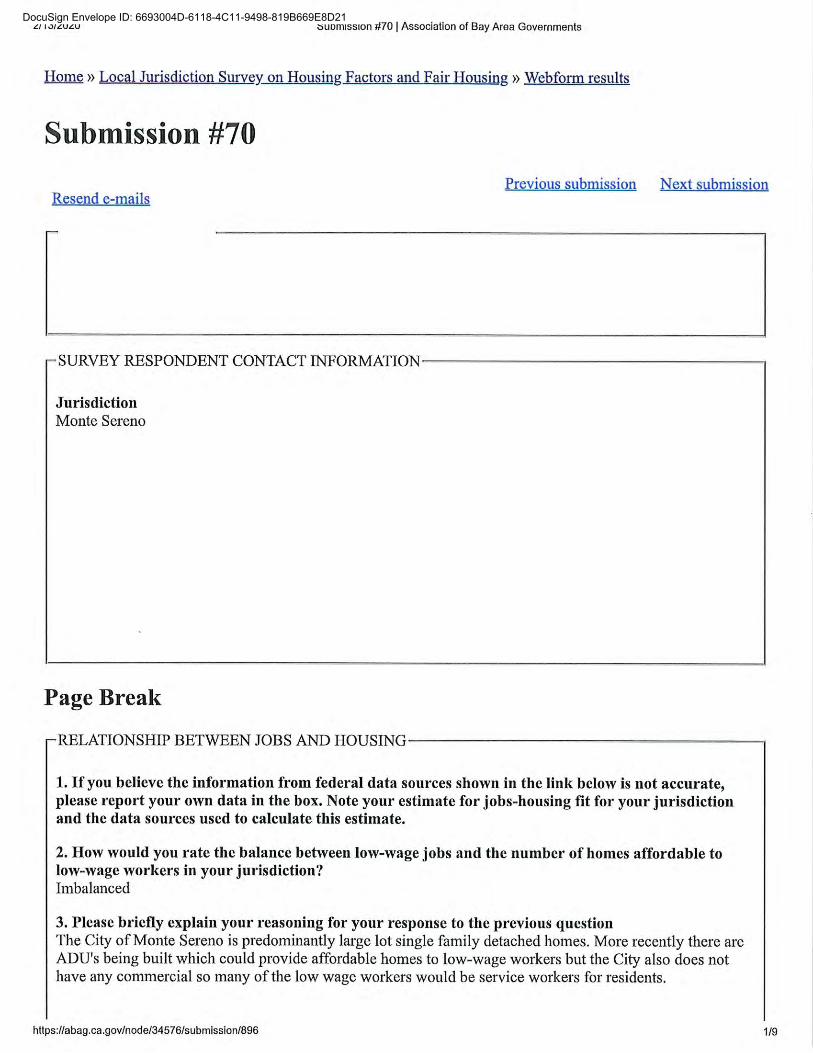
Monte Sereno’s Existing and Projected Jobs/Housing Balance The Association of Bay Area Governments (ABAG) failed to consider information relating to Monte Sereno’s jobs/housing balance. As stated in its response to the Information about Local Planning Factors and Affirmatively Furthering Fair Housing from the Local Jurisdiction Survey
DocuSign Envelope ID: 6693004D-6118-4C11-9498-819B669E8D21

Monte Sereno RHNA Appeal July 7, 2021 Page 4 (included as Attachment A), Monte Sereno does not have the jobs to support the RHNA allocation of units. Simply put: Monte Sereno is a net exporter of workers. Monte Sereno has 1,396 employed residents and 522 jobs, a ratio of jobs-to-resident-workers of 0.37.1
The City of Monte Sereno was chartered in unique fashion to essentially function as one large residential-only district. There are no commercial shopping districts and no mixed-use real estate developments that may be rezoned. The community has one traffic light, one church, and one school, and a very limited jobs base (city services and school only; no commercial jobs). The population of Monte Sereno (approximately 3,500) has increased by less than 2,000 persons since 1960, and since 2010 its population has decreased by 4.1 percent.2
Figure 1, Jobs/Housing Ratio (Monte Sereno, Santa Clara County, and Bay Area), shows the ratio of jobs to households.
Figure 1: Jobs/Housing Ratio (Monte Sereno, Santa Clara County, and Bay Area)
1 Source: “Housing Needs Data Report: Monte Sereno,” ABAG/MTC Staff and Baird + Driskell Community Planning, April 2, 2021. Employed residents in a jurisdiction is counted by place of residence (they may work elsewhere) while jobs in a jurisdiction are counted by place of work (they may live elsewhere). The jobs may differ from those reported in Figure 5 as the source for the time series is from administrative data, while the cross-sectional data is from a survey. 2 This point was highlighted in the calculations in correspondence ABAG recently received from the Contra Costa County Mayors Conference dated October 2, 2020.
DocuSign Envelope ID: 6693004D-6118-4C11-9498-819B669E8D21

Monte Sereno RHNA Appeal July 7, 2021 Page 5 Lack of Transit Access Monte Sereno has poor access to transit services. There are bus stops along Winchester Boulevard (only one of which is in the city limits), and this transit line connects to light rail further north at Winchester Station. Nonetheless, due to the very low-density lot configuration of Monte Sereno, very little of the city is within walking distance of the bus line.
As noted in the “Proposed RHNA Methodology and Subregional Shares: Public Comment on RHNA Methodology and Objection Regarding Proposed Share” included as Attachment B, jobs-rich centers and Vehicle Miles Traveled (VMT) calculations are a contradictory measure when used to determine housing allocation for Monte Sereno. An alternative approach for cities like Monte Sereno would be to add additional objectives or exemptions based on factors like insignificant population, transportation, and, most important, a fair allocation based on our employment base and jobs-creation. Lack of local jobs and public transportation lead to increased VMT, an undesired consequence of RHNA’s best intentions to reduce Green House Gas emissions (GHG).
Availability of Land Suitable for Urban Development According to ABAG’s Housing Element Site Selection (HESS) tool, Monte Sereno has very limited sites for development—seven vacant sites in all. Upon closer inspection, however, of the seven sites identified in the HESS tool, only three sites are available for higher density development due to lack of a sewer connection (septic systems only). Even these sites are surrounded by single-family residential development and configured into small parcels that are inappropriate for affordable, multi-family housing. Figure 2, HESS Site Selection Tool Results for Monte Sereno, illustrates the limited available vacant sites.
DocuSign Envelope ID: 6693004D-6118-4C11-9498-819B669E8D21

Monte Sereno RHNA Appeal July 7, 2021 Page 6 Figure 2: HESS Site Selection Tool Results for Monte Sereno
Wildfire Zones ABAG failed to wholly consider the constraints to development including the availability of land suitable for urban development or for conversion to residential use. Approximately half of Monte Sereno is located within a very high fire hazard area, and even those areas not designated as high fire hazard are subject to wildfire, because one or more large trees are present on practically every lot in the community. Figure 3, Fire Hazard Severity Zones, shows the high fire hazards in the city and surrounding areas.
Only 3 Vacant Sites (shown in red)
DocuSign Envelope ID: 6693004D-6118-4C11-9498-819B669E8D21

Monte Sereno RHNA Appeal July 7, 2021 Page 7
DocuSign Envelope ID: 6693004D-6118-4C11-9498-819B669E8D21
Monte Sereno RHNA Appeal July 7, 2021 Page 8
This side intentionally left blank.
DocuSign Envelope ID: 6693004D-6118-4C11-9498-819B669E8D21

Monte Sereno RHNA Appeal July 7, 2021 Page 9 When houses are built close to forests or other types of natural vegetation, they pose two problems related to wildfires. First, there will be more wildfires due to human ignitions. Second, wildfires that occur will pose a greater risk to lives and homes, they will be hard to fight, and letting natural fires burn becomes impossible. Development in wildland urban interface areas will exacerbate wildfire problems in the future.
Lack of evacuation routes exponentially compounds the risk from natural hazards in Monte Sereno. If a fire comes over the neighboring Santa Cruz Mountains, Highway 9 would likely be affected, which for many is the only way out of Monte Sereno. The primary evacuation route for the community is Saratoga-Los Gatos Road (Highway 9)—a two-lane highway, and according to a report by Hexagon Transportation Consultants, Inc. prepared for the Hacienda Project in 2018, the intersection at North Santa Cruz Avenue and Saratoga-Los Gatos Road operates at a very poor Level of Service E during peak hour3. During an emergency evacuation (e.g., during a wildfire event), this key intersection would be expected to be unpassable for extended periods of time. Those that can get to Highway 17 would encounter an unmoving traffic bottleneck. Highway 17, has experienced tremendous traffic delays because of the additional 40 units being built adjacent to the on ramp at Lark Avenue, and access to this entrance will be completely clogged in an emergency. Adding more housing to the area significantly increases the risk of trapped residents in a wildfire event to an unacceptable level.
Seismic Hazards Monte Sereno is located within the seismically active San Francisco Bay region, one of the most seismically active zones in the United States. The faults in the San Francisco Bay region are capable of generating earthquakes of at least 8.0 in magnitude on the Richter Scale, producing very strong ground shaking in Monte Sereno. The closest major fault is the San Andreas Fault, which passes through Monte Sereno’s SOI southwest of Lyndon Canyon. A portion of Monte Sereno also is near the potentially active Shannon Fault, just north of Monte Sereno in Los Gatos.
Landslides and slope instability are the major geologic hazards in Monte Sereno. The hillside region of the city contains some rock formations conducive to landslides. The landslide zone is also present within the Sphere of Influence. Landslides and unstable slopes may occur in this area and can create hazards within the city as the slide debris and rock move down the incline
3 Hexagon Transportation Consultants, Inc., 2018. “18840 Saratoga-Los Gatos Road Residential Development: Transportation Impact Analysis.”
DocuSign Envelope ID: 6693004D-6118-4C11-9498-819B669E8D21

Monte Sereno RHNA Appeal July 7, 2021 Page 10 toward the city's valley floor. According to the County of Santa Clara, approximately 75 percent of Monte Sereno is located in an area with a high potential for earthquake induced landslides.
Water Supply and Drought
California is experiencing severe drought conditions that are making it increasingly difficult for cities to provide sufficient water supply to customers in their jurisdiction. Monte Sereno is not exempt from drought conditions, and its ability to provide water supplies to new residential development has become progressively constrained. To make matters worse, Anderson Reservoir is off-line for approximately the next decade. As with the other local factors discussed above, the lack of water supply caused by extended drought conditions makes it extremely unlikely that Monte Sereno can meet the draft RHNA numbers. This is discussed further below under Basis #3 (changed circumstances).
__________________________________
Basis #2: ABAG did not determine the jurisdiction’s allocation in accordance with its adopted methodology and in a manner that furthers, and does not undermine, the RHNA objectives identified in Government Code Section 65584(d).
HCD’s Methodology Overestimates Statewide Housing Need According to a report by the Embarcadero Institute (Gab Layton, PhD, 2020), included as Attachment C, Senate Bill 828, co-sponsored by the Bay Area Council and Silicon Valley Leadership Group, and authored by State Senator Scott Wiener in 2018, inadvertently doubled the “Regional Housing Needs Assessment” in California. There are three major problems with the statewide methodology: The methodology makes an incorrect assumption about healthy vacancy rates for owner-occupied housing. The methodology assumes a five percent vacancy rate, which is only applicable to rental housing. The correct healthy rate is approximately 1.5 percent. The methodology incorrectly assumes that the existing housing need was not evaluated as part of the previous RHNA. Finally, the methodology incorrectly assumes that overcrowding was not considered in the Department of Finance projections. Figure 4, Impact of Methodology Errors illustrates the impacts associated with the methodology errors.
DocuSign Envelope ID: 6693004D-6118-4C11-9498-819B669E8D21

Monte Sereno RHNA Appeal July 7, 2021 Page 11 Figure 4: Impact of Methodology Errors
Fails to Meet Jobs/Housing Objective Per Government Code Section 65584 (d), ABAG’s regional housing needs allocation plan shall decrease the jobs/housing balance by providing more affordable housing in those areas where there are jobs: “Promoting an improved intraregional relationship between jobs and housing, including an improved balance between the number of low-wage jobs and the number of housing units affordable to low-wage workers in each jurisdiction.”
According to Government Code Section 65584, “the Legislature finds and declares that insufficient housing in job centers hinders the state’s environmental quality and runs counter to the state’s environmental goals. In particular, when Californians seeking affordable housing are forced to drive longer distances to work, an increased amount of greenhouse gases and other pollutants is released and puts in jeopardy the achievement of the state’s climate goals.”
ABAG’s proposed allocation is contrary to this objective. Based upon the jobs/housing balance, Monte Sereno should have received reduced RHNA allocations, with the other jurisdictions receiving an increased allocation. There are 1,396 employed residents, and 522 jobs in Monte Sereno - the ratio of jobs to resident workers is 0.37; Monte Sereno is a net exporter of workers. New jobs may draw new residents, and when there is high demand for housing relative to
DocuSign Envelope ID: 6693004D-6118-4C11-9498-819B669E8D21

Monte Sereno RHNA Appeal July 7, 2021 Page 12 supply, many workers may be unable to afford to live where they work, particularly where job growth has been in relatively lower wage jobs. This dynamic not only means many workers will need to prepare for long commutes and time spent on the road, but in the aggregate, it contributes to traffic congestion and time lost for all road users.
Fails to Account for Lack of Access to Transit ABAG’s RHNA methodology assigns 15 percent of lower-income housing need to job proximity by transit. Monte Sereno has no meaningful access to public transit. Bus service is minimal, and because of the low-density configuration of lots, most houses are not within a reasonable walking distance to the bus stop. See the discussion above under Basis #1 for a more complete discussion.
__________________________________
Basis #3 Significant and unforeseen change in circumstance has occurred in the jurisdiction after February 5, 2020.
This section describes a significant and unforeseen change in circumstance that has occurred in the jurisdiction after February 5, 2020 (the deadline for jurisdictions to submit surveys to ABAG) and merits a revision of the information previously submitted by the local jurisdiction.
Drought and Wildfire Hazards The fire hazard potential has worsened since the submittal of Monte Sereno’s survey response as the California drought continues. The drought, when combined with the high fire hazard areas and general prevalence of large canopy trees throughout the community, creates a potent hazard to housing densification in Monte Sereno.
For Monte Sereno, a wildfire emergency is a disaster waiting to happen. It is simply the wrong place to add more housing and more dense housing.
Drought and Water Supply Severe and prolonged drought conditions are also affecting Monte Sereno’s ability to supply water to customers in the jurisdiction. In Monte Sereno’s response to the “Local Jurisdiction Survey on Housing Factors and Fair Housing” (see Attachment A), the city listed water supply as an “opportunity,” but this has changed. With the continuing drought, water supply has become a constraint to housing development in Monte Sereno.
DocuSign Envelope ID: 6693004D-6118-4C11-9498-819B669E8D21

Monte Sereno RHNA Appeal July 7, 2021 Page 13
__________________________________
Basis #4 To Satisfy the Intent of the Legislature, Allocation Should be Made on a Regional Basis.
This section discusses ABAG/MTC’s regional methodology and how an allocation made on a regional basis would better satisfy the intent of the Legislature.
Allocation on Regional Basis The housing allocation does not satisfy the intent of the Legislature in that it allocates housing to cities rather than to regions. This has resulted in an allocation based on population head counts (each city is allocated a 10 percent increase to its existing household inventory) rather than an allocation that takes into account the areas where housing can be built to satisfy the needs of low-income and very low-income housing.
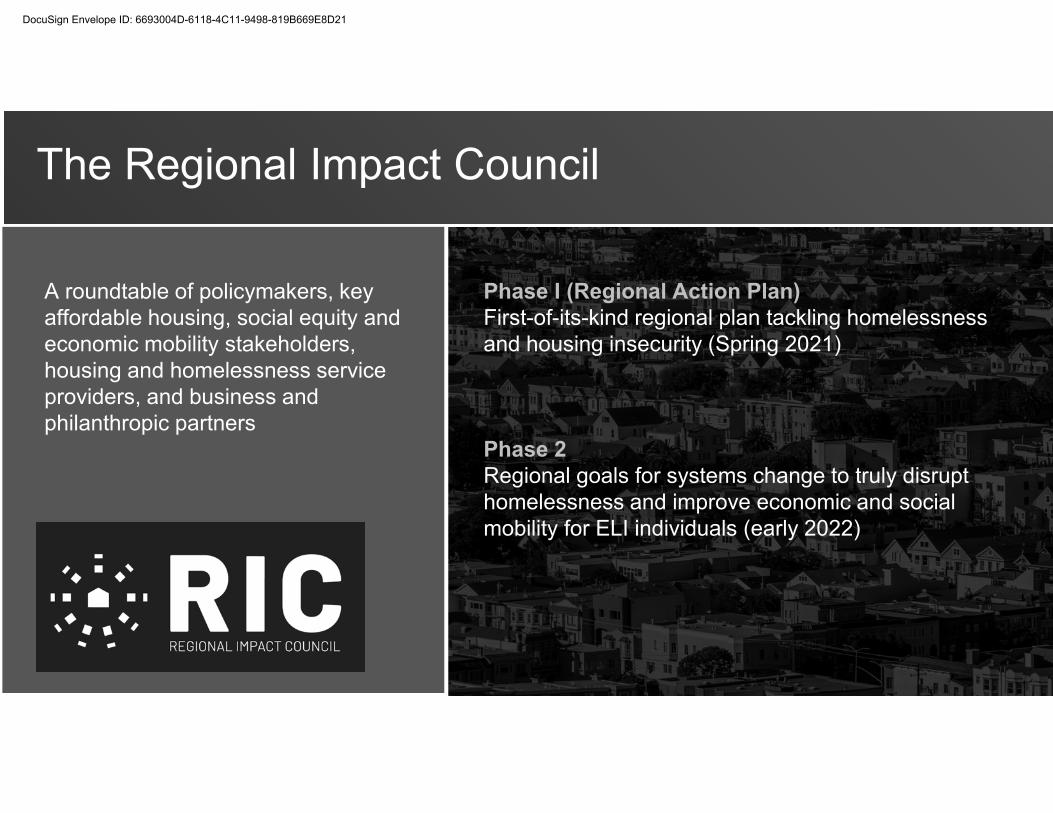
The Regional Impact Council, which is a roundtable of policymakers and key affordable housing, social equity and economic mobility stakeholders, has determined that in order to address homelessness and housing insecurity, a regional approach is necessary. A regional allocation by county would result in the 193 units that are provisionally allocated to Monte Sereno to actually be built in cities within the region that are able to accommodate such units. Monte Sereno would still play its part towards buildout of such units, but the sites would be located where they can be handled. See Attachment D, Regional Action Plan Briefing, for a copy of a recent presentation to ABAG that discusses solutions to the housing problem across the nine Bay Area counties. This is a meaningful approach that would retain the objectives spelled out in Government Code §65584(d) and that would result in low-income and very low-income housing actually being built.
It is highly unlikely that any housing built in the City of Monte Sereno will be priced at the levels to meet the needs of low-income and very low-income individuals. Producing low- and very low-income housing in Monte Sereno is simply unrealistic due to land prices. This fact was evident in the recent Hacienda Project, where units that were intended for lower-income residents now sell for $3 to $3.5 million. Even if such housing is built, individuals will not have meaningful access to transportation, grocery stores, and jobs and will face the danger of being cut off in the event of an emergency.
DocuSign Envelope ID: 6693004D-6118-4C11-9498-819B669E8D21

Monte Sereno RHNA Appeal July 7, 2021 Page 14
CONCLUSION The following bullet points summarize Monte Sereno’s basis for appealing ABAG’s 2023-2031 RHNA:
• Monte Sereno is in a very high fire hazard zone. The mountainous terrain, the heavily wooded areas, and the prevalence of large canopy trees throughout the community puts the community in harm’s way when wildfire hits. This is the wrong place to locate new housing.
• Monte Sereno is a built-out residential community with no significant vacant land to develop or redevelop for housing. What little vacant land exists, is surrounded by low-density residential development and is configured into small parcels that do not lend themselves to affordable, high-density housing.
• Monte Sereno has a jobs/housing imbalance, strongly tilted toward housing. This combined with lack of robust transit access means that new housing would only exacerbate traffic congestion and increase the vehicle miles traveled on Bay Area roads.
• Housing allocation need to be considered on a regional basis and not on a citywide basis, so that cities like Monte Sereno can meaningfully contribute to satisfying the goals of the Legislature rather than being forced to come up with a plan that would not result in an increase in the type of housing that is needed.
The City of Monte Sereno appeals to the ABAG Board of Directors for a reduction in the community’s housing allocation for the planning period 2023 through 2031.
Attachments:
Attachment A: Information about Local Planning Factors and Affirmatively Furthering Fair Housing from the Local Jurisdiction Survey-Monte Sereno Response
Attachment B: Monte Sereno Public Comment on RHNA Methodology and Objection Regarding Proposed Share
Attachment C: Embarcadero Institute Report
Attachment D: Regional Action Plan Briefing
DocuSign Envelope ID: 6693004D-6118-4C11-9498-819B669E8D21

ATTACHMENT A
INFORMATION ABOUT LOCAL PLANNING FACTORS AND
AFFIRMATIVELY FURTHERING FAIR HOUSING FROM THE LOCAL
JURISDICTION SURVEY-MONTE SERENO RESPONSE
DocuSign Envelope ID: 6693004D-6118-4C11-9498-819B669E8D21

DocuSign Envelope ID: 6693004D-6118-4C11-9498-819B669E8D21
DocuSign Envelope ID: 6693004D-6118-4C11-9498-819B669E8D21

DocuSign Envelope ID: 6693004D-6118-4C11-9498-819B669E8D21
DocuSign Envelope ID: 6693004D-6118-4C11-9498-819B669E8D21

DocuSign Envelope ID: 6693004D-6118-4C11-9498-819B669E8D21

DocuSign Envelope ID: 6693004D-6118-4C11-9498-819B669E8D21

DocuSign Envelope ID: 6693004D-6118-4C11-9498-819B669E8D21

DocuSign Envelope ID: 6693004D-6118-4C11-9498-819B669E8D21
DocuSign Envelope ID: 6693004D-6118-4C11-9498-819B669E8D21

DocuSign Envelope ID: 6693004D-6118-4C11-9498-819B669E8D21

DocuSign Envelope ID: 6693004D-6118-4C11-9498-819B669E8D21

ATTACHMENT B
MONTE SERENO PUBLIC COMMENT ON RHNA METHODOLOGY AND
OBJECTION REGARDING PROPOSED SHARE
DocuSign Envelope ID: 6693004D-6118-4C11-9498-819B669E8D21

DocuSign Envelope ID: 6693004D-6118-4C11-9498-819B669E8D21

January 07, 2021 Delivered by Express Delivery and via Email to [email protected] To: The Association of Bay Area Governments, Executive Board Bay Area Metro 375 Beale Street, Suite 800 San Francisco, CA 94105 Re: Proposed RHNA Methodology and Subregional Shares
Public Comment on RHNA Methodology and Objection Regarding Proposed Share Dear ABAG Executive Team: The City of Monte Sereno applauds your efforts in leading the 2023-2031 Regional Housing Needs Assessment (RHNA) along with the Housing Methodology Committee (HCD). Conceptually, The City of Monte Sereno agrees with the five main objectives put forth in the plan. Those objectives are:
1) Increase the housing supply and the mix of housing types in an equitable manner 2) Promote infill development, efficient development, and CHG reduction 3) Promote better relationships between jobs and housing, particularly jobs-housing fit 4) Balance existing disproportionate concentrations of income categories 5) Affirmatively further fair housing
That said, Monte Sereno strongly objects to the ABAG-proposed numbers we have seen under all current models that have been shared with us. The numbers proposed for Monte Sereno are unfair, untenable, and designed-to-fail. They are unacceptable and if not changed, will almost certainly require formal challenge. We would prefer to avoid that by getting an appropriate allocation from the start. More on that at the end of this letter. Background Monte Sereno is a hillside community with an area of 1.6 total square miles. Located just between larger Los Gatos and Saratoga in Santa Clara County, Monte Sereno contracts most of its city services from neighboring jurisdictions. Hence, Monte Sereno has a very small budget of only $4 million annually and minimal staffing resources. The City of Monte Sereno was chartered in unique fashion. Since inception, Monte Sereno has essentially functioned as one large residential-only district of approximately 1250 single family homes. There are no commercial shopping districts which can be rezoned. There are no mixed-use real estate developments which may be rezoned. There are no existing apartment complexes. There are simply no land use opportunities Monte Sereno can leverage to achieve substantial RHNA allocation numbers.
18041 Saratoga-Los Gatos Road Monte Sereno, California 95030-4299
Telephone: 408.354.7635 Fax: 408.395.7653
www.cityofmontesereno.org
DocuSign Envelope ID: 6693004D-6118-4C11-9498-819B669E8D21

Monte Sereno has one bus stop, one traffic light, one church, and one school. Monte Sereno has a very limited jobs base (city services and school only; no commercial jobs). Monte Sereno has no practical access to public transportation. Monte Sereno is a net housing supplier for neighboring jurisdiction’s employment centers. Nearly all properties in Monte Sereno are governed by private property rights in the original covenants, conditions, and restrictions. Those grandfathered CCR’s specify and restrict to single family home development on the property they govern. Homeowners who purchased properties under those written assumptions will ultimately be the decision makers when an opportunity presents itself about their property rights/usage. Forcing lip-service zoning changes on land which cannot and will not be developed is worse than no solution at all. In recent years Monte Sereno has been successful adding housing units through use of Accessory Dwelling Units (ADUs), and Junior Accessory Dwelling Units (JADU’s) to single family parcels. As a matter of fact, Monte Sereno was able to exceed its RHNA numbers of 60 units in the current allocation cycle – but multi-family/high-density mandates could not be fulfilled within the city; they were only met by annexing neighboring county land into the city! ADUs and California’s legislative support of ADUs have generally been a workable solution for Monte Sereno’s RHNA housing numbers, but there is no guarantee that ADUs will qualify as new housing stock in the next cycle. If they do not, we are again facing not just difficulty, but actual impossibility to comply with unreasonable numbers. Conversely, the population of Monte Sereno (approximately 3,500) has increased by less than 2,000 persons since 1960. In fact, according to U.S. Census data, since 2010 the population of Monte Sereno has decreased by 4.1%. In other words, demand for housing within in Monte Sereno appears essentially static. This point was highlighted in the calculations in correspondence ABAG recently received from the Contra Costa County Mayors Conference dated October 2, 2020. We fully agree with the Contra Costa analysis, which concludes that Monte Sereno should not have 140-190 units assigned, but three units, total. That is the correct number related to our growth pattern and it is the correct number based on our employment-creation levels. Of course we can beat that number with liberal approval of ADU’s, but ADU-creation is likely to fall in the 40-60 unit range. In reference to the current Draft RHNA and its applicability to cities such as Monte Sereno, a “one size fits all” housing allocation is not practical to achieve utilizing the proposed methodology. The City of Monte Sereno will struggle with the Draft RHNA proposal as written. Despite our best efforts as a City, If over-allocation occurs, Monte Sereno will be forced to fail and will be unable to meet our assigned share of the contribution to objectives one through five listed above. Another further critical consideration: Monte Sereno is located right next to a Tier 3 wildfire zone and there are serious limitations on local evacuation routes and resources. This fact presents additional difficulties developing multi-unit housing in Monte Sereno for ABAG and HCD to consider. Jobs rich centers and Vehicle Miles Traveled (VMT) calculations are a contradictory measure when used to determine housing allocation for Monte Sereno. An alternative approach for cities like Monte Sereno would be to add additional objectives or exemptions based on factors like insignificant population, transportation, and, most important, a fair allocation based on our employment base and jobs-creation. Lack of local jobs and public transportation lead to increased VMT, an undesired consequence of RHNA’s best intentions to reduce Green House Gas emissions (GHG).
DocuSign Envelope ID: 6693004D-6118-4C11-9498-819B669E8D21

Extremely unusual cities like Monte Sereno require will require different approaches to support housing and or alternative RHNA objectives. In other words, mandating a number of units referred to as “one’s share of an allocation” does not allow for consideration of unique characteristics or challenges some communities face delivering housing opportunities. The City of Monte Sereno welcomes an opportunity to help resolve housing issues regionally. Monte Sereno desires to be included in regional housing, transportation, and climate change solutions. But in its current draft, RHNA cannot be applied in any practical manner to the City of Monte Sereno, and in some respects, contradicts the very objectives RHNA strives to achieve. Please consider additional methodologies for small cities with small budgets, and large VMT. And please consider additional methodologies or exemptions from ncreased housing density near wildfire zones. Conclusion Monte Sereno supports efforts to increase much needed housing in the San Francisco Bay Area region. However, Monte Sereno just does not have the physical resources to add housing according to the objectives set forth in the RHNA 2023-2031 Draft, nor does Monte Sereno have the financial resources to achieve the proposed housing goals. For Monte Sereno to succeed in the 2023-2031 RHNA cycle, there must be alternative allocation solutions or exemptions provided to help small hillside communities play a meaningful part. That number must fall in the range of 40-60 units and it must include ADU’s an it must not impose multi-family and other requirements which simply cannot be met within the City’s borders. Monte Sereno looks forward to an appropriate allocation which considers all of the foregoing information. Barring that, the City of Monte Sereno reserves all applicable rights and legal remedies that may be available should it be necessary to challenge the allocation methodology and/or the draft allocation to the City of Monte Sereno. Sincerely, Shawn Leuthold, Mayor City of Monte Sereno
DocuSign Envelope ID: 6693004D-6118-4C11-9498-819B669E8D21

DocuSign Envelope ID: 6693004D-6118-4C11-9498-819B669E8D21
ATTACHMENT C
EMBARCADERO INSTITUTE REPORT
DocuSign Envelope ID: 6693004D-6118-4C11-9498-819B669E8D21

DocuSign Envelope ID: 6693004D-6118-4C11-9498-819B669E8D21

Do the Math: The state has ordered more than350 cities to prepare the way for more than 2 million homes by 2030. But what if the math is wrong?
Senate Bill 828, co-sponsored by the Bay Area Council and Silicon Valley Leadership Group, and authored by state Sen. Scott Wiener in 2018, has inadvertently doubled the “Regional Housing Needs Assessment” in California.Use of an incorrect vacancy rate and double counting, inspired by SB-828, caused the state’s Department of Housing and Community Development (HCD) to exaggerate by more than 900,000 the units needed in SoCal, the Bay Area, and the Sacramento area.
The state’s approach to determining the housing need must be defensible and reproducible if cities are to be held accountable. Inaccuracies on this scale mask the fact that cities and counties are surpassing the state’s market-rate housing targets but falling far short in meeting affordable housing targets. The inaccuracies obscure the real problem and the associated solution to the housing crisis—the funding of affordable housing.
Author : Gab Layton PhD, President of the Embarcadero Institute
DocuSign Envelope ID: 6693004D-6118-4C11-9498-819B669E8D21

Sierra
DelNorte
HumboldtTrinity Shasta Lassen
TehamaPlumas
Butte
Nevada
Placer
Sonoma NapaYolo
Solano
Stanislaus
SantaClara
SanBenito
SanJoaquinContra
Costa
Alameda
Marin
San Francisco
San Mateo
Santa Cruz
Monterey
San LuisObispo
Santa Barbara
VenturaLos Angeles
Orange
San Bernardino
Riverside
San Diego Imperial
Yuba
GlennMendocino
LakeColusa
Sutter
Sacra-mento
El Dorado
Alpine
CalaverasTuolumne
Mono
Mariposa
Madera
Fresno
Kings
Kern
Tulare
Inyo
Merced
Amador
SiskiyouModoc
Every five to eight years the Department of Housing and Community Development (HCD) supervises and publishes the results of a process referred to as the Regional Housing Needs Assessment (RHNA). Four regional planning agencies cover the 21 most urban counties and account for 80% of California’s housing. All four regions saw a significant jump in the state’s assessment of their housing need for the years 2021 to 2030.
Double counting (not surprisingly) doubled the assessed housing need for the four major planning regions.
Four Regions Contain 80% of the State’s HousingHousing Units Needed According to the State, (1996–2030)
0
0.5M
1.0M
1.5M
2.0M
2.5M
Sacramento AreaCouncil of Governments(SACOG)
1996–2006 2005–2014 2013–2022 2021–2030
Associationof Bay Area
Governments(ABAG)
San DiegoAssociation ofGovernments
(SANDAG)
Greater Sacramento
San Diego Region
Greater Bay Area
Six SoCal Counties
Southern CaliforniaAssociation ofGovernments
(SCAG)
1
Impacted by Great Recession
foreclosure crisis
Made before COVID impact
DocuSign Envelope ID: 6693004D-6118-4C11-9498-819B669E8D21

0
500,000
1,000,000
Cost burdening double-count
Overcrowding double-count
Extra units needed to replace demolished units
Extra units needed to achieve healthy vacancy rate
Households needed as determined by the Dept. of Finance(factors in overcrowding and cost burdening)
ConventionalEconomist Approach
Conventional Economist Approach
Conventional Economist Approach
ConventionalEconomistApproach
Six SoCal Counties Greater Bay Area San Diego Region Greater Sacramento
California plans for its housing needs in “cycles.” The four regions are on cycles that last roughly eight years with staggered start dates. In the 2021–2030 housing cycle, errors introduced by language in SB-828 nearly equal the entire 1.15M units of new housing required during the 2013–2022 “cycle.” As illustrated, Southern California and the Bay Area are the most impacted by the state’s methodology errors.
The double count, an unintended consequence of Senate Bill 828, has exaggerated the housing need by more than 900,000 units in the four regions below.
Num
ber o
f Hou
sing
Uni
ts
(1,341,827)
(153,512)(122,000)(112,000)
(283,000)
(441,176)
(171,687)
(651,000)
SB-828 DoubleCount
SB-828DoubleCount
SB-828 DoubleCount
SB-828 DoubleCount
2
DocuSign Envelope ID: 6693004D-6118-4C11-9498-819B669E8D21

Senate Bill 828 was drafted absent a detailed understanding of the Department of Finance’s methodology for developing household forecasts, and absent an understanding of the difference between rental and home-owner vacancies. These misunderstandings have unwittingly ensured a series of double counts.
State’s erroneous benchmark of 5%
Annual Homeowner Vacancy Rates for the United States and Regions: 1968º2019
Long term benchmarkis 1.5%
3
1. SB-828 wrongly assumed ‘existing housing need’ was not evaluated as part of California’s previous Regional Housing Need Assessments, or RHNA. There was an assumption that only future need had been taken into account in past assess-ments. (In fact, as detailed in The Reality section, the state’s existing housing need was fully evaluated in previous RHNA assessment cycles).
2. SB-828 wrongly assumed a 5% vacancy rate in owner-occupied housing is healthy (as explained in the column on the right, 5% vacancy in owner-occupied homes is never desir-able, and contradicts Government Code 65584.01(b)(1)(E) which specifies that a 5% vacancy rate applies only to the rental housing market).
3. SB-828 wrongly assumed overcrowding and cost-burdening had not been considered in Department of Finance projections of housing need. The bill sought to redress what it mistaken-ly thought had been left out by requiring regional planning agencies to report overcrowding and cost-burdening data to the Dept. of Housing and Community Development (as explained in the right column).
SB-828 MISTAKENLY ASSUMED: THE REALITY IS:1. Existing housing need has long been incorporated in California’s planning cycles. It has been evaluated by comparing existing vacancy rates with widely accepted benchmarks for healthy market vacancies (rental and owner-occupied). The difference between actual and benchmark is the measure of housing need/surplus in a housing market. Confusion about the inclusion of “existing need” may have arisen because vacancy rates at the time of the last assessment of housing need (”the 5th cycle”) were unusually high (higher than the healthy benchmarks) due to the foreclosure crisis of 2007–2010, and in fact, the vacancy rates suggested a surplus of housing. So, in the 5th cycle, the vacancy adjustment had the effect of lowering the total housing need. Correctly seeing the foreclosure crisis as temporary, the state Department of Finance did not apply the full weight of the surplus but instead assumed a percentage of the vacant housing would be absorbed by the time the 5th cycle began. The adjustment appears in the 5th cycle determinations, not as ‘Existing Housing Need’ but rather as “Adjustment for Absorption of Existing Excess Vacant Units.”
2. While 5% is a healthy benchmark for rental vacancies, it is unhealthy for owner-occupied housing (which typically represents half of existing housing). In the U.S. homeowner vacancy has hovered around 1.5% since the ‘70s, briefly reaching 3% during the foreclosure crisis. However, 5% is well outside any healthy norm, and thus does not appear on the Census chart (to the right) showing Annual Homeowner Vacancy Rates for the United States and Regions: 1968–2019.
3. Unknown to the authors of SB-828, the Department of Finance (DOF) has for years factored overcrowding and cost-burdening into their household projections. These projections are developed by multiplying the estimated population by the headship rate (the proportion of the population who will be head of a household). The Department of Finance (DOF), in conjunction with the Department of Housing and Community Development (HCD), has documented its deliberate decision to use higher headship rates to reflect optimal conditions and intentionally “alleviate the burdens of high housing cost and overcrowding.” Unfortunately, SB-828 has caused the state to double count these important numbers.
Five Percent
DocuSign Envelope ID: 6693004D-6118-4C11-9498-819B669E8D21

1. Incorrect use of a 5% benchmark vacancy rate for owner-occupied housing.The vacancy rate was incorrectly used for both existing and projected owner-occupied households.
2. Current vacancies were assumed to exist in household projections. This error is unrelated to SB-828, but is an accounting error introduced by HCD methodology.
3. Overcrowding and cost-burdening were double counted.** In addition to the household projection methodology outlined by the Department of Finance (shown to account for overcrowding and cost-burdening), the matter is also mentioned in meeting notes available on the Association of Bay Area Government’s (ABAG) website.***
Quote from ABAG’s Housing Methodology Committee Agenda Packet for the 4th RHNA Cycle, July 2006
“There was also a lot of discussion about the headship rates used by HCD/DOF. Several people commented that headship rates in the Bay Area are generally lower than the State’s estimates because the region’s high housing costs limit household formation. In response, Mr. Fassinger noted that HCD uses these higher headship rates because the RHNA process is intended to alleviate the burdens of high housing cost and overcrowding.”
Despite this, overcrowding and cost-burdening were counted a second time as adjustment factors required by SB-828.
+ 229,000 housing units
+ 734,000 housing units
– 22,000 housing units
+ 941,000 housing units
4
The forced double-counting errors are significant.*
* All errors are rounded to the nearest thousand.** Overcrowding measures the number of households with more than 1 person per room. Cost-burdening measures the number of households that spend more than 30% of the
household income on housing. Cost-burdening is measured by five income levels — extremely low, very low, low, moderate, above moderate*** P-4 tables are created by the Department of Finance—Household Projection table 2020–2030 and their methodology is fully explained in ‘read me’ notes that accompany the table.
TOTAL:
DocuSign Envelope ID: 6693004D-6118-4C11-9498-819B669E8D21

* Based on permit progress reports published by the Dept of Housing and Community Development and updated July 2020, reporting progress through April 2019.** Only the Bay Area is shown because other regions have not kept detailed records of permit progress through the 3rd and 4th cycles.
5th Cycle Targets (as of April 2019)
500K
250K
Permit Progress in the 5th Cycle (2013-2022)*
(all 4 regions)
Very low +low income
Market rate
Permits Issued (as of April 2019)
Affordable Housing Languishes as Market-Rate Housing Overachieves (Bay Area only)*
4th Cycle2007–2014
5th Cycle2014–2022
3rd Cycle1996–2006
+150%
+100%
+50%
-50%
0%
Very-low + Low Income PermitsMarket-Rate Permits
5
The state has shown, with decades of data, that it cannot dictate to the market. The market is going to take care of itself. The state’s responsibility is to
take care of those left behind in the market’s wake. Based on housing permit progress reports published by the Dept. of Housing and Community
Development in July 2020, cities and counties in the four most populous regions continue to strongly outperform on the state’s assigned market-rate
housing targets, but fail to achieve even 20% of their low-income housing target. In the Bay Area where permit records have been kept since 1997, there is
evidence that this housing permit imbalance has propagated through decades of housing cycles.
The state’s exaggerated targets unfortunately mask the real story: Decades of overachieving in market-rate housing has not reduced housing costs for lower income households.
Great Recession (2007–2010) impacted housing. Market-rate meets but does not exceed state target
in the 4th cycle.
DocuSign Envelope ID: 6693004D-6118-4C11-9498-819B669E8D21

Cities are charged by the state to build one market-rate home for every one affordable home. But state laws, such as the density bonus law, incentivize
developers to build market-rate units at a far higher rate than affordable units. As a result, California has been building four market-rate units for every
one affordable unit for decades. And with the near-collapse of legislative funding for low-income housing in 2011, that ratio has grown to seven to eight
market-rate units to each affordable unit. Yet we need one-to-one. This worsening situation can’t be fixed by zoning or incentives, which are the focus of
many recent housing bills and only reinforce or worsen the ever-higher market-rate housing ratios. From the data it appears that the shortage of housing
resulted not from a failure by cities to issue housing permits, but rather a failure by the state to fund and support affordable housing. Future legislative
efforts should take note.
Market-Rate to Low-Income Housing Permits in the Bay Area has grown from a ratio of 4 : 1 to 7 : 1 (Bay Area only)**
4th Cycle2006–2014
5th Cycle2014–2022
3rd Cycle1999–2006
4
2
6
8
0
Effect of reduced state funding for affordable housing
.
2008 2010 2012 2014 2016 2018
$3.0
$2.0
$1.0
$0The ratio
mandated by the state
State Funds for Affordable Housing, 2008–2019*
$ Billion
Actual ratio
Redevelopmentagenciesshuttered
6
It’s clear. Market-rate housing doesn’t need state incentives. Affordable housing needs state
* “The Defunding of Affordable Housing in California”, Embarcadero Institute, update June 2020 www.embarcaderoinstitute.com/reports/** Only Bay Area is shown because other regions have not kept detailed records of permit progress through the 3rd and 4th cycles. Data is from ABAG’s permit progress
reports for 3rd and 4th cycle and Dept. of Housing and Community Development’s 5th cycle Annual Progress Report.
DocuSign Envelope ID: 6693004D-6118-4C11-9498-819B669E8D21
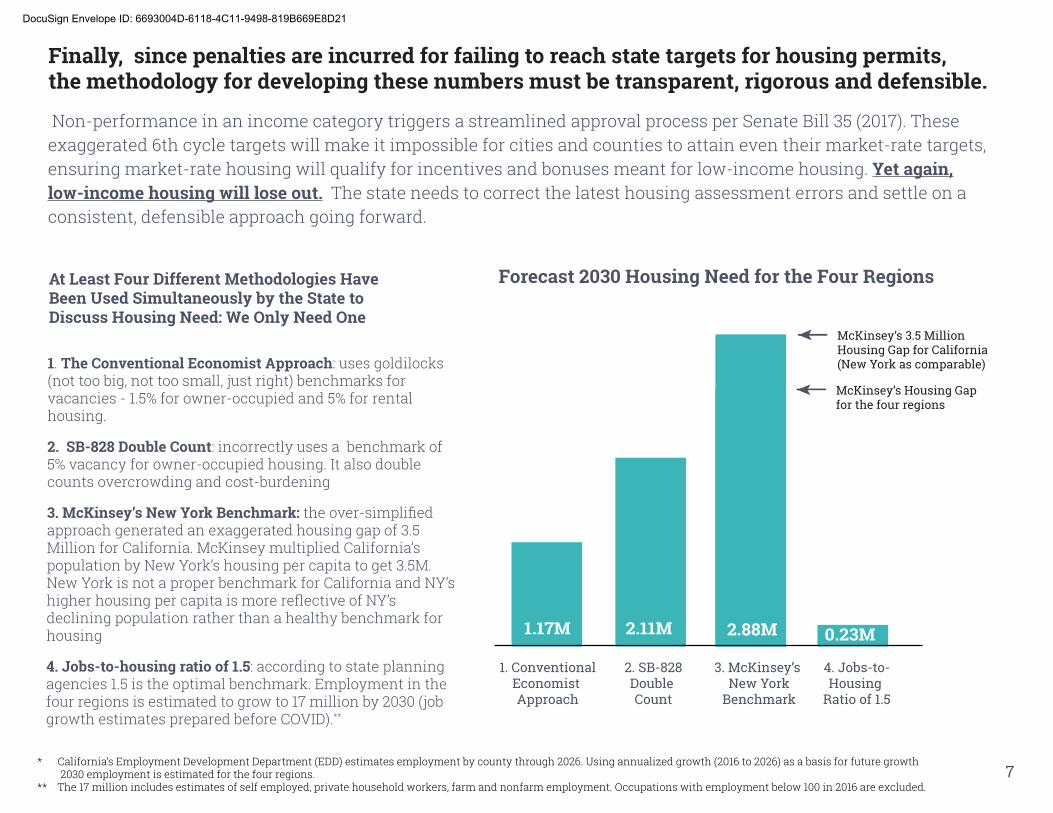
Finally, since penalties are incurred for failing to reach state targets for housing permits,the methodology for developing these numbers must be transparent, rigorous and defensible.
Non-performance in an income category triggers a streamlined approval process per Senate Bill 35 (2017). These exaggerated 6th cycle targets will make it impossible for cities and counties to attain even their market-rate targets, ensuring market-rate housing will qualify for incentives and bonuses meant for low-income housing. Yet again, low-income housing will lose out. The state needs to correct the latest housing assessment errors and settle on a consistent, defensible approach going forward.
1. ConventionalEconomist Approach
2. SB-828Double Count
3. McKinsey’s New York
Benchmark
4. Jobs-to-Housing
Ratio of 1.5
1.17M 2.11M 2.88M 0.23M
1. The Conventional Economist Approach: uses goldilocks (not too big, not too small, just right) benchmarks for vacancies - 1.5% for owner-occupied and 5% for rental housing.
2. SB-828 Double Count: incorrectly uses a benchmark of 5% vacancy for owner-occupied housing. It also double counts overcrowding and cost-burdening
3. McKinsey’s New York Benchmark: the over-simplified approach generated an exaggerated housing gap of 3.5 Million for California. McKinsey multiplied California’s population by New York’s housing per capita to get 3.5M. New York is not a proper benchmark for California and NY’s higher housing per capita is more reflective of NY’s declining population rather than a healthy benchmark for housing
4. Jobs-to-housing ratio of 1.5: according to state planning agencies 1.5 is the optimal benchmark. Employment in the four regions is estimated to grow to 17 million by 2030 (job growth estimates prepared before COVID).**
Forecast 2030 Housing Need for the Four RegionsAt Least Four Different Methodologies Have Been Used Simultaneously by the State to Discuss Housing Need: We Only Need One
* California’s Employment Development Department (EDD) estimates employment by county through 2026. Using annualized growth (2016 to 2026) as a basis for future growth 2030 employment is estimated for the four regions.** The 17 million includes estimates of self employed, private household workers, farm and nonfarm employment. Occupations with employment below 100 in 2016 are excluded.
McKinsey’s 3.5 Million Housing Gap for California(New York as comparable)
7
McKinsey’s Housing Gap for the four regions
DocuSign Envelope ID: 6693004D-6118-4C11-9498-819B669E8D21
Dept. of Finance (DOF)
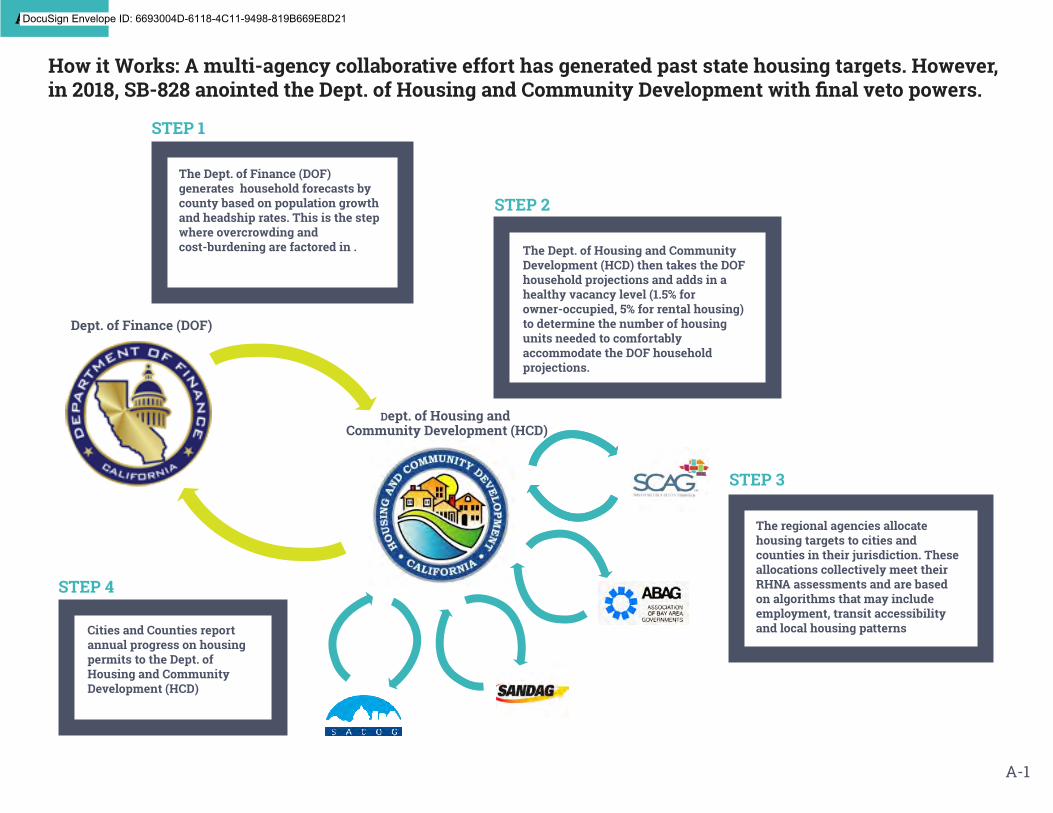
How it Works: A multi-agency collaborative effort has generated past state housing targets. However, in 2018, SB-828 anointed the Dept. of Housing and Community Development with final veto powers.
STEP 1
STEP 2
STEP 3
STEP 4
Dept. of Housing and Community Development (HCD)
APPENDIX
A-1
The Dept. of Finance (DOF) generates household forecasts by county based on population growth and headship rates. This is the step where overcrowding and cost-burdening are factored in . The Dept. of Housing and Community
Development (HCD) then takes the DOF household projections and adds in a healthy vacancy level (1.5% for owner-occupied, 5% for rental housing) to determine the number of housing units needed to comfortably accommodate the DOF household projections.
Cities and Counties report annual progress on housing permits to the Dept. of Housing and Community Development (HCD)
The regional agencies allocate housing targets to cities and counties in their jurisdiction. These allocations collectively meet their RHNA assessments and are based on algorithms that may include employment, transit accessibility and local housing patterns
DocuSign Envelope ID: 6693004D-6118-4C11-9498-819B669E8D21

+ 229,000 housing units
+ 734,000 housing units
– 22,000 housing units
Six SoCal Counties = +578,000Greater Bay Area = +104,000San Diego Area = +39,000Greater Sacramento = +13,000
Southern California and the Bay Area were most impacted by the double counting. San Diego was not assessed for cost-burdening although it is more cost-burdened than the Bay Area. It was perhaps overlooked because its assessment cycle began in July, 2018, a few months before SB-828 passed into law.
Six SoCal Counties = -13,000Greater Bay Area = -4,000San Diego Area = -2,000Greater Sacramento = -3,000
Six SoCal Counties = +126,000Greater Bay Area = +59,000San Diego Area = +23,000Greater Sacramento = +21,000
A-2
APPENDIX
SB-828 introduced errors in Step 2 (when the Dept. of Housing and Community Development made adjustments to the Dept. of Finance’s household projections).
1. Used a benchmark of 5% vacancy rate for BOTH owner-occupied and rental housing.
The Department of Housing and Community and Development
2. Assumed vacancies in household projections *
3. Double counted overcrowding and cost-burdening
* P-4 tables are created by the Department of Finance—Household Projection table 2020–2030 and their methodology is fully explained in ‘read me’ notes that accompany the table** Overcrowding measures the number of households with more than 1 person per room. Cost-burdening measures the number of households that spend more than 30% of the
household income on housing. Cost-burdening is measured by five income levels—extremely low, very low, low, moderate, above moderate.
DocuSign Envelope ID: 6693004D-6118-4C11-9498-819B669E8D21

(10,000)
(39,000)
* Owner-occupied has a lower healthy vacancy rate because it is usually only vacant while a house is for sale** All numbers are rounded to the nearest thousand.*** Seasonal Vacancies represent second homes, coprorate housing, and short-term rentals such as AIrBnBs
EXISTING HOUSING: Six SoCal Counties
The Department of Housing and Community Development (HCD) has traditionally arrived at a number for pent-up demand or housing shortfall by comparing vacancy rates in owner-occupied and rental housing to healthy benchmarks (1.5% for owner-occupied* and 5% for rental housing). The largest of the four regions, six SoCal Counties (covering Imperial, Los Angeles, Orange, Riverside, San Bernardino, and Ventura counties) is considered in the example below**.
1.2%Home-owned (3.3 Million)
Vacant Housing Units
Actual Vacancies (40,000)
Healthy Benchmark (50,000) 1.5%
3.7%
5.0%
Existing Need
Rentals (3 Million)
Occupied Housing Units
Actual Vacancies (111,000)
Healthy Benchmark (150,000)
Seasonal Vacancies (500,000)***
1 circle = 10,000 households
A-3
APPENDIX
Detailed explanation of the errors using SoCal Counties as an example: First—the correct approach.
DocuSign Envelope ID: 6693004D-6118-4C11-9498-819B669E8D21

PROJECTED HOUSING NEED: Six SoCal Counties
Healthy Vacancy New Housing:
ReplacementAdjustment:
Existing NeedAdditional HH by 2030
Home-owned (290,000)
Rentals (261,000)
Total Housing Needby 2030
1.5% (4,000) (10,000)
5.0% (13,000) (39,000)
(34,000)
The Dept. of Finance (DOF) supplies the Dept. of Housing and Community Development (HCD) with an estimate of additional households (HH) needed by the end of the cycle. The DOF forecast the 2030 population, and using an optimal household formation rate determine the number of households required to comfortably house that population*. The DOF also supply the HCD with the number of existing households at the start of the cycle. The HCD adds to the base number of additional households needed, factoring in vacancies for a healthy market, and adding a replacement adjustment (also supplied by the DOF)**.
* Households represent occupied housing units. The number of housing units is always higher as at any given time than the number of households because some housing will be vacant or unutilized. The DOF is responsible for the base projection because they manage population projections for the state, and determine those by analyzing births, deaths and net migration.
** Replacement represents houses that may be demolished or replaced during the cycle*.
651,000housing units
1 circle = 10,000 households
A-4
APPENDIX
The housing need also takes into account for future growth.
DocuSign Envelope ID: 6693004D-6118-4C11-9498-819B669E8D21

(125,000)
(39 ,000)
EXISTING HOUSING: Six SoCal Counties
Instead of the typical 1.5% benchmark for owner-occupied housing, they used a 5% vacancy rate usually reserved for rental housing. A 5% vacancy in owner-occupied housing is indicative of a distressed housing market. At 5%, SoCal’s existing housing need is increased by 115,000 housing units. Existing need for rental housing is unchanged.
However, the Dept. of Housing and Community Development has adopted an unusual methodology in evaluating existing need in the 6th housing cycle.
1.2%Home-owned (3.3 Million)
Vacant Housing Units
Actual Vacancies (40,000)
Healthy Benchmark (165,000) 5.0%
3.7%
5.0%
Existing Need
Rentals (3 Million)
Occupied Housing Units
Actual Vacancies (110,000)
Healthy Benchmark (149,000)
Seasonal Vacancies (500,000)
1 circle = 10,000 households
A-5
APPENDIXDocuSign Envelope ID: 6693004D-6118-4C11-9498-819B669E8D21
(34,000)
PROJECTED HOUSING NEED: Six SoCal Counties
Healthy Vacancy New Housing:
Assumed VacancyNew Housing
ReplacementAdjustment:
ExistingNeed
Additional HH by 2030
Home-owned(290,000)
Rentals (261,000)
5% (15,000) 1.2%(3,000)
(125,000)
5.0% (13,000) (39,000)
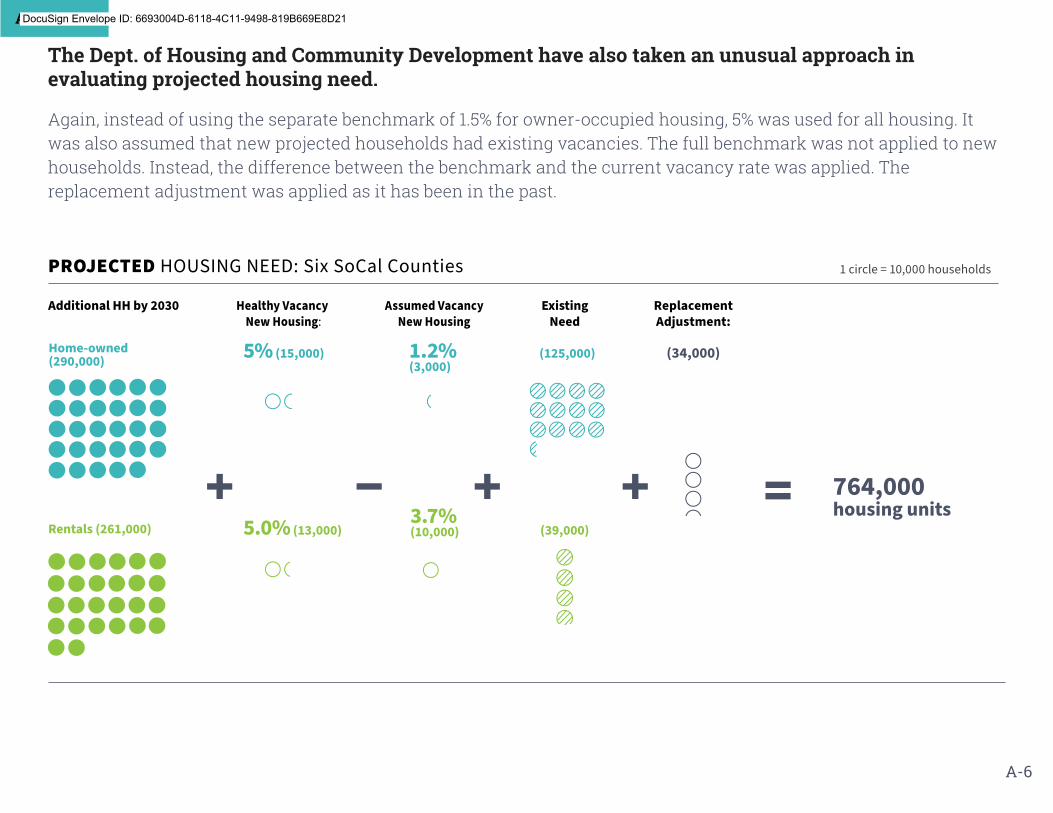
Again, instead of using the separate benchmark of 1.5% for owner-occupied housing, 5% was used for all housing. It was also assumed that new projected households had existing vacancies. The full benchmark was not applied to new households. Instead, the difference between the benchmark and the current vacancy rate was applied. The replacement adjustment was applied as it has been in the past.
3.7%(10,000)
764,000housing units
1 circle = 10,000 households
A-6
APPENDIX
The Dept. of Housing and Community Development have also taken an unusual approach in evaluating projected housing need.
DocuSign Envelope ID: 6693004D-6118-4C11-9498-819B669E8D21

(460,000)
PROJECTED HOUSING NEED: Six SoCal Counties
OvercrowdingAdjustment*
Additional HH by 2030
Home-owned(290,000)
Rentals (261,000)
(118,000)
Cost BurdeningAdjustment**
Two new factors were introduced into the 6th assessment — overcrowding and cost burdening. These factors had already been rolled into the DOF’s household projections. The DOF explicitly recognized that regional household formation rates might be depressed (a symptom of overcrowding and cost-burdening) because of the affordable housing crisis. The household formation rate used by the DOF is higher than the actual rate experienced. As such, it generates a higher housing target meant to relieve overcrowding and cost-burdening.
Projected Households already factors in
overcrowding and cost-burdening
From the Department of Finance
“The argument was that the Great Recession and the
affordability crisis which impact recent trends in headship
should not be allowed to solely dominate the projection,
rather some return to underlying socio-cultural norms
of homeownership/fewer roommates is a beneficial assumption”
A DOUBLE COUNT
1 circle = 10,000 households
A-7
APPENDIX
Lastly, the Dept. of Housing and Community Development double counted by adding two new factors that had already been factored into household forecasts made by the Dept. of Finance (DOF).
* In addition to double counting, HCD incorrectly calculated the overcrowding factor. They assumed that for every house that was overcrowded another house would be required to relieve overcrowding. The more accurate analysis would be to assess the number of extra people to be housed and divide by the average household size.
** HCD only applied cost-burdening adjustments to future households not existing households. It is unclear why cost-burdening would only be considered an issue for future households, as the data is for current households.
DocuSign Envelope ID: 6693004D-6118-4C11-9498-819B669E8D21

(34,000) (460,000)
HCD 6TH CYCLE METHODOLOGY
Healthy Vacancy New Housing:
Assumed VacancyNew Housing
ReplacementAdjustment:
OvercrowdingAdjustment
ExistingNeed
Additional HH by 2030
Home-owned(290,000)
Rentals (261,000)
(118,000)
Cost BurdeningAdjustment
Total Housing Needby 2030
5% (15,000) 1.2%(3,000)
(125,000)
5.0% (13,000) (39,000)
1,342,000housing units
TYPICAL METHODOLOGY
Healthy Vacancy New Housing:
ReplacementAdjustment:
Existing NeedAdditional HH by 2030
Home-owned (290,000)
Rentals (261,000)
Total Housing Needby 2030
1.5% (4,000) (10,000)
5.0% (13,000) (39,000)
(34,000)
651,000housing units
3.7%(10,000)
1 circle = 10,000 households
A-8
APPENDIX
The vacancy errors and double counting resulted in a doubling of the housing needs assessment for the six counties of SoCal.
DocuSign Envelope ID: 6693004D-6118-4C11-9498-819B669E8D21

Complete data tables: �������������������������� ���� www.embarcaderoinstitute.com
References used in the analysis : Dept. of Housing and Community Development (HCD) https://www.hcd.ca.gov Regional Housing Needs Allocation and Housing Elements Regional Housing Needs Allocations for 6th Cycle Housing Elements:
Association of Bay Area Governments Regional Housing Need Determination Plan for the Sixth Housing Element Update
Sacramento Area Council of Governments Regional Housing Need Determination for the Sixth Housing Element Update
Southern California Association of Governments Regional Housing Need Determination for the Sixth Housing Element Update
San Diego Association of Governments Regional Housing Need Determination and Plan for the Sixth Housing Element Update
Allocations for 5th Cycle Housing Elements:
Association of Bay Area Governments (February 24, 2012)
Sacramento Area Council of Governments (September 26, 2011)
San Diego Association of Governments (November 23, 2010)
Southern California Association of Governments (August 17, 2011)
Annual Progress Reports Annual Progress Report APR: 5th Cycle Annual Progress Report Permit Summary (updated 730/2020)
Allocations for Earlier Cycles and Housing Element
RHNA 2007-2014 - Housing Methodology Committee Agenda Packet 07-27-06
Regional Housing Needs Plan 2006 to 2013 SACOG February 2008
3rd and 4th Cycle RHNA allocations (data sent in personal communication with the Department of Housing and Comunity Development)
Department of Finance Methodology for Household Forecasts“Read Me” P4 Tables : Household Projections 2020 to 2030
Association of Bay Area Governments Digital Library: RHNA Documents, Regional Housing Needs Allocation Documents
RHNA 2007-2014 - Housing Methodology Committee Agenda Packet 07-27-06, Regional Housing Need Allocation p 2
Other Housing Assessment Methodologies“Mckinsey & Company: A TOOL KIT TO CLOSE CALIFORNIA’S HOUSING GAP: 3.5 MILLION HOMES BY 2025”, October 2016
Jobs to Housing Employment Development Department, State of California, Employment Projections : Long Term Projections
https://www.labormarketinfo.edd.ca.gov/data/employment-projections.html
END NOTESDocuSign Envelope ID: 6693004D-6118-4C11-9498-819B669E8D21

DocuSign Envelope ID: 6693004D-6118-4C11-9498-819B669E8D21
ATTACHMENT D
REGIONAL ACTION PLAN BRIEFING
DocuSign Envelope ID: 6693004D-6118-4C11-9498-819B669E8D21

DocuSign Envelope ID: 6693004D-6118-4C11-9498-819B669E8D21

�������������� ������ ���������������������������������� ���� ����!�� "�����#����DocuSign Envelope ID: 6693004D-6118-4C11-9498-819B669E8D21

�
��������������� �������������������� ���� ��������������������� �������������������������� ��������������������� ��������������������� �� ������������� ����������������������� ��������� ���������� ������� ������������������������ ����������� ���� ���������������� !"#����������������������������������������� ��$%��� ��� &������ ���� ������������� ��������������������������� ���������������������� ����������� �������������������������� ���������������������������������������������������������� ��������������������$DocuSign Envelope ID: 6693004D-6118-4C11-9498-819B669E8D21

�
������������� ��������������������
����� !"�!�!#$�%&'���� !(�)*+$!+,+-�.)/�� )*+$!+,+-0�1���12����������2��0�110��������2
0�33��11������ �2���0��1�����04������56� ������5�����2 ����3� 12���� 7#�8#$�8 +9�8!8+)�:+,)8)!;�<��=��������� �>������?����5� �������������� �@ A�?�����������������B �<����>�C����>���DE ���>FD�2GE H�5�?��� D���GE I� ����>CJ����GD��A�1GE K���D��A�G
DocuSign Envelope ID: 6693004D-6118-4C11-9498-819B669E8D21
�
����������� �������� ��������������������������� ���!"�#"!���!$�"�� %�&�"��������!���%�'��� �����$'���(�)*#��� �+,+-.������/0� ���!"� �!"�������(���&��$%!� �������'"(�����'#��%�&�"��������!����&#��1���$���&�$�!�����$�!"�&�2�"��(�����345�����1��'!"��)�!�"(�+,++.6���'���!2"�����#�"�$(&!����7���(�!�����!2"��%�'��� 7���$�!"��8'��(�!����$���&�$�&�2�"��(���!��%�"����7�%�'��� �!���%�&�"�����������1�$��#��1�����7�!���2'�������!���#%�"!��%��#�$�#!������9%��0� ���!"�5&#!$��:�'�$�"DocuSign Envelope ID: 6693004D-6118-4C11-9498-819B669E8D21

�
��������� ��� ������������� �� ��� ����������������������������������������������� ��!����"�#��#����$#���� �� %�� ������������������ �����&��� �$�������������������%�� �������� ���� ������������������#�"��������� %������%���������%�'(�#���� �� %��������)����*��+'��� �*,�� ��%�������##����������������� %������������� %����������-���� %����������� ������&������"���#�������,�#��%������ ��"� �� %���������&�������%�����%�� �������� ���� '��������� ������������������ ����!������!������
DocuSign Envelope ID: 6693004D-6118-4C11-9498-819B669E8D21

�
����������� ������������������ �������������������� �� !������� "#$%&'()*+,�-�.�����/00�-��1�2�/3���4,�25+6.0�7-�89�/3���46625+:��;�<��3/<3�7=0���3>39.����3/<3�7��3+��?����@1�/?9�-3+A-�/09�/3���+B�9�-����8��-�9�/3���3��/����3
CDEDFG����H��I������ �� ���J������,-�1���.�8-�3K9�/3�9��73�-���;0�-���?���9�����33��33�9-�/�9��?-�.3�7��1�3�������3�-.�����33/?9.3-���.�.33�3�.�?�LFMLCMN��������� �� 4�O�OP39�-�8��-�>���0�-.-=3��/�������9�0.�9���.-730�-�.�����;��5"#$%&'()*+Q.1��.����?����-3+R��=9���3+�9����-<�73+S�?OO
LEMTUVWXYZ[ZV\�]Z_WaYUbcdZe fafYe gaVbZUfghYb[ZfaYbiYbaZ[ZbaYUbfj:�-�.?9.77�����������-��9�/3���Pk;0�-�.����9�/3���3��/����3.�7l;9�����33��330-�1������
DocuSign Envelope ID: 6693004D-6118-4C11-9498-819B669E8D21
�
��������������� ��������������������������� �������������������� ����������������������� �������� ��!"#�$"%&'$("%��� � ������������ ����������������������������������������)*+&(,-".����� ��������������� ����"/0%-0!1�$"%&'$("%���������������� �������)201!3+,2',-"
DocuSign Envelope ID: 6693004D-6118-4C11-9498-819B669E8D21

�� ������������ ���������������
������������������������� �������������������������������������� !"#$%�$�&��'#() �(�)*�+),�-�(($�((�.�/!#.�(�0�(!#1��)*�'.�2�$1#)$�#$1�.2�$1#)$�(1.01�%#�(� �'-)3� �(!"+�1+01��0"+�+)!(�+)- �%�1(�&+01�1+�3�$�� �01�1+��1#,��1+�3�$�� �#14567869:�;<=5=:869:>?� �@?����?�����A BCDCEF�EGHI�JK�LJMFNFHHOFHHA P�0(�+)- �.(A QRSQT�UVWX�� ���� �Y��������A ZZ(�+�(�2�.��.�$1�[!. �$A U"1#2���2#"1#)$\�-0$ -). �+0.0((,�$1�).�+0[#10[#-#13�#((!�(A Z#%+-3�#,'0"1� �"),,!$#1#�(�0$ �$�#%+[).+)) (]9 =_= := �;<=5=:869:>?� �@?����?�����A aMMGOFOD�EGHI�JK�LJMFNFHHOFHHA b)![-� �!'�).�-�0(�+)- �.(A QRcQT�UVWX�� ���� �Y��������A ZZ(�+�0�'.�2#)!(��'#() ��)*�+),�-�(($�((A Z#%+-3�#,'0"1� �"),,!$#1#�(�0$ �$�#%+[).+)) (
]9 =_= := := �d65=<69:>?� �@?����?�����A eJHD�LJCHGOf�gOh�FGDLFE�HFFIGOf�HLFNDFE�JE�GO�HLFNDFE�A iEFHFODGOf�KJE�LJMFNFHHOFHH�gHHGHDgOjFA b)
���������������� ��������� �������������������������� ���� �������� ������� ����!���������� �"���� ����# ��
DocuSign Envelope ID: 6693004D-6118-4C11-9498-819B669E8D21

���������DocuSign Envelope ID: 6693004D-6118-4C11-9498-819B669E8D21

��
���������� ����������������� �������� ������������ ������ !"#$%&'�()�*(+,-./ ���0� ��1����� ������������� 2&#/ �������3������� ������������ ��4 ��5�6�� ��1����� ��6�����������0� ��1���� ����1��������� �1 ����������������1 ������ ��1 ������� ���� ���7��8���������0������9:�; ��8��5�;�����8��8 <�����<�� ����� ���� ������ 8����������=3����:��������� ��8���>8 � �8�����������? ����������@�3 ��
ABCDE ABCDE A�CFEAGC�E AGC�E ABCDEA��C�E A��C�E AGC�EA��CBE!H!I!H!2
A��CDE!H!J !H!! !H!&
A��CDEKL�MNO�PQRQPSTU�QVVNV�SM�WXWY�QMV�WXWZ[������� ������������ ����������1�����[���������1 ����
�� ��1����� ��\]]_abcdef�ghijgkl�mgje]
DocuSign Envelope ID: 6693004D-6118-4C11-9498-819B669E8D21

��
��������� ��������������������������������������������� ������� ����� ����� ��! ������ ���"���#������������������������ �������������������������������������"��#� ���������������������� ������# ��������������������"�����������������##����"������ ��������������$%&'$%&'��&������ ���(�������)�&�������(���� ������� ��*%*+"����� �����������������������������#����������������,������������������(�-�"�.�� �����.���/ �������0�!������0����� �����������������������������,#� ��"� ��! �����������1��������2���������3������������4�#� �
567%%8 569%%8 569%%856$%%8 567%%8 569%%8:;:<:;::56�0$%%8:;:= :;:�56�0$%%856�07%%8:;:>
56�0?%%8 56�0+%%8 569%%8 569%%8@#� �������#����� �A�� ���*+�/ ���-� B�C������������������ �?� ��! �����������
DE�FGH�IJKJILMN�JOOGO�LF�PQPR�JFO�PQPS /���������������� ��������#������ ����T���� ��0������0������UVWWXYZ[\Z]_�Zabcdaef�gad_W
DocuSign Envelope ID: 6693004D-6118-4C11-9498-819B669E8D21