2021 WHOLE GRAINS
49
2021 WHOLE GRAINS CONSUMER INSIGHTS SURVEY
Transcript of 2021 WHOLE GRAINS

2021
W H O L E G R A I N SCO N S U M E R I N S I G H T S S U RV E Y

2 2021 Whole Grains Consumer Insights Survey © 2021 Oldways2 2021 Whole Grains Consumer Insights Survey | Executive Summary © 2021 Oldways
The Oldways Whole Grains Council’s 2021 Whole Grains Consumer Insights Survey was conducted to answer key questions about whole grain consumption, and consumer knowledge and habits around whole grains. The survey also examined consumer recognition and attitudes toward the Whole Grain Stamp. This was the third time the Oldways Whole Grains Council has surveyed American consumers to better understand the whole grain landscape in the US.
This year’s online survey of 1,505 Americans, ages 18 to 88, was nationally census-representative for age, gender, race/ethnicity, region, and income. Of all respondents, 75% reported that they are the primary food purchaser for their household and 25% make about half the food purchasing decisions for their household. The survey was conducted from May 10–12, 2021.
The most significant findings from this year’s survey are centered on:
• Whole grain consumption: how often consumers choose whole grains, why consumers choose whole grains (or not), familiarity with different whole grains, when and where are consumers are most likely to eat whole grains, and which types of food are most often consumed in whole grain form
• The impact of the pandemic on eating and cooking habits
• How sustainability and environmental considerations influence food choices/diet
• Awareness of sprouted grains and their associated benefits
• Knowledge of gluten and who must avoid it
Executive Summary

3 2021 Whole Grains Consumer Insights Survey © 2021 Oldways3 2021 Whole Grains Consumer Insights Survey | Executive Summary © 2021 Oldways
• The importance of clear whole grain labeling and the impact of third-party certifications
• Trust, recognition, and understanding of the Whole Grain Stamp
Some of this year’s most compelling findings include:
More than half of Americans say they choose whole grain options at least half the time.
Since 2005, the Dietary Guidelines for Americans have encouraged all of us to make at least half our grains whole. According to our survey data, 59% of Americans are meeting this goal, with 26% of consumers telling us they nearly always choose whole grains whenever they are available. These figures are even higher among younger generations, with 64% of Gen Z and Millennial consum-ers making half their grains whole. Additionally, 67% of parents of young children (age 0–12), and 74% of health-conscious consumers choose whole grains at least half the time.
Whole grain consumption continues to grow despite the media hype about low-carb and grain-free fad diets.
Fad diets that involve low- or no-carb eating patterns may be grab-bing headlines, but the reality is that 95% of consumers tell us their whole grain consumption has either increased or is holding steady compared with five years ago. Interestingly, while we often assume that low-carb dieters have lower whole grain consumption, those who say they avoid carbs are more likely to also tell us they look for whole grains when shopping. Those who say they avoid carbs are
also more likely to say they nearly always choose whole grain op-tions and more likely to tell us their whole grain intake has increased in the last five years. This may indicate that people are differentiating based on the nutritional quality of different carbohydrate sources and gravitating toward high-quality carbs, like whole grains.
The number of consumers who say taste is a barrier to eating more whole grains is decreasing.
While health remains the leading reason (82%) for choosing whole grains, it’s not the only one. Today, more people consider the flavor of whole grains to be a benefit (38%) than a barrier (33%), and the percentage of those who cite taste as a barrier has fallen signifi-cantly since our last survey. In 2021, 33% say taste is a barrier, compared with 42% in 2018. Of those who say they nearly always choose whole grains, 45% see taste as a benefit and only 18% see it as a barrier, suggesting that the more exposure you have to whole grains, the more you come to appreciate the nuttier, more robust flavors.
Half of American consumers are eating more home-cooked meals as a result of the pandemic.
Our survey data show that the vast majority of consumers (88%) are most likely to consume whole grains when eating at home. With half of American consumers reporting that they are eating more home-cooked meals as a result of the pandemic, it may be no surprise that 1 in 5 consumers tells us they are also eating more whole grains now than they did before the pandemic.

4 2021 Whole Grains Consumer Insights Survey © 2021 Oldways4 2021 Whole Grains Consumer Insights Survey | Executive Summary © 2021 Oldways
Increasingly, sustainability is a motivation for choosing whole grains.
Two-thirds of consumers consider whole grains to be sustainable and environmentally friendly.
In 2018, when we asked if sustainability was one of the reasons people choose whole grains, just 12% of consumers said yes. Today, 19% say sustainability is a factor in choosing whole grains, and among young consumers (Gen Z and Millennials) this is an even stronger motivator, with 26% citing sustainability in their decision making.
About a quarter of consumers know about sprouted grains and seek them out.
This figure is even higher among plant-based eaters (vegans, veg-etarians, pescatarians, and those who follow a plant-based diet) (47%) and parents of young children (age 0–12) (42%). Shoppers choose sprouted grains for their flavor and taste (58%) as well as their digestibility (44%) and nutritional characteristics (such as the increased bioavailability of nutrients) (41%).
There continues to be a lot of confusion about gluten.
About half of American consumers have some idea what gluten is, but very few (7%) can fully define it correctly. Although one quarter of consumers told us they have cut back on gluten, 92% of people say they eat gluten some or all of the time, meaning that they are not following a true gluten-free diet. Only 1.84% of consumers told
us they avoid gluten entirely due to a medical diagnosis, which lines up with the estimated prevalence of celiac disease in the gen-eral population.
Third-party packaging symbols like the Whole Grain Stamp boost consumer confidence and provide important information to consumers.
About two-thirds of consumers say seeing third-party labeling on foods gives them more confidence in the products they are buying. Our survey also found that a significant majority of consumers (70%) wish information about the whole grain content of products was included on product packaging. The Whole Grain Stamp provides this whole grain content information, making it easy to identify and compare whole grain products when shopping, while also providing the peace-of-mind that third-party labeling offers consumers.
More people than ever say they trust the Whole Grain Stamp.
Trust in the Whole Grain Stamp has increased steadily over the past six years, with 86% of all consumers today saying they trust the Whole Grain Stamp, 89% percent of younger consumers saying they trust it, and 91% of parents with young children telling us they trust it. Three out of four consumers say they would use the Whole Grain Stamp as part of their purchasing decision, and most consum-ers say they would be skeptical of any whole grain claims made on a product that did not use the Whole Grain Stamp.
5 2021 Whole Grains Consumer Insights Survey © 2021 Oldways5 2021 Whole Grains Consumer Insights Survey © 2021 Oldways
Consumer Food Habits

© 2021 Oldways6 2021 Whole Grains Consumer Insights Survey | Consumer Food Habits
Q2. Which of the following statements best describe your food purchasing decisions? Choose all that apply.
Top influences on purchasing decisions include flavor, familiarity, health, ease of preparation, and a desire to try new foods.
Consumer purchasing decisions
I try to avoid added sugars. 39%
The price of the product is a major factor in my purchasing decision. 47%
I look for products that contain whole grains. 31%
I seek out products that are quick and easy to prepare. 48%
I look for products that contain a lot of fiber. 24%
The taste and flavor of the product is a major factor in my purchasing decision. 64%
Buying healthy food is important to me. 50%
I try to avoid carbohydrates. 18%
I eat mostly foods that I’m familiar with. 54%
I like to try new foods and ingredients. 48%
I buy a lot of organic foods. 23%
I try to choose foods that are environmentally sustainable and good for the climate. 21%
I like to buy prepared meals that I can heat up at home. 28%
I purchase food from local producers, farmers’ markets and/or farm shares.26%

© 2021 Oldways7 2021 Whole Grains Consumer Insights Survey | Consumer Food Habits
Q2. Which of the following statements best describe your food purchasing decisions? Choose all that apply.
Older consumers are more likely than younger consumers to avoid carbohydrates and added sugar and when shopping. They’re also less likely to choose organic or environmentally sustainable foods, and to buy prepared foods.
Comparing purchasing decisions, younger versus older consumers
32%
44%
14%21%
27%20%
25%19%
35%25%
I try to avoid added sugars.
50%40%30%20%10%0%
I try to avoid carbohydrates.
I buy a lot of organic foods.
I try to choose foods that are environmentally sustainable.
I like to buy prepared meals that I can heat up at home.
All consumers
Older consumers (Gen X, Boomers, the Silent Generation)
Younger consumers (Gen Z and Millennials)

© 2021 Oldways8 2021 Whole Grains Consumer Insights Survey | Consumer Food Habits
Q2. Which of the following statements best describe your food purchasing decisions? Choose all that apply.
Consumers who eat a plant-based diet (vegan, vegetarian, pescatarian, and plant-based) prioritize foods that are healthy, whole grain, organic, or sustainable. Price is less of a concern.
Purchasing decisions of plant-based eaters
51%39%
31%41%
23%46%
21%38%
35%47%
50%71%
80%60%40%20%0%
I buy a lot of organic foods.
I try to choose foods that are environmentally sustainable.
The price of the product is a major factor in my
purchasing decision.
All consumers
Plant-based eaters
I try to avoid added sugars.
Buying healthy food is important to me.
I look for products that contain whole grains.

© 2021 Oldways9 2021 Whole Grains Consumer Insights Survey | Consumer Food Habits
Q2. Which of the following statements best describe your food purchasing decisions? Choose all that apply.
Consumers who are health-conscious also look for whole grain, organic, or sustainable foods. They buy from local producers more frequently.
Purchasing decisions of consumers who say that healthy food is important to them
50%40%30%20%10%0%
I buy a lot of organic foods.
I try to choose foods that are environmentally sustainable.
I purchase food from local producers, farmers’ markets
and/or farm shares.
All consumers
Health-conscious consumers
I look for products that contain whole grains.
I look for products that contain a lot of fiber.
24%35%
23%35%
21%30%
31%46%
26%33%

© 2021 Oldways10 2021 Whole Grains Consumer Insights Survey | Consumer Food Habits
Q3. How would you best describe your eating habits & preferences? (Select one)
The vast majority of consumers are omnivores.Consumers who say (in Q2) that buying healthy food is important to them are slightly more likely to eat some variety of a plant-based diet [16% compared with 12% of total respondents].
Consumer eating habits and preferences
Omnivore (I eat plants, meats, seafood, eggs and dairy) [89%]
Plant-Based (I don’t necessarily eliminate animal products, but focus on eating mostly plants, such as fruits, vegetables, whole grains, legumes, etc.) [6%]
Pescatarian (I don’t eat meat, but I do eat seafood, along with plants, eggs and dairy) [3%]
Vegetarian (I don’t eat meat or seafood, but I eat plants, eggs and dairy) [2%]
Vegan (I don’t eat any animal products, meaning no meat, seafood, eggs, or dairy) [1%]
© 2021 Oldways11 2021 Whole Grains Consumer Insights Survey | Consumer Food Habits
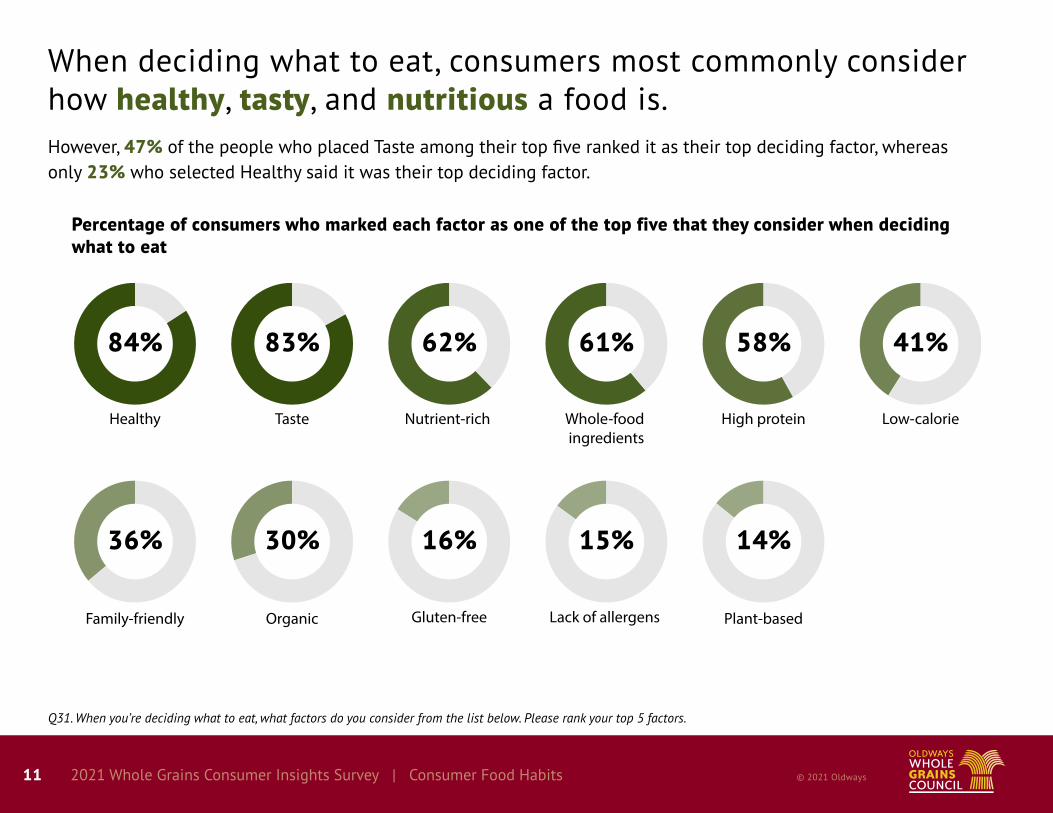
When deciding what to eat, consumers most commonly consider how healthy, tasty, and nutritious a food is.However, 47% of the people who placed Taste among their top five ranked it as their top deciding factor, whereas only 23% who selected Healthy said it was their top deciding factor.
Percentage of consumers who marked each factor as one of the top five that they consider when deciding what to eat
Whole-food ingredients
61%
Organic
30%
Plant-based
14%
Low-calorie
41%
Healthy
84%
Family-friendly
36%
Taste
83%
High protein
58%
Gluten-free
16%
Lack of allergens
15%
Nutrient-rich
62%
Q31. When you’re deciding what to eat, what factors do you consider from the list below. Please rank your top 5 factors.

© 2021 Oldways12 2021 Whole Grains Consumer Insights Survey | Consumer Food Habits
Family, restaurant meals, and cooking shows or books are the most popular sources of meal and recipe inspiration for consumers.59% of those who marked Family among their top three ranked it as their top source of inspiration.
Percentage of consumers who marked each inspiration source as one of their top three most influential
78%
30% 26%
57%
10%
50%
FriendsFamily Restaurant meals Cooking shows, books, or magazines
OtherProfessional chefsSocial media
44%
Responses included: “my own expertise and experience in the kitchen,” “my own imagination and original ideas,” “recipe websites/internet,” recipe apps on my phone,” “experimentation in the kitchen” “my mood/cravings,” and “the food in my refrigerator”
Q32. When it comes to meal/recipe inspiration, which of the following do you find to be the most influential? Please rank your top 3.

© 2021 Oldways13 2021 Whole Grains Consumer Insights Survey | Consumer Food Habits
Among American consumers, the most popular cuisines are American, Italian, Tex-Mex/Mexican, Chinese, and BBQ/Soul Food.
Percentage of consumers who marked each cuisine as one of their top three favorites
0% 20% 40% 60%
2% African-inspired foods / Ethiopian
6% Caribbean cuisine
7% French
6% Indian
4% Korean
7% Latin American Foods
1% Nordic
7% Thai
11% Spanish
1% Vietnamese
2% Other
59% American
55% Italian
38% Tex-Mex / Mexican
36% Chinese
34% BBQ / Soul Food
13% Japanese / Sushi
12% Mediterranean
Q33. What are your top 3 favorite cuisines? Select your top 3.

© 2021 Oldways14 2021 Whole Grains Consumer Insights Survey | Consumer Food Habits
Fewer younger consumers favor the top-ranked cuisines; they appear interested in a broader range of cuisines.
Differences in cuisine preferences between older consumers (Gen X, Boomers, the Silent Generation) and younger consumers (Gen Z and Millenials)
Cuisine Older Consumers Younger Consumers Change
American 60% 56% -4
Italian 59% 48% -11
Tex-Mex/Mexican 40% 35% -5
Chinese 37% 36% -1
BBQ/Soul Food 32% 37% +5
Japanese/Sushi 12% 14% +2
Mediterranean 13% 10% -3
Spanish 8% 15% +7
French 5% 10% +5
Latin American Foods 6% 9% +3
Thai 7% 6% -1
Caribbean cuisine 5% 7% +2
Indian 5% 8% +3
Korean 3% 5% +2
African-inspired/Ethiopian 1% 4% +3
Nordic 0% 1% +1
Vietnamese 2% 1% -1
Q33. What are your top 3 favorite cuisines? Select your top 3.

© 2021 Oldways15 2021 Whole Grains Consumer Insights Survey | Consumer Food Habits
Most consumers—82%—say they read packaging labels like the Nutrition Facts Panel at least some of the time. Half of consumers read them quite often or all the time.
Frequency with which consumers read packaging labels when buying food
Rarely Some of the time
4% 15% 31%
Quite often All the time
34% 17%
Never
Q34. When you are buying food and/or groceries, how often do you read the labels, i.e., the ingredients and/or the Nutrition Facts Panel? (Select one)

© 2021 Oldways16 2021 Whole Grains Consumer Insights Survey | Consumer Food Habits
Q22. How have your eating/cooking habits changed since the start of the COVID-19 pandemic? Choose all that apply.
Half of American consumers are eating more home-cooked meals as a result of the pandemic. Parents of young children (age 0–12) are much more likely to be using more meal kits since the start of the pandem-ic [12%] and more likely to be doing more baking at home [28%].
Changes in eating/cooking habits since the start of COVID-19
28%
My habits have not changed
52%
I eat more home-cooked meals
18%
I order more takeout
5%
I use more meal kits/food subscription services
6%
I am eating fewer whole grains
20%
I am eating more whole grains
22%
I am doing more baking at home
1 in 5 consumers eats more whole grains now than they did before the pandemic.
1% of respondents chose “Other” Responses included: “more adventurous combinations,” “no change”

17 2021 Whole Grains Consumer Insights Survey © 2021 Oldways17 2021 Whole Grains Consumer Insights Survey © 2021 Oldways
Whole Grain Consumption

© 2021 Oldways18 2021 Whole Grains Consumer Insights Survey | Whole Grain Consumption
Consumers choose whole grain breads, rolls, and buns nearly half the time.
These numbers represent the average percentage consumed as whole grains across all those who said they eat each type of food.
Q4. How often do you choose whole grain versions of foods? For each of the following foods that you typically eat, please indicate what percent of the time the food is whole grain.
Breads, breakfast cereals, and grain sides are the foods most commonly consumed as whole grains.
Frequency with which consumers choose whole grain versions of foods
47%
0% 50%40%30%20%10%
31% Pasta
47% Bread, rolls, buns
42% Breakfast cereals (hot or cold)
36% Rice and other grain sides
34% Crackers and snacks
30% Tortillas and wraps
24% Pancakes, wa�es, French toast, and mu�ns
21% Cookies, cakes, and baked treats
18% Biscuits
18% Pizza crust

© 2021 Oldways19 2021 Whole Grains Consumer Insights Survey | Whole Grain Consumption
Q5. For which of the following food categories do you wish your whole grain consumption was higher?
Most consumers wish they ate more whole grains, particularly breads, pasta, and grain sides.
Percentage of consumers who want to increase their whole grain consumption in each category
of consumers want to increase the whole grains they eat in at least one of these categories.
0% 30% 40%20%10%
Tortillas and wraps21%
Bread, rolls, buns37%
Pasta34%
Rice and other grain sides29%
Crackers and snacks27%
Breakfast cereals (hot or cold)25%
Cookies, cakes, and baked treats24%
I don’t wish to change my whole grain consumption levels for any of these foods24%
Pancakes, wa�es, French toast, and mu�ns23%
Pizza crust23%
Biscuits17%
I don’t eat any of these types of food1%
75%

© 2021 Oldways20 2021 Whole Grains Consumer Insights Survey | Whole Grain Consumption
Q6. Which of the following statements best describes your habits in choosing grain foods? (Select one)
A majority of all consumers—59%—say they choose whole grain options at least half the time. In many demographic groups, that number is even higher:
of Gen Z and Millennial consumers
64%
of parents of young children (age 0–12)
67%
of plant-based eaters (vegan, veg-etarian, pescatarian,
and plant-based)
77%
of health-conscious consumers
74%
Overall consumer habits when choosing whole grains
of consumers who correctly defined
gluten (Q14).
68%
I nearly always choose whole grains whenever they are available.
I choose whole grains about half the time.
26% 33%
I occasionally choose whole grains.
31%
I never or almost never choose whole grains.
I rarely consume any grain foods (whole or otherwise).
7% 4%

© 2021 Oldways21 2021 Whole Grains Consumer Insights Survey | Whole Grain Consumption
Q7. Compared to five years ago, how has your consumption of whole grains changed? (Select one)
Additionally, more than half of consumers have increased their whole grain consumption in the past five years.
Changes in whole grain consumption over the past five years
I have increased my consumption of whole grains a great deal.
I have increased my consumption of whole grains somewhat.
I eat about the same amount of whole grains.
2%I have decreased my consumption
of whole grains somewhat.
2%I have decreased my consumption
of whole grains a great deal.
23% 34% 38%
Parents of young children are even more likely to have at least somewhat increased the amount of whole grains they eat.
They’re also more likely to look for whole grains when shopping (Q2) [36% compared with 31% of total respondents].
Parents of young children (age 0–12)
0% 20% 40% 60%
67%
57% All consumers

© 2021 Oldways22 2021 Whole Grains Consumer Insights Survey | Whole Grain Consumption
Q2. Which of the following statements best describe your food purchasing decisions? Choose all that apply. / Q6. Which of the following statements best describes your habits in choosing grain foods? (Select one ) / Q7. Compared to five years ago, how has your consumption of whole grains changed? (Select one)
While we often assume that low-carb dieters have lower whole grain consumption, those who said they avoid carbs are more likely to:
Look for high-fiber foods when shopping (Q2) Nearly always choose to eat whole grains (Q6)
Have increased their whole grain intake a great deal in the last five years (Q7)
0% 20% 40% 60% 0% 20% 40%
Low-carb consumers
All consumers31%
42%
26%
35% Low-carb consumers
All consumers
23%
34% Low-carb consumers
All consumers
24%
39% Low-carb consumers
All consumers
Look for whole grains when shopping (Q2)
50%
67% Low-carb consumers
All consumers
Say that healthy food is important to them (Q2)

© 2021 Oldways23 2021 Whole Grains Consumer Insights Survey | Whole Grain Consumption
Q8. Why do you choose whole grains? Choose all that apply.
Health is still the leading reason for choosing whole grains, but not the only one.
Reasons consumers choose whole grains
1% of respondents chose “Other” Responses included: “just for a change of pace,” “much more filling,” “variety,” “dieting,” “doctor says I should eat more fiber”
• Consumers who say healthy food is important to them are more likely to choose whole grains because of their health benefits [90%].
• Those who went on to answer Q14 correctly (about gluten) were also more likely to say they choose whole grains for health reasons [90%].
82% 11%19%22%38%
Health Taste SustainabilityHabit Cost

© 2021 Oldways24 2021 Whole Grains Consumer Insights Survey | Whole Grain Consumption
Q8. Why do you choose whole grains? Choose all that apply.
Young consumers (Gen Z and Millennials) are more focused on sustainability, with 26% saying they choose whole grains for that reason in 2021.
40% of plant-based eaters (vegan, vegetarian, pes-catarian, and plant-based) choose whole grains for environmental reasons.
Sustainability is increasingly a motivation for choosing whole grains.
Sustainability as a motivation for choosing whole grains over time
Young consumers, parents of young children, and plant-based eaters are more often in the habit of choosing whole grains.
Percentage of households by demographic group in the habit of purchasing whole grain foods
2018 12%
19%
0% 10% 20%
2021
All consumers19%
26%
0% 10% 20% 30%
Young consumers
All consumers
Younger consumers (Gen Z and Millennials)
Parents of young children (age 0–12)
Plant-based eaters (vegan, vegetarian, pescatarian, and plant-based)
Older consumers (Gen X, Boomers, the Silent Generation)
0% 10% 20% 30% 40%
19%
22%
26%
29%
35%

© 2021 Oldways25 2021 Whole Grains Consumer Insights Survey | Whole Grain Consumption
Q8. Why do you choose whole grains? Choose all that apply. / Q9. What, if anything, keeps you from eating more whole grains? Choose all that apply.
The number of consumers who say taste is a barrier to eating more whole grains is decreasing.Today, fewer consumers say that taste is a deterrent; more people consider the flavor of whole grains to be a benefit.
Percentage of consumers who cite taste as a barrier to higher whole grain consumption In 2021,
of consumers say the taste of whole grains is a barrier
of consumers say the taste of whole grains is a benefit
33%
38%
Of those who say they nearly always choose whole grains (Q6), 45% see taste as a benefit and only 18% see it as a barrier, suggesting that the more exposure you have to whole grains, the more you come to appreciate the nuttier, more robust flavors.
2018
2021
0% 10% 20% 30% 40% 50%
42%
33%

© 2021 Oldways26 2021 Whole Grains Consumer Insights Survey | Whole Grain Consumption
Q9. What, if anything, keeps you from eating more whole grains? Choose all that apply.
2% of respondents chose “Other” Responses included:“my family doesn’t like them,” “I just don’t eat a lot of grain foods,” and “cooking takes longer”
In addition to taste, cost remains a barrier, particularly for younger consumers.However, about a quarter of consumers say that nothing is keeping them from eating more whole grains.
Barriers to increasing whole grain consumption
• Younger consumers (Gen Z and Millennials) are more likely to see cost as a barrier [35%] than older consumers (Gen X, Boomers, and the Silent Generation) [25%].
• The fact that many Americans are not very confident in their cooking skills does not seem to be a barrier to whole grain consumption, perhaps because whole grains are found in many forms that require no cooking.
Cost
29%
Taste
33%
Availability
23% 15%
Not in the habitof buying them
4%
Don’t know how to prepare them
6%
Food allergies or medical condition
Nothing
27%

© 2021 Oldways27 2021 Whole Grains Consumer Insights Survey | Whole Grain Consumption
Q11. When you think about foods that are sustainable and environmentally friendly, what types of foods do you picture? Choose all that apply.
Two thirds of consumers consider whole grains to be sustainable and environmentally friendly.
Foods perceived by consumers as sustainable and environmentally friendly
83% 67%72%
22%25%36%40%
Fruits and vegetables Nuts, seeds, and legumes (beans & lentils)
Whole grains
Fish Poultry Red meats (beef, pork, lamb, etc.)
Eggs and dairy
© 2021 Oldways28 2021 Whole Grains Consumer Insights Survey | Whole Grain Consumption
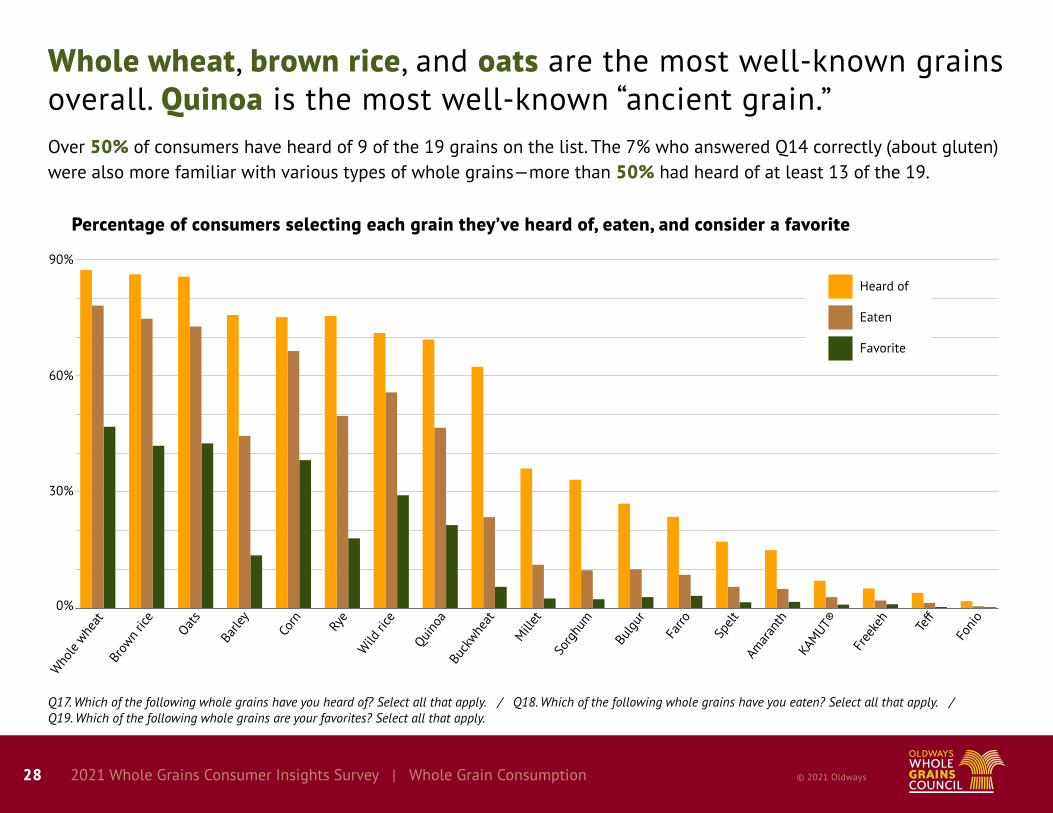
Q17. Which of the following whole grains have you heard of? Select all that apply. / Q18. Which of the following whole grains have you eaten? Select all that apply. / Q19. Which of the following whole grains are your favorites? Select all that apply.
Whole wheat, brown rice, and oats are the most well-known grains overall. Quinoa is the most well-known “ancient grain.”Over 50% of consumers have heard of 9 of the 19 grains on the list. The 7% who answered Q14 correctly (about gluten) were also more familiar with various types of whole grains—more than 50% had heard of at least 13 of the 19.
Percentage of consumers selecting each grain they’ve heard of, eaten, and consider a favorite
0%
30%
60%
90%
Who
le whe
atBr
own
rice
Oats
Barle
y
Corn Rye
Wild
rice
Quino
aBu
ckwhe
at
Millet
Sorg
hum
Bulg
ur
Farro
Spelt
Amar
anth
KAMUT®
Free
keh
Te�
Foni
o
Heard of
Eaten
Favorite

© 2021 Oldways29 2021 Whole Grains Consumer Insights Survey | Whole Grain Consumption
Who
le whe
at
Brow
n ric
e
Oats
Barle
y
Corn Rye
Wild
rice
Quino
a
Buck
wheat
Millet
Sorg
hum
Bulg
ur
Farro
Spelt
Amar
anth
KAMUT®
Free
keh
Te�
Foni
o
0%
20%
40%
60%60%
58% 58%56%
52%49%
46%44%
37% 36%
32% 31% 31%28% 28%
23% 23% 22%20%
Q18. Which of the following whole grains have you eaten? Select all that apply. / Q19. Which of the following whole grains are your favorites? Select all that apply.
Less familiar grains like freekeh, fonio, farro, and amaranth become favorites once consumers have tried them.
Percentage of consumers who consider a grain they’ve eaten to be a favorite

© 2021 Oldways30 2021 Whole Grains Consumer Insights Survey | Whole Grain Consumption
Q20. What is your one favorite whole grain food?
Whole grain bread [38%] Oatmeal [25%]
Popcorn [15%]
Whole grain pasta [10%]Whole grain cold cereal [9%]Whole grain salads [2%]
Responses to “Other” included: “whole wheat wraps,” “brown rice,” “whole grain crisp bread,” “pancakes,” “whole grains and legumes in every combo possible,” “no one favorite,” “soba noodles,” and “wild rice”
Of those who eat whole grain foods, one in three says whole grain bread is their favorite food, with oatmeal as the runner-up.While whole grain pasta is often described as a food that’s difficult to produce in whole grain form, one in ten consumers considers it their favorite whole grain food.
Consumers’ one favorite whole grain food
Other [1%]

© 2021 Oldways31 2021 Whole Grains Consumer Insights Survey | Whole Grain Consumption
Q10. Where are you most likely to eat a whole grain food? Select one.
Consumers are much more likely to eat whole grains at home.Low availability of whole grain options at restaurants and cafeterias may contribute to the lower likelihood that people would eat whole grains in these settings.
Locations where consumers say they are most likely to eat a whole grain food
At home [88%]
At a restaurant [8%]
At a work/school cafeteria or lunchroom [3%]
Other [1%]
Responses included: “friend’s home,” “all of the above,” and “when that’s all that’s available”

© 2021 Oldways32 2021 Whole Grains Consumer Insights Survey | Whole Grain Consumption
Q21. When do you eat most of your whole grains? Select one.
Breakfast is the most popular time to eat whole grains, with nearly half of consumers getting most of their whole grains at this meal.
Meal during which consumers eat most of their whole grains
Breakfast [47%]
Lunch [24%]
Dinner [23%]
Snacks [6%]

© 2021 Oldways33 2021 Whole Grains Consumer Insights Survey | Whole Grain Consumption
Q12. Do you eat/buy products made with sprouted grains?
Significantly more consumers in the following demographic groups reported seeking out sprouted grains:
Only about a quarter of consumers know about sprouted grains and seek them out.
Percentage of consumers who eat/buy products made with sprouted grains
I don’t know what sprouted grains are [42%]
No [29%]
Yes [28%]
0% 10% 20% 30% 40% 50%
28%
36%
37%
42%
47%
All consumers
Plant-based eaters (vegan, vegetarian, pescatarian, plant-based)
Younger consumers (Gen Z and Millennials)
Parents of young children (age 0–12)
Health-conscious consumers

© 2021 Oldways34 2021 Whole Grains Consumer Insights Survey | Whole Grain Consumption
Q13. Why do you choose sprouted grain foods? Choose all that apply. / Q13a. How often do you choose sprouted grain foods? Select one.
The top reason consumers choose sprouted grains is their flavor and taste. Of the consumers who eat sprouted grains, a majority—59%—choose them at least half the time.
Reasons for choosing sprouted grains
I choose sprouted grains about half the time.
23% 36%
I occasionally choose sprouted grains.
41%
I nearly always choose sprouted grains whenever they are available.
Frequency with which consumers of sprouted grains choose them
3% of respondents chose “Other” Responses included: “less likely to give me acid,” “biblical,” “healthy,” “try something new and different,” “texture,” and “keeps you feeling fuller”
Flavor and taste Digestibility Bioavailability of nutrients
58% 44% 41% 26%
Reduced anti-nutrients/phytates

© 2021 Oldways35 2021 Whole Grains Consumer Insights Survey | Whole Grain Consumption
Q14. What is gluten? Select all that apply.
About half of American consumers have some idea what gluten is—but few can fully define it correctly.
In the survey, there were two correct answers to the question “What is gluten?”
1. A protein found in wheat, barley, and rye 2. Helps bread dough stretch and rise
The seven percent who fully answered this question correctly are more likely to be women, much more likely to have a graduate degree, and more likely to have a household income over $100k.
• 60% are women
• 31% have a graduate degree [compared with 17% in the general pool of respondents]
• 35% have a household income over $100k [com-pared with 22% in the general pool of respondents]
of consumers selected one of the correct answers
of consumers selected both correct answers
(and didn’t select any additional answers)
54%
7%

© 2021 Oldways36 2021 Whole Grains Consumer Insights Survey | Whole Grain Consumption
Q14. What is gluten? Select all that apply.
Nearly a quarter of consumers responded that they don’t know what gluten is.A similar percentage of consumers incorrectly identified gluten as something found in all grains.
Consumers’ definitions of gluten
6%
42%
21% 12%
23%
9%
22%
A dangerous carbohydrate
A protein found in wheat, barley, and rye
It helps bread dough stretch and rise
Don’t know
A substance that makes you gain weight
An unnatural substance found in GMO grains
Something found in all grains
Those who avoid carbs are more likely to believe that gluten is dangerous [13%].
1% of respondents chose “Other” Responses included: “white flour,” “something trendy for people to obsess about,” “preservative,” and “something bad for celiac disease”

© 2021 Oldways37 2021 Whole Grains Consumer Insights Survey | Whole Grain Consumption
Even more consumers in the following demographic groups have reduced their consumption of gluten-containing foods:
Q15. Do you actively avoid gluten?
At least a quarter of consumers have cut back on gluten but are not following a true gluten-free diet.People with a medically diagnosed gluten problem (such as celiac disease) must avoid even the smallest crumb of gluten-containing foods for a gluten-free diet to be effective.
Gluten avoidance among consumers
I’ve cut back on gluten as part of my diet, but do not avoid it altogether [26%]
No, I do not avoid gluten [66%]
Yes, I always avoid gluten [8%]
0% 20% 40% 60%
All consumers26%
32%
37%
41%
51%
Younger consumers (Gen Z and Millennials)
Plant-based eaters (vegan, vegetarian, pescatarian, plant-based)
Health-conscious consumers
Consumers who avoid carbs
© 2021 Oldways38 2021 Whole Grains Consumer Insights Survey | Whole Grain Consumption
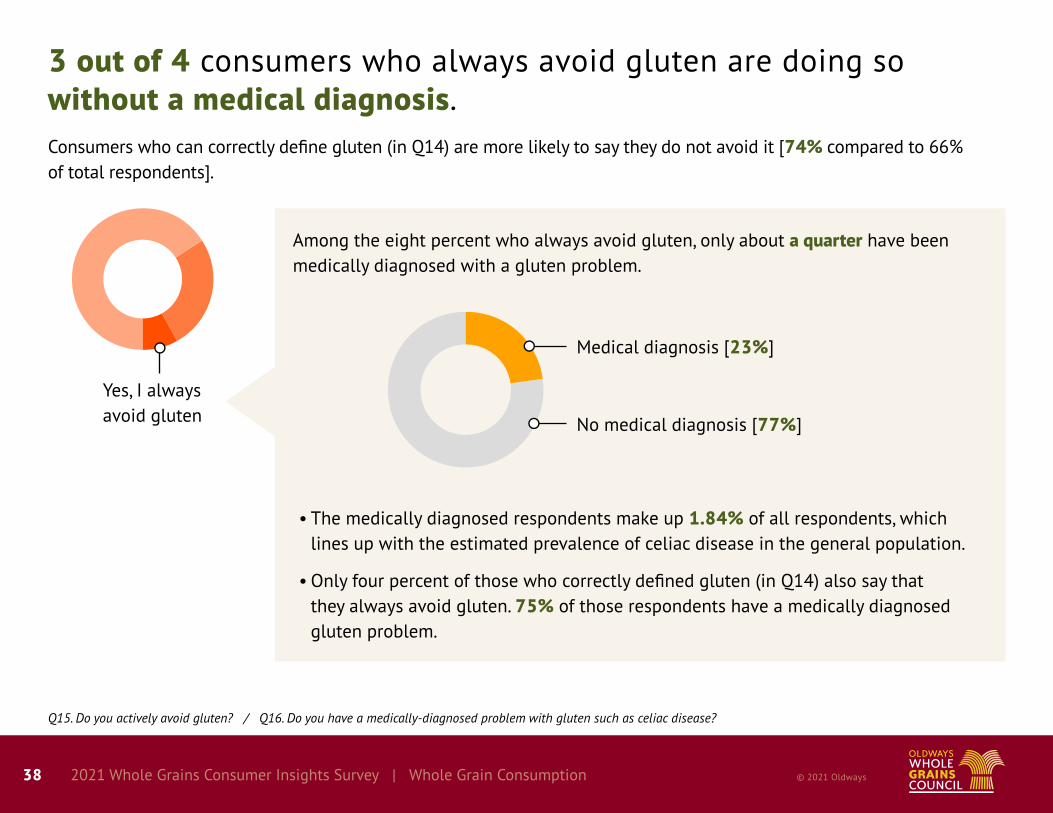
3 out of 4 consumers who always avoid gluten are doing so without a medical diagnosis.Consumers who can correctly define gluten (in Q14) are more likely to say they do not avoid it [74% compared to 66% of total respondents].
Among the eight percent who always avoid gluten, only about a quarter have been medically diagnosed with a gluten problem.
• The medically diagnosed respondents make up 1.84% of all respondents, which lines up with the estimated prevalence of celiac disease in the general population.
• Only four percent of those who correctly defined gluten (in Q14) also say that they always avoid gluten. 75% of those respondents have a medically diagnosed gluten problem.
Medical diagnosis [23%]
No medical diagnosis [77%]
Q15. Do you actively avoid gluten? / Q16. Do you have a medically-diagnosed problem with gluten such as celiac disease?
Yes, I always avoid gluten

39 2021 Whole Grains Consumer Insights Survey © 2021 Oldways39 2021 Whole Grains Consumer Insights Survey © 2021 Oldways
Whole Grain Labeling

© 2021 Oldways40 2021 Whole Grains Consumer Insights Survey | Whole Grain Labeling
Q23. The whole grain content of packaged food is not currently included on the product’s Nutrition Facts Panel. Is the whole grain content of a food something you wish was displayed on the product packaging?
A significant majority of consumers want the whole grain content of products to be included on the packaging (something the Whole Grain Stamp offers consumers).
Consumer interest in seeing whole grain content displayed on packaging
Yes [70%]
No [10%]
Not sure [20%]
Health-conscious consumers and consumers who frequently read the Nutrition Facts Panel are even more likely to want the whole grain contents of foods to be included.
0% 20% 40% 60% 80%
70%
82%
84%
All consumers
Frequent readers ofNutrition Facts Panels
Health-consciousconsumers

© 2021 Oldways41 2021 Whole Grains Consumer Insights Survey | Whole Grain Labeling
Q24. Have you seen the Whole Grain Stamp on packages?
Over one third of all consumers recognize the Whole Grain Stamp; nearly two thirds of younger consumers recognize it.
Percentage of consumers who have seen the Whole Grain Stamp on packaging
Yes [44%]
Not sure [22%]
No [33%]
While older consumers don’t recognize the Stamp as often, other demographic groups are much more likely to have seen it:
All consumers
Frequent readers ofNutrition Facts Panels
0% 20% 40% 60%
33%
44%
50%
63%
64% Younger consumers (Gen Z and Millennials)
Parents of young children (age 0–12)
Older consumers (Gen X, Boomers, the Silent Generation)

© 2021 Oldways42 2021 Whole Grains Consumer Insights Survey | Whole Grain Labeling
Q25. The Whole Grain Stamp is provided by an independent, third-party organization, certifying how much whole grain is in a product. Do you trust the Whole Grain Stamp to accurately state a product’s whole grain content?
More people than ever say they trust the Whole Grain Stamp. The Whole Grain Stamp is an easy, trusted way for companies to provide the whole grain content information we know consumers are looking for (see Q23).
Percentage of consumers who trust the Whole Grain Stamp to accurately state whole grain content
Yes [86%]
No [14%]
Over the past six years, trust in the Stamp has steadily increased.
2015: 82%
2018: 83%
2021: 86%
• Gen Z and Millennials are more likely [89%] to trust the Whole Grain Stamp than Gen X, Boomers, and the Silent Gen-eration [84%].
• 91% of parents with young children (age 0–12) say they trust the Stamp!

© 2021 Oldways43 2021 Whole Grains Consumer Insights Survey | Whole Grain Labeling
Q26. When comparing similar foods, does seeing the Whole Grain Stamp make you more likely to buy a product?
Three out of four consumers would use the Whole Grain Stamp as part of their purchasing decisions. Half of those consumers would also look at other factors like sugar and sodium content.
Consumer likeliness to purchase a product with the Whole Grain Stamp
Yes, seeing the Whole Grain Stamp would make me more likely to buy a product [39%]
Yes, but I would also consider other factors (sugar, sodium, etc.) [39%]
No, seeing the Whole Grain Stamp would not sway my purchasing decision [22%]
• Among parents with young children (age 0–12), 85% would use the Stamp; one third of those would also consid-er other factors.
• Similarly, 87% of health-conscious consumers say that seeing the Stamp would increase the likelihood that they would buy a product.
• 89% of consumers who regularly read the Nutrition Facts Panel say the Stamp would make them more likely to choose the product.

© 2021 Oldways44 2021 Whole Grains Consumer Insights Survey | Whole Grain Labeling
Q27. This is the same product, but without the Whole Grain Stamp. If you do not see the Whole Grain Stamp on a package, do you question the product’s claims about whole grains?
If a product does not use the Whole Grain Stamp, more than half of consumers would be skeptical of any whole grain claims made on its labeling.
Percentage of consumers who would question whole grain claims on products without the Stamp
Yes [51%] No [49%]
of Gen Z and Millennial consumers
58%
of parents of young children (0-12)
59%
of health-conscious consumers
59%
of frequent readers of Nutrition Facts Panels
61%

© 2021 Oldways45 2021 Whole Grains Consumer Insights Survey | Whole Grain Labeling
Q28. There are currently three versions of the Whole Grain Stamp: the 100% Stamp, the 50%+ Stamp, and the Basic Stamp. Please match each Stamp with ONE set of words that best explains it.
Over half of consumers are able to correctly identify the meaning of the three Whole Grain Stamps.
Consumer ability to correctly match each Stamp with the best explanation
1. All of the grain (100%) in this product is whole grain.
2. This product provides 100% of your recommended daily amount of whole grain.
3. This product contains a significant amount of whole grain (specified on the Stamp) but contains primarily refined grain.
4. All of the grain (100%) in this product is refined (non-whole) grain.
5. Half or more of the grain in this product is whole grain.
2
1
5
4
3
53%
®
20g or moreper serving
3
1
2
4
5
57%
®
20g or moreper serving
50%+
50%
1 2
5
4
3
®
20g or moreper serving
100%

© 2021 Oldways46 2021 Whole Grains Consumer Insights Survey | Whole Grain Labeling
Q30. When you see packaging symbols (like the Whole Grain Stamp) that are provided by independent, third-party organizations on food packages, does it give you more or less confidence in the product you’re buying? Please pick a point on the scale where 1 means Much less confidence, and a 5 means Much more confidence.
About two thirds of consumers say packaging symbols like the Whole Grain Stamp give them more confidence in the product they are buying.
Consumer confidence in products with independent, third-party food packaging symbols Ranked on a scale of 1 (Much less confidence) to 5 (Much more confidence)
35% 41% 21%
1%2%

47 2021 Whole Grains Consumer Insights Survey © 2021 Oldways47 2021 Whole Grains Consumer Insights Survey © 2021 Oldways
Demographics

© 2021 Oldways48 2021 Whole Grains Consumer Insights Survey | Demographics
Region
Northwest 21%
Midwest 21%
South 37%
West 21%
Gender
Male 50%
Female 50%
Non-binary 0%
Age/Generation
Gen Z (18–22) 8%
Millennials (28–38) 29%
Gen X (39–54) 29%
Boomers (55–73) 30%
Silent Generation (74+) 4%
Race
Caucasian 70%
Black 13%
Hispanic or Latinx 14%
Asian 6%
American Indian 2%
Other 1%
Prefer not to answer 0%
Income
Under $25,000 21%
$25,000–$49,999 25%
$50,000–$74,999 20%
$75,000–$99,999 12%
$100,000–$124,999 7%
$125,000–$149,999 6%
$150,000–$249,999 7%
$250,000 or more 2%
Children in Household
Yes 31%
No 69%
Children’s Ages (of those who said yes to having children in household)
Under age 5 37%
6–12 years 54%
13–17 years 44%
Education
Some high school or less 2%
Completed high school 18%
Trade/technical school 5%
Some college 25%
Completed college 33%
Graduate degree 17%

49 2021 Whole Grains Consumer Insights Survey © 2021 Oldways© 2021 Oldways49 2021 Whole Grains Consumer Insights Survey
For questions or more information about the survey, contact:Caroline Sluyter Whole Grains Council Program Director
WholeGrainsCouncil .org
OldwaysPT.org
@OldwaysPT
@OldwaysPT
@wholegrains_council
Oldways Preservation Trust