2021 U.S. Livestock and Poultry Outlook
37
2021 U.S. Livestock and Poultry Outlook Presented By Seanicaa E. Herron World Agricultural Outlook Board, USDA USDA Agricultural Outlook Forum February 19, 2021
Transcript of 2021 U.S. Livestock and Poultry Outlook

2021 U.S. Livestock and Poultry Outlook
Presented By
Seanicaa E. Herron
World Agricultural Outlook Board, USDA
USDA Agricultural Outlook Forum
February 19, 2021

Total Red Meat And Poultry Production Record Large In 2021
• Total red meat and poultry production up 1 percent in 2021.
• Beef, pork, broiler sectors are positioned for higher production.
0
20
40
60
80
100
120
2010 2011 2012 2013 2014 2015 2016 2017 2018 2019 2020 2021F
Billi
on P
ound
s
Beef Pork Poultry* Other
+1.0%

Per Capita Disappearance, Retail Basis
• Per capita disappearance projected to reach 224.8 pounds in 2021.
• Down fractionally from 2020.
0
50
100
150
200
250
2010 2011 2012 2013 2014 2015 2016 2017 2018 2019 2020 2021F
Poun
ds, R
etai
l Wei
ght
Beef Pork Broiler Turkey Other
-0.1%

Feed Cost Outlook
• Corn: $3.56 per bushel in 2019/20$4.30 per bushel in 2020/21$4.20 per bushel in 2021/22
• SBM: $299.50 per ton in 2019/20$400 per ton in 2020/21$390 per ton in 2021/22

Meat Exports Increasingly Important
Poultry = Broilers & Turkey
0.0
1.0
2.0
3.0
4.0
5.0
6.0
7.0
8.0
9.0
2010 2011 2012 2013 2014 2015 2016 2017 2018 2019 2020 2021F
Billi
ons P
ound
s
Beef Pork Poultry

Livestock & Poultry Prices Forecast Higher
• Livestock and poultry prices forecast higher on recovering demand in 2021.
• Egg prices virtually unchanged
-40
-30
-20
-10
0
10
20
30
40
2017 2018 2019 2020 2021F
Yr/Y
r Per
cent
Cha
nge
Cattle Hogs Broilers Turkeys Eggs


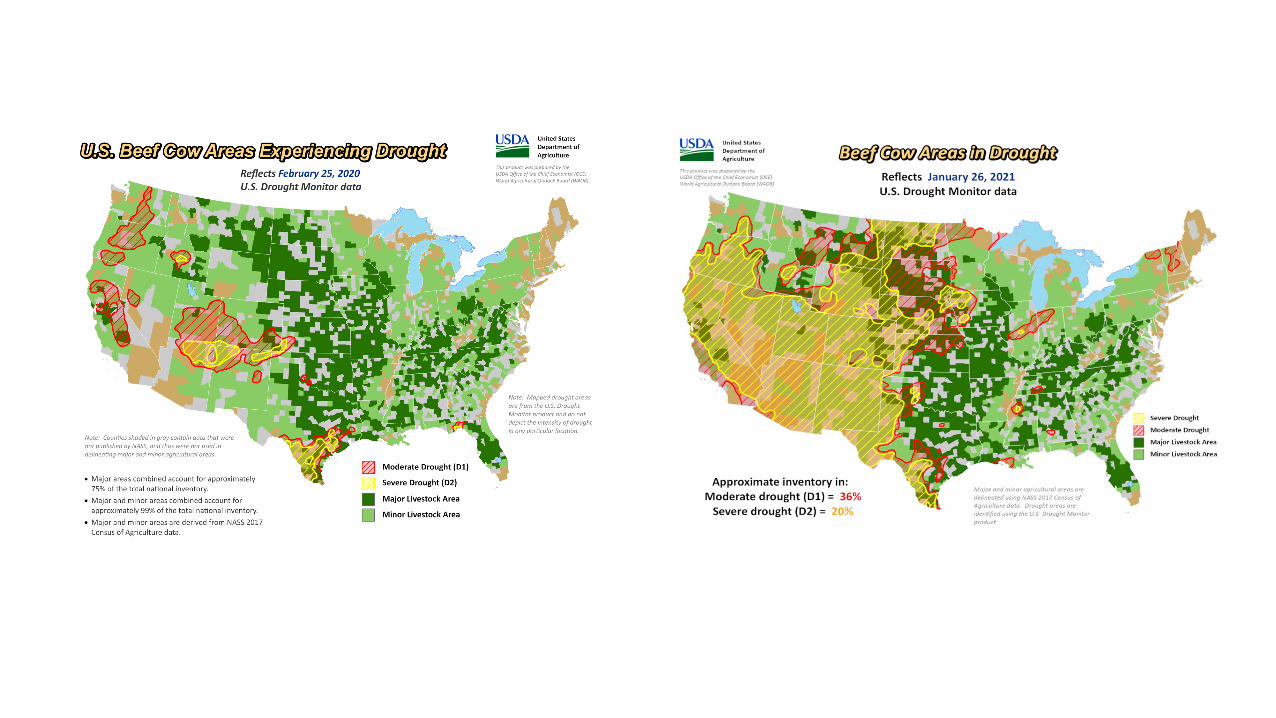
January 1 Cattle Inventory
• U.S. cattle herd declined for the second year.
• 93.6 million head as of Jan. 1, 2021, down 0.2 percent year-over.
80
85
90
95
100
105
1990
1991
1992
1993
1994
1995
1996
1997
1998
1999
2000
2001
2002
2003
2004
2005
2006
2007
2008
2009
2010
2011
2012
2013
2014
2015
2016
2017
2018
2019
2020
2021
2022
F
Mill
ion
Head

Beef Cow Herd, Calf-crop Decreases
• Beef cow herd down 1 percent at 31.2 million head.
• 2020 calf-crop estimated at 35.1 million head, 1 percent smaller than 2019 calf-crop.
• Rate of decline expected to slow as producers retain approximately the same level of replacement heifers as 2020. 25
27
29
31
33
35
37
39
41
43
1990
1991
1992
1993
1994
1995
1996
1997
1998
1999
2000
2001
2002
2003
2004
2005
2006
2007
2008
2009
2010
2011
2012
2013
2014
2015
2016
2017
2018
2019
2020
2021
Mill
ion
Head
Beef Cows Calf-crop* (2020)
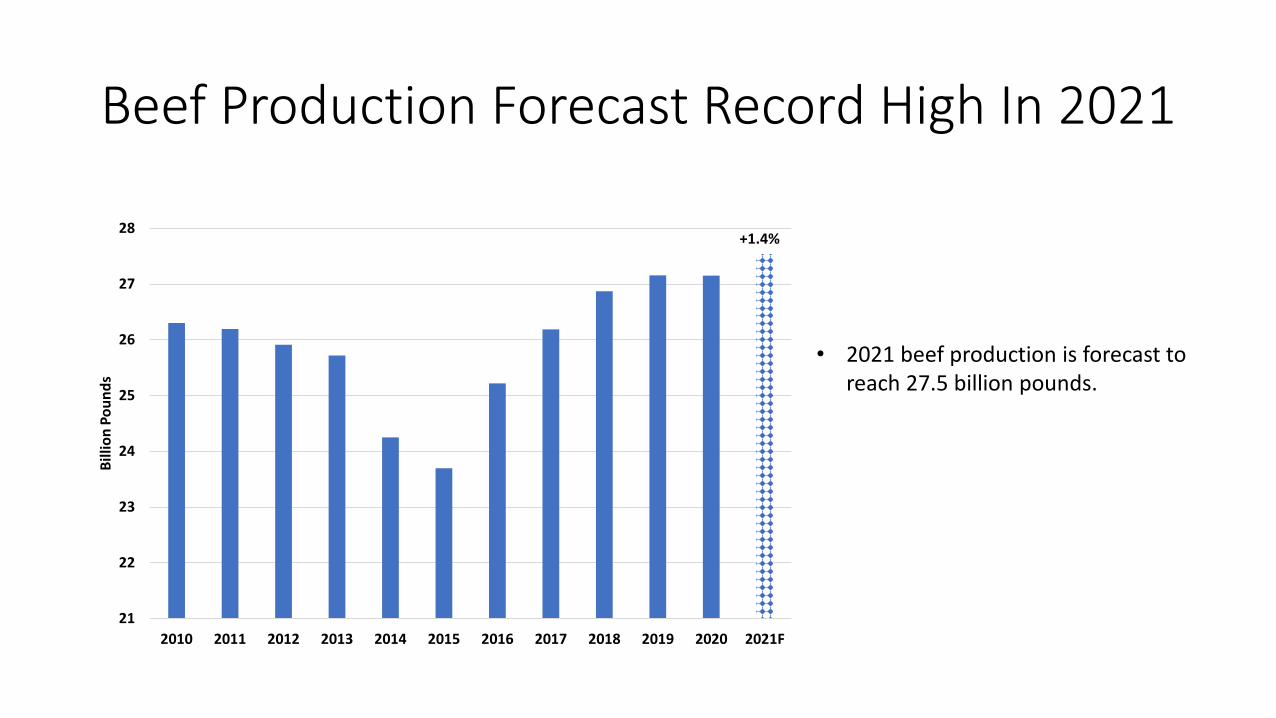
Beef Production Forecast Record High In 2021
• 2021 beef production is forecast to reach 27.5 billion pounds.
21
22
23
24
25
26
27
28
2010 2011 2012 2013 2014 2015 2016 2017 2018 2019 2020 2021F
Billi
on P
ound
s
+1.4%

Beef Exports Forecast to Increase In 2021
• Beef exports forecast to reach 3.1 billion pounds this year.
0.0
0.5
1.0
1.5
2.0
2.5
3.0
3.5
2010 2011 2012 2013 2014 2015 2016 2017 2018 2019 2020 2021F
Billi
on P
ound
s
+6.4%

Cattle Prices Forecast Higher In 2021
$80
$90
$100
$110
$120
$130
$140
$150
$160
2010 2011 2012 2013 2014 2015 2016 2017 2018 2019 2020 2021F
$/CW
T
5-area steer price
+5.8%


Hog Inventories, Breeding Herd Lower On December 1, 2020
• All hogs and pigs estimated at 77.5 million head, down 1 percent from the previous year.
• Breeding herd estimated at 6.3 million head, down 3 percent from 2019.
5.0
5.5
6.0
6.5
7.0
7.5
50.0
55.0
60.0
65.0
70.0
75.0
80.0
1990
1992
1994
1996
1998
2000
2002
2004
2006
2008
2010
2012
2014
2016
2018
2020
Bree
ding
Her
d
Dec
1 Ho
g In
vent
ory
Hog Inventory Dec 1 Breeding Herd

Producer Farrowing Intentions Mixed
*Forecast - 2021 Q1 & Q2 reported intentions. Q3 & Q4 forecasts.
2.8
2.9
2.9
3.0
3.0
3.1
3.1
3.2
3.2
3.3
3.3
QI QII QIII QIV
2018 2019 2020 2021F
+2.0%-1.0%

Pigs Per Litter Increasing
8.5
9
9.5
10
10.5
11
11.520
11 II III IV20
12 II III IV20
13 II III IV20
14 II III IV20
15 II III IV20
16 II III IV20
17 II III IV20
18 II III IV20
19 II III IV20
20 II III IV20
21F II III IV
Head

Pork Production Forecast Record High in 2021
• Pork production is forecast to reach 28.7 billion pounds in 2021.
0
5
10
15
20
25
30
35
2010 2011 2012 2013 2014 2015 2016 2017 2018 2019 2020 2021F
Billi
on P
ound
s
+1.4%

Pork Exports Lower in 2021
• Pork exports are forecast at 7.2 billion pounds, down 1.5 percent year over.
• Rapid growth in import demand from China is expected to slow in 2021 as China begins to recover from African Swine Fever (ASF).
0.0
1.0
2.0
3.0
4.0
5.0
6.0
7.0
8.020
10
2011
2012
2013
2014
2015
2016
2017
2018
2019
2020
2021
F
Billi
on P
ound
s
-1.5%

Hog Prices Forecast Higher in 2021
$30.00
$35.00
$40.00
$45.00
$50.00
$55.00
$60.00
$65.00
$70.00
$75.00
$80.00
2010 2011 2012 2013 2014 2015 2016 2017 2018 2019 2020 2021F
$/CW
T
National Base, Live equiv 51-52% lean
+16.9%


Broiler Laying Flock Above 2019 Levels
55
56
57
58
59
60
61
62
63
Jan Feb Mar Apr May Jun Jul Aug Sep Oct Nov Dec
Mill
ion
Bird
s
2018 2019 2020

Chick Placements Lower in early 2021
160
165
170
175
180
185
190
195
1 4 7 10 13 16 19 22 25 28 31 34 37 40 43 46 49 52
Mill
ion
Bird
s
U.S. Total Chicks Placed
2018 2019 2020 2021

Heavier Bird Weights Support Increased Production in 2021
5.8
5.9
6.0
6.1
6.2
6.3
6.4
6.5
6.6
1 4 7 10 13 16 19 22 25 28 31 34 37 40 43 46 49 52
Poun
ds, A
vg L
ivew
eigh
t
2019 2020 2021

Broiler Production Forecast Record High in 2021
• Broiler production is forecast to reach 44.9 billion pounds this year.
0
5
10
15
20
25
30
35
40
45
50
2010 2011 2012 2013 2014 2015 2016 2017 2018 2019 2020 2021F
Billi
on P
ound
s
+0.7%
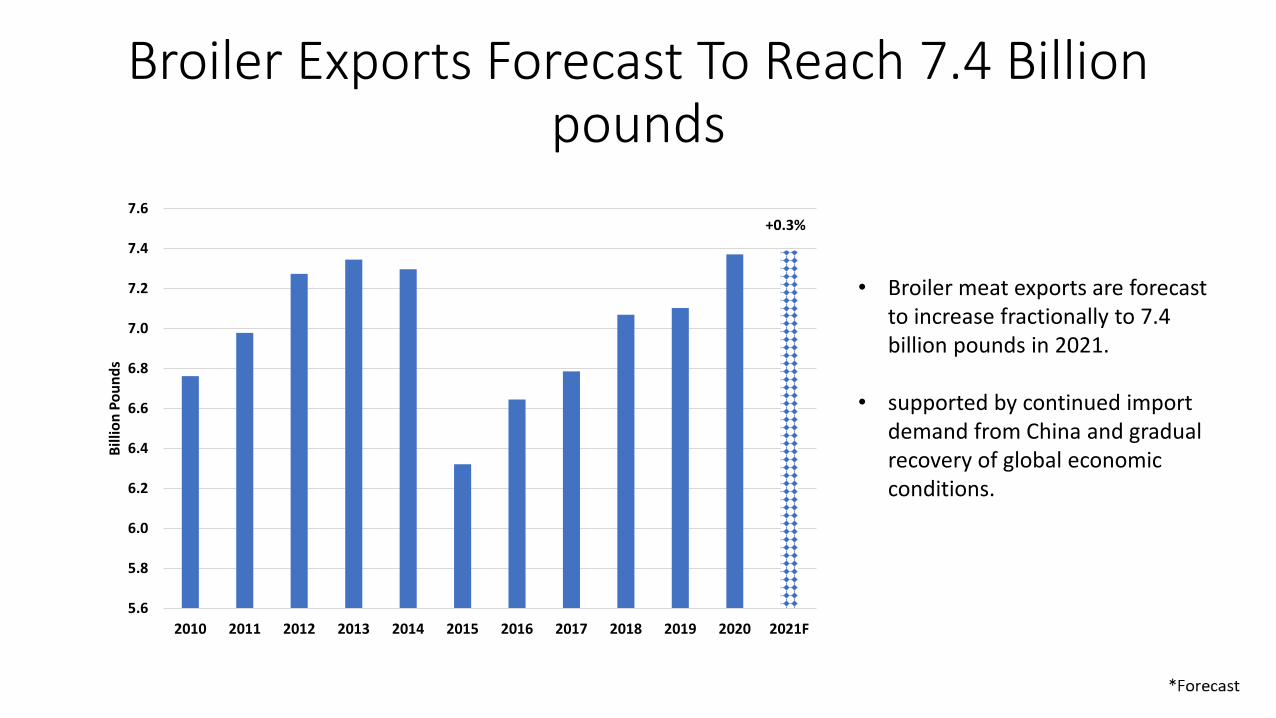
Broiler Exports Forecast To Reach 7.4 Billion pounds
• Broiler meat exports are forecast to increase fractionally to 7.4 billion pounds in 2021.
• supported by continued import demand from China and gradual recovery of global economic conditions.
5.6
5.8
6.0
6.2
6.4
6.6
6.8
7.0
7.2
7.4
7.6
2010 2011 2012 2013 2014 2015 2016 2017 2018 2019 2020 2021F
Billi
on P
ound
s
+0.3%

Broiler Prices Forecast Higher In 2021
60
65
70
75
80
85
90
95
100
105
110
2010
2011
2012
2013
2014
2015
2016
2017
2018
2019
2020
2021
F
Cent
s Per
Pou
nd
National composite weighted avg.
+15.4


Turkey Poult Placements Below Year-Ago
15
17
19
21
23
25
27
Jan Feb Mar Apr May Jun Jul Aug Sep Oct Nov Dec
Mill
ion
Bird
s
2018 2019 2020 2021

Turkey Eggs In Incubators Below Year-Ago
20
22
24
26
28
30
32
Jan Feb Mar Apr May Jun Jul Aug Sep Oct Nov Dec
Mill
ion
Eggs
2018 2019 2020 2021
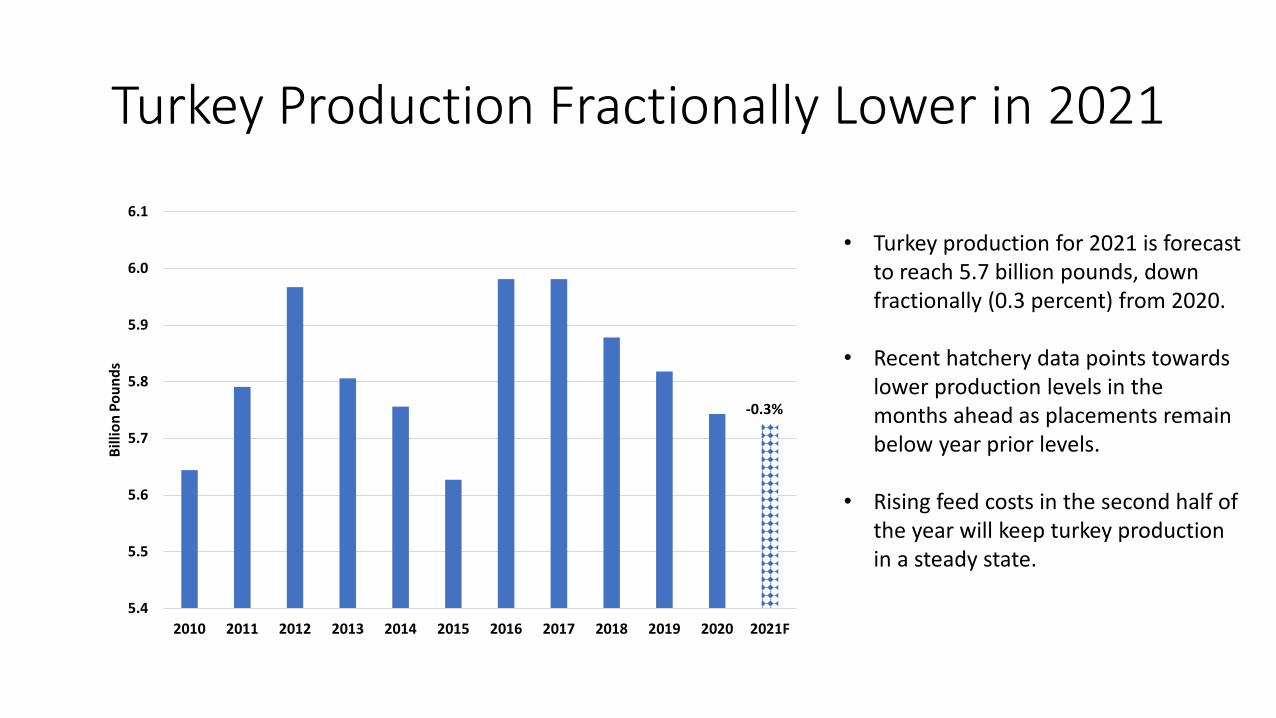
Turkey Production Fractionally Lower in 2021
• Turkey production for 2021 is forecast to reach 5.7 billion pounds, down fractionally (0.3 percent) from 2020.
• Recent hatchery data points towards lower production levels in the months ahead as placements remain below year prior levels.
• Rising feed costs in the second half of the year will keep turkey production in a steady state.
5.4
5.5
5.6
5.7
5.8
5.9
6.0
6.1
2010 2011 2012 2013 2014 2015 2016 2017 2018 2019 2020 2021F
Billi
on P
ound
s
-0.3%

Turkey Exports Slightly Higher in 2021
• In 2021, turkey exports are forecast slightly higher on recovering global demand.
0
0.1
0.2
0.3
0.4
0.5
0.6
0.7
0.8
0.9
2010 2011 2012 2013 2014 2015 2016 2017 2018 2019 2020 2021F
Billi
on P
ound
s
+0.6%

Turkey Prices Forecast Higher In 2021
70
75
80
85
90
95
100
105
110
115
120
2010 2011 2012 2013 2014 2015 2016 2017 2018 2019 2020 2021F
Cent
s Per
Pou
nd
National Turkey Hen Price
+4.0%
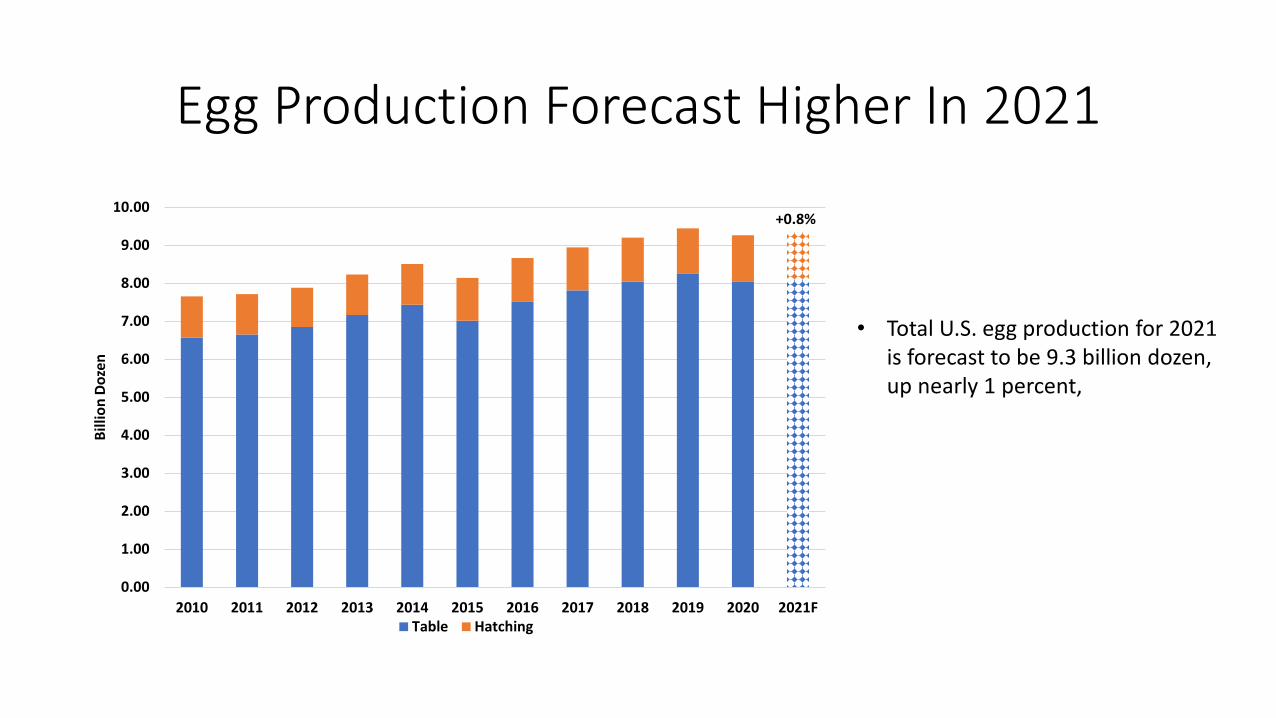
Egg Production Forecast Higher In 2021
• Total U.S. egg production for 2021 is forecast to be 9.3 billion dozen, up nearly 1 percent,
0.00
1.00
2.00
3.00
4.00
5.00
6.00
7.00
8.00
9.00
10.00
2010 2011 2012 2013 2014 2015 2016 2017 2018 2019 2020 2021F
Billi
on D
ozen
Table Hatching
+0.8%
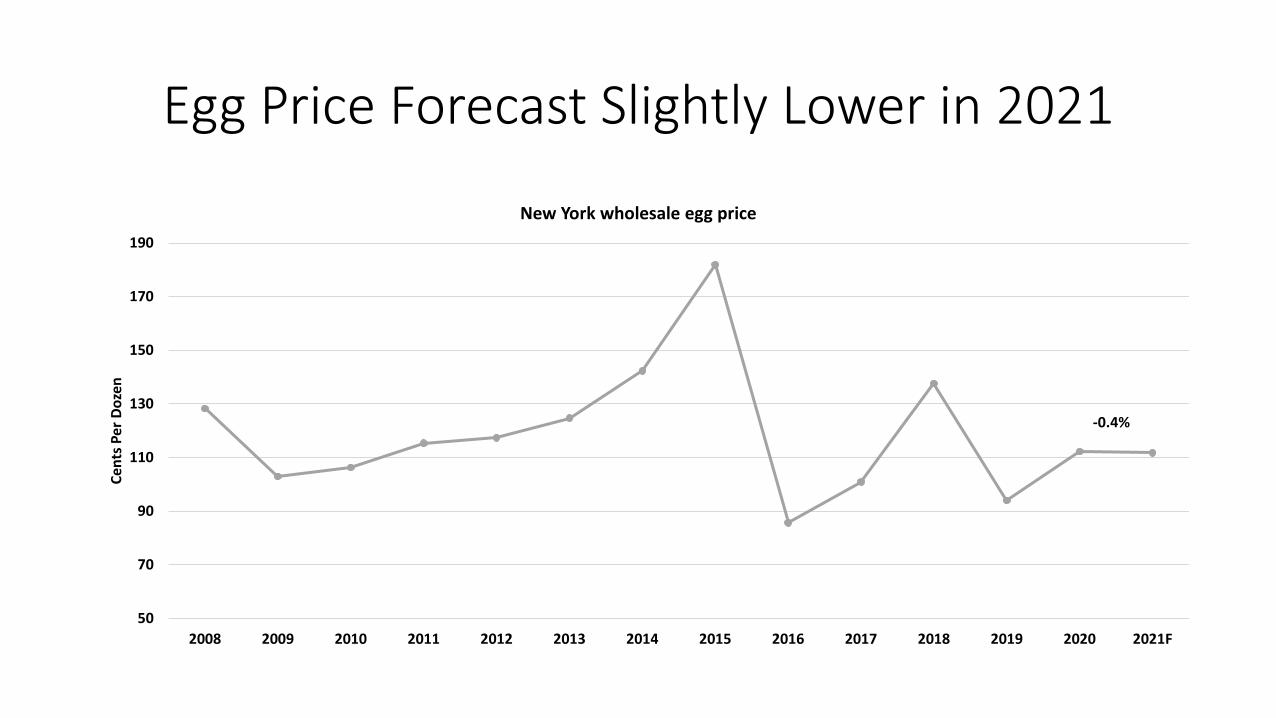
Egg Price Forecast Slightly Lower in 2021
50
70
90
110
130
150
170
190
2008 2009 2010 2011 2012 2013 2014 2015 2016 2017 2018 2019 2020 2021F
Cent
s Per
Doz
en
New York wholesale egg price
-0.4%

Additional information about USDA outlook is available at the following websites:
• World Agricultural Outlook Board (WAOB)World Agricultural Supply and Demand Estimates
• www.usda.gov/oce/commodity/wasde/index.htm
• Economic Research Service (ERS)Livestock, Dairy, and Poultry Situation and Outlook
• https://www.ers.usda.gov/publications/?page=1&topicId=0&authorId=0&seriesCode=LDPM&sort=CopyrightDate&sortDir=desc
• Foreign Agricultural Service (FAS)Livestock and Poultry: World Markets and Trade
• http://www.fas.usda.gov/data/livestock-and-poultry-world-markets-and-trade