2021 Second Quarter Results
30
Tokyo, July 30, 2021 2021 Second Quarter Results Year-to-Date Highlights (vs. 2020) Revenue increased 11.1% to JPY 1,144.5 billion. Adjusted operating profit at constant currency increased 26.9% to JPY 365.1 billion. On a reported basis, adjusted operating profit increased 24.5% to JPY 358.2 billion. Operating profit increased 27.8% to JPY 322.1 billion. Profit attributable to owners of the parent company increased 30.5% to JPY 225.2 billion. The Company announced to offer an interim dividend of JPY 65 as initially planned. FY2021 Forecasts (vs. Initial Forecast) Revenue forecast is revised upward by JPY 120.0 billion. Adjusted operating profit at constant currency is revised upward by JPY 10.0 billion. Forecasts are revised upward for adjusted operating profit on a reported basis (JPY 42.0 billion), operating profit (JPY 39.0 billion) and profit attributable to owners of the parent company (JPY 32.0 billion). As announced in the initial forecast, the Company plans to offer an annual dividend per share of JPY 130. Please refer to P.17 ‘Data Sheets’ for more financial figures. Masamichi Terabatake, President and Chief Executive Officer of the JT Group, said: “JT Group delivered a robust performance in the first half, driven by strong business momentum. This was a result of continued market share gains in combustibles in many markets and continued tailwinds of strong industry volume trends due to travel restrictions in some mature markets. “Considering this robust performance, we have revised our full year guidance upward. “We have launched Ploom X, our next generation device for heated tobacco sticks in Japan, the world’s largest heated tobacco market. Listening carefully to our consumers around the world, we have developed our first global model, offering a richer and enhanced taste, improved design, and a more intuitive user experience. Ploom X will gradually be rolled out across other markets. “We are also making steady progress on several initiatives announced in February this year, including the rollout of our new operating model for the combined one tobacco business as well as measures to strengthen competitiveness in the Japan market. These initiatives will act as a catalyst for future growth while we continue to offer products and services which exceed our consumers’ expectations.” Investors’ Meeting An investors’ meeting (phone conference) with members of the investor community will be held on July 30, 2021 at 4:30pm Tokyo Time. An on-demand audio recording of this conference will be available on our website (https://www.jt.com/investors/results/presentation_financial). For detailed information on the consolidated financial results, please visit the Company’s website. (https://www.jt.com/investors/). Note on Hyperinflationary Adjustments In accordance with the requirements stipulated in IAS 29, the JT Group has been applying hyperinflationary accounting adjustments since Q3 2020, so both the results and the forecasts for fiscal year 2021 on a reported basis include the impact of these adjustments. Starting from Q1 2021, both the results and forecasts on a constant currency basis have been calculated to exclude amounts of revenue and profit that have increased due to hyperinflation in certain markets. 1
Transcript of 2021 Second Quarter Results

Tokyo, July 30, 2021
2021 Second Quarter Results
Year-to-Date Highlights (vs. 2020) Revenue increased 11.1% to JPY 1,144.5 billion. Adjusted operating profit at constant currency increased 26.9% to JPY 365.1 billion. On a reported basis, adjusted operating profit increased 24.5% to JPY 358.2 billion. Operating profit increased 27.8% to JPY 322.1 billion. Profit attributable to owners of the parent company increased 30.5% to JPY 225.2 billion. The Company announced to offer an interim dividend of JPY 65 as initially planned.
FY2021 Forecasts (vs. Initial Forecast) Revenue forecast is revised upward by JPY 120.0 billion. Adjusted operating profit at constant currency is revised upward by JPY 10.0 billion. Forecasts are revised upward for adjusted operating profit on a reported basis (JPY 42.0 billion), operating
profit (JPY 39.0 billion) and profit attributable to owners of the parent company (JPY 32.0 billion). As announced in the initial forecast, the Company plans to offer an annual dividend per share of JPY 130.
Please refer to P.17 ‘Data Sheets’ for more financial figures.
Masamichi Terabatake, President and Chief Executive Officer of the JT Group, said: “JT Group delivered a robust performance in the first half, driven by strong business momentum. This was a result of continued market share gains in combustibles in many markets and continued tailwinds of strong industry volume trends due to travel restrictions in some mature markets.
“Considering this robust performance, we have revised our full year guidance upward.
“We have launched Ploom X, our next generation device for heated tobacco sticks in Japan, the world’s largest heated tobacco market. Listening carefully to our consumers around the world, we have developed our first global model, offering a richer and enhanced taste, improved design, and a more intuitive user experience. Ploom X will gradually be rolled out across other markets.
“We are also making steady progress on several initiatives announced in February this year, including the rollout of our new operating model for the combined one tobacco business as well as measures to strengthen competitiveness in the Japan market. These initiatives will act as a catalyst for future growth while we continue to offer products and services which exceed our consumers’ expectations.” Investors’ Meeting An investors’ meeting (phone conference) with members of the investor community will be held on July 30, 2021 at 4:30pm Tokyo Time. An on-demand
audio recording of this conference will be available on our website (https://www.jt.com/investors/results/presentation_financial). For detailed information
on the consolidated financial results, please visit the Company’s website. (https://www.jt.com/investors/).
Note on Hyperinflationary Adjustments In accordance with the requirements stipulated in IAS 29, the JT Group has been applying hyperinflationary accounting adjustments since Q3 2020, so
both the results and the forecasts for fiscal year 2021 on a reported basis include the impact of these adjustments. Starting from Q1 2021, both the results
and forecasts on a constant currency basis have been calculated to exclude amounts of revenue and profit that have increased due to hyperinflation in
certain markets.
1

2021 Q2 Financial Results
Consolidated Results
(billions of JPY) 2020 Q2 2021 Q2 Variance 2020 YTD 2021 YTD Variance
Revenue 510.6 597.2 +17.0% 1,030.2 1,144.5 +11.1%
Adjusted operating profit 140.8 180.1 +28.0% 287.6 358.2 +24.5%
Operating profit 123.0 162.0 +31.6% 252.0 322.1 +27.8%
Profit attributable to
owners of the parent 86.1 111.4 +29.4% 172.5 225.2 +30.5%
Adjusted operating profit
at constant FX 140.8 178.2 +26.6% 287.6 365.1 +26.9%
2021 Q2
Revenue
Revenue increased by 17.0% to JPY 597.2 billion driven by increases in the international tobacco,
Japanese-domestic tobacco, pharmaceutical and processed food businesses.
Adjusted operating profit
At constant currency, adjusted operating profit increased by 26.6% to JPY 178.2 billion driven by
increases in the international tobacco, Japanese-domestic tobacco and processed food businesses,
partially offset by a decrease in the pharmaceutical business.
On a reported basis, adjusted operating profit increased by 28.0% to JPY 180.1 billion driven by
positive foreign currency impacts in the international tobacco business.
• Operating profit
Operating profit increased by 31.6% to JPY 162.0 billion driven by an increase in adjusted operating
profit.
• Profit attributable to owners of the parent
Profit attributable to owners of the parent increased by 29.4% to JPY 111.4 billion driven by factors
that include increases in operating profit and improved financing costs.
2021 YTD
Revenue
Revenue increased by 11.1% to JPY 1,144.5 billion driven by increases in the international tobacco
and Japanese-domestic tobacco businesses, partially offset by decreases in the pharmaceutical and
processed food businesses.
Adjusted operating profit
At constant currency, adjusted operating profit increased by 26.9% to JPY 365.1 billion driven by
increases in the international tobacco, Japanese-domestic tobacco and processed food businesses,
partially offset by a decrease in the pharmaceutical business.
On a reported basis, adjusted operating profit increased by 24.5% to JPY 358.2 billion, despite
negative foreign currency impacts in the international tobacco business.
• Operating profit
Operating profit increased by 27.8% to JPY 322.1 billion driven by an increase in adjusted operating
2

profit.
• Profit attributable to owners of the parent
Profit attributable to owners of the parent increased by 30.5% to JPY 225.2 billion driven by factors
that include increases in operating profit and improved financing cost.
In accordance with the requirements stipulated in IAS 29, the JT Group has been applying hyperinflationary
accounting adjustments since Q3 2020, so the results for fiscal year 2021 on a reported basis include the
impact of the adjustments. Starting from Q1 2021, results on a constant currency basis have been
calculated to exclude amounts of revenue and profit that have increased due to hyperinflation in certain
markets.
3

Results by Business Segment
International Tobacco Business
(billions of Units, billions of JPY) 2020 Q2 2021 Q2 Variance 2020 YTD 2021 YTD Variance
Total shipment volume 107.8 118.7 +10.1% 211.9 228.9 +8.0%
GFB shipment volume 68.8 79.8 +16.1% 136.3 153.5 +12.6%
Core revenue1 314.0 387.3 +23.3% 626.1 736.3 +17.6%
Adjusted operating profit1 110.3 136.6 +23.8% 214.3 270.2 +26.1%
Reference (millions of USD)
Core revenue1 2,918 3,535 +21.1%
(+15.0%)* 5,784 6,818 +17.9%
(+14.5%)*
Adjusted operating profit1 1,025 1,247 +21.7%
(+22.1%)* 1,980 2,505 +26.5%
(+29.2%)*
*at constant currency
2021 Q2
• Volume and market share2
Total shipment volume increased 10.1% including favorable inventory movements. Excluding
inventory adjustments, total shipment volume increased 9.1% building on favorable industry volume
trend comparisons in several markets and quarterly market share gains. Share grew across all key
markets of France, Italy, Russia, Spain, Taiwan, Turkey and the UK, in addition to many others,
notably Brazil, Canada, the Czech Republic, Germany, Hungary, the Philippines, Poland, Romania
and Ukraine. GFB shipment volume increased 16.1%, driven by strong growth from Winston (+14.5%),
Camel (+39.3%) and Mevius (+9.9%).
• Core revenue and adjusted operating profit1
Core revenue and adjusted operating profit increased 23.3% and 23.8%, respectively, driven by solid volume, robust price/mix contribution as well as favorable currency movements.
On a USD basis, core revenue at constant currency increased 15.0%, driven by a favorable volume
contribution of USD 246 million and a positive price/mix variance of USD 192 million, notably from
Canada, Iran, Kazakhstan, the Philippines, Romania, Turkey, the UK and Ukraine. At constant
currency, adjusted operating profit grew by 22.1%, driven by a positive volume contribution of USD
163 million and a favorable price/mix variance of USD 165 million, partially offset by continued
investments in the heated tobacco sticks segment. On a reported basis, core revenue and adjusted
operating profit increased 21.1% and 21.7%, respectively.
2021 YTD
• Volume and market share2
Total shipment volume increased 8.0% including favorable inventory movements. Excluding inventory
adjustments, total shipment volume increased 7.1%, driven by favorable industry volume trend
comparisons in several markets, mainly due to on-going travel restrictions, and robust market share
gains. Market share gains continued across many geographies, notably in in Austria, Brazil, Canada,
the Czech Republic, France, Germany, Hungary, Italy, the Philippines, Poland, Romania, Serbia,
Spain, Taiwan, Turkey, the UK and Ukraine. These positive factors more than offset the lower Duty-
Free shipment volumes resulting from COVID-19 measures. GFB shipment volume grew 12.6%,
fueled by the robust performance of Winston (+12.0%), Camel (+24.6%), LD (+3.4%) and Mevius
4

(+5.4%).
• Core revenue and Adjusted operating profit1
Core revenue and adjusted operating profit increased 17.6% and 26.1%, respectively, driven by a
strong price/mix variance and a positive volume contribution, offsetting by unfavorable currency movements.
On a USD basis, core revenue at constant currency increased 14.5%, driven by a robust volume contribution of USD 460 million and a positive price/mix variance of USD 379 million, notably from Canada, Iran, Kazakhstan, the Philippines, Russia, Turkey and Ukraine. At constant currency, adjusted operating profit grew 29.2%, driven by a favorable price/mix variance of USD 346 million and a positive volume contribution of USD 311 million. On a reported basis, core revenue and adjusted operating profit increased 17.9% and 26.5%, respectively.
International Tobacco Business
(Quarterly) Performance Review by Cluster
South and West Europe
(billions of Units, millions of USD) 2020 Q2 2021 Q2 Variance
Total shipment volume 16.3 18.7 +14.5%
GFB shipment volume 13.7 15.9 +16.5%
Core revenue 493 621 +26.0%
(+15.7%)*
*at constant currency
• Volume and market share2
Total and GFB shipment volumes, including favorable inventory movements, increased 14.5% and
16.5%, respectively. Excluding inventory adjustments, total shipment volume grew 7.0%, driven by
favorable industry volume trend comparisons versus the same quarter last year, and continued market
share gains. Quarterly market share increased in Belgium, France, Greece, Italy, Luxembourg, the
Netherlands, Spain and Switzerland.
• Core revenue
Core revenue grew 26.0%, driven by a positive volume contribution of USD 71 million, notably from
Italy and Spain, and a favorable price/mix variance of USD 6 million. Excluding favorable currency
movements of USD 50 million, core revenue increased 15.7%.
• By market2
In France, excluding inventory movements, total shipment volume decreased 4.7% despite continued
quarterly market share gains (+1.8ppt) in cigarettes and fine cut. Factoring in favorable inventory
adjustments, total, GFB and fine cut shipment volumes declined 4.3%, 4.7% and 16.3%, respectively,
due to the unfavorable industry volume trend comparison versus the same quarter last year. Currency-
neutral core revenue declined, as a positive price/mix was offset by a negative volume contribution.
Year-to-date total shipment volumes were up 5.3%, or 4.0% excluding inventory movements, with
GFB shipment volume increasing 6.1% and fine cut shipment volume declining 2.2%. Year-on-year
market share increased 3.2ppt to 28.4%, fueled by GFBs.
In Italy, excluding inventory movements, total shipment volume increased 7.7% fueled by a favorable
industry volume trend comparison versus the same period last year and solid quarterly market share
gains (+1.2ppt) in both cigarettes and fine cut. Accounting for favorable inventory adjustments, total
5

and GFB shipment volumes increased 16.4% and 21.0%, respectively, while fine cut shipment volume
decreased 5.4%. Currency-neutral core revenue increased, driven by a solid volume contribution and
a favorable price/mix variance. Year-to-date total shipment volume grew 4.1%, or 4.4% excluding
inventory adjustments, with GFB shipment volume up 6.4% and fine cut down 0.5%. Year-on-year
market share increased 1.3ppt to 26.2%, led by Winston.
In Spain, excluding inventory movements, total shipment volume grew 13.1%, driven by a favorable
industry volume trend comparison and strong quarterly market share gains (+1.5ppt). Factoring in
favorable inventory adjustments, total, GFB and fine cut shipment volumes increased 41.4%, 42.7%
and 5.5%, respectively. Currency-neutral core revenue increased, driven by a strong volume
contribution combined with a favorable price/mix variance. Year-to-date total shipment volume
increased 12.2%, or 4.8% excluding inventory movements. GFB and fine cut shipment volume
increased 15.6% and 3.9% respectively. Year-on-year market share increased 1.4ppt to 27.4%, led
by Winston and Camel.
North and Central Europe
(billions of Units, millions of USD) 2020 Q2 2021 Q2 Variance
Total shipment volume 15.7 17.6 +12.4%
GFB shipment volume 8.1 9.8 +20.2%
Core revenue 609 778 +27.8%
(+14.7%)*
*at constant currency
• Volume and market share2
Total and GFB shipment volumes increased 12.4% and 20.2%, respectively, driven by favorable
industry volume trend comparisons in several markets due to travel restrictions, notably in the UK,
and continued market share gains. Quarterly market share grew in the Czech Republic, Germany,
Hungary, Ireland, Poland and the UK.
• Core revenue
Core revenue grew 27.8% driven by a favorable volume contribution of USD 63 million, notably from
Poland and the UK, combined with a positive price/mix variance of USD 26 million and favorable
currency movements of USD 80 million. Excluding currency impacts, core revenue increased 14.7%.
• By market2
In Germany, total and GFB shipment volumes both increased 0.9%, driven by quarterly market share
gains (+0.7ppt) in cigarettes and fine cut. Fine cut shipment volume declined 1.2% due to lower
industry volume. Currency-neutral core revenue grew, driven by positive volume and price/mix
contributions. Year-to-date shipment volumes grew 6.9%, 7.3% and 4.2% in total, GFB and fine cut
respectively. Year-on-year market share grew 0.6ppt to 9.2% driven by Winston.
In the UK, total shipment volume increased 7.3%, building on a favorable industry volume trend
comparison, driven by travel restrictions, and quarterly market share gains (+0.9ppt). Cigarette and
fine cut shipment volumes grew 7.9% and 5.3%, respectively, led by B&H Blue and Sterling. Currency-
neutral core revenue increased, fueled by favorable volume and price/mix contributions. Year-to-date
shipment volumes grew 8.3% and 12.8% in total and fine cut respectively. Year-on-year market share
was up 1.1ppt to 45.4%.
6

CIS+
(billions of Units, millions of USD) 2020 Q2 2021 Q2 Variance
Total shipment volume 32.1 33.0 +3.1%
GFB shipment volume 21.7 23.3 +7.4%
Core revenue 714 794 +11.2%
(+12.1%)*
*at constant currency
• Volume and market share2
Total shipment volume, excluding inventory movements, increased 5.6%, driven by quarterly market
share gains and favorable industry volume trend comparisons versus the same quarter last year.
Factoring in unfavorable inventory adjustments, total and GFB shipment volumes increased 3.1% and
7.4%, respectively. Quarterly market share grew in Azerbaijan, Romania, Russia, Serbia and Ukraine.
• Core revenue
Core revenue increased 11.2% driven by a favorable price/mix variance of USD 52 million, mainly
from Kazakhstan, Romania and Ukraine, and a positive volume contribution of USD 35 million.
Excluding unfavorable currencies of USD 7 million, core revenue grew 12.1%.
• By market2
In Romania, total and GFB shipment volumes increased 18.2% and 14.7%, respectively, driven by
quarterly market share gains (+1.1ppt). Positive volume and price/mix variances drove an increase in
currency-neutral core revenue. Year-to-date shipment volumes grew 10.3% and 7.9% in total and
GFB, respectively. Year-on-year market share reached 29.5%, an increase of 1.2ppt driven by
Winston and Sobranie.
In Russia3, excluding inventory movements, total shipment volume increased 3.3%, driven by
quarterly total tobacco market share gains (+0.6ppt), mainly in combustibles, and lower illicit trade.
The latter resulted in an improved total tobacco industry volume4 trend comparison, increasing an
estimated 2.6%. Accounting for unfavorable inventory adjustments, total shipment volume declined
0.5% while GFB shipment volume increased a robust 8.2%, driven by the performance of Camel and
LD. The distribution expansion of heated tobacco sticks in key accounts continued, strengthening the
foundations ahead of the introduction of Ploom X later this year. Currency-neutral core revenue grew,
driven by positive volume and price/mix contributions. Year-to-date total shipment volume increased
6.9%, or 3.6% excluding inventory movements, and GFB shipment volume was up 17.6%. Despite an
improving trend over the last three quarters, year-on-year total tobacco market share declined to
36.4%.
7
Rest-of-the-World
(billions of Units, millions of USD) 2020 Q2 2021 Q2 Variance
Total shipment volume 43.8 49.4 +12.9%
GFB shipment volume 25.3 30.9 +21.9%
Core revenue1 1,102 1,342 +21.8%
(+16.7%)*
*at constant currency
• Volume and market share2
Total shipment volume increased 11.2% when excluding inventory movements, driven by favorable
industry volume trend comparisons in several markets and solid quarterly market share gains.
Factoring in favorable inventory adjustments, total and GFB shipment volumes increased 12.9% and
21.9%, respectively, driven by Winston, Camel, Mevius and LD. Quarterly market share increased
across many markets, notably in Brazil, Cambodia, Canada, Indonesia, Lebanon, the Philippines,
Saudi Arabia, Singapore, South Korea, Taiwan, Tanzania and Turkey.
• Core revenue1
Core revenue increased 21.8%, driven by a favorable price/mix variance of USD 108 million, notably
in Canada, the Philippines and Turkey, combined with a positive volume contribution of USD 76 million
and favorable currencies of USD 56 million. Excluding currency impacts, core revenue increased
16.7%.
• By market2
In Iran, excluding inventory movements, total shipment volume grew 15.6%, driven by stronger
industry volume trends. Accounting for favorable inventory adjustments, total and GFB shipment
volumes increased 16.1% and 24.1%, respectively. Currency-neutral core revenue increased, fueled
by volume and price/mix contributions. Year-to-date total shipment volume grew 9.3%, or 9.6%
excluding inventory adjustments, and GFB shipment volume was up 15.0%. Year-on-year market
share declined 0.9ppt to 59.0%.
In Taiwan, total shipment volume increased 1.0%, or declined 1.3% when excluding inventory
movements. GFB shipment volume grew 0.5% and quarterly market share gains continued (+0.6ppt),
in a resilient industry in terms of volume. Currency-neutral core revenue increased, driven by favorable
volume and price/mix variances. Year-to-date total shipment volume grew 6.6%, or 5.2% excluding
inventory adjustments, and GFB shipment volume was up 5.3%. Year-on-year market share increased
by 1.7ppt to 48.2%, driven by Mevius, LD and Winston.
In Turkey, excluding inventory movements, total shipment volume grew 16.8% supported by an
improved industry volume comparison and quarterly market share gains (+1.5ppt), driven by Winston.
Accounting for favorable inventory adjustments, total and GFB shipment volumes increased 26.2%
and 26.5%, respectively. Currency-neutral core revenue grew driven by favorable volume and
price/mix contributions. Year-to-date total shipment volume increased 13.1%, or 13.9% excluding
inventory adjustments, and GFB shipment volume grew 13.7%. Year-on-year market share increased
0.3ppt to 27.0%.
1 In accordance with the requirements stipulated in IAS 29, the JT Group has been applying hyperinflationary accounting adjustments since Q3 2020, so the results for fiscal year 2021 on a reported basis include the impact of the adjustments. Starting from Q1 2021, results on a constant currency basis have been calculated to exclude amounts of revenue and profit that have increased due to hyperinflation in certain markets. 2 Source: IRI, Logista, Nielsen, Panel Strator and JTI estimates on a 12-month rolling average and 3-month average, unless other specified, for cigarettes and fine cut (excluding snus) at the end of June 2021. Azerbaijan, Cambodia,
8

Canada, the Czech Republic, Germany, Greece, Hungary, Iran, Ireland, Netherlands, Philippines, Romania, Russia, Tanzania, Turkey and the UK are on a 12-month rolling average and 2-month average at the end of May 2021. 12-month and 3-month shares of market growth for 2021 are calculated against 12-month and 3-month shares of market at the end of the respective period in 2020. 3 From Q1 2021 onwards, shipment volume and market share data for Russia reflect total tobacco figures, i.e. cigarettes and heated tobacco sticks. 2020 data has been adjusted accordingly. 4 Source: JTI estimates based on Apr.-May 2021 total tobacco data versus the same period last year.
9

Japanese-Domestic Tobacco Business
(billions of units, billions of JPY) 2020 Q2 2021 Q2 Variance 2020 YTD 2021 YTD Variance
Cigarette industry volume5 28.2 26.9 -4.8% 57.0 51.9 -8.9%
Cigarette sales volume 17.0 16.0 -5.7% 34.2 30.9 -9.5%
Core revenue 123.0 132.2 +7.5% 248.8 256.4 +3.0%
Adjusted operating profit 38.6 53.3 +38.0% 81.8 101.3 +23.8%
2021 Q2 Cigarette sales volume
Cigarette industry volume5 decreased by 4.8%, mainly due to a natural decline trend, growth in the
RRP category and the impact of price revisions in October 2020.
Cigarette sales volume decreased by 5.7% due to cigarette industry volume contraction and a loss in
market share.
Cigarette market share5 decreased by 0.6ppt year on year to 59.5% due to growth in the RRP category
and intense competition in the value segment followed by downtrading. Reduced-Risk Products (RRP) performance
RRP industry volume6 in Japan was 11.2 billion units, an increase of 1.3 billion units year on year.
The overall RRP market size is estimated to represent 29.3% (shipment basis) of total tobacco
industry volume. JT’s RRP sales volume was 1.1 billion units, an increase of 0.2 billion units year on
year. JT’s market share5 in the RRP category is estimated to be 9.9% (shipment basis).
In July, Ploom X, the next generation heated tobacco device, was launched.
Core revenue and adjusted operating profit
Core revenue increased by 7.5%, mainly driven by a positive cigarette price/mix variance of JPY 13.3
billion and an increase in RRP-related revenue, despite an unfavorable cigarette sales volume
variance of JPY 6.2 billion. RRP-related revenue increased by JPY 1.6 billion year on year to JPY
14.6 billion, driven by an increase in RRP sales volume.
Adjusted operating profit increased by 38.0%, mainly driven by a positive cigarette price/mix variance
of JPY 13.3 billion; an increase in RRP-related revenue; and investments originally skewed in the
second half to support the expansion of Ploom X, resulting in reduced sales promotion expenses. This
was partially offset by an unfavorable cigarette sales volume variance of JPY 5.1 billion.
2021 YTD Cigarette sales volume
Cigarette industry volume5 decreased by 8.9%, mainly due to a natural decline trend, growth in the
RRP category and the impact of price revisions in October 2020.
Cigarette sales volume decreased by 9.5% due to cigarette industry volume contraction, growth in the
RRP category and a loss in market share.
Cigarette market share5 decreased by 0.4ppt, down to 59.5% due to growth in the RRP category and
intense competition in the value segment followed by downtrading.
Reduced-Risk Products (RRP) performance
RRP industry volume6 in Japan was 21.7 billion units, an increase of 2.6 billion units year on year.
The overall RRP market size is estimated to represent 29.5% (shipment basis) of total tobacco
industry volume. JT’s RRP sales volume was 2.1 billion units, an increase of 0.3 billion units year on
year. JT’s market share5 in the RRP category is estimated to be 9.8% (shipment basis).
10

Core revenue and adjusted operating profit
Core revenue increased by 3.0%, driven by a positive cigarette price/mix variance of JPY 25.6 billion
and an increase in RRP-related revenue, despite an unfavorable cigarettes sales volume variance of
JPY 20.6 billion and lower sales in the domestic Duty-Free and China businesses. RRP-related
revenue increased by JPY 3.4 billion year on year to JPY 29.3 billion, driven by an increase in RRP
sales volume.
Adjusted operating profit increased by 23.8%, mainly driven by a positive cigarette price/mix variance
of JPY 25.6 billion, an increase in RRP-related revenue and investments originally skewed in the
second half to support the expansion of Ploom X, resulting in reduced sales promotion expenses. This
was partially offset by an unfavorable cigarette sales volume variance of JPY 17.2 billion.
5 Source: JT estimates. Cigarette industry volume and cigarette market share include little cigars, which are classified as
cigars as per the Tobacco Business Act of Japan, as well as ready-made cigarettes. 6 Source: JT estimates industry volume of RRP in the Japanese market by number of sticks based on internal assumptions,
i.e. one pack of consumables is equivalent to 20 sticks of combustible cigarettes. This excludes RRP devices, RRP- related
accessories, etc.
11

Pharmaceutical Business (billions of JPY) 2020 Q2 2021 Q2 Variance 2020 YTD 2021 YTD Variance
Revenue 16.5 17.4 +5.1% 37.3 37.1 -0.6%
Adjusted operating profit 1.4 -0.7 ― 7.9 3.6 -55.2%
2021 Q2 Revenue and adjusted operating profit
Revenue increased 5.1% mainly driven by top-line growth in our consolidated subsidiary, Torii Pharmaceutical, which more than offset a decrease in overseas royalty income. Adjusted operating profit decreased by JPY 2.0 billion, due to recognition of losses associated with the termination of the development of a licensed compound as well as a Torii Pharmaceutical’s decrease in profit.
2021 YTD Revenue and adjusted operating profit
Revenue was almost flat as the top-line growth in Tori Pharmaceutical was partially offset by the decrease in overseas royalty income. Adjusted operating profit decreased 55.2% for the reasons mentioned for Q2.
Processed Food Business (billions of JPY) 2020 Q2 2021 Q2 Variance 2020 YTD 2021 YTD Variance
Revenue 35.1 36.7 +4.5% 71.8 70.4 -1.9%
Adjusted operating profit ‐0.1 1.1 ― 0.3 1.5 +316.9%
2021 Q2 Revenue and adjusted operating profit
Revenue increased 4.5% mainly led by a slight sales recovery in food-service products within the frozen and ambient food as well as the seasonings businesses, in addition to the bakery business compared to the previous year. The sales, however, did not recover to the levels before COVID-19. Adjusted operating profit increased by JPY 1.2 billion mainly led by the top-line growth of these businesses and a decrease in SG&A expenses, including a favorable comparison of impairment losses in the bakery business in the previous year.
2021 YTD Revenue and adjusted operating profit
Revenue decreased 1.9% mainly due to a relative decline in demand for household products in the frozen and ambient food business, which had temporarily increased in the same period of the previous year. Adjusted operating profit increased by JPY 1.1 billion mainly led by a decrease in SG&A expenses, including a favorable comparison of impairment losses in the bakery business in the previous year, which more than offset the top-line decline.
12

FY2021 Revised Forecasts
Consolidated
(billions of JPY)
2021 Forecast
Initial Revised Revised
Variance vs.
Initial Forecast
Variance vs.
2020 Results
Revenue 2,080.0 2,200.0 +120.0 +5.1%
Adjusted operating profit 475.0 517.0 +42.0 +6.2%
Operating profit 363.0 402.0 +39.0 -14.3%
Profit attributable to
owners of the parent 240.0 272.0 +32.0 -12.3%
Free cash flow 315.0 383.0 +68.0
Adjusted operating profit
at constant FX 512.0 522.0 +10.0 +7.2%
Revenue
Revenue forecast is revised upward by JPY 120.0 billion to JPY 2,200.0 billion driven by the upward
revisions in the international tobacco and pharmaceutical businesses, partially offset by the downward
revisions in the Japanese-domestic tobacco and processed food businesses. As a result, revenue is
now expected to increase by 5.1% year on year.
Adjusted operating profit
Adjusted operating profit at constant currency is revised upward by JPY 10.0 billion to JPY 522.0
billion, resulting in a 7.2% increase year on year, driven by the upward revisions in the international
tobacco business, partially offset by the expected partial reclassification of investments related to the
consolidation of IT infrastructure between JT and JTI from capital expenditures to expenses.
On a reported basis, adjusted operating profit is revised upward by JPY 42.0 billion to JPY 517.0
billion, resulting in a 6.2% increase year-on-year, driven by the upward revisions in adjusted operating
profit at constant currency and revised currency assumptions.
Operating profit and Profit attributable to owners of the parent
Operating profit is revised upward by JPY 39.0 billion to JPY 402.0 billion, driven by the upward
revision in adjusted operating profit, resulting in a 14.3% decline year-on-year.
Profit attributable to owners of the parent company is revised upward by JPY 32.0 billion to JPY 272.0
billion driven by the upward revisions in the operating profit and improved financing costs. This
represents a 12.3% decline year on year.
Free cash flow
Free cash flow is revised upward by JPY 68.0 billion to JPY 383.0 billion, driven by the upward revision
in adjusted operating profit and a revision in capital expenditures.
In accordance with the requirements stipulated in IAS 29, hyperinflationary accounting adjustments have
been applied to the forecasts on a reported basis since Q3 2020. The forecasts on a constant currency
basis have been calculated to exclude amounts of revenue and profit that have been increased due to
hyperinflation in certain markets.
13

Forecasts by Business Segment
International Tobacco Business
(billions of JPY)
2021 Forecast Initial Revised
Variance vs. Initial Forecast
Variance vs.
2020 Results
Total shipment volume Decline mid 3% Almost flat
GFB shipment volume Approx. -1% Approx. +3%
Core revenue7 1,230.0 1,360.0 +130.0 +8.7%
Adjusted operating profit7 332.0 377.0 +45.0 +10.6%
Reference (millions of USD)
Core revenue7 11,900 12,500 +600+6.6%
(+3.2%)*
Adjusted operating profit7 3,220 3,480 +260+9.4%
(+11.6%)*
*at constant currency
• Volume
The forecasts for total and GFB shipment volumes are revised upwards to account for the stronger
first half performance, driven by favorable industry volume trend comparisons in several markets,
notably from the slower easing of COVID-19 restrictions, and continued market share gains across
many markets. Factoring in a deterioration in industry volume trends in the second half, mainly due
to a more challenging comparative related to different levels of COVID-19 restrictions in several
markets, total shipment volume is now expected to be almost flat year-on-year and GFB shipment
volume is forecast to increase approximately 3%.
• Core revenue and adjusted operating profit7
On a JPY basis, the forecasts for core revenue and adjusted operating profit are revised upward by
JPY 130.0 billion and JPY 45.0 billion respectively, mainly driven by a stronger first half performance
and revised FX assumptions. As a result, core revenue and adjusted operating profit will increase
8.7% and 10.6%, respectively, versus the previous year.
On a USD basis, core revenue and adjusted operating profit are revised upwards by USD 600 million
and USD 260 million, respectively, driven by a stronger first half volume performance and revised FX
assumptions, notably GBP, IRR and RUB. Investments in the second half of the year are expected to
exceed those in the first half and will result in a year-on-year increase to support the expansion of
heated tobacco sticks. On a currency-neutral basis, core revenue and adjusted operating profit are
now expected to increase by 3.2% and 11.6%, respectively.
7 In accordance with the requirements stipulated in IAS 29, hyperinflationary accounting adjustments have been applied to the forecasts on a reported basis since Q3 2020. The forecasts on a constant currency basis have been calculated to exclude amounts of revenue and profit that have been increased due to hyperinflation in certain markets.
14

Japanese-Domestic Tobacco Business
(billions of JPY) 2021 Forecast
Initial Revised
Variance vs. Initial Forecast
Variance vs. 2020 Results
Cigarette industry volume8 Decline over 8.0%
Decline over 9.0%
Cigarette sales volume Decline
upper 7.0% Decline slightly less than 11.0%
Core revenue 520.0 510.0 -10.0 -1.1%
Adjusted operating profit 176.0 176.0 ― +4.7%
Volume
The cigarette industry volume8 decline assumption is revised from over 8.0% to over 9.0% reflecting
growth in the RRP category beyond the initial expectations. JT’s estimate for overall RRP market size
is revised from upper 20% range to approx. 30% of the full year total tobacco industry volume.
The total tobacco industry volume8 decline assumption is revised from over 4.0% to upper 3.0%
reflecting a resilient industry volume in the first half of this year.
The assumption on JT cigarette sales volume decline is revised from upper 7.0% to slightly less than
11.0%, mainly due to growth in the RRP category beyond the initial expectations and intense
competition in the value segment followed by downtrading. The JT RRP sales volume estimate
remains unchanged at over 4.5 billion units.
Core revenue and adjusted operating profit
The core revenue forecast is revised downward by JPY 10.0 billion now representing a decrease of
1.1% versus the previous year. This is due to intense competition in the value segment followed by
downtrading, a decrease in JT cigarette sales volume due to growth in the RRP category and the
protracted negative impact of COVID-19 on the top line in the Duty-Free business.
Adjusted operating profit forecast remains unchanged at a year-on-year increase at 4.7% despite
accounting for necessary investments in the second half of this year, notably for sales and promotion
activities of Ploom X, which are expected to be offset by efficient cost execution and optimised
investments in priority activities.
8 Source: JT estimates. Total tobacco industry volume and cigarette industry volume include little cigars, which are classified
as cigars as per the Tobacco Business Act in Japan as well as conventional cigarettes.
15

Pharmaceutical Business
(billions of JPY) 2021 Forecast
Initial Revised
Variance vs. Initial Forecast
Variance vs. 2020 Results
Revenue 76.5 77.0 +0.5 -2.5%
Adjusted operating profit 7.0 7.0 - -59.2%
Revenue and adjusted operating profit
The revenue forecast is revised upward by JPY 0.5 billion as overseas royalty income is expected to be better than the initial forecast. The revised forecast represents a decrease of 2.5% versus the previous year. Adjusted operating profit forecast remains unchanged despite the top-line growth due to recognition of losses associated with the termination of the development of a licensed compound. The forecast represents a decrease of 59.2% versus the previous year.
Processed Food Business
(billions of JPY) 2021 Forecast
Initial Revised
Variance vs. Initial Forecast
Variance vs. 2020 Results
Revenue 151.0 150.0 -1.0 +0.4%
Adjusted operating profit 3.0 3.0 - -
Revenue and adjusted operating profit
Revenue is revised downward by JPY 1.0 billion, representing an increase of 0.4% versus the previous year, considering the continued impact by factors including the declaration of a state of emergency. The revision also reflects the sales recovery outlook, which is expected to be slower than that initially anticipated, in food-service products in the frozen and ambient food; seasonings; and the bakery businesses despite the expected growth in sales of household products in the frozen and ambient food business. Adjusted operating profit forecast remains unchanged despite the downward revision of revenue, and it will be achieved by committing to an improvement in product mix in the frozen and ambient food business as well as effective cost execution and investments.
16

Data Sheets
17

Results for 2021 Second Quarter
1. Summary of Consolidated results (Unit: JPY billion)
2020 2021
Q2 YTD Q2 YTD
1,030.2 1,144.5 +114.3 +11.1%
252.0 322.1 +70.1 +27.8%
287.6 358.2 +70.6 +24.5%
226.0 314.1 +88.1 +39.0%
173.4 225.9 +52.6 +30.3%
172.5 225.2 +52.7 +30.5%
97.23 126.92 +29.69 +30.5%
*Based on profit attributable to owners of the parent company
[Reference] Consolidated results (Unit: JPY billion)
2020 2021Q2 YTD Q2 YTD
287.6 365.1 +77.5 +26.9%
2. Results by business segment (Unit: JPY billion)
2020 2021Q2 YTD Q2 YTD
Consolidated: revenue 1,030.2 1,144.5 +114.3 +11.1%
Japanese-domestic tobacco 267.7 275.3 +7.6 +2.8%
Core revenue 248.8 256.4 +7.5 +3.0%
International tobacco 651.9 760.9 +108.9 +16.7%
Core revenue 626.1 736.3 +110.2 +17.6%
Pharmaceutical 37.3 37.1 -0.2 -0.6%
Processed food 71.8 70.4 -1.4 -1.9%
Others 1.4 0.9 -0.5 -37.8%
Consolidated: operating profit 252.0 322.1 +70.1 +27.8%
Japanese-domestic tobacco 73.7 93.1 +19.4 +26.4%
International tobacco 187.3 243.4 +56.1 +29.9%
Pharmaceutical 7.2 3.8 -3.4 -47.8%
Processed food 0.3 0.5 +0.1 +34.8%
Others/Elimination -16.5 -18.6 -2.1 -
Adjustments, total -35.6 -36.1 -0.5
Japanese-domestic tobacco -8.1 -8.1 -0.0
International tobacco -27.0 -26.9 +0.2
Pharmaceutical -0.7 0.2 +0.9
Processed food -0.0 -1.0 -1.0
Others/Elimination 0.2 -0.4 -0.6
Consolidated: adjusted operating profit 287.6 358.2 +70.6 +24.5%
Japanese-domestic tobacco 81.8 101.3 +19.5 +23.8%
International tobacco 214.3 270.2 +55.9 +26.1%
Pharmaceutical 7.9 3.6 -4.4 -55.2%
Processed food 0.3 1.5 +1.1 +316.9%
Others/Elimination -16.8 -18.3 -1.5 -
[Reference] International tobacco business (Unit: USD million)
2020 2021Q2 YTD Q2 YTD
5,784 6,818 +1,034 +17.9%
5,784 6,623 +839 +14.5%
1,980 2,505 +524 +26.5%
1,980 2,560 +579 +29.2% Adjusted operating profit at constant FX
Adjusted operating profit at constant FX
Core revenue
Core revenue at constant FX
Adjusted operating profit
Variance (abs) Variance (%)
In accordance with the requirements stipulated in IAS 29, the JT Group has been applying hyperinflationary accounting adjustmentssince Q3 2020, so the results for fiscal year 2021 on a reported basis include the impact of the adjustments. Starting from Q1 2021,results on a constant currency basis have been calculated to exclude amounts of revenue and profit that have increased due tohyperinflation in certain markets.
Profit before income taxes
Adjusted operating profit
Operating profit
Revenue
Profit
Profit (attributable to owners of the parent company)
Basic EPS*(JPY)
Variance (abs) Variance (%)
Variance (abs) Variance (%)
Variance (abs) Variance (%)
18

Results for 2021 Second Quarter
3. Depreciation and amortization* (Unit: JPY billion)
2020 2021Q2 YTD Q2 YTD
Consolidated: depreciation and amortization 81.1 81.9 +0.9
Japanese-domestic tobacco 26.7 25.0 -1.7
International tobacco 47.4 50.6 +3.3
Pharmaceutical 2.6 2.5 -0.2
Processed food 3.3 3.0 -0.2
Others/Elimination 1.1 0.8 -0.3
*Excluding depreciation from lease transactions
4. Consolidated financial position (Unit: JPY billion)
2020 Dec. end 2021 Jun. end Variance (abs)
Total assets 5,381.4 5,538.9 +157.5
Total equity 2,599.5 2,862.8 +263.3
Equity attributable to owners of the parent company 2,522.8 2,786.1 +263.3
BPS (attributable to owners of the parent company) (JPY) 1,421.92 1,570.05 +148.13
5. Liquidity and interest-bearing debt (Unit: JPY billion)
2020 Dec. end 2021 Jun. end Variance (abs)
Liquidity 548.3 493.3 -55.0
Interest-bearing debt 958.9 927.0 -31.9
6. Consolidated cash flow (Unit: JPY billion)
2020 2021Q2 YTD Q2 YTD
Cash flows from operating activities 126.6 174.9 +48.2
Cash flows from investing activities -27.9 -46.5 -18.6
Cash flows from financing activities -25.0 -212.7 -187.7
Cash and cash equivalents, beginning of the year 357.2 538.8 +181.7
Foreign currency translation adj. on cash & cash equivalents -23.2 26.1 +49.3
Cash and cash equivalents, end of the year 407.7 480.7 +73.0
FCF 93.1 125.4 +32.4
7. Capital expenditures (Unit: JPY billion)
2020 2021Q2 YTD Q2 YTD
Consolidated: capital expenditures 45.5 38.8 -6.7
Japanese-domestic tobacco 8.7 7.5 -1.2
International tobacco 22.9 23.7 +0.8
Pharmaceutical 7.8 4.0 -3.8
Processed food 4.0 3.9 -0.1
Others/Elimination 2.1 -0.3 -2.4
8. FX actual (Reference information)
2020 2021Q2 YTD Q2 YTD
USD/JPY 108.23 107.82 -0.41 -0.4%
USD/RUB 69.24 74.28 +5.04 -6.8%
USD/GBP 0.79 0.72 -0.07 +10.2%
USD/EUR 0.91 0.83 -0.08 +9.4%
USD/CHF 0.97 0.91 -0.06 +6.4%
USD/TWD 30.01 28.03 -1.98 +7.1%
USD/TRY 6.48 7.87 +1.39 -17.7%
USD/IRR 139,706
EUR/IRR is converted to USD/IRR in table by using cross rate
*The closing currency rates for the month ended June 2021 have been applied when converting financial statements for subsidiaries located inhyperinflationary economies to the US dollar. Similarly, the month-end rates are also applied upon conversions from the US dollar to the Japaneseyen. (USD/IRR: 217,892, USD/JPY: 110.58)
Variance (abs)
Variance (abs) Variance (%)
*
Variance (abs)
Variance (abs)
19

FY2021 Revised Forecasts(as of July 30, 2021)
1. Summary of consolidated forecasts (Unit: JPY billion)
2020 Results2021 Revised
ForecastsVariance (abs) Variance (%)
Revenue 2,092.6 2,200.0 +107.4 +5.1%
Operating profit 469.1 402.0 -67.1 -14.3%
Adjusted operating profit 487.0 517.0 +30.0 +6.2%
Profit (attributable to owners of the parent company) 310.3 272.0 -38.3 -12.3%
[Reference] Consolidated forecast (Unit: JPY billion)
2020 Results2021 Revised
ForecastsVariance (abs) Variance (%)
487.0 522.0 +35.0 +7.2%
2. EPS, DPS, ROE (Unit: JPY)
2020 Results2021 Revised
ForecastsVariance (abs) Variance (%)
Basic EPS* 174.88 153.29 -21.59 -12.3%
DPS 154 130 -24.00 -15.6%
ROE* 12.0% 10.6% -1.3%ppt
3. Forecasts by business segment (Unit: JPY billion)
2020 Results2021 Revised
ForecastsVariance (abs) Variance (%)
Consolidated: revenue 2,092.6 2,200.0 +107.4 +5.1%
Japanese-domestic tobacco 555.6 550.0 -5.6 -1.0%
Core revenue 515.7 510.0 -5.7 -1.1%
International tobacco 1,306.2 1,420.0 +113.8 +8.7%
Core revenue 1,250.8 1,360.0 +109.2 +8.7%
Pharmaceutical 79.0 77.0 -2.0 -2.5%
Processed food 149.3 150.0 +0.7 +0.4%
Others 2.5 3.0 +0.5 +21.3%
Consolidated: operating profit 469.1 402.0 -67.1 -14.3%
Japanese-domestic tobacco 151.8 114.0 -37.8 -24.9%
International tobacco 296.4 321.0 +24.6 +8.3%
Pharmaceutical 16.5 7.0 -9.5 -57.5%
Processed food -0.8 2.0 +2.8 -
Others/Elimination 5.1 -42.0 -47.1 -
Consolidated: adjusted operating profit 487.0 517.0 +30.0 +6.2%
Japanese-domestic tobacco 168.1 176.0 +7.9 +4.7%
International tobacco 340.9 377.0 +36.1 +10.6%
Pharmaceutical 17.2 7.0 -10.2 -59.2%
Processed food -0.8 3.0 +3.8 -
Others/Elimination -38.4 -46.0 -7.6 -
[Reference] International tobacco business (Unit: USD million)
2020 Results2021 Revised
ForecastsVariance (abs) Variance (%)
11,724 12,500 +776 +6.6%
11,724 12,100 +376 +3.2%
3,181 3,480 +299 +9.4%
3,181 3,550 +369 +11.6%
In accordance with the requirements stipulated in IAS 29, hyperinflationary accounting adjustments have been applied to the forecastson a reported basis since Q3 2020. The forecasts on a constant currency basis have been calculated to exclude amounts of revenueand profit that have been increased due to hyperinflation in certain markets.
Adjusted operating profit at constant FX
Adjusted operating profit at constant FX
*Based on profit attributable to owners of the parent company
Core revenue
Core revenue at constant FX
Adjusted operating profit
20

FY2021 Revised Forecasts(as of July 30, 2021)
4. Free cash flow (Unit: JPY billion)
2020 Results2021 Revised
ForecastsVariance (abs)
FCF 503.9 383.0 -120.9
5. Capital expenditures (Unit: JPY billion)
2020 Results2021 Revised
ForecastsVariance (abs)
Consolidated: capital expenditures 112.9 132.0 +19.1
Japanese-domestic tobacco 21.1 28.0 +6.9
International tobacco 66.6 82.0 +15.4
Pharmaceutical 9.1 6.0 -3.1
Processed food 8.0 14.0 +6.0
Others/Elimination 8.2 2.0 -6.2
6. Assumptions of 2020 Forecast
2021 Japanese-domestic tobacco business
・Industry volume: a decrease of an upper 3% range (vs. 2020: 155.0 BnU)
・Cigarette industry volume: a decrease of a lower 9% range (vs. 2020 : 114.9 BnU)
・JT cigarette sales volume : a decrease of a slightly less than 11% (vs. 2020 : 68.7 BnU)
・Reduced-Risk Products market share in tobacco industry (shipment basis) : approx. 30% (2020: approx. 26%)
・JT RRP sales volume : over 4.5 BnU stick equivalent
2021 International tobacco business
・Total shipment volume︓almost flat (vs. 2020: 435.7 BnU)
・GFB shipment volume︓an increase of approx. 3% (vs. 2020: 282.0 BnU)
<FX assumptions>
2020 Results2021 Revised
ForecastsVariance (abs) Variance (%)
USD/JPY 106.76 108.91 +2.15 +2.0%
USD/RUB 72.07 74.00 +1.93 -2.6%
USD/GBP 0.78 0.72 -0.06 +8.3%
USD/EUR 0.88 0.83 -0.05 +5.7%
USD/CHF 0.94 0.91 -0.03 +3.2%
USD/TWD 29.47 28.00 -1.47 +5.2%
USD/TRY 7.01 8.60 +1.59 -18.5%
21

FY2021 Revised Forecastsvs Initial Forecasts(as of July 30, 2021)
1. Summary of consolidated forecasts (Unit: JPY billion)
2021 InitialForecasts
2021 RevisedForecasts
Variance (abs) Variance (%)
Revenue 2,080.0 2,200.0 +120.0 +5.8%
Operating profit 363.0 402.0 +39.0 +10.7%
Adjusted operating profit 475.0 517.0 +42.0 +8.8%
Profit (attributable to owners of the parent company) 240.0 272.0 +32.0 +13.3%
[Reference] Consolidated forecast (Unit: JPY billion)
2021 InitialForecasts
2021 RevisedForecasts
Variance (abs) Variance (%)
512.0 522.0 +10.0 +2.0%
2. EPS, DPS, ROE (Unit: JPY)
2021 InitialForecasts
2021 RevisedForecasts
Variance (abs) Variance (%)
Basic EPS 135.30 153.29 +17.99 +13.3%
DPS 130 130 - -
ROE (attributable to owners of the parent company) 9.6% 10.6% 1.1%ppt
3. Forecasts by business segment (Unit: JPY billion)
2021 InitialForecasts
2021 RevisedForecasts
Variance (abs) Variance (%)
Consolidated: revenue 2,080.0 2,200.0 +120.0 +5.8%
Japanese-domestic tobacco 560.0 550.0 -10.0 -1.8%
Core revenue 520.0 510.0 -10.0 -1.9%
International tobacco 1,290.0 1,420.0 +130.0 +10.1%
Core revenue 1,230.0 1,360.0 +130.0 +10.6%
Pharmaceutical 76.5 77.0 +0.5 +0.7%
Processed food 151.0 150.0 -1.0 -0.7%
Others 3.0 3.0 - -
Consolidated: operating profit 363.0 402.0 +39.0 +10.7%
Japanese-domestic tobacco 123.0 114.0 -9.0 -7.3%
International tobacco 280.0 321.0 +41.0 +14.6%
Pharmaceutical 7.0 7.0 - -
Processed food 2.0 2.0 - -
Others/Elimination -49.0 -42.0 +7.0 -
Adjusted operating profit 475.0 517.0 +42.0 +8.8%
Japanese-domestic tobacco 176.0 176.0 - -
International tobacco 332.0 377.0 +45.0 +13.6%
Pharmaceutical 7.0 7.0 - -
Processed food 3.0 3.0 - -
Others/Elimination -43.0 -46.0 -3.0 -
[Reference] International tobacco business (Unit: USD million)
2021 InitialForecasts
2021 RevisedForecasts
Variance (abs) Variance (%)
11,900 12,500 +600 +5.0%
11,850 12,100 +250 +2.1%
3,220 3,480 +260 +8.1%
3,450 3,550 +100 +2.9%
Adjusted operating profit
Adjusted operating profit at constant FX
Adjusted operating profit at constant FX
Core revenue
Core revenue at constant FX
In accordance with the requirements stipulated in IAS 29, hyperinflationary accounting adjustments have been applied to the forecasts ona reported basis since Q3 2020. The forecasts on a constant currency basis have been calculated to exclude amounts of revenue andprofit that have been increased due to hyperinflation in certain markets.
22

FY2021 Revised Forecastsvs Initial Forecasts(as of July 30, 2021)
4. Free cash flow (Unit: JPY billion)
2021 InitialForecasts
2021 RevisedForecasts
Variance (abs)
FCF 315.0 383.0 +68.0
5. Capital expenditures (Unit: JPY billion)
2021 InitialForecasts
2021 RevisedForecasts
Variance (abs)
Consolidated 147.5 132.0 -15.5
Japanese-domestic tobacco 30.0 28.0 -2.0
International tobacco 92.0 82.0 -10.0
Pharmaceutical 5.0 6.0 +1.0
Processed food 14.5 14.0 -0.5
Others/Elimination 6.0 2.0 -4.0
6. Revised assumptions of FY2021 Forecast (vs FY2020 results)
Japanese-domestic tobacco business
Total Industry volume*
Cigarette industry volume*
RRP market share in tobacco industry*
JT cigarette sales volume
JT RRP sales volume
* JT estimate based on shipment, annual base
International tobacco business
Total shipment volume
GFB shipment volume
<FX assumptions>
2021 InitialForecasts
2021 RevisedForecasts
Variance (abs) Variance (%)
USD/JPY 103.00 108.91 +5.91 +5.7%
USD/RUB 76.00 74.00 -2.00 +2.7%
USD/GBP 0.74 0.72 -0.02 +2.8%
USD/EUR 0.82 0.83 +0.01 -1.2%
USD/CHF 0.90 0.91 +0.01 -1.1%
USD/TWD 29.00 28.00 -1.00 +3.6%
USD/TRY 8.00 8.60 +0.60 -7.0%
<FX sensitivity>
a decrease of a lower 4% range a decrease of an upper 3% range
Initial Forecasts Revised Forecasts
a decrease of a lower 8% range a decrease of a lower 9% range
a decrease of an upper 7% rangea decrease of a slightly less than
11%
Initial Forecasts Revised Forecasts
upper 20% range approx. 30%
over 4.5 BnU stick equivalent
a decrease of approx. 1%
FX Sensitivity Guidance for FX impact on 2021 adjusted operating profit of USD 3,480 MM based on the assumptions:----------------------------------------------------------------------------------------------------------------------------------------USD vs. Local currency1% deviation from the revised assumption rates against USD by all the currencies in the same direction (excluding JPY) leads toapproximately USD 62MM impacting on USD based adjusted operating profit
This amount of approximately USD 62MM composed of:RUB approx. 20%, GBP approx. 15%, TWD approx. 15%, EUR 10%+, TRY 5%-, CHF just over -5%----------------------------------------------------------------------------------------------------------------------------------------USD vs. JPYUSD/JPY move of 1 yen from the assumption leads to approximately JPY 3.5 billion impact on JPY-based adjusted operating profit
a decrease in the mid 3% range almost flat
an increase of approx. 3%
23

Tobacco Business Data
1. Summary (YTD)
2020 Q2 2021 Q2 Variance Variance (%)
Total shipment volume 211.9 228.9 +16.9 +8.0% BNU
136.3 153.5 +17.2 +12.6% BNU
Core revenue 626.1 736.3 +110.2 +17.6% JPY BN
214.3 270.2 +55.9 +26.1% JPY BN
[USD Reference information]
Core revenue 5,784 6,818 +1,034 +17.9% USD MM
1,980 2,505 +524 +26.5% USD MM
Constant FX basis
Core revenue 5,784 6,623 +839 +14.5% USD MM
1,980 2,560 +579 +29.2% USD MM
・Contribution by cluster (vs. PY) (BNU/USD MM)
Reported basis
2021
SWE 36.7 +8.0% 31.3 +10.4% 1,214 +16.9%
NCE 33.4 +12.1% 18.4 +19.2% 1,449 +25.3%
CIS+ 62.1 +5.7% 44.1 +10.5% 1,511 +11.8%
RoW 96.6 +8.2% 59.7 +13.5% 2,645 +18.2%
Total 228.9 153.5 6,818
2021
SWE 1,113 +7.2%
NCE 1,318 +14.0%
CIS+ 1,575 +16.6%
RoW 2,617 +16.9%
Total 6,623
2. Total shipment volume by cluster / market (vs. PY)
2021 Q1 Q2 Q3 Q4 YTD
SWE +2.0% +14.5% +8.0%
France +16.6% -4.3% +5.3%
Italy -6.0% +16.4% +4.1%
Spain -8.8% +41.4% +12.2%
NCE +11.6% +12.4% +12.1%
Germany +13.7% +0.9% +6.9%
UK +9.4% +7.3% +8.3%
CIS+ +8.8% +3.1% +5.7%
Romania +2.2% +18.2% +10.3%
Russia +16.5% -0.5% +6.9%
RoW +3.7% +12.9% +8.2%
Iran +3.1% +16.1% +9.3%
Taiwan +12.7% +1.0% +6.6%
Turkey +0.4% +26.2% +13.1%
Total +5.8% +10.1% +8.0%
3. GFB shipment volume by brand (vs. PY) (BNU)
2021 Q1 Q2 Q3 Q4 YTD
41.2 44.8 86.0
+9.4% +14.5% +12.0%
16.0 18.1 34.1
+11.4% +39.3% +24.6%
4.0 4.0 8.0
+1.2% +9.9% +5.4%
12.4 13.0 25.4
+7.9% -0.6% +3.4%
International Tobacco Business
Adjusted operating profit
Total shipment volume Core revenue
Winston
MEVIUS
LD
Camel
Adjusted Operating Profit
At constant FX Core Revenue Adjusted Operating Profit
GFB shipment volume
Adjusted operating profit
Adjusted operating profit
GFB shipment volume
In accordance with the requirements stipulated in IAS 29, the JT Group has been applying hyperinflationary accounting adjustmentssince Q3 2020, so the results for fiscal year 2021 on a reported basis include the impact of the adjustments. Starting from Q1 2021,results on a constant currency basis have been calculated to exclude amounts of revenue and profit that have increased due tohyperinflation in certain markets.
*From Q1 2021 onwards, shipment volume data for Russia reflects total tobacco figures, i.e.cigarettes and heated tobacco sticks. 2020 data has been adjusted accordingly.
*
24

Tobacco Business Data
4. GFB shipment volume by cluster / market (vs. PY)
2021 Q1 Q2 Q3 Q4 YTD
SWE +4.8% +16.5% +10.4%
France +19.2% -4.7% +6.1%
Italy -5.3% +21.0% +6.4%
Spain -4.6% +42.7% +15.6%
NCE +18.1% +20.2% +19.2%
Germany +14.5% +0.9% +7.3%
UK -12.4% +0.5% -5.5%
CIS+ +14.1% +7.4% +10.5%
Romania +0.9% +14.7% +7.9%
Russia +29.9% +8.2% +17.6%
RoW +5.6% +21.9% +13.5%
Iran +6.8% +24.1% +15.0%
Taiwan +10.4% +0.5% +5.3%
Turkey +1.3% +26.5% +13.7%
Total +9.1% +16.1% +12.6%
5. Share of market by key markets
3-month average
2020 2021 2020 2020 2020 2021 2021
Jun. Jun. Variance Q2 Q3 Q4 Q1 Q2
France 25.2% 28.4% +3.2%ppt 27.2% 27.6% 28.3% 28.8% 29.0%
Italy 24.9% 26.2% +1.3%ppt 25.4% 26.2% 26.0% 26.2% 26.5%
Russia 37.2% 36.4% -0.8%ppt 36.2% 35.8% 36.7% 36.7% 36.8%
Spain 26.0% 27.4% +1.4%ppt 26.2% 27.0% 27.4% 27.5% 27.7%
Taiwan 46.5% 48.2% +1.7%ppt 47.5% 48.0% 48.5% 48.1% 48.1%
Turkey 26.8% 27.0% +0.3%ppt 26.3% 26.5% 26.8% 27.5% 27.8%
UK 44.4% 45.4% +1.1%ppt 44.9% 45.3% 45.3% 45.4% 45.8%
Source: IRI, Nielsen, Logista, Panel Strator / Reflects the changes in historical data from the sources.
*12-month moving average and 2-month average at the end of May 2021, respectively.
6. Core revenue at constant FX by cluster (vs. PY) (USD MM)
2021 Q1 Q2 Q3 Q4 YTD
543 570 1,113
-0.5% +15.7% +7.2%
620 698 1,318
+13.3% +14.7% +14.0%774 801 1,575
+21.5% +12.1% +16.6%1,331 1,286 2,617
+17.1% +16.7% +16.9%3,268 3,355 6,623
+14.0% +15.0% +14.5%
SWE
12-month moving average
Total
CIS+
RoW
NCE
**From Q1 2021 onwards, market share data for Russia reflects total tobacco figures, i.e. cigarettes and heated tobacco sticks. 2020 datahas been adjusted accordingly.
*
*
*
*
*
*
**
25
Tobacco Business Data
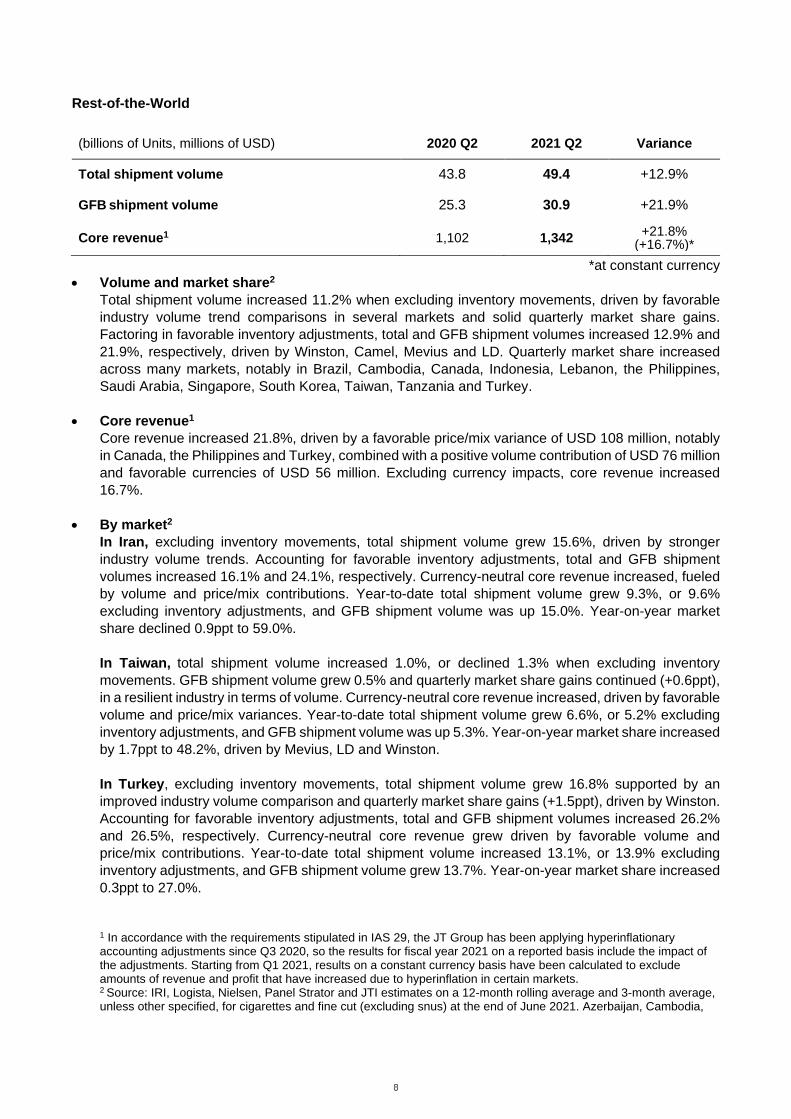
7. Breakdown of core revenue
・USD basis (USD MM)
Q1 Q2 Q3 Q4 YTD
2020 2,866 2,918 5,784
Volume +214 +246 +460
Price/Mix +187 +192 +379
2021 at constant 3,268 3,355 6,623
FX +16 +179 +195
2021 3,284 3,535 6,818
・JPY basis (JPY BN)
Q1 Q2 Q3 Q4 YTD
2020 312.0 314.0 626.1
Operations +43.7 +47.1 +90.8
JPY vs. USD -8.5 +6.8 -1.6
2021 349.0 387.3 736.3
8. Breakdown of adjusted operating profit
・USD basis (USD MM)
Q1 Q2 Q3 Q4 YTD
2020 956 1,025 1,980
Volume +148 +163 +311
Price/Mix +182 +165 +346
Others +22 -101 -79
2021 at constant 1,308 1,251 2,560
FX -50 -5 -55
2021 1,258 1,247 2,505
・JPY basis (JPY BN)
Q1 Q2 Q3 Q4 YTD
2020 104.1 110.3 214.3
Operations +38.4 +24.4 +62.8
JPY vs. USD -3.3 +2.4 -0.9
2021 133.6 136.6 270.2
9. FX actual vs. PY
2021 Q1 Q2 Q3 Q4 YTD
74.34 74.22 74.28
-10.8% -2.8% -6.8%
0.73 0.72 0.72
+7.8% +12.5% +10.2%
0.83 0.83 0.83
+9.4% +9.4% +9.4%
0.90 0.91 0.91
+7.1% +5.7% +6.4%
28.07 27.99 28.03
+7.3% +6.9% +7.1%
7.37 8.37 7.87
-17.2% -18.0% -17.7%
106.09 109.52 107.82
-2.5% +1.8% -0.4%Local currency vs USD variance: (Local currency exchange rates of same period in previous year / Local currency exchange rates of current period ) -1
JPY vs USD variance: (JPY exchange rates of current period / JPY exchange rates of same period in previous year ) -1
EUR/IRR is converted to USD/IRR in table by using cross rate.
-6.0
USD/RUB
USD/GBP
In accordance with the requirements stipulated in IAS 29, the JT Group has been applying hyperinflationary accounting adjustments sinceQ3 2020, so the results for fiscal year 2021 on a reported basis include the impact of the adjustments. Starting from Q1 2021, results on aconstant currency basis have been calculated to exclude amounts of revenue and profit that have increased due to hyperinflation in certainmarkets. The FX impact in the figures below include the aforementioned adjustments in addition to the prevailing FX impact.
Local currenciesvs. USD
+1.7
*
*The closing currency rates for the month ended June 2021 have been applied when converting financial statements for subsidiarieslocated in hyperinflationary economies to the US dollar. Similarly, the month-end rates are also applied upon conversions from the USdollar to the Japanese yen. (USD/IRR: 217,892, USD/JPY: 110.58)
* *
In accordance with the requirements stipulated in IAS 29, the JT Group has been applying hyperinflationary accounting adjustments sinceQ3 2020, so the results for fiscal year 2021 on a reported basis include the impact of the adjustments. Starting from Q1 2021, results on aconstant currency basis have been calculated to exclude amounts of revenue and profit that have increased due to hyperinflation in certainmarkets. The FX impact in the figures below include the aforementioned adjustments in addition to the prevailing FX impact.
+19.3
USD/JPY
+21.0
Local currenciesvs. USD
-5.5
USD/EUR
USD/CHF
USD/TWD
USD/TRY
USD/IRR
-0.5
26
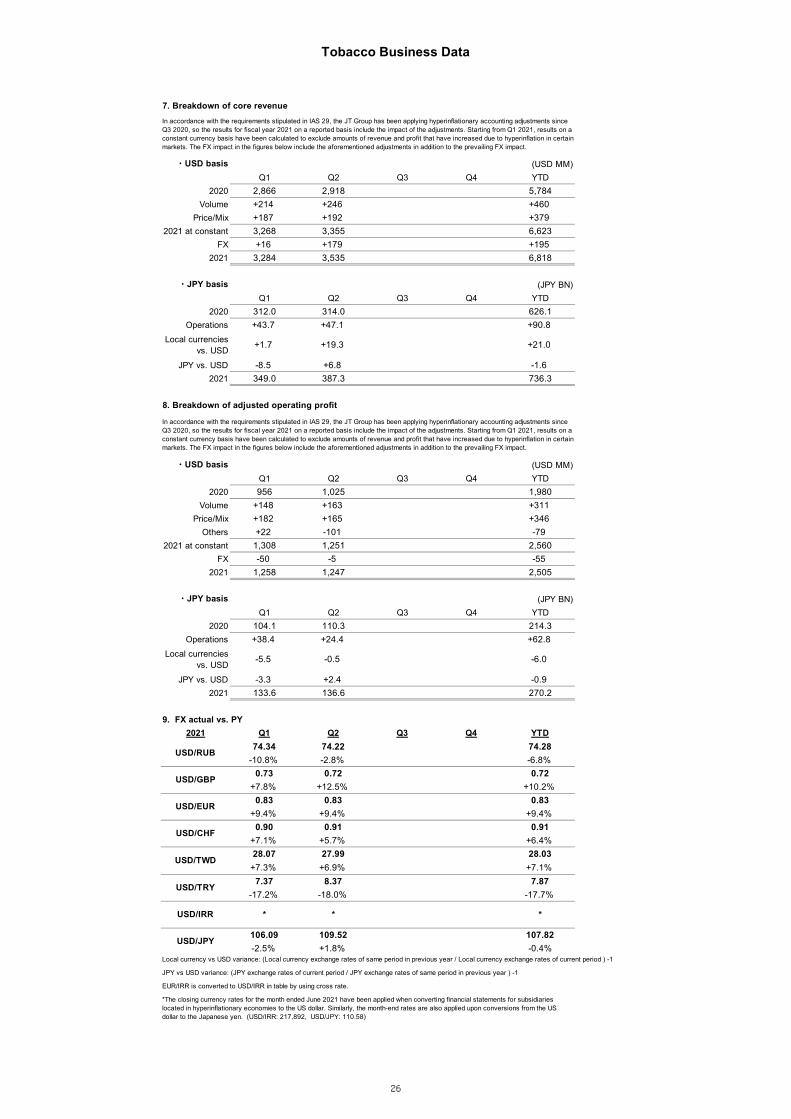
Tobacco Business Data
1. Summary (YTD)2020 Q2 2021 Q2 Variance Variance (%)
Cigarette industry volume (JT estimate) 57.0 51.9 -5.1 -8.9% BNUCigarette sales volume 34.2 30.9 -3.3 -9.5% BNUExcludes volumes of domestic Duty-Free, China businesses (0.9BNU in 2020 Q2 and 0.9BNU in 2021 Q2, respectively) and RRP sales
Core revenue 248.8 256.4 +7.5 +3.0% JPY BNAdjusted operating profit 81.8 101.3 +19.5 +23.8% JPY BN
2. Cigarette sales volume (BNU)Q1 Q2 Q3 Q4 FY
2020 17.2 17.0 19.9 14.7 68.72021 14.9 16.0
Variance -13.3% -5.7%
3. Revenue per thousand cigarettes (JPY)Q1 Q2 Q3 Q4 FY
2020 6,326 6,344 6,369 7,172 6,5242021 7,155 7,174
Revenue per thousand cigarettes = (retail price sales - retailer margins - consumption tax - excise taxes)/sales volume×1,000
4. Results of Reduced-Risk Products (BNU / JPY BN)
2021 Q1 Q2 Q3 Q4 YTDRRP sales volume 1.0 1.1 2.1RRP-related revenue 14.7 14.6 29.3
5. Breakdown of financial results (JPY BN)
Core revenue Q1 Q2 Q3 Q4 YTD2020 125.8 123.0 248.8
Cigarette volume -14.5 -6.2 -20.6Cigarette price/mix +12.3 +13.3 +25.6
RRP/Others +0.4 +2.1 +2.52021 124.1 132.2 256.4
Adjusted OP Q1 Q2 Q3 Q4 YTD2020 43.2 38.6 81.8
Cigarette volume -12.1 -5.1 -17.2Cigarette price/mix +12.3 +13.3 +25.6
RRP/Others +4.5 +6.5 +11.02021 48.0 53.3 101.3
6. Cigarette market share (JT estimate) (%)
JT Total Q1 Q2 Q3 Q4 FY2020 59.7 60.1 60.2 59.0 59.82021 59.5 59.5
MEVIUS2020 28.9 28.8 28.9 27.4 28.62021 27.6 27.5
Winston2020 7.3 7.3 7.3 7.1 7.22021 7.1 7.1
Seven Stars2020 7.5 7.5 7.6 7.1 7.42021 7.4 7.3
2020 2.0 2.0 1.9 2.1 2.02021 2.1 2.1
Natural American Spirit
Japanese-Domestic Tobacco Business
27

Pharmaceutical Business Clinical Development as of July 30, 2021
<In-house development>
Code (Generic Name)
Potential Indication/Dosage form Mechanism Phase(Region) Origin Note
JTE-052 (delgocitinib)
Atopic dermatitis (infant)
/Topical JAK inhibitor
Suppresses overactive immune response via inhibition of Janus kinase (JAK) related to immune signal.
Phase3 (Japan)
In-house
・Co-development with Torii
Autoimmune/allergic diseases
/Oral, Topical Phase1 (Japan)
JTE-051
Autoimmune/allergic diseases
/Oral
Interleukin-2 inducible T cell kinase inhibitor
Suppresses overactive immune response via inhibition of the signal to activate T cells related to immune response.
Phase2(Japan)
In-house
Phase2 (Overseas)
JTE-451 Autoimmune/allergic
diseases /Topical
RORγ antagonist
Suppresses overactive immune response via inhibition of ROR γ related to Th 17 activation.
Phase1 (Japan) In-house
JTT-251 Type 2 diabetes mellitus /Oral
PDHK inhibitor
Decreases blood glucose by activation of pyruvate dehydrogenase (PDH) related to carbohydrate metabolism.
Phase1 (Overseas) In-house
JTT-662 Type 2 diabetes mellitus
/Oral SGLT1 inhibitor
Suppresses postprandial hyperglycemia and normalizes blood glucose level via inhibition of SGLT1.
Phase1 (Overseas) In-house
JTT-861 Chronic heart failure
/Oral PDHK
inhibitor
Improves cardiac function by activation of pyruvate dehydrogenase (PDH) related to carbohydrate metabolism.
Phase1 (Overseas) In-house
Clinical trial phase presented above is based on the first dose. We are also conducting additional studies to examine the potential for use in additional dosage forms.
<Licensed compounds>
Compound (JT's code) Licensee Mechanism Note
trametinib Novartis MEK inhibitor Inhibits cellular growth by specifically inhibiting the activity of MAPK/ERK pathway.
Anti-ICOS monoclonal antibody AstraZeneca
ICOS
antagonist
Suppresses overactive immune response via inhibition of ICOS which regulates activation of T cells.
delgocitinib LEO Pharma
ROHTO Pharmaceutical JAK inhibitor Suppresses overactive immune response via inhibition of Janus kinase (JAK) related to immune signal.
enarodustat JW Pharmaceutical Salubris
HIF-PH inhibitor
Increases red blood cells by stimulating production of erythropoietin, an erythropoiesis- stimulating hormone, via inhibition of HIF-PH.
Updates since the previous announcement on April 30, 2021: ・JTE-051 (Autoimmune/allergic diseases/Oral): advanced to Phase2 in Japan ・JTE-861 has entered the clinical trial stage (Phase1) in overseas. ・JTE-761 (Autoimmune/allergic diseases/Oral) : terminated ・JTE-052 : Listing on the Japanese National Health Insurance Drug Price List and Launch of CORECTIM® Ointment 0.25% in Japan
28

Definitions
Terms Definitions
Adjusted operating profit (AOP)
Adjusted operating profit (AOP) = operating profit + amortization cost of acquiredintangibles arising from business acquisitions + adjusted items (income and costs) **Adjusted items (income and costs) = impairment losses on goodwill ± restructuringincome and costs ± others
Consolidated adjusted operatingprofit at constant FX
The same foreign exchange rates between local currencies vs USD as well as theexchange rates between JPY and USD are applied as in the equivalent period inthe previous fiscal year for international tobacco business.
Reduced-Risk Products (RRP)Reduced-Risk Products are products with the potential to reduce the risksassociated with smoking.
GFB (Global flagship brands) GFB includes four brands namely Winston, Camel, MEVIUS and LD.
Total shipment volume:(International tobacco business)
Total shipment volume is the shipment volume of tobacco-based products whichincludes fine cut tobacco, cigars, pipe tobacco, snus, kretek and heated tobaccoproducts but excludes contract manufactured products, waterpipe, and E-Vapor.
Core revenue(International tobacco business)
Core revenue includes waterpipe, and RRP, but excludes revenue from distribution,contract manufacturing and other peripheral businesses.
Core revenue / Adjustedoperating profit at constant FX(International tobacco business)
The same foreign exchange rates between local currencies vs USD are applied asin the equivalent period in the previous fiscal year for international tobaccobusiness.
Industry volume(Japanese-domestic tobaccobusiness)
Industry volume in the Japanese market by number of sticks based on internalestimates.This includes cigarettes, little cigars, RRP and others.
Cigarette industry volume(Japanese-domestic tobaccobusiness)
Industry volume of ready-made cigarettes in the Japanese market by number ofsticks based on the internal estimates. This includes little cigars but excludes RRP.
RRP industry volume(Japanese-domestic tobaccobusiness)
Industry volume of RRP in the Japanese market by number of sticks based on theinternal estimates. One pack of consumables is equivalent to 20 sticks ofcombustible cigarettes. This excludes RRP devices, RRP related accessories, etc.
Cigarette sales volume(Japanese-domestic tobaccobusiness)
JT’s cigarette sales volume excluding the volume of domestic Duty-Free and theChina businesses.This includes little cigars but excludes RRP.
RRP sales volume(Japanese-domestic tobaccobusiness)
JT’s RRP sales volume excluding the volume of domestic Duty-Free business. Onepack of consumables is equivalent to 20 sticks of combustible cigarettes.This also excludes RRP devices, RRP related accessories, etc.
Little cigarsProducts rolled in tobacco-based paper with a similar format to ready-madecigarettes and classified as “cigars” under the Tobacco Business Act of Japan.
Core revenue(Japanese-domestic tobaccoBusiness)
Core revenue, excludes revenue from distribution of imported tobacco in theJapanese-domestic tobacco business, among others, but includes revenue fromdomestic Duty-free and the China businesses as well as the revenue from RRP andlittle cigars.
RRP related revenue(Japanese-domestic tobaccobusiness)
RRP related revenue, as a part of core revenue, represents the sale of RRPincluding domestic Duty-Free, principally the device and the related accessories.
LiquidityCash and deposits + marketable securities + securities purchased underrepurchase agreements
Interest-bearing debt Short-term bank loans + CP + bonds + long-term borrowings
FCF
FCF is sum of cash flows from operating activities and investing activities, butexcludes the following items:- From operating CF: depreciation from lease transactions, interest received,dividends received, interest paid and income taxes related to these items excludinglease transactions, and other items- From investing CF: purchase of investment securities (for both short-term andlong-term), payments into time deposits, proceeds from sale or redemption ofinvestment securities (for both short-term and long-term), proceeds from withdrawalof time deposits and other investing activities not for business operation purposes
Additional definitions are provided at https://www.jt.com/media/glossary/index.html
29
###Japan Tobacco Inc. is a leading international tobacco company with operations in more than 130 countries. With approximately 58,000 employees, it manufactures and sells some of the world’s best-known brands including Winston, Camel, MEVIUS and LD. The JT Group is committed to investing in Reduced-Risk Products (RRP) and currently markets its heated tobacco products under its Ploom brand and various e-cigarette products under its Logic brand. The Group is also present in the pharmaceutical and processed food businesses. For more information, visit https://www.jt.com/.
FORWARD-LOOKING STATEMENTS
This document contains forward-looking statements. These statements appear in a number of places in thisdocument and include statements regarding the intent, belief, or current and future expectations of ourmanagement with respect to our business, financial condition and results of operations. In some cases, youcan identify forward-looking statements by terms such as “may”, “will”, “should”, “would”, “expect”, “intend”,“project”, “plan”, “aim”, “seek”, “target”, “anticipate”, “believe”, “estimate”, “predict”, “potential” or the negativeof these terms or other similar terminology. These statements are not guarantees of future performance andare subject to various risks and uncertainties. Actual results, performance or achievements, or those of theindustries in which we operate, may differ materially from any future results, performance or achievementsexpressed or implied by these forward-looking statements. In addition, these forward-looking statements arenecessarily dependent upon assumptions, estimates and data that may be incorrect or imprecise and involveknown and unknown risks and uncertainties. Forward-looking statements regarding operating results areparticularly subject to a variety of assumptions, some or all of which may not be realized.
Risks, uncertainties or other factors that could cause actual results to differ materially from those expressedin any forward-looking statement include, without limitation:(1) increase in awareness of health concerns related to smoking;(2) regulatory developments; including, without limitation, tax increases and restrictions on sales,
marketing, packaging, labeling and use of tobacco products, privately imposed restrictions andgovernmental investigations;
(3) litigation around the world alleging adverse health and financial effects resulting from, or relating to,tobacco products;
(4) our ability to further diversify our business beyond the traditional tobacco industry;(5) our ability to successfully expand internationally and make investments outside Japan;(6) competition, changing consumer preferences and behavior;(7) our ability to manage impacts derived from business diversification or business expansion;(8) economic, regulatory and political changes, such as nationalization, terrorism, wars and civil unrest,
in countries in which we operate;(9) fluctuations in foreign exchange rates and the costs of raw materials; and(10) catastrophes, including natural disasters.
Contacts:
Media and Investor Relations Division
Japan Tobacco Inc.
Investors:
Tatsuya Tsukuura, General Manager (Tokyo)
E-mail: [email protected]
Ryo Ishikawa, IR Director (Geneva)
E-mail: [email protected]
Media:
Dinesh Babu Thotakura, General Manager (Tokyo)
E-mail: [email protected]
30