2021 QRS Proof Sheet User Guide - cms.gov
41
Health Insurance Exchange 2021 Quality Rating System Proof Sheet User Guide August 2021
Transcript of 2021 QRS Proof Sheet User Guide - cms.gov
Health Insurance Exchange
2021 Quality Rating System Proof Sheet User Guide
August 2021

2021 Quality Rating System Proof Sheet User Guide
pg. ii
Table of Contents 1. Document Purpose and Organization .................................................................................... 1
2. Background ............................................................................................................................ 4
3. QRS Preview via CMS’ Health Insurance Oversight System − Marketplace Quality Module ................................................................................................................................... 4
3.1 Instructions for Accessing QRS Ratings....................................................................... 5
4. QRS Rating Methodology...................................................................................................... 6
4.1 QRS Measure Set and Hierarchy .................................................................................. 7 4.2 QRS Rating Methodology Overview ............................................................................ 9 4.3 Process for Calculating QRS Scores and Ratings ....................................................... 11
Appendix A: Resources for Reviewing QHP Enrollee Survey Results ........................................ 31
Appendix B: Key to Invalid Codes in the 2021 QRS Proof Sheet ............................................... 33
Appendix C: Additional Details on the Contents of the 2021 QRS Proof Sheet .......................... 34
Appendix D: Crosswalk of 2021 QHP Enrollee Survey Questions Included in the QRS ............ 36
List of Exhibits Exhibit 1. QRS and QHP Enrollee Survey Documents Available for Preview on the
HIOS-MQM Website .................................................................................................... 5 Exhibit 2. QRS Hierarchy ............................................................................................................... 8 Exhibit 3. Overview of QRS Rating Methodology ......................................................................... 9 Exhibit 4. Steps for Calculating QRS Scores and Ratings............................................................ 10 Exhibit 5. Audit Designations ....................................................................................................... 12 Exhibit 6. Aggregation Methods for QRS Clinical Measures with Multiple Indicators .............. 12 Exhibit 7. Minimum Denominator Size Required for Inclusion in QRS Scoring ........................ 21 Exhibit 8. Example Denominator Size for QRS Clinical Measure Indicators .............................. 22 Exhibit 9. Example of Total Denominator Size Calculation for CAHPS®-Based QRS
Survey Measure .......................................................................................................... 22 Exhibit 10. Example Score after Z-score Standardization ............................................................ 23 Exhibit 11. Example Composite Score Calculation ...................................................................... 24 Exhibit 12. Example Domain Score Calculation .......................................................................... 25 Exhibit 13. Application of the Explicit Weights to the Clinical Quality Management
Domain Scores ............................................................................................................ 25 Exhibit 14. Example Summary Indicator Score Calculation ........................................................ 26 Exhibit 15. Example Clinical Quality Management Summary Indicator Score Calculation ....... 26 Exhibit 16. Application of the Explicit Weights to the Summary Indicator Score....................... 26 Exhibit 17. Example Global Score Calculation ............................................................................ 27 Exhibit 18. Domain Rating Calculation with Example Cut Points ............................................... 28 Exhibit 19. 2021 Rating Distribution for Summary Indicator and Global Components .............. 29 Exhibit 20. Reporting Unit Star Rating Decline Limit Example .................................................. 29

2021 Quality Rating System Proof Sheet User Guide
pg. iii
Exhibit 21. QHP Issuer Resources for Reviewing QHP Enrollee Survey Results ....................... 31 Exhibit 22. Key to Invalid Codes in the 2021 QRS Proof Sheet .................................................. 33 Exhibit 23. QRS Hierarchy Component Codes ............................................................................ 34 Exhibit 24. Approach to Decimal Places and Rounding in Communicating QRS Results .......... 35 Exhibit 25. Crosswalk of 2021 QHP Enrollee Survey Questions Included in the QRS ............... 36

2021 Quality Rating System Proof Sheet User Guide
pg. 1
1. Document Purpose and Organization This 2021 Quality Rating System Proof Sheet User Guide (2021 QRS Proof Sheet User Guide) is intended to provide detail for Qualified Health Plan (QHP) issuers and state Exchange administrators regarding the methodology used to produce the Quality Rating System (QRS) scores and ratings as shown in the 2021 QRS Proof Sheets. The QRS Proof Sheets provide QHP issuers and state Exchange administrators with QRS ratings information for each ratings-eligible reporting unit, from below sub (b-sub)-measure indicator values through the global score. This document is organized into the following sections:
• Section 1: Document purpose and organization. • Section 2: Background on the QRS. • Section 3: Information on the 2021 QRS preview period, including instructions for
accessing the QRS Preview Report and QRS Proof Sheet. Information on the release of full QHP Enrollee Survey results is provided in Appendix A.
• Section 4: Detailed description of each step of the QRS rating methodology (i.e., the process for calculating QRS scores and ratings). – The key differences outlined in the text box below reflect changes to the QRS and
QHP Enrollee Survey requirements between the 2020 and 2021 ratings year to align with the Quality Ranking System and Qualified Health Plan Enrollee Experience Survey: Technical Guidance for 2021 (2021 QRS and QHP Enrollee Survey Technical Guidance).1
Key Differences in QRS and QHP Enrollee Survey Requirements Between the 2020 Ratings Year and the 2021 Ratings Year
QRS and QHP Enrollee Survey Requirements: In April 2020, CMS published the COVID-19 Marketplace Quality Initiatives Memo,2 which announced CMS’ temporary policy of relaxed enforcement due to the challenges health care providers faced responding to the COVID-19 virus. This memo directed all eligible QHP issuers to discontinue the collection of clinical quality measure data and survey measure data that would normally have been used to calculate 2020 quality ratings and would normally be reported to CMS between May and June 2020. This enforcement discretion policy included discontinuation of reporting data for the QRS and QHP Enrollee Survey that would have been used to calculate the quality ratings for display on Exchange websites beginning during the 2021 open enrollment period for the individual market.3
For the 2021 QRS, CMS is enforcing compliance with the QRS and QHP Enrollee Survey requirements. All eligible QHP issuers were required to collect and report validated QRS
1 See the 2021 QRS and QHP Enrollee Survey Technical Guidance available at: https://www.cms.gov/Medicare/Quality-Initiatives-Patient-Assessment-Instruments/QualityInitiativesGenInfo/ACA-MQI/Quality-Rating-System/About-the-QRS 2 See the COVID-19 Marketplace Quality Initiatives Memo, available at: https://www.cms.gov/files/document/covid-qrs-and-marketplace-quality-initiatives-memo-final.pdf 3 Id.

2021 Quality Rating System Proof Sheet User Guide
pg. 2
clinical measure data and QHP Enrollee Survey response data to CMS between May and June 2021. Participation Criteria: For the 2021 QRS, CMS clarified that QRS and QHP Enrollee Survey requirements do not apply to the Basic Health Plan (BHP); therefore, QHP issuers should not have included BHP enrollees in their QRS data submissions. Measures Removed from the QRS Measure Set: In the Final 2020 Call Letter, CMS announced the removal of two measures, Adult Body Mass Index (BMI) Assessment (ABA) and Medication Management for People with Asthma (75% of Treatment Period) (MMA), from the QRS measure set beginning with the 2021 QRS ratings year. QHP issuers were not required to submit data for either measure as part of the 2021 QRS data submission.4 Addition of New Measures: In the Final 2020 Call Letter, CMS announced the addition of two measures, Annual Monitoring for Persons on Long-term Opioid Therapy (AMO) and Asthma Medication Ratio (AMR), to the QRS measure set beginning with the 2021 QRS ratings year. QHP issuers are required to submit data for the AMO and AMR measures as part of the 2021 QRS data submission.5 Scoring Eligibility: Under normal operations, reporting units are eligible to receive QRS scores and ratings beginning with their third consecutive year of operation on the Exchange. However, due to the suspension of 2020 QRS data collection, reporting units in their second year of operation were unable to submit data for the first time during the 2020 QRS ratings year. Therefore, in recognition of the impact of the COVID-19 public health emergency, CMS amended the scoring eligibility criteria such that the 2020 ratings year will not count toward scoring eligibility. As a result, reporting units will be considered scoring eligible if they were operational on the Exchange in 2018, 2019, and 2021, and meet the minimum enrollment criteria. CMS previously finalized the addition of the International Normalized Ratio Monitoring for Individual on Warfarin (INR) measure beginning in 2020; however, due to the suspension of activities for the 2020 QRS, the 2021 ratings year will be the first year of data collection for the INR measure and the 2022 ratings year will be the first year for scoring the measure.
– The key differences outlined in the text box below reflect methodology changes between the 2021 QRS and QHP Enrollee Survey Technical Guidance and the final
4 These two measures will no longer be included in scoring. 5 CMS anticipates including this measure in scoring beginning with the 2021 ratings year.
2021 Quality Rating System Proof Sheet User Guide
pg. 3
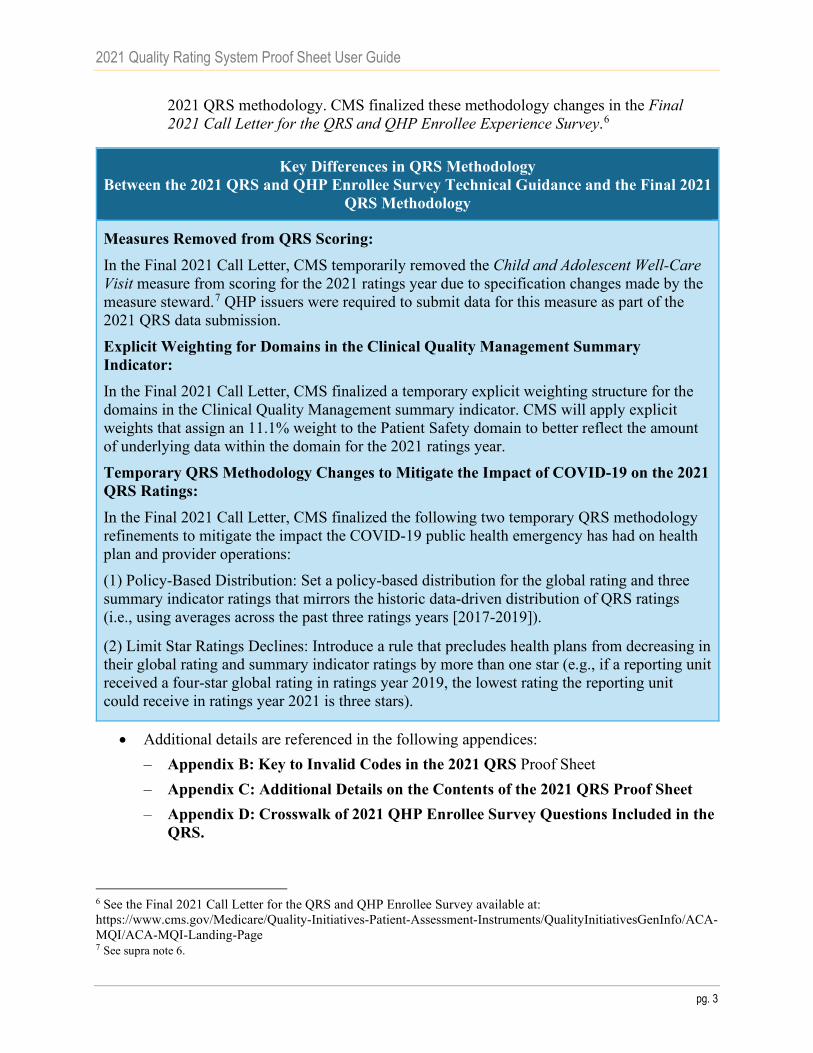
2021 QRS methodology. CMS finalized these methodology changes in the Final 2021 Call Letter for the QRS and QHP Enrollee Experience Survey.6
Key Differences in QRS Methodology Between the 2021 QRS and QHP Enrollee Survey Technical Guidance and the Final 2021
QRS Methodology
Measures Removed from QRS Scoring: In the Final 2021 Call Letter, CMS temporarily removed the Child and Adolescent Well-Care Visit measure from scoring for the 2021 ratings year due to specification changes made by the measure steward.7 QHP issuers were required to submit data for this measure as part of the 2021 QRS data submission. Explicit Weighting for Domains in the Clinical Quality Management Summary Indicator: In the Final 2021 Call Letter, CMS finalized a temporary explicit weighting structure for the domains in the Clinical Quality Management summary indicator. CMS will apply explicit weights that assign an 11.1% weight to the Patient Safety domain to better reflect the amount of underlying data within the domain for the 2021 ratings year. Temporary QRS Methodology Changes to Mitigate the Impact of COVID-19 on the 2021 QRS Ratings: In the Final 2021 Call Letter, CMS finalized the following two temporary QRS methodology refinements to mitigate the impact the COVID-19 public health emergency has had on health plan and provider operations: (1) Policy-Based Distribution: Set a policy-based distribution for the global rating and three summary indicator ratings that mirrors the historic data-driven distribution of QRS ratings (i.e., using averages across the past three ratings years [2017-2019]).
(2) Limit Star Ratings Declines: Introduce a rule that precludes health plans from decreasing in their global rating and summary indicator ratings by more than one star (e.g., if a reporting unit received a four-star global rating in ratings year 2019, the lowest rating the reporting unit could receive in ratings year 2021 is three stars).
• Additional details are referenced in the following appendices: – Appendix B: Key to Invalid Codes in the 2021 QRS Proof Sheet – Appendix C: Additional Details on the Contents of the 2021 QRS Proof Sheet – Appendix D: Crosswalk of 2021 QHP Enrollee Survey Questions Included in the
QRS.
6 See the Final 2021 Call Letter for the QRS and QHP Enrollee Survey available at: https://www.cms.gov/Medicare/Quality-Initiatives-Patient-Assessment-Instruments/QualityInitiativesGenInfo/ACA-MQI/ACA-MQI-Landing-Page 7 See supra note 6.

2021 Quality Rating System Proof Sheet User Guide
pg. 4
Please submit questions regarding this document to the Marketplace Service Desk (MSD) via email to [email protected] or phone at 1-855-267-1515. Please reference “MQI-QRS Preview” in the subject line.
2. Background The CMS will calculate the quality ratings for QHPs offered through all Health Insurance Exchanges (also known as Marketplaces), regardless of the Exchange model. Section 1311(c)(3) of the Patient Protection and Affordable Care Act directs the Secretary of the Department of Health & Human Services (HHS) to develop a quality rating for each QHP offered through an Exchange, based on quality and price.8 Section 1311(c)(4) of the Patient Protection and Affordable Care Act directs the Secretary to establish an enrollee satisfaction survey that will assess enrollee satisfaction with each QHP offered through the Exchanges with more than 500 enrollees in the prior year.
The goals of the QRS and QHP Enrollee Survey are to:
• Provide comparable and useful information to consumers about the quality of health care services and the experience of enrollees in QHPs offered through the Exchanges,
• Facilitate oversight of QHP issuer compliance with quality reporting standards set forth in the Affordable Care Act and implementing regulations, and
• Provide actionable information that QHP issuers can use to improve quality and performance.
For additional information on the QRS and QHP Enrollee Survey, please see the CMS Health Insurance Marketplace Quality Initiatives (MQI) website: http://www.cms.gov/Medicare/ Quality-Initiatives-Patient-Assessment-Instruments/QualityInitiativesGenInfo/Health-Insurance-Marketplace-Quality-Initiatives.html
3. QRS Preview via CMS’ Health Insurance Oversight System − Marketplace Quality Module
QHP issuers and state Exchange administrators will receive QHP quality rating information and QHP Enrollee Survey results, and will be able to preview these results via the CMS Health Insurance Oversight System-Marketplace Quality Module (HIOS-MQM) website during the annual preview period (anticipated August-September 2021).
During the QRS preview period, QHP issuers in all Exchanges will be able to preview their respective QRS ratings via the CMS HIOS-MQM website and submit related inquiries to CMS. A description of the documents available for preview is provided in Exhibit 1.
The QRS Preview Reports, QRS Proof Sheets, and QHP Enrollee Survey Quality Improvement (QI) Reports will be available for preview for each ratings-eligible reporting unit on the HIOS-MQM website. CMS recommends that QHP issuers review their QRS Preview Report first as the
8 The Patient Protection and Affordable Care Act (Pub. L. 111–148) as amended by the Health Care and Education Reconciliation Act of 2010 (Pub. L. 111–152) (collectively referred to as the Affordable Care Act).

2021 Quality Rating System Proof Sheet User Guide
pg. 5
QRS Proof Sheet provides additional detail behind the ratings shown in the QRS Preview Report.
Exhibit 1. QRS and QHP Enrollee Survey Documents Available for Preview on the HIOS-MQM Website Document Title Description QRS Preview Report
The QRS Preview Report provides the QRS ratings for each QHP issuer’s reporting unit. The reporting unit is defined as the unique combination of QHP issuer, state, and product type. The ratings are provided on a 5-star scale for all QRS hierarchy components (i.e., composites, domains, summary indicators, and the global result).
The QRS Preview Report is available online and for download as a PDF file on the HIOS-MQM website.
QRS Proof Sheet
The QRS Proof Sheet provides additional detail behind the ratings shown in the QRS Preview Report. The QRS Proof Sheet is available for download on the HIOS-MQM website as a PDF file and CSV file.
The PDF file displays outputs for each step of the QRS rating methodology, from the submitted measure rates (raw values) through the global score and rating. Specifically, the PDF file includes the following: • Scores and ratings for all QRS hierarchy components. • Raw measure rates for all collected QRS measures, including measures not included in
scoring. For all measures, the file will include the rate and total denominator size. • Cut points used to convert numeric scores to star ratings for each QRS hierarchy
component. For 2021, CMS will not provide cut points at the summary indicator and global level.
The CSV file provides additional information, specifically: • Measure indicator values and b-sub-measure indicator values. • The standard deviation and mean per measure, allowing a QHP issuer to recalculate the Z-
score for their reported measure rate. CMS created these values using data from all reporting units that are scoring eligible.
• Percentile values for measure rates, allowing a QHP issuer to compare its reporting unit’s results to all other reporting units, nationally. CMS includes the 5th, 10th, 25th, 50th, 75th, 90th, and 95th percentiles of the reported measure rates (raw values) across all reporting units, only using measure rates that have met the minimum denominator criteria for scoring.
QHP Enrollee Survey Quality Improvement (QI) Reports
CMS-calculated results for the QRS include survey measures derived from a subset of questions in the QHP Enrollee Survey (as described in Section 4). Full results for the QHP Enrollee Survey are also made available to QHP issuers during the QRS preview period, via the QHP Enrollee Survey Quality Improvement (QI) Reports. Appendix A provides an overview of different resources through which QHP Enrollee Survey results are communicated to QHP issuers. Additional details for interpreting the QHP Enrollee Survey results are included in the QHP Enrollee Survey Scoring Methodology Guide (available on the HIOS-MQM).
3.1 Instructions for Accessing QRS Ratings Access to the HIOS-MQM website is required to view QRS results during the QRS preview period. QHP issuers should follow these instructions to access their results:
1) Log in to the HIOS-MQM website. – Users new to HIOS need to request access to HIOS and the MQM through the CMS
Enterprise Portal. Existing HIOS users who are new to the MQM need to request a new role. QHP issuers should request the Ratings/Reports Viewer role. The Ratings/Reports Viewer role authorizes users to perform predetermined functions and access certain data sets.

2021 Quality Rating System Proof Sheet User Guide
pg. 6
– Detailed instructions for registering for access to HIOS and the MQM can be found in the HIOS-MQM Reference Guide located on CMS’ MQI website.
2) Navigate to the Preview Ratings and Survey Results webpage and search for the corresponding QHP issuer. The QRS Preview Report is available for view online by selecting the Online button. To download the QRS Preview Report and access the QRS Proof Sheet, click the Download link in the Preview Details table. The zip file also includes the QI Report(s) and instructions for interpreting the QHP Enrollee Survey results.
Exchange administrators who need to access the results for all reporting units operating in their respective states can do so by following these instructions:
1) Log in to the HIOS-MQM website. – Users new to HIOS need to contact the appropriate authorizing official: CMS (via the
Marketplace Service Desk [MSD]) or the cognizant State Access Administrator (SAA) to initiate a role request.
2) Navigate to the Preview Ratings and Survey Results webpage and reports will populate for the user’s corresponding QHPs. To access the QRS Preview Report, QRS Proof Sheet, and QI Report, click the appropriate Download link at the bottom of the page.
3) Navigate to the Download State Ratings and Survey Results webpage and download the State-level compiled QHP Enrollee Survey QI Report by selecting the Download link in the State Level QI Report column. – In September of the ratings year, download the machine readable, state-level
compiled QRS quality ratings data file by selecting the Download link in the State Rating File column. Download the State Ratings Report by selecting the Download link in the State Rating Report column. (The State Ratings Report communicates the same information as the State Rating File in a user-friendly format.)
4. QRS Rating Methodology The QRS rating methodology is the process CMS uses to calculate QRS scores and ratings from QRS measure data (QRS clinical measure and QHP Enrollee Survey response data). This section describes how CMS calculates scores and ratings per the 2021 QRS requirements (see the 2021 QRS and QHP Enrollee Survey Technical Guidance).
QHP issuers are required to collect and submit validated QRS clinical measure data and QHP Enrollee Survey response data by product type9 with separate submissions by state. Therefore, the reporting unit for the QRS and QHP Enrollee Survey is defined by the unique combination of QHP issuer–state–product type.
CMS applies the QRS rating methodology to validated QRS measure data (i.e., QRS clinical measure data and a subset of the QHP Enrollee Survey response data [QRS survey measures]) to produce quality ratings on a 5-star rating scale. CMS uses collected data to calculate ratings for each reporting unit and applies these ratings to each QHP associated with that reporting unit. For 2021, QHP issuers were required to collect and submit validated data for 37 measures in the
9 Product type refers to Exclusive Provider Organization (EPO), Health Maintenance Organization (HMO), Point of Service (POS), and Preferred Provider Organization (PPO).

2021 Quality Rating System Proof Sheet User Guide
pg. 7
QRS measure set;10 however, four of these measures will not be included in scoring for 2021. CMS incorporated the Asthma Medication Ratio (AMR) and Annual Monitoring for Persons on Long-term Opioid Therapy (AMO) measures into the QRS measure set and will begin data collection in 2021.11
CMS will not include these two measures in scoring until the 2022 ratings year, at the earliest. CMS previously finalized the addition of the International Normalized Ratio Monitoring for Individual on Warfarin (INR); 12 however, due to the suspension of data collection and reporting activities for the 2020 QRS,13 the 2021 ratings year will be the first year of data collection for the INR measure and it will not be included in scoring until the 2022 ratings year, at the earliest. CMS temporarily removed the Child and Adolescent Well-Care Visit measure from scoring for the 2021 ratings year due to specification changes made by the measure steward.14 Therefore, CMS will include 33 measures in scoring in 2021. Additionally, as the AMR measure is the only measure in the Asthma Care composite, CMS will not score this composite for 2021.
4.1 QRS Measure Set and Hierarchy The QRS measures are organized into a hierarchical structure that serves as a foundation of the QRS rating methodology, as shown in Exhibit 2. The measures are grouped into hierarchy components (composites, domains, summary indicators) to form a single global rating.
• Measures and hierarchy components highlighted in grey are not included in the calculation of 2021 QRS scores and ratings.
• Survey measures in the QRS measure set are noted with an asterisk (*). The QHP Enrollee Survey assesses enrollee experience with health care services; specific questions are grouped to form survey measures used in the QRS. Appendix D shows which QHP Enrollee Survey questions are used for each QRS survey measure.
• Measures not currently endorsed by the National Quality Forum (NQF) are noted as ¥.
10 In communicating total measure counts, the totals presented here represent the perspective of the measure steward, rather than the perspective of the scoring methodology. If counting based on the perspective of the scoring methodology, QHP issuers were required to collect and submit validated data for 40 measures (rather than 37). The difference of three measures in this count comes from two factors. First, Prenatal and Postpartum Care (NQF #1517) is split into two distinct measures for the QRS hierarchy: Timeliness of Prenatal Care and Postpartum Care. Similarly, Proportion of Days Covered (NQF #0541) is split into three distinct measures: Diabetes All Class, Renin Angiotensin System (RAS) Antagonists, and Statins.) 11 See Section 3 of the Final 2020 Call Letter, available at https://www.cms.gov/files/document/final-2020-call-letter-quality-rating-system-qrs-and-qualified-health-plan-enrollee-experience.pdf). 12 See the Final 2019 Call Letter, available at: https://www.cms.gov/files/document/final-2020-call-letter-quality-rating-system-qrs-and-qualified-health-plan-enrollee-experience.pdf. 13 See the supra note 3. 14 See supra note 6.

2021 Quality Rating System Proof Sheet User Guide
pg. 8
Exhibit 2. QRS Hierarchy QRS
Summary Indicator QRS Domain
QRS Composite
QRS Measure ( * indicates survey measure) NQF ID15
Clinical Quality Management
Clinical Effectiveness
Asthma Care Asthma Medication Ratio 1800 Behavioral Health
Antidepressant Medication Management 0105 Follow-Up After Hospitalization for Mental Illness (7-Day Follow-Up)
0576
Initiation and Engagement of Alcohol and Other Drug Dependence Treatment
0004
Cardiovascular Care
Controlling High Blood Pressure 0018
Proportion of Days Covered (RAS Antagonists) 0541 Proportion of Days Covered (Statins) 0541
Diabetes Care Comprehensive Diabetes Care: Eye Exam (Retinal) Performed
0055
Comprehensive Diabetes Care: Hemoglobin A1c (HbA1c) Control (<8.0%)
0575
Comprehensive Diabetes Care: Medical Attention for Nephropathy
0062
Proportion of Days Covered (Diabetes All Class) 0541 Patient Safety Patient Safety Annual Monitoring for Persons on Long-term
Opioid Therapy 3541
Plan All-Cause Readmissions 1768 ¥ International Normalized Ratio Monitoring for Individuals on Warfarin
0555
Prevention Checking for Cancer
Breast Cancer Screening 2372 Cervical Cancer Screening 0032 Colorectal Cancer Screening 0034
Maternal Health Prenatal and Postpartum Care (Postpartum Care)
1517 ¥
Prenatal and Postpartum Care (Timeliness of Prenatal Care)
1517 ¥
Staying Healthy Adult
Chlamydia Screening in Women 0033 Flu Vaccinations for Adults Ages 18-64 * 0039 Medical Assistance with Smoking and Tobacco Use Cessation *
0027
Staying Healthy Child
Annual Dental Visit 1388 ¥ Childhood Immunization Status (Combination 3) 0038 Immunizations for Adolescents (Combination 2) 1407 Weight Assessment and Counseling for Nutrition and Physical Activity for Children and Adolescents
0024
Well-Child Visits in the First 30 Months of Life 1392 Child and Adolescent Well-Care Visits N/A
Enrollee Experience
Access and Care Coordination
Access and Care Coordination
Access to Care * 0006 Care Coordination * 0006
Doctor and Care
Doctor and Care
Rating of All Health Care * 0006 Rating of Personal Doctor * 0006 Rating of Specialist * 0006
15 Definitions of NQF-endorsed measures can be found here: http://www.qualityforum.org/Home.aspx.

2021 Quality Rating System Proof Sheet User Guide
pg. 9
QRS Summary Indicator QRS Domain
QRS Composite
QRS Measure ( * indicates survey measure) NQF ID15
Plan Efficiency, Affordability, & Management
Efficiency & Affordability
Efficient Care Appropriate Testing for Pharyngitis 0002 ¥ Appropriate Treatment for Upper Respiratory Infection
0069
Avoidance of Antibiotic Treatment for Acute Bronchitis/Bronchiolitis
0058
Use of Imaging Studies for Low Back Pain 0052 ¥ Plan Service Enrollee
Experience with Health Plan
Access to Information * 0007 ¥ Plan Administration * 0006 Rating of Health Plan * 0006
4.2 QRS Rating Methodology Overview Exhibit 3 provides a visual overview of the QRS rating methodology, which illustrates how CMS converts submitted QRS measure data into higher-level QRS hierarchy component scores and ratings. For the 2021 ratings year, CMS is applying the following two temporary refinements to mitigate the impact of the COVID-19 pandemic on ratings:
(1) Policy-Based Distribution: Set a policy-based distribution for the global rating and three summary indicator ratings that mirrors the historic data-driven distribution of QRS ratings (i.e., using averages across the past three ratings years [2017-2019]).
(2) Limit Star Ratings Declines: Introduce a rule that precludes health plans from decreasing in their global rating and summary indicator ratings by more than one star (e.g., if a reporting unit received a four-star global rating in ratings year 2019, the lowest rating the reporting unit could receive in ratings year 2021 is three stars).
Exhibit 3. Overview of QRS Rating Methodology

2021 Quality Rating System Proof Sheet User Guide
pg. 10
CMS applies explicit weights at the summary indicator level when calculating QRS scores and ratings. CMS will assign a weight of 2/3 (66.67%) to the Clinical Quality Management summary indicator, and a weight of 1/6 (16.67%) to the Enrollee Experience and the Plan Efficiency, Affordability, & Management summary indicators. This weighting structure reflects the approximate percentage of measures in each summary indicator.
For 2021, CMS will apply a temporary explicit weighting structure that reflects the amount of underlying measure data within the Patient Safety domain in the Clinical Quality Management summary indicator. As shown in Exhibit 2, the Patient Safety composite and domain will include only one measure for scoring in the 2021 ratings year (i.e., the Plan All-Cause Readmission (PCR) measure). To mitigate the influence of the PCR measure on the overall global score for the 2021 ratings year, CMS will adopt an explicit weighting structure that results in the Patient Safety domain contributing 11.1% to the global score.
The process for calculating 2021 QRS scores and ratings is further detailed below in Exhibit 4. Steps for calculating QRS scores and ratings that are new or unique for the 2021 ratings year are denoted with an asterisk (*). CMS conducts quality assurance (QA) activities throughout the data scoring process, beginning upon receipt of QRS clinical measure data and QHP Enrollee Survey response data. These QA activities include verification of submitted data file attributes and data content quality checks to validate the accuracy, completeness, consistency, and validity of output files and reports.
Exhibit 4. Steps for Calculating QRS Scores and Ratings Step Sub-steps
Step 1. Calculate measure rates
• Calculate QRS clinical measure rates. For QRS clinical measures with multiple measure indicators, calculate measure rates per the method defined by the measure’s technical specifications.
• Calculate QRS survey measure rates. For QRS survey measures, calculate measure rates from QHP Enrollee Survey data.
Step 2. Determine scoring status and application of denominator criteria
• Apply the scoring eligibility criteria. Only reporting units that have operated for three consecutive years on the Exchange and meet the QRS enrollment criteria are ratings eligible. Reporting units that do not meet the ratings eligibility criteria are removed from the analytical data, and do not go through steps 3-12 below.
• Apply the denominator criteria. The minimum denominator size is 30 observations for QRS clinical measures (including clinical measures captured in the QHP Enrollee Survey), 150 for the PCR measure, and 100 for QRS survey measures. Measures that do not meet the minimum denominator size requirement for scoring are excluded from QRS scoring.
Step 3. Calculate standardized measure scores
• Independently transform all raw measure rates using z-standardization. Compare the measure rate values of each reporting unit to the mean measure rate using a national reference group (i.e., across all reporting units), and control the spread using the standard deviation.
Step 4. Calculate composite scores
• Determine if the score can be calculated. Apply the half-scale rule, meaning the composite score can be calculated only if at least half (>= 50%) of the associated measures have a score.
• Calculate the score. If half-scale rule is met, average standardized measure scores. Otherwise, no composite score is calculated.
Step 5. Calculate domain scores
• Determine if the score can be calculated. Apply the half-scale rule, meaning the domain score can be calculated only if at least half (>= 50%) of the associated composites have a score.
• Calculate the score. If half-scale rule is met, average composite scores. Otherwise, no domain score is calculated.

2021 Quality Rating System Proof Sheet User Guide
pg. 11
Step Sub-steps Step 6. Apply explicit weights to Clinical Quality Management domain scores*
• Calculate the Clinical Quality Management score. Aggregate the domain scores calculated in Step 5 by applying the appropriate explicit weights, as applicable. For QRS 2021, only Patient Safety has an explicit weight (i.e., score x 0.1666 = weighted Patient Safety score).
Step 7. Calculate summary indicator scores
• Determine if the score can be calculated. Apply the half-scale rule, meaning the summary indicator score can be calculated only if at least half (>= 50%) of the associated domains have a score.
• Calculate the Enrollee Experience and Plan Efficiency, Affordability, & Management scores. If half-scale rule is met, average domain scores. Otherwise, no summary indicator score is calculated.
• Calculate the Clinical Quality Management score. If the half-scale rule is met, sum the domain scores. Otherwise, no summary indicator score is calculated.
Step 8. Apply explicit weights to summary indicator scores
• Calculate the final score. Multiply the summary indicator scores calculated in Step 7 by the appropriate explicit weights (e.g., Clinical Quality Management score x 0.6667 = weighted Clinical Quality Management score).
Step 9. Calculate global score
• Determine if the score can be calculated. The global score can be calculated only if the Clinical Quality Management summary indicator received a score and at least one of the other two summary indicators received a score. Otherwise, no global score is calculated.
• Calculate the score. If the above scoring rule is met, sum summary indicator scores (e.g., a weight of 2/3 (66.67%) to the Clinical Quality Management summary indicator, and a weight of 1/6 (16.67%) to the Enrollee Experience and the Plan Efficiency, Affordability, & Management summary indicators).
Step 10. Convert scores to ratings*
• Identify composite and domain cut point values. At the composite and domain level identify cut point values using a clustering algorithm. Use submitted, scored, and aggregated QRS measure data to identify four cut point values (to delineate five-star rating categories).
• Convert scores to ratings. Convert scores into a rating using the cut points for composites and domains.
• Identify summary indicator and global ratings. At the summary indicator and global level, assign ratings using the policy-based distribution. Group reporting unit scores such that the percent of reporting units in each ratings category reflects the average ratings distribution. − For 2021, CMS will not calculate cut points at the summary indicator and global
level. Step 11. Adjust summary indicator and global ratings*
• Identify reporting units that decreased in their global or summary indicator rating(s) by more than one star. For 2021, CMS will identify reporting units that experienced a reduction of more than one star compared to 2019. CMS will then adjust the ratings for impacted reporting units such that no reporting unit’s rating decreases by more than one star at the summary indicator and global level.
Step 12. Produce QRS results for preview and finalization
• Prepare the Ratings Output File (ROF). • Prepare QRS Preview Reports and Proof Sheets for QRS preview.
4.3 Process for Calculating QRS Scores and Ratings STEP 1: CALCULATE MEASURE RATES
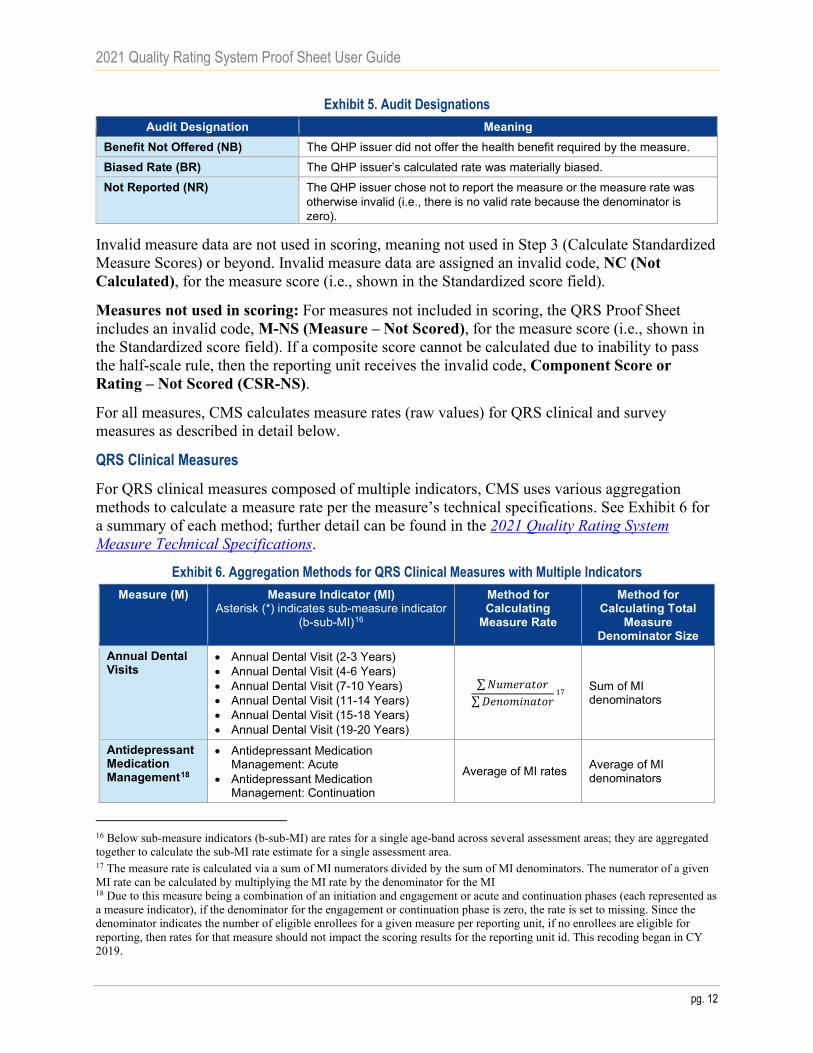
If a QHP issuer submitted a valid measure rate for the reporting unit, then a numeric result will appear in the Raw Value field for the measure in the QRS Proof Sheet. If a QHP issuer did not submit a valid measure rate for the reporting unit, then an invalid code will appear in the Raw Value field for the measure in the QRS Proof Sheet (and a null value [a dash, “-”] will appear in the Denominator Size field). A measure rate is considered invalid if the reporting unit received one of the audit designations provided in Exhibit 5.
2021 Quality Rating System Proof Sheet User Guide
pg. 12
Exhibit 5. Audit Designations Audit Designation Meaning
Benefit Not Offered (NB) The QHP issuer did not offer the health benefit required by the measure. Biased Rate (BR) The QHP issuer’s calculated rate was materially biased. Not Reported (NR) The QHP issuer chose not to report the measure or the measure rate was
otherwise invalid (i.e., there is no valid rate because the denominator is zero).
Invalid measure data are not used in scoring, meaning not used in Step 3 (Calculate Standardized Measure Scores) or beyond. Invalid measure data are assigned an invalid code, NC (Not Calculated), for the measure score (i.e., shown in the Standardized score field).
Measures not used in scoring: For measures not included in scoring, the QRS Proof Sheet includes an invalid code, M-NS (Measure – Not Scored), for the measure score (i.e., shown in the Standardized score field). If a composite score cannot be calculated due to inability to pass the half-scale rule, then the reporting unit receives the invalid code, Component Score or Rating – Not Scored (CSR-NS).
For all measures, CMS calculates measure rates (raw values) for QRS clinical and survey measures as described in detail below.
QRS Clinical Measures
For QRS clinical measures composed of multiple indicators, CMS uses various aggregation methods to calculate a measure rate per the measure’s technical specifications. See Exhibit 6 for a summary of each method; further detail can be found in the 2021 Quality Rating System Measure Technical Specifications.
Exhibit 6. Aggregation Methods for QRS Clinical Measures with Multiple Indicators Measure (M) Measure Indicator (MI)
Asterisk (*) indicates sub-measure indicator (b-sub-MI)16
Method for Calculating
Measure Rate
Method for Calculating Total
Measure Denominator Size
Annual Dental Visits
• Annual Dental Visit (2-3 Years)• Annual Dental Visit (4-6 Years)• Annual Dental Visit (7-10 Years)• Annual Dental Visit (11-14 Years)• Annual Dental Visit (15-18 Years)• Annual Dental Visit (19-20 Years)
∑𝑁𝑁𝑁𝑁𝑁𝑁𝑁𝑁𝑁𝑁𝑁𝑁𝑁𝑁𝑁𝑁𝑁𝑁∑𝐷𝐷𝑁𝑁𝐷𝐷𝑁𝑁𝑁𝑁𝐷𝐷𝐷𝐷𝑁𝑁𝑁𝑁𝑁𝑁𝑁𝑁
17 Sum of MI denominators
Antidepressant Medication Management18
• Antidepressant MedicationManagement: Acute
• Antidepressant MedicationManagement: Continuation
Average of MI rates Average of MI denominators
16 Below sub-measure indicators (b-sub-MI) are rates for a single age-band across several assessment areas; they are aggregated together to calculate the sub-MI rate estimate for a single assessment area. 17 The measure rate is calculated via a sum of MI numerators divided by the sum of MI denominators. The numerator of a given MI rate can be calculated by multiplying the MI rate by the denominator for the MI 18 Due to this measure being a combination of an initiation and engagement or acute and continuation phases (each represented as a measure indicator), if the denominator for the engagement or continuation phase is zero, the rate is set to missing. Since the denominator indicates the number of eligible enrollees for a given measure per reporting unit, if no enrollees are eligible for reporting, then rates for that measure should not impact the scoring results for the reporting unit id. This recoding began in CY 2019.

2021 Quality Rating System Proof Sheet User Guide
pg. 13
Measure (M) Measure Indicator (MI) Asterisk (*) indicates sub-measure indicator
(b-sub-MI)16
Method for Calculating
Measure Rate
Method for Calculating Total
Measure Denominator Size
Chlamydia Screening in Women
• Chlamydia Screening (16-20 Years) • Chlamydia Screening (21-24 Years)
∑𝑁𝑁𝑁𝑁𝑁𝑁𝑁𝑁𝑁𝑁𝑁𝑁𝑁𝑁𝑁𝑁𝑁𝑁∑𝐷𝐷𝑁𝑁𝐷𝐷𝑁𝑁𝑁𝑁𝐷𝐷𝐷𝐷𝑁𝑁𝑁𝑁𝑁𝑁𝑁𝑁
Sum of MI denominators
Initiation and Engagement of Alcohol and Other Drug (AOD) Dependence8
• Initiation of Alcohol and Other Drug Dependence Treatment (Total) − Initiation (13-17)*19 Alcohol Abuse or Dependence Opioid Abuse or Dependence Other Drug Abuse or
Dependence − Initiation (18+)* Alcohol Abuse or Dependence Opioid Abuse or Dependence Other Drug Abuse or
Dependence • Engagement of Alcohol and Other Drug
Dependence Treatment (Total) − Engagement (13-17) * Alcohol Abuse or Dependence Opioid Abuse or Dependence Other Drug Abuse or
Dependence − Engagement (18+)* Alcohol Abuse or Dependence Opioid Abuse or Dependence Other Drug Abuse or
Dependence
Three Steps:
1. Sub-MI = Count of unique enrollees per age band across treatments (b-sub-MIs)
2. ∑𝑁𝑁𝑁𝑁𝑁𝑁𝑁𝑁𝑁𝑁𝑁𝑁𝑁𝑁𝑁𝑁𝑁𝑁𝑠𝑠𝑠𝑠𝑠𝑠−𝑀𝑀𝑀𝑀∑𝐷𝐷𝑁𝑁𝐷𝐷𝑁𝑁𝑁𝑁𝐷𝐷𝐷𝐷𝑁𝑁𝑁𝑁𝑁𝑁𝑁𝑁𝑠𝑠𝑠𝑠𝑠𝑠−𝑀𝑀𝑀𝑀
3. Average of MI rates
Three Steps:
1. Sub-MI = Count of unique enrollees per age band across treatments (b-sub-MIs)
2. ∑𝐷𝐷𝑁𝑁𝐷𝐷𝑁𝑁𝑁𝑁𝐷𝐷𝐷𝐷𝑁𝑁𝑁𝑁𝑁𝑁𝑁𝑁𝑠𝑠𝑁𝑁𝑠𝑠−𝑀𝑀𝑀𝑀
3. Average of MI
denominators
Plan All-Cause Readmissions
• Observed Readmission Rate (Numerator/Denominator) Total
• Average Adjusted Probability Total
Observed Readmission Rate divided by Average Adjusted Probability
Sum of MI denominators
Weight Assessment and Counseling for Nutrition and Physical Activity for Children and Adolescents
• Body Mass Index (BMI) Percentile Documentation − BMI Percentile − 3-11 Years* − BMI Percentile − 12-17 Years*
• Counseling for Nutrition − Counseling for nutrition − 3-11
Years* − Counseling for nutrition − 12-17
Years* • Counseling for Physical Activity
− Counseling for Physical Activity − 3-11 Years*
− Counseling for Physical Activity − 12-17 Years*
Two Steps: 1. ∑𝑁𝑁𝑁𝑁𝑁𝑁𝑁𝑁𝑁𝑁𝑁𝑁𝑁𝑁𝑁𝑁𝑁𝑁𝑠𝑠𝑠𝑠𝑠𝑠−𝑀𝑀𝑀𝑀
∑𝐷𝐷𝑁𝑁𝐷𝐷𝑁𝑁𝑁𝑁𝐷𝐷𝐷𝐷𝑁𝑁𝑁𝑁𝑁𝑁𝑁𝑁𝑠𝑠𝑠𝑠𝑠𝑠−𝑀𝑀𝑀𝑀
2. Average of MI rates
Two Steps: 1. ∑𝐷𝐷𝑁𝑁𝐷𝐷𝑁𝑁𝑁𝑁𝐷𝐷𝐷𝐷𝑁𝑁𝑁𝑁𝑁𝑁𝑁𝑁𝑠𝑠𝑁𝑁𝑠𝑠−𝑀𝑀𝑀𝑀 2. Average of MI denominators
Well-Child Visits in the First 30 Months of Life
• Well-Child Visits in the First 15 Months • Well-Child Visits for Age 15 Months – 30
Months ∑𝑁𝑁𝑁𝑁𝑁𝑁𝑁𝑁𝑁𝑁𝑁𝑁𝑁𝑁𝑁𝑁𝑁𝑁∑𝐷𝐷𝑁𝑁𝐷𝐷𝑁𝑁𝑁𝑁𝐷𝐷𝐷𝐷𝑁𝑁𝑁𝑁𝑁𝑁𝑁𝑁
Sum of MI denominators
19 Sub-measure indicators (sub-MIs) are combined via an average (sum of numerators divided by sum of denominators) to create the rate for a measure indicator (MI).

2021 Quality Rating System Proof Sheet User Guide
pg. 14
Measure (M) Measure Indicator (MI) Asterisk (*) indicates sub-measure indicator
(b-sub-MI)16
Method for Calculating
Measure Rate
Method for Calculating Total
Measure Denominator Size
Medical Assistance with Smoking and Tobacco Use Cessation20
• How Often Advised to Quit Smoking or Using Tobacco
– How Often Advised to Quit Smoking or Using Tobacco (Current Year)
– How Often Advised to Quit Smoking or Using Tobacco (Previous Year)
• How Often Medication Recommended or Discussed
– How Often Medication Recommended or Discussed (Current Year)
– How Often Medication Recommended or Discussed (Previous Year)
• How Often Provided Strategies to Quit – How Often Provided Strategies to
Quit (Current Year) – How Often Provided Strategies to
Quit (Previous Year)
Two Steps: 1. ∑𝑁𝑁𝑁𝑁𝑁𝑁𝑁𝑁𝑁𝑁𝑁𝑁𝑁𝑁𝑁𝑁𝑁𝑁𝑠𝑠𝑠𝑠𝑠𝑠−𝑀𝑀𝑀𝑀
∑𝐷𝐷𝑁𝑁𝐷𝐷𝑁𝑁𝑁𝑁𝐷𝐷𝐷𝐷𝑁𝑁𝑁𝑁𝑁𝑁𝑁𝑁𝑠𝑠𝑠𝑠𝑠𝑠−𝑀𝑀𝑀𝑀
2. Average of MI rates
Two Steps: 1. ∑𝐷𝐷𝑁𝑁𝐷𝐷𝑁𝑁𝑁𝑁𝐷𝐷𝐷𝐷𝑁𝑁𝑁𝑁𝑁𝑁𝑁𝑁𝑠𝑠𝑁𝑁𝑠𝑠−𝑀𝑀𝑀𝑀 2. Average of MI denominators
QRS Survey Measures
For QRS survey measures, CMS calculates measure rates from QHP Enrollee Survey questions.
Appendix D shows which QHP Enrollee Survey questions are used for each QRS survey measure.
QRS survey measures are grouped into two categories:
(1) CAHPS®-based: Consumers’ experience of care measures based on the Consumer Assessment of Healthcare Providers and Systems (CAHPS®), and
(2) Clinical measures captured in QHP Enrollee Survey: Selected clinical measures based on the Healthcare Effectiveness Data and Information Set (HEDIS®).
CMS calculates QRS survey measure rates according to the scoring specifications described below.
20 The Medical Assistance with Smoking and Tobacco Use Cessation (Tobacco) measure is calculated as a two-year rolling average based on sub-MI data. Typically, CMS uses the data reported in the prior year and the ratings year to calculate a two-year rolling average. Due to the suspension of data collection in 2020 in response to the COVID-19 public health emergency, CMS will calculate the rolling average using the last year of available data for the Tobacco measure (i.e., 2019) and data from the current ratings year (i.e., 2021). CMS merges information for a given reporting unit from the prior year onto the data from the ratings year to calculate the measure score. Missing data is recoded to zero for rate calculation. The Tobacco sub-MIs are reported in the QRS Proof Sheets as M25a1-M25c1 and M25a2-M25c2, respectively. For reporting units that were ineligible to receive a QRS rating in the prior year, CMS uses the reported rates from the prior year and current year to calculate the Tobacco measure score, even though the reporting unit was not ratings-eligible in the prior year. For example, if a reporting unit is newly eligible to receive a QRS rating in 2021, CMS will use the reporting unit’s reported data for 2019 and 2021 to calculate the Tobacco measure score.

2021 Quality Rating System Proof Sheet User Guide
pg. 15
CAHPS®-based QRS Survey Measures
CMS calculates CAHPS®-based QRS survey measures with an approach similar to the one CMS uses in the Medicare Advantage-Prescription Drug Program (MA-PDP) quality measurement initiative for data collected through the MA-PDP CAHPS® survey.21
CMS calculates QRS survey measures rates from the QHP Enrollee Survey using the CAHPS®
Analysis Program Version 5.0 (“CAHPS® macro”), which was developed by the CAHPS®
Consortium under the auspices of the Agency for Healthcare Research and Quality (AHRQ). A comprehensive description of the calculations performed by the CAHPS® macro, including additional information on weighting and case-mix adjustment, can be found in the Instructions for Analyzing Data from CAHPS Surveys.
To adjust for any systematic biases with the enrollee response data, CMS applies a case-mix adjustment to the QHP Enrollee Survey response data and uses the adjusted data when calculating the QRS survey measures. It is common in survey-based applications to case-mix adjust for such factors as overall health status, age, and education to account for biases due to survey response tendencies. The QHP Enrollee Survey variables used in the case-mix adjustment include the following: general health rating, mental health rating, chronic conditions/ medications, age, education, survey language, help with the survey, and survey mode. The final variables to be included in the case-mix adjustment will be determined based on additional analysis of the 2021 QHP Enrollee Survey data.
All CAHPS®-based measures are based on weighted, case-mix adjusted means. CMS uses person-level sampling weights to account for the different probabilities of selection across reporting units. The weights are calculated as follows:
𝐹𝐹𝐷𝐷𝐷𝐷𝑁𝑁𝑖𝑖 𝑊𝑊𝑁𝑁𝐷𝐷𝑊𝑊ℎ𝑁𝑁 = �𝑀𝑀𝐷𝐷_𝑠𝑠
� ∗ 𝑘𝑘
Where: n_s = Total number of sampled enrollees in the sampling unit; M = Total number of records in the sampling unit after-de-duplication; k = Number of eligible enrollees covered by the Subscriber or Family ID (SFID) that covers the sampled enrollee.
As shown below, all CAHPS®-based questions should be coded so higher values represent more positive responses.
Rating of Health Plan
Question 20 in the 2021 QHP Enrollee Survey asks, “Using any number from 0 to 10, where 0 is the worst health plan possible and 10 is the best health plan possible, what number would you use to rate your health plan in the last 6 months?” Use the following steps to calculate the QRS measure rate for Rating of Health Plan:
1. Calculate the weighted, case-mix adjusted mean for question 20.
21 General background information about the scoring of CAHPS®-based measures in the MA-PDP program is presented in the MA-PDP CAHPS® Survey: Quality Assurance Protocols and Technical Specifications (http://www.ma-pdpcahps.org/).
2021 Quality Rating System Proof Sheet User Guide
pg. 16
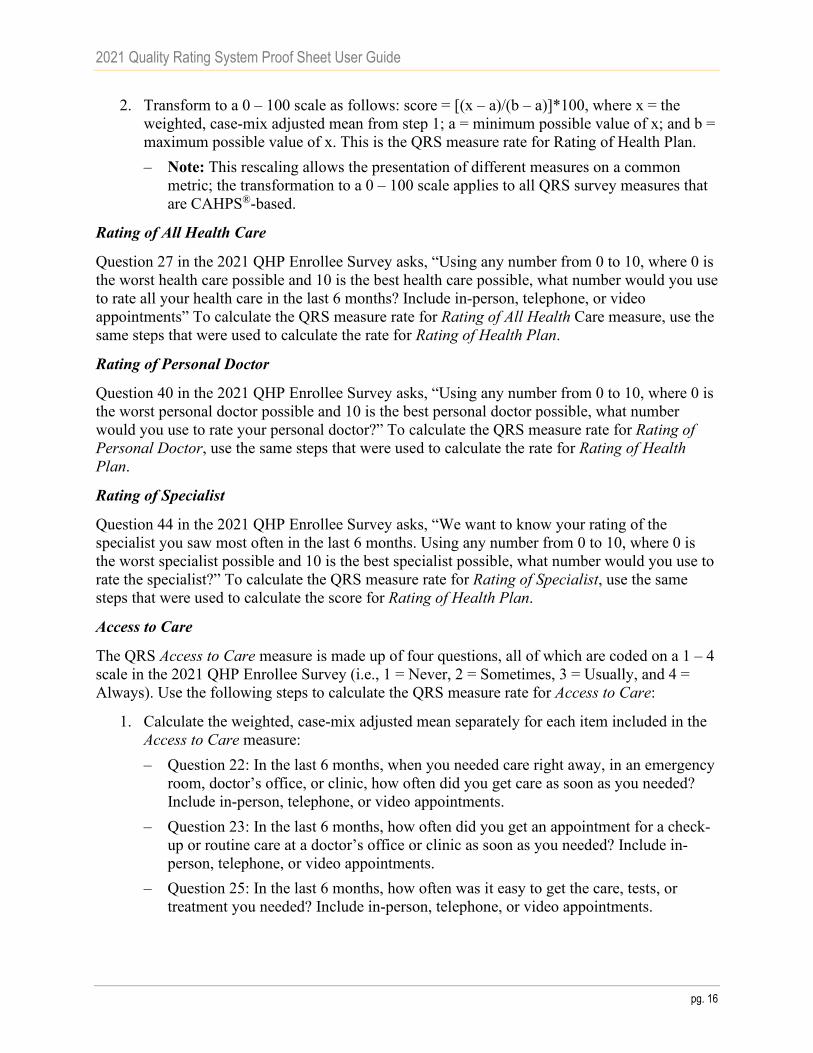
2. Transform to a 0 – 100 scale as follows: score = [(x – a)/(b – a)]*100, where x = the weighted, case-mix adjusted mean from step 1; a = minimum possible value of x; and b = maximum possible value of x. This is the QRS measure rate for Rating of Health Plan. – Note: This rescaling allows the presentation of different measures on a common
metric; the transformation to a 0 – 100 scale applies to all QRS survey measures that are CAHPS®-based.
Rating of All Health Care
Question 27 in the 2021 QHP Enrollee Survey asks, “Using any number from 0 to 10, where 0 is the worst health care possible and 10 is the best health care possible, what number would you use to rate all your health care in the last 6 months? Include in-person, telephone, or video appointments” To calculate the QRS measure rate for Rating of All Health Care measure, use the same steps that were used to calculate the rate for Rating of Health Plan.
Rating of Personal Doctor
Question 40 in the 2021 QHP Enrollee Survey asks, “Using any number from 0 to 10, where 0 is the worst personal doctor possible and 10 is the best personal doctor possible, what number would you use to rate your personal doctor?” To calculate the QRS measure rate for Rating of Personal Doctor, use the same steps that were used to calculate the rate for Rating of Health Plan.
Rating of Specialist
Question 44 in the 2021 QHP Enrollee Survey asks, “We want to know your rating of the specialist you saw most often in the last 6 months. Using any number from 0 to 10, where 0 is the worst specialist possible and 10 is the best specialist possible, what number would you use to rate the specialist?” To calculate the QRS measure rate for Rating of Specialist, use the same steps that were used to calculate the score for Rating of Health Plan.
Access to Care
The QRS Access to Care measure is made up of four questions, all of which are coded on a 1 – 4 scale in the 2021 QHP Enrollee Survey (i.e., 1 = Never, 2 = Sometimes, 3 = Usually, and 4 = Always). Use the following steps to calculate the QRS measure rate for Access to Care:
1. Calculate the weighted, case-mix adjusted mean separately for each item included in the Access to Care measure: – Question 22: In the last 6 months, when you needed care right away, in an emergency
room, doctor’s office, or clinic, how often did you get care as soon as you needed? Include in-person, telephone, or video appointments.
– Question 23: In the last 6 months, how often did you get an appointment for a check-up or routine care at a doctor’s office or clinic as soon as you needed? Include in-person, telephone, or video appointments.
– Question 25: In the last 6 months, how often was it easy to get the care, tests, or treatment you needed? Include in-person, telephone, or video appointments.

2021 Quality Rating System Proof Sheet User Guide
pg. 17
– Question 41: In the last 6 months, how often did you get an appointment to see a specialist as soon as you needed? Include in-person, telephone, or video appointments.
2. Calculate the average of the weighted, case-mix adjusted means across the four survey questions; use equal weighing of the questions.
3. Transform the average from Step 2 to a 0 – 100 scale (use the same formula as described in Step 2 for Rating of Health Plan). This is the QRS measure rate for Access to Care.
Care Coordination
The QRS Care Coordination measure is made up of six questions, all of which are coded on a 1 – 4 scale in the 2021 QHP Enrollee Survey (i.e., 1 = Never, 2 = Sometimes, 3 = Usually, and 4 = Always). Use the following steps to calculate the QRS measure rate for the Care Coordination measure:
1. Questions 34 and 35 are combined into a single measure to assess getting results after a blood test, x-ray, or other test. Calculate the average of the weighted, case-mix adjusted means for Questions 34 and 35 using equal weighting of the two questions. Use this average in Step 3.
2. Calculate the weighted, case-mix adjusted mean separately for each question included in the Care Coordination measure: – Question 33: When you visited your personal doctor for a scheduled appointment in
the last 6 months, how often did he or she have your medical records or other information about your care? Include in-person, telephone, or video appointments.
– Question 34: In the last 6 months, when your personal doctor ordered a blood test, x-ray, or other test for you, how often did someone from your personal doctor’s office follow up to give you those results?
– Question 35: In the last 6 months, when your personal doctor ordered a blood test, x-ray, or other test for you, how often did you get those results as soon as you needed them?
– Question 43: In the last 6 months, how often did your personal doctor seem informed and up-to-date about the care you got from specialists?
– Question 36: In the last 6 months, how often did you and your personal doctor talk about all the prescriptions medicines you were taking?
– Question 39: In the last 6 months, how often did you get the help that you needed from your personal doctor’s office to manage your care among these different providers and services?
3. Calculate the average of the weighted, case-mix adjusted means across the five survey questions (i.e., Questions 33, 43, 36, and 39, and the average of Questions 34 and 35 from Step 2); use equal weighting of the questions.
4. Transform the average from Step 3 to a 0 – 100 scale (use the same formula as described in Step 2 for Rating of Health Plan). This is the QRS measure rate for Care Coordination.

2021 Quality Rating System Proof Sheet User Guide
pg. 18
Access to Information
The QRS Access to Information measure is made up of three questions, all of which are coded on a 1 – 4 scale in the 2021 QHP Enrollee Survey (i.e., 1 = Never, 2 = Sometimes, 3 = Usually, and 4 = Always). Use the following steps to calculate the QRS measure rate for Access to Information:
1. Calculate the weighted, case-mix adjusted mean separately for each item included in the Access to Information measure: – Question 3: In the last 6 months, how often did the written materials or the Internet
provide the information you needed about how your health plan works? – Question 4: In the last 6 months, how often were you able to find out from your
health plan how much you would have to pay for a health care service or equipment before you got it?
– Question 5: In the last 6 months, how often were you able to find out from your health plan how much you would have to pay for specific prescription medicines?
2. Calculate the average of the weighted, case-mix adjusted means across the three survey questions; use equal weighing of the questions.
3. Transform the average from Step 2 to a 0 – 100 scale (use the same formula as described in Step 2 for Rating of Health Plan). This is the QRS measure rate for Access to Information.
Plan Administration
The QRS Plan Administration measure is made up of five questions, all of which are coded on a 1 – 4 scale in the 2021 QHP Enrollee Survey (i.e., 1 = Never, 2 = Sometimes, 3 = Usually, and 4 = Always). Use the following steps to calculate the QRS score for the Plan Administration measure:
1. Calculate the weighted, case-mix adjusted mean separately for each item included in the Plan Administration measure: – Question 6: In the last 6 months, how often did your health plan’s customer service
give you the information or help you needed? – Question 7: In the last 6 months, how often did your health plan’s customer service
staff treat you with courtesy and respect? – Question 8: In the last 6 months, how often did the time that you waited to talk to
your health plan’s customer service staff take longer than you expected? o Note: To make the direction of coding of Question 8 consistent with the other
questions, Question 8 needs to be recoded so higher values represent a more positive response, as follows:
Category Original Code Recode Never 1 4 Sometimes 2 3 Usually 3 2 Always 4 1

2021 Quality Rating System Proof Sheet User Guide
pg. 19
– Question 9: In the last 6 months, how often were the forms from your health plan easy to fill out?
– Question 10: In the last 6 months, how often did the health plan explain the purpose of a form before you filled it out?
2. Calculate the average of the weighted, case-mix adjusted means across the five survey questions; use equal weighing of the questions.
3. Transform the average from Step 2 to a 0 – 100 scale (use the same formula as described in Step 2 for Rating of Health Plan). This is the QRS measure rate for Plan Administration.
QRS Clinical Measures Captured in QHP Enrollee Survey
The following QRS survey measures are clinical in nature: • Flu Vaccinations for Adults Ages 18-64 • Medical Assistance with Smoking and Tobacco Use Cessation
Scoring specifications for the clinical measures collected through the 2021 QHP Enrollee Survey follow the HEDIS® specifications as defined by NCQA. CMS applies the QRS clinical measure denominator criterion of 30 to all clinical measures captured in the QHP Enrollee survey. The scoring procedures are described below. These specifications are also presented in the 2021 Quality Rating System Measure Technical Specifications.
Flu Vaccinations for Adults Ages 18-64
The QRS survey measure captures the proportion of eligible plan enrollees who received a flu vaccination. The following steps are used for calculating the QRS survey measure (flu_shot):
1. Select eligible enrollees: – Include:
o Enrollees age 18-64 (to determine eligibility use flu_flag from the sampling frame, which indicates eligibility for the flu shot based on the person’s age as of July 1, 2020).
– Exclude: o Respondents with a missing value code on flu_shot (i.e., respondents coded as -1,
-3, or 3 on flu_shot). 2. Calculate the proportion of eligible enrollees for whom flu_shot=1 to create the final
QRS survey measure rate for Flu Vaccinations for Adults Ages 18-64. – Note: The proportion is not weighted and is not case-mix adjusted.
Medical Assistance with Smoking and Tobacco Use Cessation
The QRS survey measure is made up of three items/indicators, all of which are coded on a 1 − 4 scale in the questionnaire. All items require two years of data collection.
The inclusion/exclusion criteria for the measure include the following steps:

2021 Quality Rating System Proof Sheet User Guide
pg. 20
1. Select eligible enrollees (the criteria for each of the three indicators follow separately): Advising Smokers and Tobacco Users to Quit (advised_quit_tob):
– Include: o Current smokers or tobacco user (i.e., respondents coded as 1 or 2 on
use_tobacco). – Exclude:
o Respondents with a missing value code on advised_quit_tob (i.e., respondents coded as -1, -2, -3, or -7 on advised_quit_tob).
Discussing Cessation Medications (recommend_tob_med): – Include:
o Current smokers or tobacco user (i.e., respondents coded as 1 or 2 on use_tobacco).
– Exclude: o Respondents with a missing value code on recommend_tob_med (i.e.,
respondents coded as -1, -2, -3, or -7 on recommend_tob_med). Discussing Cessation Strategies (discuss_tob_non_meds): – Include:
o Current smokers or tobacco user (i.e., respondents coded as 1 or 2 on use_tobacco).
– Exclude: o Respondents with a missing value code on discuss_tob_non_meds (i.e.,
respondents coded as -1, -2, -3, or -7 on discuss_tob_non_meds).
2. Calculate the unadjusted proportion of respondents who indicated on each item included in the measure that they received some level of advice/discussion (i.e., proportion on each item with codes of Sometimes, Usually, or Always). – Note: The proportion is not weighted and not case-mix adjusted. These are the
indicators used in the calculation of the QRS survey measure rate for Medical Assistance with Smoking and Tobacco Use Cessation: o advised_quit_tob (i.e., proportion of respondents coded as 2, 3, or 4), o recommend_tob_med (i.e., proportion of respondents coded as 2, 3, or 4), o discuss_tob_non-meds (i.e., proportion of respondent coded as 2, 3, or 4).

2021 Quality Rating System Proof Sheet User Guide
pg. 21
STEP 2: DETERMINE SCORING STATUS AND APPLICATION OF DENOMINATOR CRITERIA
For each reporting unit, CMS assesses whether measure data can be included in QRS scoring based on the reporting unit’s ratings eligibility status, and each measure’s denominator size. A reporting unit is considered ratings-eligible if it operated in an Exchange for three consecutive years (i.e., 2018, 2019, and 2021), and meets the minimum enrollment criteria (i.e., more than 500 enrollees as of July 1 of the prior year [i.e., 2020] and the ratings year [i.e., 2021]).22
Reporting units that do not meet the ratings eligibility criteria are removed from scoring and will receive an invalid code, as described in Appendix B. Similarly, while QHP issuers submit measure data to CMS regardless of denominator size, measures that do not meet the minimum denominator criteria for scoring (see Exhibit 7) are excluded from QRS scoring.
Exhibit 7. Minimum Denominator Size Required for Inclusion in QRS Scoring Measure Minimum Denominator Criteria
for Inclusion in QRS Scoring QRS Clinical Measure 30 PCR Measure 150 QRS Clinical Measures Captured in QHP Enrollee Survey 30 QRS CAHPS®-based Survey Measure 100
The minimum denominator size of 100 applies to all QRS CAHPS®-based survey measures, regardless of the number of survey questions associated with the measure. The minimum denominator size of 30 applies to all QRS clinical measures (including those clinical measures captured in the 2021 QHP Enrollee Survey), with the exception of the PCR measure.
For measures with an insufficient denominator size, CMS assigns the measure an invalid code (i.e., NC/Not Calculated) and excludes the measure from scoring.
QRS Clinical Measures
For QRS clinical measures, CMS determines if the minimum denominator size is met based on the measure’s total denominator size. Different measures have different aggregation methods, as shown in Exhibit 6.
As shown in the illustrative example in Exhibit 8, the measure Weight Assessment and Counseling for Nutrition and Physical Activity for Children/Adolescents has three indicators. For this example reporting unit, the measure’s denominator size of 995 meets the minimum denominator size criteria of 30. Therefore, CMS uses these measure data in QRS scoring (i.e., proceed to use this measure data in the standardization procedures described in Step 3).
22 Under normal operations, reporting units are eligible to receive QRS scores and ratings beginning with their third consecutive year of operation on the Exchange. However, due to the suspension of 2020 QRS data collection, reporting units in their second year of operation were unable to submit data for the first time during the 2020 QRS ratings year. Therefore, in recognition of the impact of the COVID-19 public health emergency, CMS is amending the scoring eligibility criteria such that the 2020 ratings year will not count toward scoring eligibility. As a result, reporting units will be considered scoring eligible if they were operational on the Exchange in 2018, 2019, and 2021, and meet the minimum enrollment criteria.

2021 Quality Rating System Proof Sheet User Guide
pg. 22
Exhibit 8. Example Denominator Size for QRS Clinical Measure Indicators Name Type of QRS
Component Denominator Size
BMI percentile documentation Indicator 1641
Counseling for nutrition Indicator 17
Counseling for physical activity Indicator 1327
Weight Assessment and Counseling for Nutrition and Physical Activity for Children/Adolescents
Measure 995
CAHPS®-based QRS Survey Measures
For CAHPS®-based QRS survey measures, CMS determines if the minimum denominator size is met based on the measure’s total denominator size. The denominator size for the measure is equal to the total number of unique respondents who provided a response to at least one of the questions.
Exhibit 9 shows an example (using mock data) of denominator size calculation for the CAHPS®-based QRS survey measure, Access to Care. Access to Care is composed of four questions. As shown, there can be valid denominator observations for each of the four questions that are lower than 100 and yet the measure denominator size can still be greater than 100. Enrollees are not required to respond to all survey questions to be included in a given measure’s denominator or rate. The total measure denominator size (161), meaning that 161 unique respondents answered across the four questions needed to calculate Access to Care, is greater than the minimum denominator size needed for QRS scoring (100). Therefore, CMS calculates the average of the case-mix adjusted mean across the four survey questions to obtain the Access to Care measure score.
Exhibit 9. Example of Total Denominator Size Calculation for CAHPS®-Based QRS Survey Measure
Name Type of QRS Component Question Details
Denominator Size
CAHPS® Getting Care Quickly: Non-Urgent Care
Indicator Question 22: In the last 6 months, how often did you get an appointment for a check-up or routine care, in an emergency room, doctor’s office, or clinic, how often did you get care as soon as you needed? Include in person, telephone, or video appointments.
136
CAHPS® Getting Care Quickly: Urgent Care
Indicator Question 23: In the last 6 months, when you needed care right away, how often did you get care as soon as you needed? Include in person, telephone, or video appointments.
77
CAHPS® Getting Needed Care: Easy Care, Tests, or Treatment
Indicator Question 25: In the last 6 months, how often was it easy to get the care, tests, or treatment you needed? Include in person, telephone, or video appointments.
146
CAHPS® Getting Needed Care: Easy to See Specialist
Indicator Question 41: In the last 6 months, how often did you get an appointment to see a specialist as soon as you needed? Include in person, telephone, or video appointments.
90
Access to Care Measure 161

2021 Quality Rating System Proof Sheet User Guide
pg. 23
STEP 3: CALCULATE STANDARDIZED MEASURE SCORES
CMS calculates standardized measure scores by independently transforming the raw measure rate using Z-standardization and comparing measure rate values of each reporting unit to the mean measure rate based on one national, all-product reference group (i.e., not stratified by any characteristics, such as product type or Exchange). The scores reflect how well a reporting unit did compared to the other reporting units in a given measure.
CMS uses a Z-score approach to transform all raw measure rates, independently, by calculating each measure’s respective mean and standard deviation. The Z-score approach compares a reporting unit’s measure rate values to the mean measure rate and standardized deviation of all available reporting units at a national level. 23 After Z-scoring, the standardized values are converted to a 0 to 100 scale, using a normal curve equivalent (NCE). All values under 0 or over 100 are truncated to 0 or 100, respectively.24 Reporting units with tied measure rates will receive the same standardized score without impacting the preceding or proceeding reporting units’ scores.25 CMS excludes reporting units that do not meet the minimum denominator criterion from standardization.
For example, as shown in Exhibit 10, CMS uses the valid rates for the Cervical Cancer Screening measure across all reporting units to calculate the mean and standard deviation, across all products (i.e., EPO, HMO, POS, and PPO) and all Exchanges. If a QHP issuer’s HMO product has a measure rate (raw value) equal to the mean of the measure, the product’s Z-score equals zero. From here, the Z-score is first converted to a 0-100 scale using the NCE, and then converted to a standardized score of 50.
Exhibit 10. Example Score after Z-score Standardization Measure Raw Value Standardized Score
Cervical Cancer Screening (CCS) 0.82 50.0000
Summary Statistics for Cervical Cancer Screening (CCS):
𝑍𝑍 − 𝑆𝑆𝑆𝑆𝑁𝑁𝑁𝑁𝑁𝑁 = (0.82 − 0.82)
2.15= 0
Converted value using NCE: 50 + 49/𝑞𝑞𝐷𝐷𝑁𝑁𝑁𝑁𝑁𝑁(.99)26 ∗ 𝑍𝑍 − 𝑆𝑆𝑆𝑆𝑁𝑁𝑁𝑁𝑁𝑁
Reporting Unit Standardized Score for CCS: 50 + 21.063 ∗ (0) = 50
23 While similar to a percentile-rank, z-score differs by better preserving the distance between values, such that differences between z-scores reflect real differences in the underlying data. The closer the underlying data follow a normal distribution, the closer the transformed z-scores mimic the percentiles of the normal distribution at 1, 50, and 99. The property fails the further the underlying data are from normal. 24 This is an artifact from the conversion using NCE. 25 Prior to the 2018 ratings year, CMS used the PROC RANK standardization approach. Under the PROC RANK approach, reporting units with tied measure rates were assigned the value of the average rank. 26 Quantile function for the normal distribution.

2021 Quality Rating System Proof Sheet User Guide
pg. 24
STEP 4: CALCULATE COMPOSITE SCORES
CMS calculates composite scores by averaging (unweighted) scores.
CMS calculates composite scores based on averages of standardized QRS measure scores. The steps are as follows:
1. Determine if the composite score can be calculated. CMS uses a half-scale rule to determine if the composite score can be calculated. The half-scale rule allows calculation of the score only if at least half (>50%) of the associated measures in the composite have a valid score (i.e., measure results met the minimum denominator criteria as defined in Step 2 and, therefore, received a score). Otherwise, the composite cannot be calculated and does not receive a score. When applying the half-scale rule for composite score calculation, CMS only considers measures that are included in scoring. If the composite score cannot be calculated due to inability to pass the half-scale rule, then the reporting unit receives the following invalid code: – CSR-I: Insufficient data to calculate a score according to the QRS rating
methodology. 2. Calculate the composite score. If the composite score can be calculated according to the
half-scale rule, CMS averages the available measure scores.
Exhibit 11 shows how a composite is calculated from measure scores using mock data.
Exhibit 11. Example Composite Score Calculation
Measure Type of QRS Component
Score
Chlamydia Screening in Women Measure 99.5169 Flu Vaccinations for Adults Ages 18-64 Measure 10.4982 Medical Assistance With Smoking and Tobacco Use Cessation
Measure NC (Invalid code NC assigned due to invalid measure rate [NR audit designation]) defined in Appendix B.
Staying Healthy Adult Composite 55.0076 Note, the composite score can be calculated because two of the three available measures (Chlamydia Screening and Flu Vaccinations) received valid scores (equal to >50%).
STEP 5: CALCULATE DOMAIN SCORES
CMS calculates domain scores based on averages of composite scores. The steps are as follows: 1. Determine if the domain score can be calculated. To calculate the domain score, CMS
uses the half-scale rule to determine if at least half (>50%) of the associated composites have a valid score. If the domain score cannot be calculated, it will not reflect a score (i.e., will receive an invalid result of CSR-I).
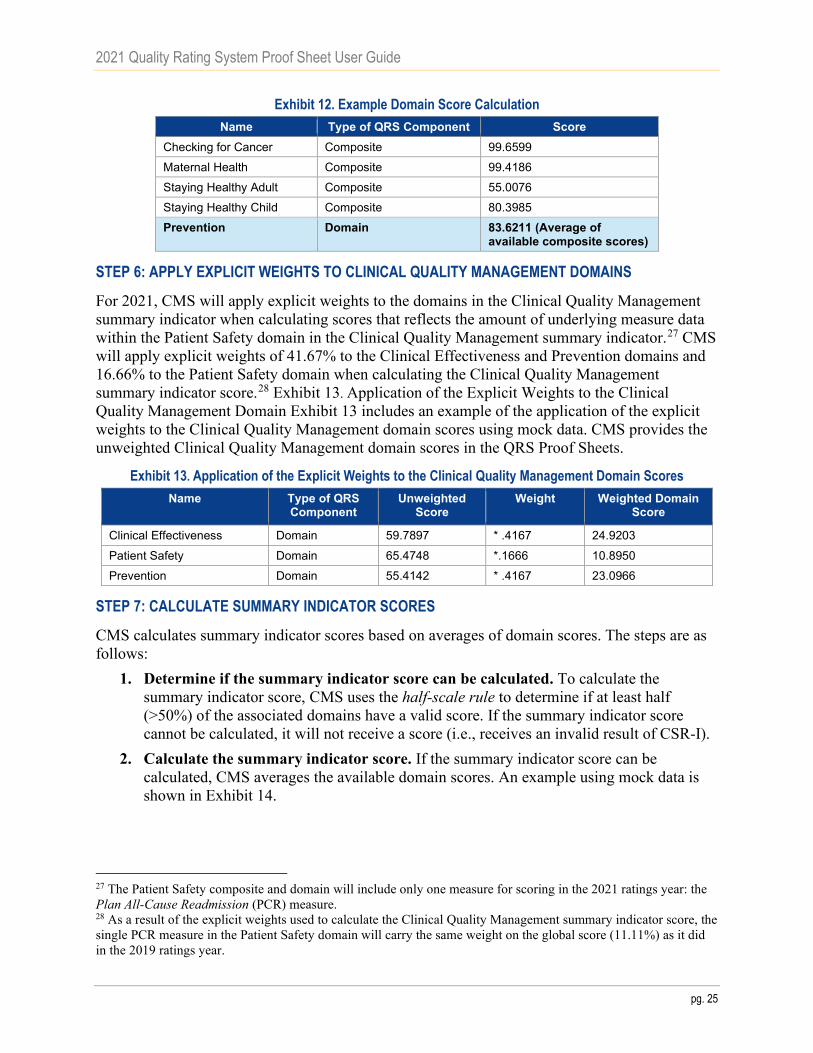
2. Calculate the domain score. If the domain score can be calculated, CMS averages the available composite scores. An example using mock data is shown in Exhibit 12.
2021 Quality Rating System Proof Sheet User Guide
pg. 25
Exhibit 12. Example Domain Score Calculation Name Type of QRS Component Score
Checking for Cancer Composite 99.6599 Maternal Health Composite 99.4186 Staying Healthy Adult Composite 55.0076 Staying Healthy Child Composite 80.3985 Prevention Domain 83.6211 (Average of
available composite scores)
STEP 6: APPLY EXPLICIT WEIGHTS TO CLINICAL QUALITY MANAGEMENT DOMAINS
For 2021, CMS will apply explicit weights to the domains in the Clinical Quality Management summary indicator when calculating scores that reflects the amount of underlying measure data within the Patient Safety domain in the Clinical Quality Management summary indicator.27 CMS will apply explicit weights of 41.67% to the Clinical Effectiveness and Prevention domains and 16.66% to the Patient Safety domain when calculating the Clinical Quality Management summary indicator score.28 Exhibit 13. Application of the Explicit Weights to the Clinical Quality Management Domain Exhibit 13 includes an example of the application of the explicit weights to the Clinical Quality Management domain scores using mock data. CMS provides the unweighted Clinical Quality Management domain scores in the QRS Proof Sheets.
Exhibit 13. Application of the Explicit Weights to the Clinical Quality Management Domain Scores Name Type of QRS
Component Unweighted
Score Weight Weighted Domain
Score
Clinical Effectiveness Domain 59.7897 * .4167 24.9203 Patient Safety Domain 65.4748 *.1666 10.8950 Prevention Domain 55.4142 * .4167 23.0966
STEP 7: CALCULATE SUMMARY INDICATOR SCORES
CMS calculates summary indicator scores based on averages of domain scores. The steps are as follows:
1. Determine if the summary indicator score can be calculated. To calculate the summary indicator score, CMS uses the half-scale rule to determine if at least half (>50%) of the associated domains have a valid score. If the summary indicator score cannot be calculated, it will not receive a score (i.e., receives an invalid result of CSR-I).
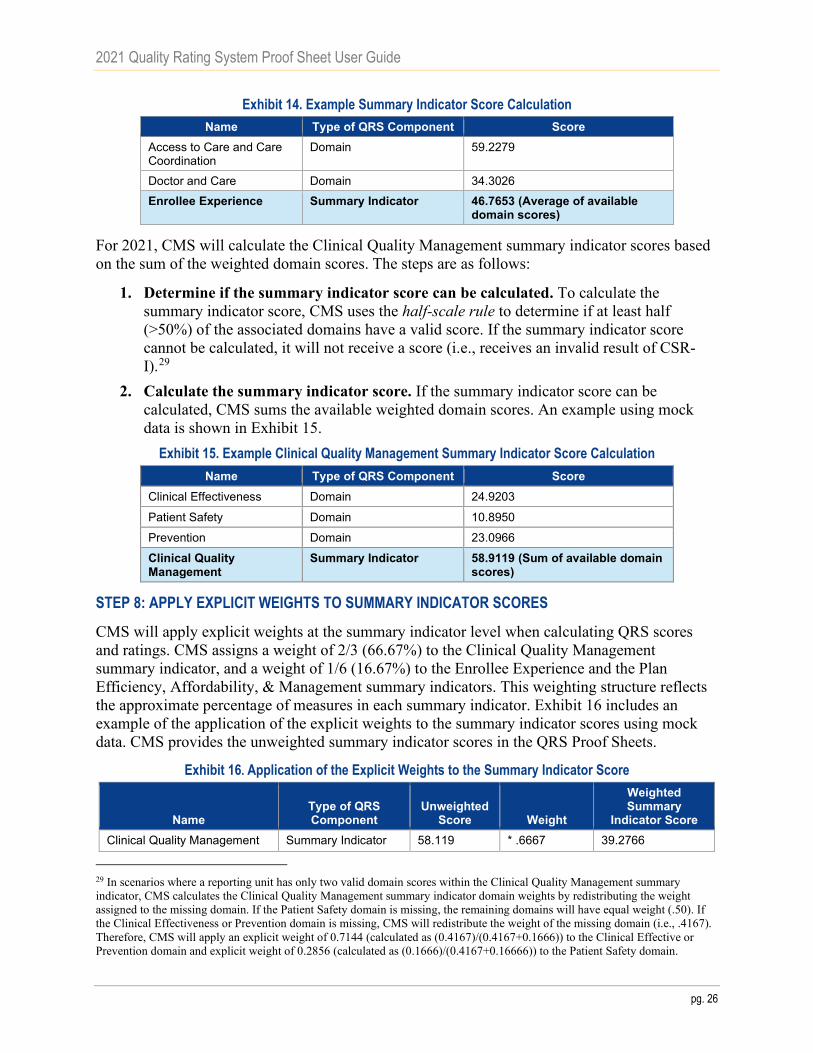
2. Calculate the summary indicator score. If the summary indicator score can be calculated, CMS averages the available domain scores. An example using mock data is shown in Exhibit 14.
27 The Patient Safety composite and domain will include only one measure for scoring in the 2021 ratings year: the Plan All-Cause Readmission (PCR) measure. 28 As a result of the explicit weights used to calculate the Clinical Quality Management summary indicator score, the single PCR measure in the Patient Safety domain will carry the same weight on the global score (11.11%) as it did in the 2019 ratings year.
2021 Quality Rating System Proof Sheet User Guide
pg. 26
Exhibit 14. Example Summary Indicator Score Calculation Name Type of QRS Component Score
Access to Care and Care Coordination
Domain 59.2279
Doctor and Care Domain 34.3026 Enrollee Experience Summary Indicator 46.7653 (Average of available
domain scores)
For 2021, CMS will calculate the Clinical Quality Management summary indicator scores based on the sum of the weighted domain scores. The steps are as follows:
1. Determine if the summary indicator score can be calculated. To calculate the summary indicator score, CMS uses the half-scale rule to determine if at least half (>50%) of the associated domains have a valid score. If the summary indicator score cannot be calculated, it will not receive a score (i.e., receives an invalid result of CSR-I).29
2. Calculate the summary indicator score. If the summary indicator score can be calculated, CMS sums the available weighted domain scores. An example using mock data is shown in Exhibit 15.
Exhibit 15. Example Clinical Quality Management Summary Indicator Score Calculation Name Type of QRS Component Score
Clinical Effectiveness Domain 24.9203
Patient Safety Domain 10.8950
Prevention Domain 23.0966
Clinical Quality Management
Summary Indicator 58.9119 (Sum of available domain scores)
STEP 8: APPLY EXPLICIT WEIGHTS TO SUMMARY INDICATOR SCORES
CMS will apply explicit weights at the summary indicator level when calculating QRS scores and ratings. CMS assigns a weight of 2/3 (66.67%) to the Clinical Quality Management summary indicator, and a weight of 1/6 (16.67%) to the Enrollee Experience and the Plan Efficiency, Affordability, & Management summary indicators. This weighting structure reflects the approximate percentage of measures in each summary indicator. Exhibit 16 includes an example of the application of the explicit weights to the summary indicator scores using mock data. CMS provides the unweighted summary indicator scores in the QRS Proof Sheets.
Exhibit 16. Application of the Explicit Weights to the Summary Indicator Score
Name Type of QRS Component
Unweighted Score Weight
Weighted Summary
Indicator Score Clinical Quality Management Summary Indicator 58.119 * .6667 39.2766
29 In scenarios where a reporting unit has only two valid domain scores within the Clinical Quality Management summary indicator, CMS calculates the Clinical Quality Management summary indicator domain weights by redistributing the weight assigned to the missing domain. If the Patient Safety domain is missing, the remaining domains will have equal weight (.50). If the Clinical Effectiveness or Prevention domain is missing, CMS will redistribute the weight of the missing domain (i.e., .4167). Therefore, CMS will apply an explicit weight of 0.7144 (calculated as (0.4167)/(0.4167+0.1666)) to the Clinical Effective or Prevention domain and explicit weight of 0.2856 (calculated as (0.1666)/(0.4167+0.16666)) to the Patient Safety domain.

2021 Quality Rating System Proof Sheet User Guide
pg. 27
Name Type of QRS Component
Unweighted Score Weight
Weighted Summary
Indicator Score Enrollee Experience Summary Indicator 46.7653 *.16665 7.7934
Plan Efficiency, Affordability, and Management Summary Indicator 57.8032 * .16665 9.6329
STEP 9: CALCULATE GLOBAL SCORE
CMS calculates the global score based on the sum of summary indicator scores. The steps for reporting units with three summary indicator scores are as follows:
1. Determine if the global score can be calculated. CMS calculates the global score for the reporting unit only if the Clinical Quality Management summary indicator has a score and at least one of the other two summary indicators has a score. If the global score cannot be calculated due to inability to pass this scoring rule, then the reporting unit receives the following invalid code: – Not Global (NG): Insufficient data to calculate a global rating.
2. Calculate the global score. If the global score can be calculated according to the scoring rule described above, CMS sums the available weighted summary indicator scores. An example using mock data is shown in Exhibit 17.
Exhibit 17. Example Global Score Calculation Name Type of QRS
Component Example Weighted Summary
Indicator Score Clinical Quality Management Summary Indicator 39.2766 Enrollee Experience Summary Indicator 7.7934 Plan Efficiency, Affordability, and Management Summary Indicator 9.6329 Global Global 56.7029 (Sum of available summary
indicator scores)
For reporting units with two summary indicator scores (i.e., Clinical Quality Management and either Enrollee Experience or Plan Efficiency, Affordability, and Management), CMS applies an 80% weight to the Clinical Quality Management summary indicator score and a 20% weight to the other scored summary indicator.30 CMS then sums the weighted scores to calculate the global score.
STEP 10: CONVERT SCORES TO RATINGS
CMS converts scores to ratings by following these steps:
1. Identify cut point values at the composite and domain level. After calculating scores for composites through the global result, CMS uses cluster analysis of scores to create cut
30 In scenarios where a reporting unit has only two valid summary indicator scores, CMS calculates the summary indicator weights by redistributing the weight assigned to the missing summary indicator (i.e., .1667). Because the total weight of the two available summary indicators does not equal 100 (i.e., ~66.67% + ~ 16.67% = 83.34%), CMS scales up the two valid summary indicators proportional to 83.34%. Thus, the calculation of summary indicator weights in these scenarios is as follows: S1 weight = 0.6667/0.8334 = 0.8000; Other SI weight = 0.1667/0.8334 = 0.2000.
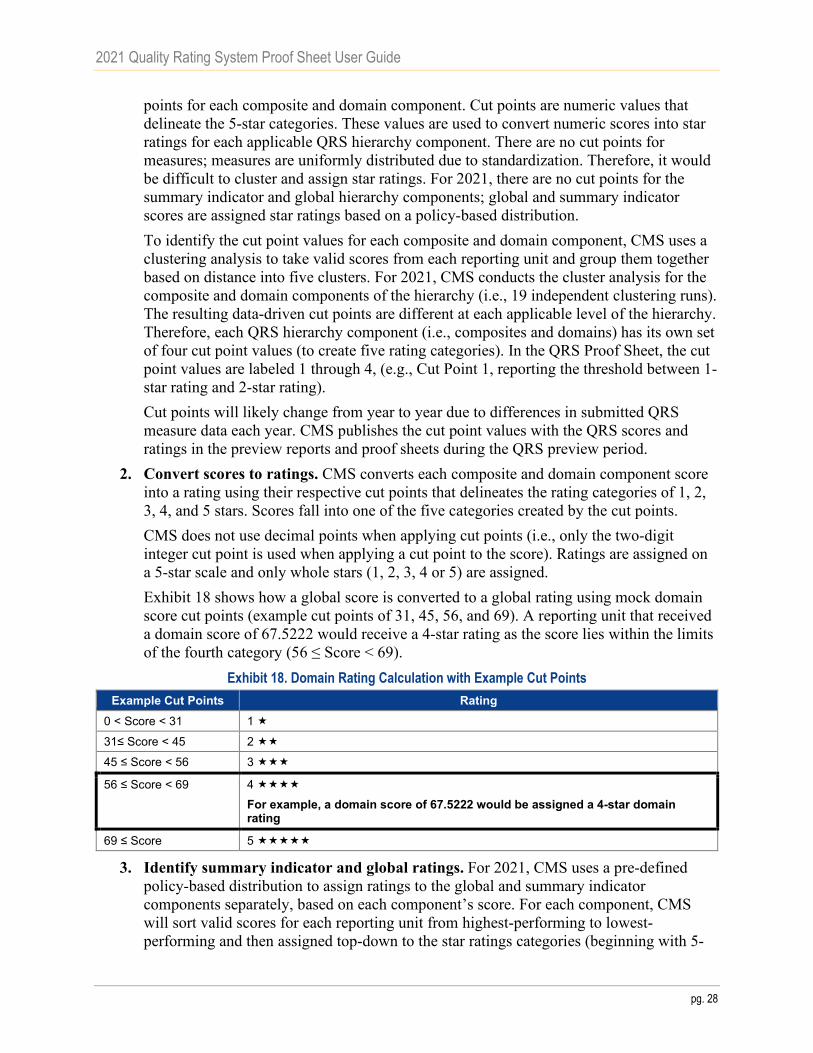
2021 Quality Rating System Proof Sheet User Guide
pg. 28
points for each composite and domain component. Cut points are numeric values that delineate the 5-star categories. These values are used to convert numeric scores into star ratings for each applicable QRS hierarchy component. There are no cut points for measures; measures are uniformly distributed due to standardization. Therefore, it would be difficult to cluster and assign star ratings. For 2021, there are no cut points for the summary indicator and global hierarchy components; global and summary indicator scores are assigned star ratings based on a policy-based distribution. To identify the cut point values for each composite and domain component, CMS uses a clustering analysis to take valid scores from each reporting unit and group them together based on distance into five clusters. For 2021, CMS conducts the cluster analysis for the composite and domain components of the hierarchy (i.e., 19 independent clustering runs). The resulting data-driven cut points are different at each applicable level of the hierarchy. Therefore, each QRS hierarchy component (i.e., composites and domains) has its own set of four cut point values (to create five rating categories). In the QRS Proof Sheet, the cut point values are labeled 1 through 4, (e.g., Cut Point 1, reporting the threshold between 1-star rating and 2-star rating). Cut points will likely change from year to year due to differences in submitted QRS measure data each year. CMS publishes the cut point values with the QRS scores and ratings in the preview reports and proof sheets during the QRS preview period.
2. Convert scores to ratings. CMS converts each composite and domain component score into a rating using their respective cut points that delineates the rating categories of 1, 2, 3, 4, and 5 stars. Scores fall into one of the five categories created by the cut points. CMS does not use decimal points when applying cut points (i.e., only the two-digit integer cut point is used when applying a cut point to the score). Ratings are assigned on a 5-star scale and only whole stars (1, 2, 3, 4 or 5) are assigned. Exhibit 18 shows how a global score is converted to a global rating using mock domain score cut points (example cut points of 31, 45, 56, and 69). A reporting unit that received a domain score of 67.5222 would receive a 4-star rating as the score lies within the limits of the fourth category (56 ≤ Score < 69).
Exhibit 18. Domain Rating Calculation with Example Cut Points Example Cut Points Rating
0 < Score < 31 1
31≤ Score < 45 2
45 ≤ Score < 56 3
56 ≤ Score < 69 4
For example, a domain score of 67.5222 would be assigned a 4-star domain rating
69 ≤ Score 5
3. Identify summary indicator and global ratings. For 2021, CMS uses a pre-defined policy-based distribution to assign ratings to the global and summary indicator components separately, based on each component’s score. For each component, CMS will sort valid scores for each reporting unit from highest-performing to lowest-performing and then assigned top-down to the star ratings categories (beginning with 5-

2021 Quality Rating System Proof Sheet User Guide
pg. 29
stars), until the percentage allocated for that category is reached. For example, at the global level, the top 10% of reporting units with the highest global scores will receive a 5-star global rating. Next, CMS will populate the 4-star rating category with the next highest 31% of reporting units with valid scores have received a 4-star global rating. This continues until CMS assigns all reporting units with valid global scores to a global rating category. This process is repeated for each summary indicator, separately. Exhibit 19 shows the 2021 policy-based distribution, based on the three-year average using 2017–2019 ratings, which CMS will use to determine global and summary indicator star ratings.31
Exhibit 19. 2021 Rating Distribution for Summary Indicator and Global Components
Global Rating Clinical Quality
Management Rating
Enrollee Experience
Rating
Plan Affordability, Efficiency, &
Management Rating Star Rating Percent of Reporting
Units Percent of
Reporting Units Percent of
Reporting Units Percent of
Reporting Units 1-star 1% 4% 7% 1% 2-star 16% 14% 19% 10% 3-star 42% 45% 38% 49% 4-star 31% 33% 28% 28% 5-star 10% 4% 8% 12%
CMS will not assign cut points at the summary indicator and global level for 2021. Because CMS does not use decimal points when applying cut points, the application of cut points could potentially cause large deviations from the policy-based distribution. CMS will not conduct the jackknifing procedure that is typically used to calculate the global cut points.
STEP 11: ADJUST SUMMARY INDICATOR AND GLOBAL RATINGS
After applying the temporary policy-based distribution to the 2021 scores, CMS identifies any reporting units that experienced a reduction of more than one star compared to 2019. CMS adjusts the ratings for impacted reporting units such that no reporting unit’s rating decreases by more than one star. Adjustments applied to the summary indicator and global ratings will have no impact on underlying star rating components (i.e., composites and domains), component scores, or cut points. Exhibit 20 offers an illustrative example of how CMS applies this rule.
Exhibit 20. Reporting Unit Star Rating Decline Limit Example Reporting Unit 2019 Global Rating Original 2021
Global Rating Adjusted 2021 Global Rating
12345-WV-HMO 4 2 3 12345-PA-PPO 3 2 No adjustment
STEP 12. PRODUCE QRS RESULTS FOR PREVIEW AND FINALIZATION
The last step in applying the QRS rating methodology is production of the Ratings Output File (ROF) (for internal CMS use). The ROF contains all the QRS results for all participating reporting units. Using the ROF, CMS produces a QRS Preview Report and QRS Proof Sheet for
31 When assigning ratings to the global and summary indicator components (beginning with the 5-star category), CMS rounds up the number of reporting units assigned to a given star ratings category. Therefore, the star rating distributions may differ slightly from the temporary policy-based distribution provided in Exhibit 18.

2021 Quality Rating System Proof Sheet User Guide
pg. 30
each reporting unit for QHP issuers to preview the results during the QRS preview period and reports for Exchange administrators (e.g., the Center for Consumer Information and Insurance Oversight [CCIIO], State-based Exchange [SBE] administrators, FFE state contacts). Within the HIOS-MQM website, states are only granted access to ratings information for QHP issuers operating within their state, and QHP issuers may only access ratings information for their respective reporting units.
Each October, CMS publishes Public Use Files (PUFs) with quality rating information. CMS releases a Nationwide Quality Rating System PUF that outlines underlying measure data (i.e., measure rates and denominators) as well as star ratings for all eligible reporting units, operating in all Exchange types, which received QRS star ratings for the plan year. CMS also releases the Quality PUF that includes star ratings assigned to plans that will be available on HealthCare.gov for the plan year.

2021 Quality Rating System Proof Sheet User Guide
pg. 31
Appendix A: Resources for Reviewing QHP Enrollee Survey Results
Exhibit 21 provides an overview of different resources through which QHP Enrollee Survey results are communicated to QHP issuers.
Exhibit 21. QHP Issuer Resources for Reviewing QHP Enrollee Survey Results Resource Description
QHP Enrollee Survey Quality Improvement (QI) reports
These reports communicate the full results of the QHP Enrollee Survey, including questions not included as part of the QRS measure set. The raw frequencies for all QHP Enrollee Survey questions are included in the QHP Enrollee Survey QI Reports. CMS intends to release the QHP Enrollee Survey QI Reports concurrently with the QRS preview period via the HIOS-MQM website. The results shown in QHP Enrollee Survey QI Reports are produced after data cleaning and scoring procedures. First, the data used for these reports are cleaned according to standard CAHPS® rules. Second, the scores are weighted and case-mix adjusted using the CAHPS® Analysis Program (CAHPS® macro). Lastly, significance testing is conducted on the scores by comparison with the average from the full national QHP Enrollee Survey. This program, along with instructions for using it, are available at no cost at Instructions for Analyzing Data from CAHPS Surveys. Please reference the QHP Enrollee Survey QI Reports Methodology Guide for additional information about the methodology behind the QHP Enrollee Survey QI Reports.
Qualified Health Plan Enrollee Survey Quality Improvement Reports Methodology Guide
CMS developed this report to provide the methodology for calculating the results of the QHP Enrollee Survey.
QRS survey measures (e.g., via QRS preview)
CMS-calculated results for the QRS include survey measures derived from a subset of questions in the QHP Enrollee Survey. The results in the QHP Enrollee Survey QI Reports differ from those reported for QRS survey measures as additional scoring specifications are used to calculate QRS survey measure results. QRS survey measure results are calculated via additional post-survey processing including case-mix adjustment, removal of invalid responses, and including appropriate respondents in the denominator totals.
Raw results provided by the QHP Enrollee Survey vendors upon data submission
The estimates provided by survey vendors are preliminary and are intended to provide QHP issuers with an early estimate of their survey scores. Survey vendors may not perform the same type of data cleaning performed by CMS. Additionally, survey vendors are unable to implement the identical case-mix adjustment that is performed by CMS because they do not have access to the full national dataset. A survey vendor may analyze the survey data in order to provide QHP issuers with aggregated results and may conduct additional analyses. These survey vendor analyses are not official survey results and should only be used for quality improvement purposes.
Detailed below is additional information regarding differences between QHP Enrollee Survey results communicated via the QHP Enrollee Survey QI Reports and QRS results communicated via the QRS Proof Sheet.
QHP Enrollee Survey Composite versus QRS Survey Measure: Historically, the CAHPS® program has used the term composite to refer to a summary measure that is derived from more than one question, such as Getting Needed Care and Getting Care Quickly. The QHP Enrollee Survey QI Reports use the term composite in the same context as other CAHPS® surveys. However, for the QRS, composite refers to a grouping of measures; that is, it is the first level of summary results in the QRS hierarchy. For example, the Enrollee Experience with Health Plan

2021 Quality Rating System Proof Sheet User Guide
pg. 32
composite in the QRS includes the scores for three QRS measures: Access to Information, Plan Administration, and Rating of Health Plan.
The questions included in QRS survey measures may be different than the questions included in “composites” shown in the QHP Enrollee Survey QI Reports.
Denominator Size Calculation: There is a difference in how CMS calculates and communicates the denominator size in the QHP Enrollee Survey QI Report versus the QRS Proof Sheet. QHP Enrollee Survey QI Reports include raw survey frequencies, meaning that the denominator size reported for measures are equal to the total number of eligible respondents who answered the question. For the QRS, CMS calculates survey measures from survey questions using specific QRS scoring specifications. For the QRS, the total denominator size for QRS survey measures reflects the total number of respondents who have a non-missing value for at least one of the questions within the measure.
For example, the QRS measure Care Coordination is identical to the QHP Enrollee Survey QI Report composite Care Coordination. With 75 responses, the result for the Care Coordination composite would appear on the QI Reports; however, a Care Coordinate measure score would not appear in the QRS Proof Sheet as CMS did not calculate the score due to an insufficient denominator size (<100).
These differences stem from the different goals of the two reports. The QRS Proof Sheet is designed to communicate results for public reporting and, therefore, has distinct requirements associated with whether a measure can be reported; by comparison, the QHP Enrollee Survey QI Reports are currently designed as a tool to be used for quality improvements undertaken by the QHP issuer.
Communicating Relative Performance: QRS measure data are standardized across all reporting units. Therefore, if a majority of reporting units submit very high measure rates (raw values), a single reporting unit may submit a high rate for a given measure, but may still receive a low standardized score for the measure because many other reporting units performed even better.
The QHP Enrollee Survey QI Reports use a different approach to convey relative performance. This approach is based on a pair-wise t-test with an alpha of 0.05. Additional information can be found in the CAHPS® macro materials in Instructions for Analyzing Data from CAHPS® Surveys.
Due to these different approaches, there are instances when a reporting unit could score average or above average on QHP Enrollee Survey items in the QI Reports and receive one- or two-star ratings for certain QRS components. Similarly, there may be instances when a reporting unit receives three or four stars for certain QRS components, but scores below average on QHP Enrollee Survey items.

2021 Quality Rating System Proof Sheet User Guide
pg. 33
Appendix B: Key to Invalid Codes in the 2021 QRS Proof Sheet Exhibit 22. Key to Invalid Codes in the 2021 QRS Proof Sheet
Code QRS Measures – Codes for Non-numeric Results M-NS Measure Not Scored: Measure data not included in QRS scoring this year for all reporting units.
Grey highlight to emphasize not included in scoring. Used in Standardized Score field. NC Not Calculated: Measure data not included in QRS scoring as the QHP issuer either received an
invalid code for the measure (i.e., BR, NB, or NR) or the QHP issuer followed the measure specifications but the denominator was too small to report a valid rate. Used in Standardized Score field.
BR Biased Rate: The QHP issuer’s calculated rate was materially biased. Used in Raw Value field. NB Benefit Not Offered: The QHP issuer did not offer the health benefit required by the measure. Used
in Raw Value field. NR Not Reported: TNot Reported: The QHP issuer chose not to report the measure or the measure rate
was otherwise invalid (i.e., there is no valid rate because the denominator is zero). Used in Raw Value field. - Null value used for: • Denominator field for measures that have an invalid rate (i.e., BR, NB, or NR).In the CSV version of the QRS Proof Sheet, this dash appears as a blank.
Code QRS Hierarchy Components – Codes for Non-numeric Component Score or Rating (CSR) CSR-I Insufficient data to calculate a score or rating according to the QRS rating methodology. CSR-NS Measure data for this component not included in QRS scoring this year for all reporting units. Grey
highlight to emphasize not included in scoring. NG No Global: Insufficient data to calculate a global rating. This code applies to the global rating only. Code QRS Cut Points – Codes for Non-numeric Cut Points CSR-NS Cut points for this component were not calculated this year. For 2021, CMS will use this code for the
global and summary indicator cut points fields.

2021 Quality Rating System Proof Sheet User Guide
pg. 34
Appendix C: Additional Details on the Contents of the 2021 QRS Proof Sheet
QRS Hierarchy Components: The QRS hierarchy is the organization of measures into composites, domains, and summary indicators and, ultimately, into a single global rating. The QRS Proof Sheet includes codes to indicate the level of the QRS hierarchy, as shown in Exhibit 23.
Exhibit 23. QRS Hierarchy Component Codes Code Full Name
B-Sub-MI Below Sub-Measure Indicator Sub-MI Sub-Measure Indicator (age stratifications) MI Measure Indicator M Measure C Composite D Domain SI Summary Indicator Global Global
Benchmarks: In the QRS Proof Sheet, CMS includes the benchmarks: 5th, 10th, 25th, 50th, 75th, 90th, and 95th percentiles, the mean, standard deviation, minimum, and maximum of the rates (raw values) across all reporting units (i.e., national reference group). To create these benchmarks, CMS uses only valid measure rates that have met the minimum denominator criteria and are scoring eligible. The mean measure rate and standardized deviation are used to transform all raw measure rates using z-score standardization.
Rescaling: CMS rescales some measures when the Ratings Output File (ROF) is created so that measure rates (raw values) are reported on a uniform scale of 0-1.32 This avoids confusion when the measure rates are shown alongside standardized measures scores which range from 0-100. Specifically, CMS divides the CAHPS®-based QRS survey measure rates (that are on a 0-100 scale) by 100 to match the magnitude of other measures. Therefore, a measure rate of 44.11 may be shown in the QRS Proof Sheet as 0.4411. CMS rescales measure rates after scoring. Therefore, it has no impact on a measure’s score nor standardization; it is an aesthetic change to ease interpretation of the results.
Decimal places and rounding: All QRS measure rates are reported at seven decimal places (rounded) upon data submission to CMS’ HIOS-MQM website. No rounding occurs throughout the scoring process starting from and including the standardization procedure; rounding occurs during the clustering procedure to calculate cut points, though this rounding does not impact score calculation.33 In communicating QRS results, CMS uses the approach to decimal places and rounding as described in Exhibit 24.
32 CMS does not rescale the Plan All Cause Readmission measure as the ratio for this measure can be greater than 1. 33 Due to system inconsistency between UNIX and Windows and 32-bit/64-bit systems, in order to guarantee consistent clustering results, the component scores are rounded to 15 decimal places before clustering.

2021 Quality Rating System Proof Sheet User Guide
pg. 35
Exhibit 24. Approach to Decimal Places and Rounding in Communicating QRS Results QRS Document Type of QRS Result Decimal Places and Rounding QRS Proof Sheet (PDF)
Rates/raw values and scores Three decimal places, rounded. Cut points Two-digit integer.
QRS Proof Sheet (CSV file)
Rates/raw values and scores All possible decimal places shared. There is a maximum length of 20 characters that can be displayed.
Cut points Two-digit integer. Benchmarks Seven decimal places as that is the highest level of
precision possible given the received data.

2021 Quality Rating System Proof Sheet User Guide
pg. 36
Appendix D: Crosswalk of 2021 QHP Enrollee Survey Questions Included in the QRS
Exhibit 25. Crosswalk of 2021 QHP Enrollee Survey Questions Included in the QRS 2021 QRS
Survey Measure
2021 QHP Enrollee Survey
Composite Question Number Question Wording
Question Source
Access to Care
Getting Care Quickly
22 In the last 6 months, when you needed care right away, in an emergency room, doctor’s office, or clinic, how often did you get care as soon as you needed? Include in-person, telephone, or video appointments.
CAHPS® Health Plan 5.0
23 In the last 6 months, how often did you get an appointment for a check-up or routine care at a doctor’s office or clinic as soon as you needed?Include in-person, telephone, or video appointments.
CAHPS® Health Plan 5.0
Getting Needed Care
25 In the last 6 months, how often was it easy to get the care, tests, or treatment you needed? Include in-person, telephone, or video appointments.
CAHPS® Health Plan 5.0
41 In the last 6 months, how often did you get an appointment to see a specialist as soon as you needed? Include in-person, telephone, or videoappointments.
CAHPS® Health Plan 5.0
Access to Information
Access to Information34
3 In the last 6 months, how often did the written materials or the Internet provide the information you needed about how your health plan works?
CAHPS® Health Plan 4.0 —Supplemental Items (HEDIS®)
4 In the last 6 months, how often were you able to find out from your health plan how much you would have to pay for a health care service or equipment before you got it?
CAHPS® Health Plan 4.0 —Supplemental Items (HEDIS®)
5 In the last 6 months, how often were you able to find out from your health plan how much you would have to pay for specific prescription medicines?
CAHPS® Health Plan 4.0 —Supplemental Items (HEDIS®)
Care Coordination
Care Coordination
33 When you visited your personal doctor for a scheduled appointment in the last 6 months, how often did he or she have your medical records or other information about your care? Include in-person, telephone, or video appointments.
CAHPS® Health Plan 5.0 —Supplemental Items
34 In the last 6 months, when your personal doctor ordered a blood test, x-ray, or other test for you,how often did someone from your personal doctor’s office follow up to give you those results?
CAHPS® Health Plan 5.0 —Supplemental Items
35 In the last 6 months, when your personal doctorordered a blood test, x-ray, or other test for you,how often did you get those results as soon as you needed them?
CAHPS® Health Plan 5.0 —Supplemental Items
34 These items come from the National Committee for Quality Assurance (NCQA) HEDIS® CAHPS® Survey.

2021 Quality Rating System Proof Sheet User Guide
pg. 37
2021 QRS Survey
Measure
2021 QHP Enrollee Survey
Composite Question Number Question Wording
Question Source
Care Coordination (continued)
Care Coordination (continued)
43 In the last 6 months, how often did your personal doctor seem informed and up-to-date about the care you got from specialists?
CAHPS® Health Plan 5.0 —Supplemental Items
36 In the last 6 months, how often did you and your personal doctor talk about all the prescription medicines you were taking?
CAHPS® Health Plan 5.0 —Supplemental Items
39 In the last 6 months, how often did you get the help that you needed from your personal doctor’s office to manage your care among these different providers and services?
CAHPS® Health Plan 5.0 —Supplemental Items
Plan Administration
Plan Administration
6 In the last 6 months, how often did your health plan’s customer service give you the information or help you needed?
CAHPS® Health Plan 5.0
7 In the last 6 months, how often did your health plan’s customer service staff treat you with courtesy and respect?
CAHPS® Health Plan 5.0
Single Item Measure (Plan Administration)
8 In the last 6 months, how often did the time that you waited to talk to your health plan’s customer service staff take longer than you expected?
New Question developed for QHP Enrollee Survey
9 In the last 6 months, how often were the forms from your health plan easy to fill out?
CAHPS® Health Plan 5.0
10 In the last 6 months, how often did the health plan explain the purpose of a form before you filled it out?
CAHPS® Health Plan 5.0—Supplemental Items
Rating of all Health Care
Single Item Measure
27 Using any number from 0 to 10, where 0 is the worst health care possible and 10 is the best health care possible, what number would you use to rate all your health care in the last 6 months? Include in-person, telephone, or video appointments.
CAHPS® Health Plan 5.0
Rating of Health Plan
Single Item Measure
20 Using any number from 0 to 10, where 0 is the worst health plan possible and 10 is the best health plan possible, what number would you use to rate your health plan in the last 6 months?
CAHPS® Health Plan 5.0
Rating of Personal Doctor
Single Item Measure
40 Using any number from 0 to 10, where 0 is the worst personal doctor possible and 10 is the best personal doctor possible, what number would you use to rate your personal doctor?
CAHPS® Health Plan 5.0
Rating of Specialist
Single Item Measure
44 We want to know your rating of the specialist you saw most often in the last 6 months. Using any number from 0 to 10, where 0 is the worst specialist possible and 10 is the best specialist possible, what number would you use to rate the specialist?
CAHPS® Health Plan 5.0
Flu Vaccinations for Adults Ages 18–64
Single Item Measure (Preventive Services)
47 Have you had either a flu shot or flu spray in the nose since July 1, 2020?
CAHPS® 5.0H35 Survey
35 National Committee for Quality Assurance (NCQA) HEDIS® CAHPS® Survey.

2021 Quality Rating System Proof Sheet User Guide
pg. 38
2021 QRS Survey
Measure
2021 QHP Enrollee Survey
Composite Question Number Question Wording
Question Source
Medical Assistance with Smoking and Tobacco Use Cessation
Single Item Measure (Preventive Services)
49 In the last 6 months, how often were you advised to quit smoking or using tobacco by a doctor or other health provider in your plan?
CAHPS® 5.0H Survey
50 In the last 6 months, how often was medication recommended or discussed by a doctor or health provider to assist you with quitting smoking or using tobacco? Examples of medication are: nicotine gum, patch, nasal spray, inhaler, or prescription medication.
CAHPS® 5.0H Survey
51 In the last 6 months, how often did your doctor or health provider discuss or provide methods and strategies other than medication to assist you with quitting smoking or using tobacco? Examples of methods and strategies are: telephone helpline, individual or group counseling, or cessation program.
CAHPS® 5.0H Survey