2021 Q3 GSF quarterly report
59
Transcript of 2021 Q3 GSF quarterly report


Contents
PART 01 Group highlights page 3
Highlights CEO comment page 4
Regional highlights page 5
Key figures page 6
Our scoreboard page 8
Guiding and expectations page 9
Our approach to sustainable business page 10
PART 02 Group financial review page 13
Progress Sales and market development page 16
Rogaland page 19
Finnmark page 23
British Columbia page 27
Newfoundland page 32
Board's approval page 34
PART 03 Financial statements page 36
Results Selected notes page 41
Appendix page 58
Grieg Seafood Q3 report 2021 2

PART 01
HIGHLIGHTSWe are on a journey of sustainable growth. We are dedicated to improve our operational performance, fish welfare and survival, reduce our impact and increase profitability. Change will never stop, and we pursue improvement wherever we see it. It drives our commitment and lets us capture new opportunities. This is
how we farm the ocean for a better future.
Group highlights
• EBIT before production fee and fair value adjustment of NOK 149 million (-14 million), with
EBIT/kg of NOK 7.3 (-1.0) driven by high prices in BC and declining cost level
• Good performance in Shetland, EBITDA of NOK 53 million (held for sale). UK competition
authorities expected to decide on Shetland transaction by 15 December 2021
• Underlying operational improvement, with increased survival in all regions. Expect lower
costs towards year end
• Value added processing capacity for part of our volume secured in Norway
• One site ASC certified, total of 30 sites or 56% of net production certified
• Expect harvest ex Shetland of 25 100 tonnes in Q4 2021, 77 000 tonnes for the full year 2021
and 90 000 for 2022
Grieg Seafood Q3 report 2021 3

CEO commentThanks to the hard work of my colleagues across the company, Grieg Seafood has delivered one of our best third quarters ever.
Biology has continued to improve and stabilize, with increased survival across the regions compared to last year. The
market was surprisingly strong, considering the large volumes harvested in the industry during the quarter, which would
normally cause lower prices. We are experiencing the advantage of an in-house sales and market organization, which sold
all of our fish for the second quarter in a row, and their work on integration between sales and production to optimize
price performance. Moreover, we have secured value-added processing capacity for part of our volume in Norway as a
step towards repositioning the company in the market.
Operationally, British Columbia was again a highlight during the quarter, with stable production and high average harvest
weights. We continued the positive trend of reduced impact by harmful algae blooms. We experienced the full advantage
of the region’s close proximity to a strong US market, where we achieved high prices.
Finnmark performed well, with good production, good fish health and welfare, and few biological challenges. September
marked the best production month the region has ever seen. Finnmark has taken measures to reduce the risk of winter
ulcers during the coming winter, such as avoiding two winters at sea in the farming areas with the coldest temperatures.
Access to value-added processing capacity will also contribute to better price achievement should there be downgrades.
Rogaland’s performance was impacted by downgrades caused by PD, affecting both cost and price achievement. We
experience, however, that fish groups harvested after a shorter time spent at sea, have reduced risk of PD and need fewer
sea lice treatments, strengthening our confidence in our post-smolt strategy. Due to preventative measures, the region
needed few sea lice treatments, continuing the positive trend from earlier years. Biology in the region stabilized towards
the end of the quarter.
The fish in our Newfoundland freshwater facility is growing well and according to schedule. Shetland continued to deliver
a profit, as the region has done since the turn-around. The sale is expected to be approved by UK authorities during the
fourth quarter. It will allow us to concentrate focus, resources and investments to our production regions with the most
potential for profitable growth – Norway and Canada.
Grieg Seafood’s focus on sustainability remains. Reducing our footprint and improving fish welfare is key to long-term
profitability, growth, attractiveness to our customers and license to operate. As a part of our work, Grieg Seafood has
joined the Taskforce on Nature-related Financial Disclosures (TNFD) as a Taskforce Member, to build a global risk
management and financial disclosure framework on nature-related risks.
With a strong outlook for both our farming operations and markets, we are optimistic for the time ahead, especially as the
covid-19 pandemic continues to loosen it’s grip.
ANDREAS KVAMECEO Grieg Seafood ASA
Grieg Seafood Q3 report 2021 4
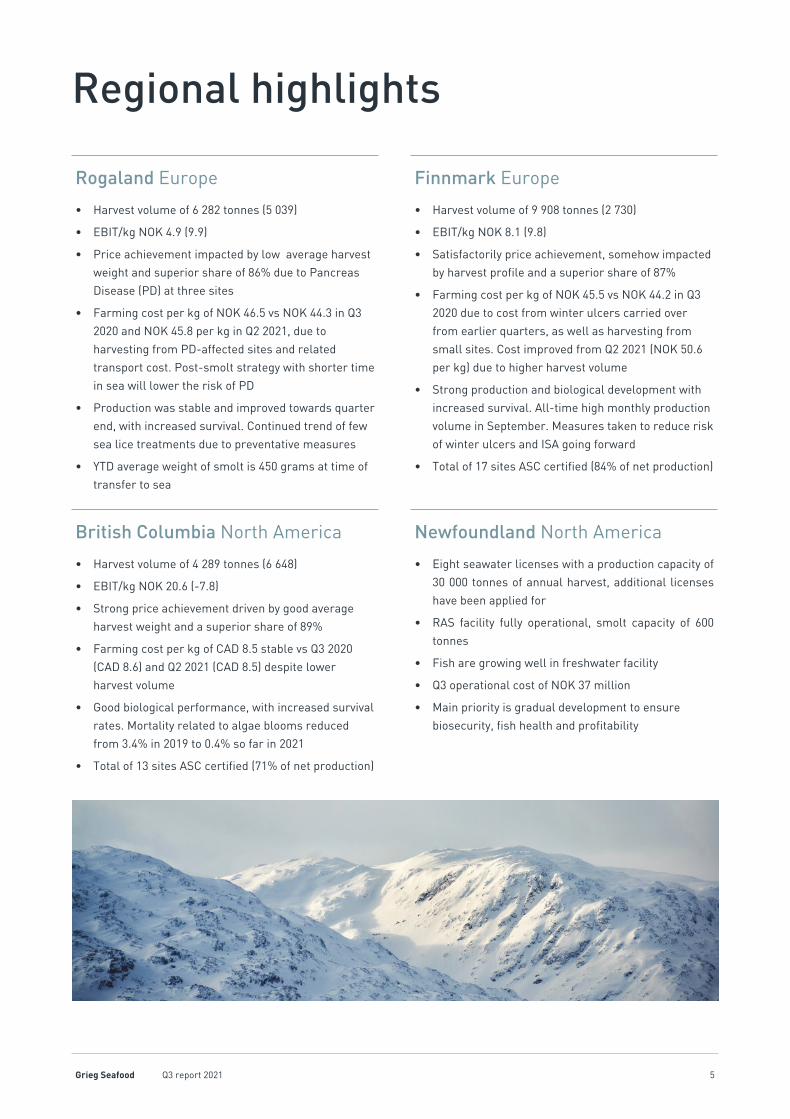
Regional highlights
Rogaland Europe Finnmark Europe
• Harvest volume of 6 282 tonnes (5 039)
• EBIT/kg NOK 4.9 (9.9)
• Price achievement impacted by low average harvest
weight and superior share of 86% due to Pancreas
Disease (PD) at three sites
• Farming cost per kg of NOK 46.5 vs NOK 44.3 in Q3
2020 and NOK 45.8 per kg in Q2 2021, due to
harvesting from PD-affected sites and related
transport cost. Post-smolt strategy with shorter time
in sea will lower the risk of PD
• Production was stable and improved towards quarter
end, with increased survival. Continued trend of few
sea lice treatments due to preventative measures
• YTD average weight of smolt is 450 grams at time of
transfer to sea
• Harvest volume of 9 908 tonnes (2 730)
• EBIT/kg NOK 8.1 (9.8)
• Satisfactorily price achievement, somehow impacted
by harvest profile and a superior share of 87%
• Farming cost per kg of NOK 45.5 vs NOK 44.2 in Q3
2020 due to cost from winter ulcers carried over
from earlier quarters, as well as harvesting from
small sites. Cost improved from Q2 2021 (NOK 50.6
per kg) due to higher harvest volume
• Strong production and biological development with
increased survival. All-time high monthly production
volume in September. Measures taken to reduce risk
of winter ulcers and ISA going forward
• Total of 17 sites ASC certified (84% of net production)
British Columbia North America Newfoundland North America
• Harvest volume of 4 289 tonnes (6 648)
• EBIT/kg NOK 20.6 (-7.8)
• Strong price achievement driven by good average
harvest weight and a superior share of 89%
• Farming cost per kg of CAD 8.5 stable vs Q3 2020
(CAD 8.6) and Q2 2021 (CAD 8.5) despite lower
harvest volume
• Good biological performance, with increased survival
rates. Mortality related to algae blooms reduced
from 3.4% in 2019 to 0.4% so far in 2021
• Total of 13 sites ASC certified (71% of net production)
• Eight seawater licenses with a production capacity of
30 000 tonnes of annual harvest, additional licenses
have been applied for
• RAS facility fully operational, smolt capacity of 600
tonnes
• Fish are growing well in freshwater facility
• Q3 operational cost of NOK 37 million
• Main priority is gradual development to ensure
biosecurity, fish health and profitability
Grieg Seafood Q3 report 2021 5

Key figures (from continuing operations)
Continuing operations
As at 30 September 2021, the Group presents the farming and sales operations of Grieg Seafood Shetland as discontinued
operations (classification made in Q4 2020). In addition, in 2020 the former sales organization Ocean Quality was also
treated as discontinued operations. Unless otherwise explicitly mentioned, qualitative and quantitative information
disclosed in this report refer to the continued operations of Grieg Seafood. See also Note 4.
KEY FIGURES NOK MILLION Q3 2021 Q3 2020 YTD 2021 YTD 2020
Operational
Harvest volume (tonnes GWT) 20 479 14 416 51 874 50 872
Sales revenue/kg (NOK) 58.4 52.9 54.9 54.5
Group farming cost/kg (NOK) 48.7 51.2 48.5 47.5
Other costs incl. ownership and headquarter costs/kg (NOK) 2.4 2.7 3.0 2.1
EBIT/kg (NOK) 7.3 -1.0 3.4 4.9
Financial
Sales revenues 1 303 914 3 085 3 242
EBITDA before production fee and fair value adj. of biological assets 251 74 464 523
EBIT before production fee and fair value adj. of biological assets 149 -14 177 249
Profit before tax 209 -57 490 -406
Cash flow from operations 238 142 251 540
Capital structure
Net interest-bearing liabilities according to covenant requirement 4 053 3 016 4 053 3 016
NIBD/EBITDA(1) n/a 4.2 n/a 4.2
NIBD/harvest volume (NOK) (2) 27.5 34.7 27.5 34.7
Equity % 41% 42% 41% 42%
Equity % according to covenant 43% 45% 43% 45%
Gross investments incl. Shetland (3) 136 335 462 738
Profitability
ROCE (4) 7 % -1 % 3 % 5 %
Dividend per share (NOK) 0.0 0.0 0.0 0.0
Earnings per share, continued operations (NOK) 1.3 -0.4 3.1 -2.9
Total market value (OSE) 9 303 9 688 9 303 9 688
1) NIBD/EBITDA not measured through Q3 2021. See Note 6.
2) NIBD/harvest Q3 2021/YTD 2021: NIBD according to covenant less Shetland-transaction's enterprise value of GBP 164 million translated to NOK at 30
September 2021, divided by guided harvest volume for FY 2021 ex. Shetland.
3) Incl. financial lease (according to IFRS in force prior to 1 January 2019) investments. For FY 2020, the figure is ex. cash consideration of NOK 620 million
for Grieg Newfoundland, acquired in Q2 2020.
4) ROCE: Return on capital employed. See Alternative Performance Measures for definition.
Grieg Seafood Q3 report 2021 6

HARVEST VOLUME Q3 2021
SALES REVENUESQ3 2021
Rogaland 31%
Finnmark 48%
BC 21%Rogaland 27%
Finnmark 44%
BC 29%
_____________________________________________________________________________
EBIT BEFORE PRODUCTION FEE AND FAIR VALUE
(NOK MILLION)
HARVEST VOLUME INCL. SHETLAND(TONNES GWT)
EBIT/KG PER REGION(NOK)
-14 -16 -16
44
149
Q3 20 Q4 20 Q1 21 Q2 21 Q3 21
21 20123 374
16 752
21 81924 508
Group ex ShetlandShetland
Q3 20 Q4 20 Q1 21 Q2 21 Q3 21
_____________________________________________________________________________
HARVEST VOLUME & FARMING COST/KG (NOK)
ROGALAND*TARGET: NOK 40/kg
HARVEST VOLUME & FARMING COST/KG (NOK)
FINNMARK*TARGET: NOK 40/kg
HARVEST VOLUME & FARMING COST/KG (CAD)
BRITISH COLUMBIA*TARGET: CAD 7/kg
*Guided harvest volume for Q4 2021. Dotted cost line indicate direction of farming cost per kg.
Grieg Seafood Q3 report 2021 7

Our scoreboardl Within target t On track to meet target n Unsatisfactory result
PROFIT & INNOVATION
Return on capital employed 1) 12% p.a. t 7% 2% -1% -1% -1%
Harvest volume (tonnes GWT) 90 000 tonnes in 2022 t 20 479 17 812 13 583 20 271 14 416
Farming cost per kg
Rogaland NOK 40/kg in 2022 n 46.5 45.8 41.9 42.7 44.3
Finnmark NOK 40/kg in 2022 t 45.5 50.6 46.5 43.8 44.2
British Columbia CAD 7/kg in 2022 n 8.5 8.5 8.8 8.9 8.6
HEALTHY OCEAN
ASC certifications 2) All sites by 2023 t 30 29 27 26 26
Survival rate sea (GSI standard) 93% by 2022
Rogaland t 91% 91% 91% 90% 90%
Finnmark l 95% 94% 93% 92% 92%
British Columbia t 91% 91% 90% 90% 88%
Antibiotics g/tonne 3) No use of antibiotics
Rogaland l 0.0 0.0 0.0 0.0 0.0
Finnmark l 0.0 0.0 49.0 0.0 0.0
British Columbia t 2.0 41.3 92.7 47.6 2.3
Sea lice treatmentsg/tonne 3/4)
Minimize use of pharmaceutical treatments
Rogaland l 0.0 0.4 2.8 0.0 0.0
Finnmark l 0.4 0.0 2.5 1.5 0.0
British Columbia l 0.9 0.0 0.4 0.0 0.0
Escape incidents(# of fish) Zero escape incidents l 0 1 (1) 1 (6) 0 0
SUSTAINABLE FOOD
High quality product 93% superior share
Rogaland t 86% 76% 75% 83% 90%
Finnmark t 87% 78% 65% 77% 90%
British Columbia t 89% 89% 90% 78% 85%
PEOPLE Absence rate Below 4.5%
Rogaland l 3.5% 3.0% 1.8% 2.5% 2.7%
Finnmark n 7.8% 7.9% 8.1% 5.6% 6.4%
British Columbia t 5.1% 5.5% 6.2% 5.9% 7.3%
LOCAL COMMUNITIES
Support our local communities
Collaborate and contribute to local community
l Yes Yes Yes Yes Yes
ASPECT TARGET STATUS Q3 2021 Q2 2021 Q1 2021 Q4 2020 Q3 2020
1) ROCE is calculated using EBIT before fair value of biological assets (incl. production fee). See Alternative Performance Measures for definition.
2) Number of sites certified. Target: 100% ASC compliant within 2023.
3) Amount of active pharmaceutical ingredients (APIs) used (g) per tonne of fish produced (LWE).
4) Excl. hydrogen peroxide. For data on hydrogen peroxide, see the regions' Sustainability KPIs.
Grieg Seafood Q3 report 2021 8

Guiding and expectationsFarming operations
Rogaland Europe Finnmark Europe
• Good biological production so far in Q4
• Expect harvest of 7 100 tonnes in Q4 2021, with a
peak in November, with slightly lower cost per kg as
we harvest from a new generation
• Q4 harvest volume reduced by ~1 500 tonnes mainly
due to PD outbreak
• Cost improvement ambition remains, increased risk
due to feed raw material inflation
• Strong biological production so far in Q4
• Expect harvest of 13 400 tonnes in Q4 2021, evenly
distributed through the quarter, with lower cost per kg
as we harvest from sites with good biological
performance
• Q4 harvest volume reduced by ~1 500 tonnes due to
optimization of capacity utilization and skewing of
volume to 2022
• Cost improvement ambition remains, increased risk due
to feed raw material inflation
British Columbia North America Newfoundland North America
• Good biological situation so far in Q4
• Expect harvest of 4 600 tonnes in Q4 2021 with the
largest portion of the volume in October, with some
higher cost due to harvest from smaller sites
• Cost improvements longer term as a result of
improved survival rates and increased volume,
increased risk due to feed raw material inflation
• Good biological conditions at the freshwater facility
• Reduced operational cost in Q4
• Focus going forward is preparation of seawater
operations
• Three million smolt to be released during the spring
and summer of 2022, with harvesting in 2023 and 2024
Our harvest target for 2021 is 77 000 tonnes (ex Shetland).
HARVEST (TONNES GWT) ROGALAND FINNMARK BRITISH COLUMBIA GROUP TOTAL
Q1 2021 5 350 7 380 850 13 600
Q2 2021 7 780 4 780 5 250 17 800
Q3 2021 6 280 9 910 4 290 20 500
Q4 2021 7 100 13 400 4 600 25 100
Total 2021 26 500 35 500 15 000 77 000
Total 2022 30 000 38 000 22 000 90 000
Sales & Market
We expect good market prices as a result of the tight global supply in combination with the outlook for retail demand
remaining high, supported by HoReCa market fully opening up. Current Fishpool forward price for Q4 2021 is close to NOK
61 per kg. Our estimated contract share in Norway for Q4 is 20%, or 29% for 2021.
Capex
Remaining capex estimated at approx. NOK 220 million in Q4, totaling close to NOK 680 million in 2021.
Grieg Seafood Q3 report 2021 9

Our approach to sustainable businessIn our long-term perspective, there is no contradiction between clean seas, healthy fish and financial profit. It is our task to make these aspects go hand in hand, and contribute to a sustainable ocean economy.
Grieg Seafood's business is based on five pillars, covering environmental, social and governance (ESG) topics identified as
important to our stakeholders. Our materiality assessment forms the foundation of our pillars. The pillars help us steer
towards long-term value creation for investors, customers, employees and local communities. Find an overview of our
pillars, targets and Group policies here.
Sustainability is core to the industry and strongly impacts our financial performance. Our sustainability drivers must
perform well if we are to reach our financial targets.
SUSTAINABILITY DRIVERS
• Sea lice control and minimal
sea lice medication
• Escape control
• Survival and disease control
• Wildlife management
• Carbon emissions
• HSE, diversity and work
satisfaction
• Certifications
• Local value creation
→
SUCCESS FACTORS
• License to operate
• Higher volume
• Superior quality
• Reduced cost
• Engaged employees
• Preferred by customers and
consumers
→
FINANCIAL TARGETS
• ROCE: 12%
• Harvest: 90 000 tonnes in
2022, 130 000 tonnes in 2025
ex Shetland
• Farming cost: NOK 40/kg
and CAD 7/kg in 2022
• NIBD/EBITDA: < 4.5 (bank
covenant)*
• Dividend: 30-40% of net
profit
*Not applicable through Q3 2021 due to
temporary amended covenant
THE UNITED NATIONS SUSTAINABLE DEVELOPMENT GOALS
The UN Sustainable Development Goals
guide us towards a more sustainable food
system. They highlight opportunities to
grasp and challenges to solve - both in our
farming operations and in our value chain.
Read how Grieg Seafood align with the
various SDGs here.
TOMORROW’S SUSTAINABLE GLOBAL FOOD SYSTEM
• Healthy and nutritious food for 9 billion people
• Nature and biodiversity protected
• Low carbon and low climate risk
• Good animal welfare
• A circular economy with resources recycled
• Social and economic justice for producers in
supply chains
Aquaculture and farmed salmon can play an
important role in the future food system - if we do
it responsibly and right. Read more here.
Grieg Seafood Q3 report 2021 10

Status towards 2025We aim to expand globally through growth and value chain innovation. Our 2025 strategy comprises three key strategic objectives for continued business development. Increasingly sustainable farming practices form the very foundation of all areas of the strategy.
Global growth Cost improvement Value chain repositioning
Harvest volume of 130 000
tonnes by 2025
Improve competitiveness in
each region
Evolve from supplier to
innovation partner
SUSTAINABILITY
Global growth, market repositioning and cost leadership are the key areas of business development towards 2025.
Sustainability is the foundation of all areas of the strategy. Read more about our 2025 business strategy here.
OPERATIONAL FOCUS AREASTo achieve sustainable growth and improve competitiveness, we focus on reducing the time fish spend at sea
(post-smolt), improving fish welfare and providing data-driven decision support (Precision Farming) to our
operations. Together, the focus areas strengthen our ocean farming. Read more about our operational focus
areas here.
Less time at sea(post-smolt)
Prevention and fish welfare
Precision Farming - data driven decision support
Grieg Seafood Q3 report 2021 11

PART 02
PROGRESSWithout a profitable business, we will not be able to farm healthy
salmon for people to eat all over the world. To achieve good financial results, our farming methods need to be both cost
effective and sustainable.
Grieg Seafood Q3 report 2021 12

Group financial reviewImproving sustainability is key to increasing our profits. By focusing on reducing our environmental impact and improving fish welfare, we aim to increase harvest rates and reduce production cost. We aim to provide our shareholders with a competitive return on capital invested, with a ROCE target of 12%.
Continuing operations
Grieg Seafood's financial figures are separated as our continuing operations and discontinued operations. Unless
otherwise explicitly mentioned, all qualitative and quantitative information disclosed in this Quarterly Report refer to the
continuing operations of Grieg Seafood. Our continued operations are the Group's operations exclusive of the Shetland
disposal group. Please refer to Note 4 of this report, and our Annual Report for 2020.
ProfitFigures for Q3 2020 in brackets
The Group harvested 20 479 tonnes ex. Shetland in Q3 2021 (14 416 tonnes), contributing to a sales revenue of NOK 1 303
million (NOK 914 million) for the quarter, realizing an average price achievement of NOK 58.4 per kg (NOK 52.9 per kg), up
NOK 1.4 per kg from Q2 2021. By comparison, the average spot salmon price (NQSALMON weekly average less distributor
margin) for Q3 2021 was NOK 54.5 per kg, up by NOK 7.4 per kg compared to Q3 2020, and down by NOK 7.6 per kg
compared to Q2 2021. The difference in achieved price, measured by sales revenue/kg compared to Q3 2020, had a
positive contribution to our EBIT by NOK 113 million. The Group's price achievement for Q3 2021 was positively impacted
by strong market conditions for BC, with a realized price achievement of NOK 79.6 per kg, up NOK 28.2 per kg from Q3
2020 and up NOK 13.2 per kg from Q2 2021. Our Norwegian regions performed below NQSALMON-average mainly due
downgraded volume, partly offset by positive contributions from fixed price contracts.
The higher harvest volume for the quarter impacted our EBIT by NOK 10 million compared to Q3 2020, while decreases in
operational costs impacted our EBIT before production fee and fair value adjustment of biological assets positively by
NOK 51 million compared to Q3 2020. On average, the Group's farming costs decreased by NOK 2.5 per kg from NOK 51.2
per kg in Q3 2020 to NOK 48.7 per kg in Q3 2021, and down NOK 2.0 per kg from Q2 2021.
The Group’s EBIT before production fee and fair value adjustment of biological assets was NOK 149 million
(NOK -14 million) for the quarter, corresponding to an EBIT per kg of NOK 7.3 (NOK -1.0 per kg). EBIT from the operative
regions Rogaland, Finnmark and BC includes value creation from the respective sales activities of the Group.
EBIT PER REGION (NOK MILLION) Q3 2021 Q3 2020 YTD 2021 YTD 2020
Rogaland 30.6 49.9 158.6 261.6
Finnmark 80.2 26.7 39.4 118.5
British Columbia 88.4 -51.6 133.6 -23.8
Newfoundland -36.9 — -97.1 —
Elimination/Others -12.8 -39.2 -57.4 -107.0
EBIT from continuing operations 149.5 -14.3 177.0 249.3
Grieg Newfoundland (acquired in Q2 2020) is reported as a region in our segment information as from 2021, however included in "Elimination/Others" in
2020, when the region was under development.
Grieg Seafood Q3 report 2021 13

Fair value adjustments of biological assets amounted to NOK 121 million (NOK -31 million) in the quarter, while
production fee (Norway) for the quarter was NOK 6 million, bringing EBIT after production fee and fair value adjustment of
biological assets from the Group’s continuing operations to NOK 264 million (NOK -46 million).
Net financial items were NOK -55 million (NOK -11 million) for the quarter. The difference of NOK -44 million compared to
Q3 2020 is primarily due foreign currency exchange rates and increased debt service costs due to the NOK 1 500 million
bond issue.
The pre-tax profit from continued operations for the quarter totaled NOK 209 million (NOK -57 million). Tax expense for
the period was estimated to NOK 61 million (tax income of NOK 10 million), resulting in profit after tax of NOK 148 million
(loss of NOK 46 million) from continued operations.
The profit after tax from discontinued operations in Q3 2021 was NOK 56 million, compared to NOK -73 million in Q3 2020.
See Note 4 for more information.
Cash flowFigures for Q3 2020 in brackets
Cash flow from operating activities during the quarter amounted to NOK 238 million (NOK 142 million). Changes in
working capital impacted our cash flow from operating activities by NOK -75 million (NOK 100 million).
Net cash flow from investing activities was NOK -126 million (NOK -305 million) during the quarter. Our gross
investments, including Shetland, for the quarter was NOK 136 million (NOK 335 million). The investments in Q3 2021
mainly related to seasite developments in Newfoundland, the Gold River smolt facility in BC and land sites in Finnmark.
No investments were financed through financial leasing during Q3 2021 (NOK 14 million).
Investment level for Q3 2020 through Q3 2021 includes the capex related to the assets classified has held for sale.
Net cash flow from financing activities in Q3 2021 was NOK -262 million, in line with cash flow from financing in Q3 2020
(NOK -240 million), and the difference being primarily higher debt service costs in 2021.
Net change in cash and cash equivalents from our continued operations was negative by NOK 150 million (negative by NOK
403 million) for the third quarter of 2021, and at the end of the quarter, the Group had cash holdings of NOK 146 million,
compared to NOK 334 million at end of Q3 2020.
Grieg Seafood Q3 report 2021 14

Financial position and liquidityFigures for Q3 2020 in brackets
At 30 September 2021, book value of total assets was NOK 11 735 million (NOK 10 587 million) compared
to NOK 10 650 million at 31 December 2020 and NOK 11 540 million at 30 June 2021. The composition of our balance sheet
at 30 September 2021 compared to 30 September 2020 was significantly impacted by Shetland being classified as held for
sale as from Q4 2020. At 30 September 2021, NOK 1 944 million of the Grieg Seafood Group book value of assets relates to
the Shetland assets held for sale. Please see Note 4 for specification of the net assets attributable to the Shetland
disposal group.
Total equity amounted to NOK 4 866 million (NOK 4 432 million) as at 30 September 2021 compared to NOK 4 371 million
as at 31 December 2020 and NOK 4 670 million as at 30 June 2021, corresponding to an equity-ratio of 41% at Q3 2021
(42%) compared to 41% at 31 December 2020 and 40% as at 30 June 2021.
The Group's financing consists of two term loans of NOK 600 million and EUR 60 million, a NOK 600 million bridge loan
and NOK 1 500 million green bond issue. Measured on our net interest-bearing debt (NIBD), 33% (28%) of our financing
was green as at 30 September 2021, compared to 38% as at 31 December 2020 and 33% as at 30 June 2021. The principal
outstanding as at 30 September 2021 of the NOK and EUR term loan was NOK 425 million and EUR 43 million. Both term
loans mature in 2023, and the bridge loan matures in 2022, while the green bond issue matures in 2025.
Our cash balance at the end of the quarter was NOK 146 million. In addition, we had NOK 800 million available in undrawn
credit facilities, thus a total free liquidity of NOK 946 million as at 30 September 2021.
At the end of Q3 2021, NIBD amounted to NOK 4 495 million (NOK 3 541 million), up from NOK 3 931 million at
31 December 2020, and down from NOK 4 563 million at 30 June 2021. Compared to Q2 2021, the change in NIBD is
primarly due to installments on our NOK and EUR term loans. Compared to Q3 2020, the change in NIBD is mainly driven
by the green bond issue of NOK 500 million in Q4 2020, in addition to Shetland being classified as held for sale (impacted
NIBD through operational leases) and the bridge-loan financing in Q1 2021. At the end of Q3 2021, we were in compliance
with the temporary amended financial covenants. Our equity-ratio measured according to loan agreements was 43%. For
more information on interest-bearing liabilities and financial covenants, please see Note 6.
Our liquidity, debt service costs and leverage ratio will be significantly affected by conducting the sale of our Shetland
assets to Scottish Sea Farms Ltd. The Competition and Markets Authority (CMA) in UK has announced to complete the
initial stage of its merger review process by 15 December 2021. We expect to be able to close the transaction in the fourth
quarter of 2021. See note 4 for mere information.
Grieg Seafood Q3 report 2021 15

Sales and market development Grieg Seafood supplied 3.6% of the global volume of Atlantic salmon harvested in Q3 2021. As part of our new strategy, we will reposition Grieg Seafood in the value chain and become an innovative partner for selected customers. By focusing on sustainable farming practices and good fish health and welfare, we can provide the healthy, tasty, and high-quality product that our customers and consumers demand.
Sales and market updates
During the third quarter, we established a value added product (VAP) sales department, which will be a key contributor to
increase our VAP product portfolio from Norwegian and Canadian origin. Moreover, we signed a Letter of Intent for
cooperation with Isfjord Norway AS on VAP capacity, as a first step towards repositioning the company in the market.
Grieg Seafood will process salmon at Isfjord Norway and sell the finished production through our sales organization. This
capacity will also contribute to better price achievement should fish be downgraded.
Going forward, we are continuing to evaluate external and internal opportunities to strengthen our processing capacity.
We are looking at developing long-term partnerships with third parties in Norway, North America and Europe, as well as
the development of existing processing infrastructure.
Our operations are certified according to Global Food Safety Initiative (GFSI), including BAP and GLOBALG.A.P., and our
sales and market organization is chain-of-custody certified according to ASC. We maintain strict quality control at every
stage of our farming operations to ensure the highest levels of food safety. Products originating from our processing
plants have been handled through a HACCP- and sanitary program. We have not had any product recalls for the last ten
years, nor did we have any in Q3 2021. We are not banned from any markets. Read more about product safety, traceability
and our certifications here.
Market development
GLOBAL SUPPLY AND DEMANDThe global supply of Atlantic salmon for the quarter increased by approximately 7% compared to Q3 2020, according to
Kontali. The growth is driven by high volumes from Norway, where salmon of Norwegian origin contributed to 57% of the
total supply in the quarter. The export of fresh salmon (head on gutted, HOG) from Norway for the quarter was up 20%
compared to Q3 2020, or 15% YTD 2021 compared to the same period last year. The main export markets for Norwegian
salmon HOG were Europe with 84%, Asia with 13% and North America with 3%. There has also been a significant increase
of 11% of fresh filet export from Norway in the quarter compared to Q3 2020, with the main volume increase to the US
market.
Market demand have been strong during the quarter. The demand is driven by supermarkets and grocery stores, in
addition to a recovery of the HoReCa segment. Demand in Europe increased by approximately 6% compared to Q3 2020,
while demand in North America increased by 13%. A decrease of salmon supplied by Chile and Canada increased the
demand for Norwegian salmon in North America. The demand in the Asian market increased by approximately 15%
compared to Q3 2020.
The average spot salmon price for Norwegian salmon (NQSALMON, weekly average less distributor margin) for Q3 2021
was NOK 54.5 per kg, up by NOK 7.4 per kg compared to Q3 2020, but down by NOK 7.6 per kg compared to Q2 2021.
Prices started in the mid-fifties going into the quarter, peaked around NOK 64 per kg mid-July and ended in the low fifties
Grieg Seafood Q3 report 2021 16
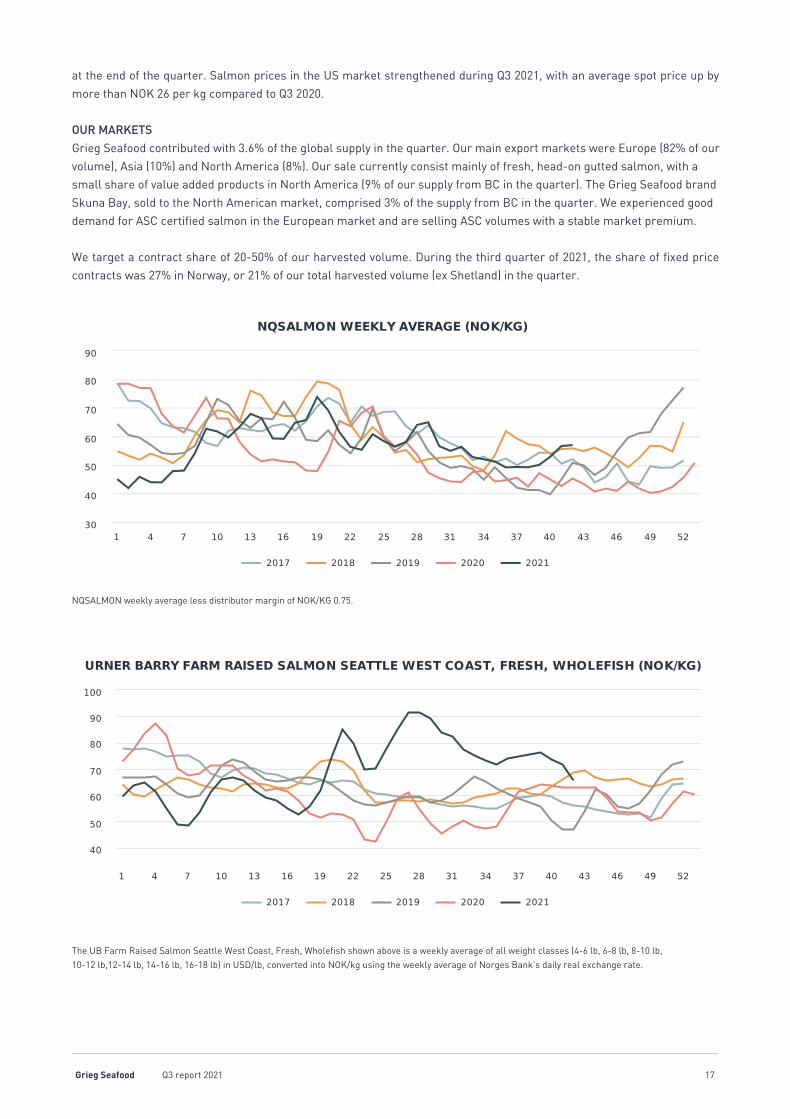
at the end of the quarter. Salmon prices in the US market strengthened during Q3 2021, with an average spot price up by
more than NOK 26 per kg compared to Q3 2020.
OUR MARKETS
Grieg Seafood contributed with 3.6% of the global supply in the quarter. Our main export markets were Europe (82% of our
volume), Asia (10%) and North America (8%). Our sale currently consist mainly of fresh, head-on gutted salmon, with a
small share of value added products in North America (9% of our supply from BC in the quarter). The Grieg Seafood brand
Skuna Bay, sold to the North American market, comprised 3% of the supply from BC in the quarter. We experienced good
demand for ASC certified salmon in the European market and are selling ASC volumes with a stable market premium.
We target a contract share of 20-50% of our harvested volume. During the third quarter of 2021, the share of fixed price
contracts was 27% in Norway, or 21% of our total harvested volume (ex Shetland) in the quarter.
NQSALMON weekly average less distributor margin of NOK/KG 0.75.
The UB Farm Raised Salmon Seattle West Coast, Fresh, Wholefish shown above is a weekly average of all weight classes (4-6 lb, 6-8 lb, 8-10 lb,
10-12 lb,12-14 lb, 14-16 lb, 16-18 lb) in USD/lb, converted into NOK/kg using the weekly average of Norges Bank's daily real exchange rate.
Grieg Seafood Q3 report 2021 17

Market expectations
The global harvest of Atlantic salmon in 2021 is expected to increase by 4%, or 117 000 tonnes, to a total of 2 828 700
tonnes, according to Kontali. Due to the increase in maximum allowed biomass (MAB) in Norway, good seawater
conditions during the second half of 2020, and volumes held back for harvest in 2020, Norwegian salmon farmers are
expected to harvest 143 000 tonnes more in 2021 than in 2020. Chile is expected to decrease harvest for 2021 by
approximately 110 000 tonnes, while the rest of the increase in harvest volume is expected to come mainly from the UK
(+ 31 000 tonnes) and other salmon farming countries (+ 53 000 tonnes). At the end of Q3 2021, the YTD harvest increase
was 8%, implying that Q4 will feature a global harvest reduction compared to Q4 2020.
The average spot price according to NQSALMON for the first weeks into Q4 2021 was around NOK 53 per kg, while spot
price in the USA according to Urner Barry was around NOK 80 per kg for Q3 2021. With global progress on vaccination
against Covid-19 and reopening of countries, it seems like prices start to stabilize again at levels known from pre-
pandemic periods, and the short-term market outlook is stable. Fishpool forward prices have remained stable throughout
Q3 2021. Q4 2021 was priced at NOK 62 per kg at the start of Q3 2021, and by the end of Q3 the forward price was close to
NOK 61 per kg. For 2022, the forward price remains at NOK 62 per kg by the end of Q3 2021.
The Group targets a fixed price contract share of 20-50%. Estimated contract share for Q4 2021 is 20%, or 29% for the
year, of our Norwegian harvest volume.
The demand from retail in Europe and from Asian countries has been stronger than expected so far this year. We believe
in increased market prices as a result of the tight global supply in combination with the outlook for continuing strong
demand. We see the case for a strong recovery from the HoReCa segments return to a more normalized situation with
society reopening. We expect the significant decrease in supply volumes from Chile for remainder of 2021 and start of
2022 to drive prices and maintain the strong demand.
Grieg Seafood Q3 report 2021 18

OUR PROGRESSROGALAND
l Within target t On track to meet target n Unsatisfactory results
PROFIT & INNOVATION
Harvest volume (tonnes GWT)
28 000 tonnes in 2021 t 6 282 7 783 5 346 6 532 5 039 19 411 16 510
EBIT per kg (NOK)
n/a 4.9 10.2 9.2 4.7 9.9 8.2 15.8
Farming cost per kg (NOK)
NOK 40/kg in 2022 n 46.5 45.8 41.9 42.7 44.3 44.9 41.9
HEALTHY OCEAN
ASC certification (# of sites)
All sites (11 eligible) by 2023 n 0 0 0 0 0 n/a n/a
Survival rate at sea
93% by 2022 t 91% 91% 91% 90% 90% n/a n/a
Cost of reduced survival (NOK million)
n/a 5.1 18.8 6.2 10.0 7.4 30.1 53.6
Use of antibiotics (g per tonne LWE) *
No use of antibiotics l 0.0 0.0 0.0 0.0 0.0 0.0 0.0
Use of hydrogen peroxide (kg per tonne LWE) *Minimize use of pharmaceutical treatments l 0.0 1.0 7.0 0.0 0.0 2.3 10.2
Sea lice treatments - in feed (g per tonne LWE) *Minimize use of pharmaceutical treatments l 0.0 0.0 0.0 0.0 0.0 0.0 0.0
Sea lice treatments - in bath (g per tonne LWE) *Minimize use of pharmaceutical treatments l 0.0 0.4 2.8 0.0 0.0 0.9 0.0
Escape incidents (# of fish)
Zero escape incidents l 0 0 0 0 0 0 0
SUSTAINABLE FEED
High quality product
93% superior share t 86 % 76 % 75 % 83 % 90 % 79 % 85 %
PEOPLE Employees
Headcount (ex contractors) n/a 167 179 164 165 161 n/a n/a
Absence rate
Below 4.5% l 3.5 % 3.0 % 1.8 % 2.5 % 2.7 % 2.9 % 3.2 %
Lost time incident rate
n/a 0 77 18 0 19 34 12
PILLAR KPI & TARGET STATUS Q3 2021 Q2 2021 Q1 2021 Q4 2020 Q3 2020 YTD 2021 YTD 2020
* Amount of active pharmaceutical ingredients (APIs) used (in gr and kg) per tonne of fish produced (LWE).
n/a: No set target or data similar to quarter end. ASC certification and number of employees are disclosed per reporting date. Survival rate is defined as the
last twelve months rolling survival, and thus not calculated year-to-date.
Grieg Seafood Q3 report 2021 19
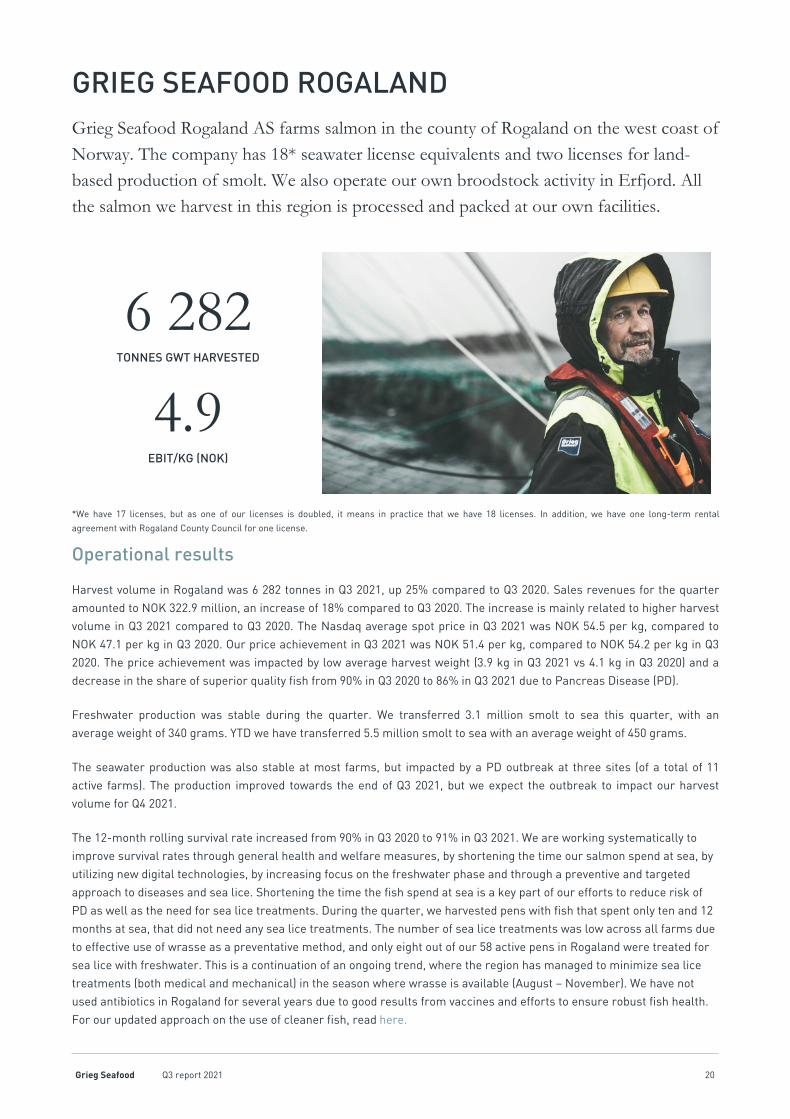
GRIEG SEAFOOD ROGALANDGrieg Seafood Rogaland AS farms salmon in the county of Rogaland on the west coast of Norway. The company has 18* seawater license equivalents and two licenses for land-based production of smolt. We also operate our own broodstock activity in Erfjord. All the salmon we harvest in this region is processed and packed at our own facilities.
6 282TONNES GWT HARVESTED
4.9EBIT/KG (NOK)
*We have 17 licenses, but as one of our licenses is doubled, it means in practice that we have 18 licenses. In addition, we have one long-term rental
agreement with Rogaland County Council for one license.
Operational results
Harvest volume in Rogaland was 6 282 tonnes in Q3 2021, up 25% compared to Q3 2020. Sales revenues for the quarter
amounted to NOK 322.9 million, an increase of 18% compared to Q3 2020. The increase is mainly related to higher harvest
volume in Q3 2021 compared to Q3 2020. The Nasdaq average spot price in Q3 2021 was NOK 54.5 per kg, compared to
NOK 47.1 per kg in Q3 2020. Our price achievement in Q3 2021 was NOK 51.4 per kg, compared to NOK 54.2 per kg in Q3
2020. The price achievement was impacted by low average harvest weight (3.9 kg in Q3 2021 vs 4.1 kg in Q3 2020) and a
decrease in the share of superior quality fish from 90% in Q3 2020 to 86% in Q3 2021 due to Pancreas Disease (PD).
Freshwater production was stable during the quarter. We transferred 3.1 million smolt to sea this quarter, with an
average weight of 340 grams. YTD we have transferred 5.5 million smolt to sea with an average weight of 450 grams.
The seawater production was also stable at most farms, but impacted by a PD outbreak at three sites (of a total of 11
active farms). The production improved towards the end of Q3 2021, but we expect the outbreak to impact our harvest
volume for Q4 2021.
The 12-month rolling survival rate increased from 90% in Q3 2020 to 91% in Q3 2021. We are working systematically to
improve survival rates through general health and welfare measures, by shortening the time our salmon spend at sea, by
utilizing new digital technologies, by increasing focus on the freshwater phase and through a preventive and targeted
approach to diseases and sea lice. Shortening the time the fish spend at sea is a key part of our efforts to reduce risk of
PD as well as the need for sea lice treatments. During the quarter, we harvested pens with fish that spent only ten and 12
months at sea, that did not need any sea lice treatments. The number of sea lice treatments was low across all farms due
to effective use of wrasse as a preventative method, and only eight out of our 58 active pens in Rogaland were treated for
sea lice with freshwater. This is a continuation of an ongoing trend, where the region has managed to minimize sea lice
treatments (both medical and mechanical) in the season where wrasse is available (August – November). We have not
used antibiotics in Rogaland for several years due to good results from vaccines and efforts to ensure robust fish health.
For our updated approach on the use of cleaner fish, read here.
Grieg Seafood Q3 report 2021 20

The farming cost ended at NOK 46.5 per kg in Q3 2021, up from NOK 44.3 per kg in Q3 2020 and NOK 45.8 per kg in Q2
2021, mainly due to harvesting from PD-affected sites, and increased well boat cost related to transport of PD-infected
fish. We expect the farming cost to decrease in Q4 as we harvest from a new generation. Cost recognized as abnormal
mortality in the income statement (cost of reduced survival) was NOK 5 million in Q3 2021 (NOK 0.8 per kg), compared to
NOK 7 million in Q3 2020 (NOK 1.5 per kg).
EBIT per kg before production fee and fair value adjustment of biological assets came to NOK 4.9 in the quarter, compared
to NOK 9.9 in Q3 2020 and NOK 10.2 in Q2 2021.
Employee well-being continue to be highly prioritized. We had no major incidents during the quarter, and the absence rate
continued at a low level of 3.5% compared to 2.7% in Q3 2020.
Operational priorities towards 2025
Grieg Seafood Rogaland aims to reduce production time in the sea, which will result in improved biological performance
and a higher utilization of each site’s maximum allowable biomass (MAB). Larger smolt will significantly reduce seawater
production time, making the fish less exposed to issues such as sea lice and Pancreas Disease (PD). The transfer of larger
smolt has produced promising results, with the time the fish spend at sea reduced from the previous norm of 18 months
to less than 12 months. We also have sites with post-smolt that we expect to harvest in Q4 2021, after less than 10 months
in sea.
Our freshwater facility at Trosnavåg and Hognaland has a production capacity of 1 200 tonnes smolt. We also have a 33%
shareholding in Tytlandsvik Aqua, which will be expanded from its current smolt production capacity of 3 400 tonnes to 4
500 tonnes in 2022, with a further expansion to 6 000 tonnes in 2024. Grieg Seafood Rogaland is entitled to 50% of the
volume from Tytlandsvik. We also use the closed-containment facility, FishGLOBE, to produce large size smolt, and in the
beginning of Q4 we have added an addition capacity of post-smolt with the second FishGLOBE ready for use. The Fish
GLOBEs have a capacity of 900 tonnes smolt. We have also invested in Årdal Aqua, which we expect to produce at least 3
000 tonnes of post-smolt annually, with the first delivery of post-smolt in 2024. Construction of the Årdal Aqua facility will
start during the first half of 2022.
Our integrated operational center monitors and controls the production and feeding operations on our farms. All Precision
Farming initiatives, such as dashboards on feed, production, fish health and welfare, is connected to the operational
center. Initiative to utilize video analytics with machine learning algorithms to automize biomass control and sea lice
counts is ongoing, and will be expanded to new areas such as behavioral based fish welfare monitoring. Our Precision
Farming strategy will ensure more efficient feeding, leading to reduced cost and improved growth going forward.
Aquaculture Stewardship Council (ASC) certification is an important objective, as we believe it provides our customers and
consumers with the assurance that we are operating in a responsible manner, producing high-quality seafood certified to
the highest social and environmental standards. We aim to certify all sites in Rogaland according to ASC, or be in
compliance with ASC, by 2023, with the first sites being certified in 2022.
Grieg Seafood Q3 report 2021 21
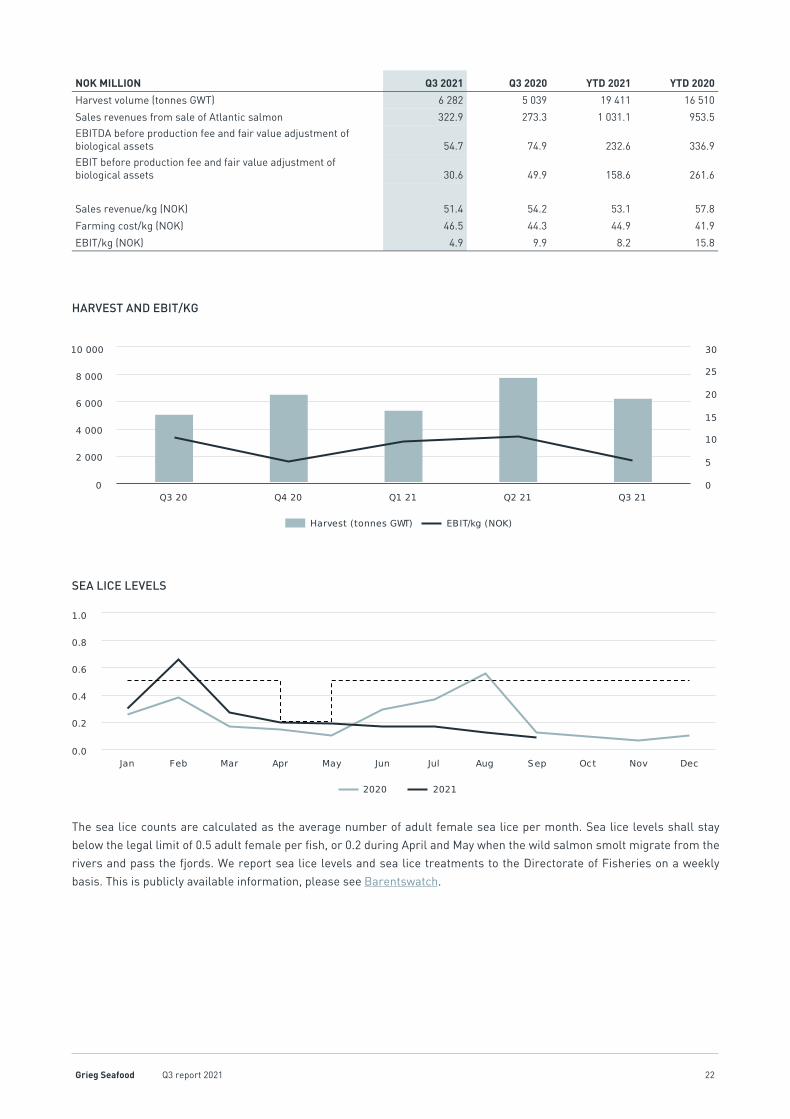
NOK MILLION Q3 2021 Q3 2020 YTD 2021 YTD 2020
Harvest volume (tonnes GWT) 6 282 5 039 19 411 16 510
Sales revenues from sale of Atlantic salmon 322.9 273.3 1 031.1 953.5
EBITDA before production fee and fair value adjustment of biological assets 54.7 74.9 232.6 336.9
EBIT before production fee and fair value adjustment of biological assets 30.6 49.9 158.6 261.6
Sales revenue/kg (NOK) 51.4 54.2 53.1 57.8
Farming cost/kg (NOK) 46.5 44.3 44.9 41.9
EBIT/kg (NOK) 4.9 9.9 8.2 15.8
HARVEST AND EBIT/KG
SEA LICE LEVELS
The sea lice counts are calculated as the average number of adult female sea lice per month. Sea lice levels shall stay
below the legal limit of 0.5 adult female per fish, or 0.2 during April and May when the wild salmon smolt migrate from the
rivers and pass the fjords. We report sea lice levels and sea lice treatments to the Directorate of Fisheries on a weekly
basis. This is publicly available information, please see Barentswatch.
Grieg Seafood Q3 report 2021 22

OUR PROGRESSFINNMARK
l Within target t On track to meet target n Unsatisfactory results
PROFIT & INNOVATION
Harvest volume (tonnes GWT)
37 000 tonnes in 2021 t 9 908 4 780 7 385 11 082 2 730 22 073 15 837
EBIT per kg (NOK)
n/a 8.1 -2.2 -4.1 0.8 9.8 1.8 7.5
Farming cost per kg (NOK)
NOK 40/kg in 2022 t 45.5 50.6 46.5 43.8 44.2 46.9 44.3
HEALTHY OCEAN
ASC certification (# of sites)
All sites (18 eligible) by 2021 t 17 16 16 15 15 n/a n/a
Survival rate at sea
93% by 2022 l 95% 94% 93% 92% 92% n/a n/a
Cost of reduced survival (NOK million)
n/a 15.3 15.3 20.5 12.6 3.1 51.1 24.9
Use of antibiotics (g per tonne LWE) *
No use of antibiotics l 0.0 0.0 49.0 0.0 0.0 8.9 0.0
Use of hydrogen peroxide (kg per tonne LWE) *Minimize use of pharmaceutical treatments l 0.0 0.0 0.0 10.0 0.0 0.0 0.0
Sea lice treatments - in feed (g per tonne LWE) *Minimize use of pharmaceutical treatments l 0.4 0.0 0.0 0.1 0.0 0.2 0.0
Sea lice treatments - in bath (g per tonne LWE) *Minimize use of pharmaceutical treatments l 0.0 0.0 2.5 1.4 0.0 0.4 0.0
Escape incidents (# of fish)
Zero escape incidents l 0 0 1 (6) 0 0 1 (6) 0
SUSTAINABLE FEED
High quality product
93% superior share t 87 % 78 % 65 % 77 % 90 % 78 % 63 %
PEOPLE Employees
Headcount (ex contractors) n/a 251 278 248 257 249 n/a n/a
Absence rate
Below 4.5% n 7.8 % 7.9 % 8.1 % 5.6 % 6.4 % 8.1 % 5.5 %
Lost time incident rate
n/a 10 23 49 10 76 23 34
PILLAR KPI & TARGET STATUS Q3 2021 Q2 2021 Q1 2021 Q4 2020 Q3 2020 YTD 2021 YTD 2020
* Amount of active pharmaceutical ingredients (APIs) used (in gr and kg) per tonne of fish produced (LWE).
n/a: No set target or data similar to quarter end. ASC certification and number of employees are disclosed per reporting date. Survival rate is defined as the
last twelve months rolling survival, and thus not calculated year-to-date.
Grieg Seafood Q3 report 2021 23

GRIEG SEAFOOD FINNMARKGrieg Seafood Finnmark AS farms salmon in Troms and Finnmark, the northernmost county in Norway. Of the company's 28* seawater licenses, eight are “green licenses” and therefore subject to stricter environmental standards. In addition, we own one freshwater license. In general, the salmon we harvest are processed and packed at our local facility in Alta.
9 908TONNES GWT HARVESTED
8.1EBIT/KG (NOK)
*In addition to 28 licenses for seawater production, we have one long-term rental agreement with Troms and Finnmark County Council for one license.
Operational results
Grieg Seafood Finnmark harvested 9 908 tonnes in Q3 2021, an increase of 263% compared to Q3 2020. Sales revenues for
the quarter amounted to NOK 531.1 million, up 261% compared to Q3 2020, mainly related to higher harvest volume. The
Nasdaq average spot price in Q3 2021 was NOK 54.5 per kg, compared to NOK 47.1 per kg in Q3 2020. Our price
achievement came to NOK 53.6 per kg in Q3 2021 compared to NOK 54.0 per kg in Q3 2020. The price achievement for the
quarter was negatively impacted by a superior share of 87% compared to 90% in Q3 2020 in addition to somewhat skewed
harvesting towards the end of the quarter when spot market prices were lower. However, a fixed-price contract share of
27% and good average harvest size of 4.4 kg contributed positively to the price achievement.
Freshwater production at our own facility at Adamselv has been good during the quarter. We transferred 2.9 million smolt
to sea this quarter, with an average weight of 120 grams. YTD we have transferred 7.5 million smolt to sea with an average
weight of 170 grams.
Seawater production has been strong during the quarter, with an all-time high monthly production volume in September.
Still, we have reduced our expected harvest volume for Q4 2021 by approximately 1 500 tonnes GWT due to optimization of
capacity utilization and skewing of harvest volume to 2022. Due to overall good and stable biology, we accomplished a 12-
month survival rate of 95% as of Q3 2021. We are working to improve survival rates through both general and targeted
health and welfare measures. Good results from vaccines and efforts to ensure robust fish health have eliminated the
need of antibiotics for several years. Antibiotics was used in the first quarter to safeguard the welfare of fish severely
impacted by winter ulcers, before use again dropped to zero during the last two quarters.
Finnmark has low sea lice levels throughout the year. Generally, lower seawater temperatures in the region are an
advantage, and the interconnectivity between the sites remains low. However, we also experience good results from the
targeted and preventive methods we use to ensure that the sea lice level remains low, such as sea lice skirts and cleaner
Grieg Seafood Q3 report 2021 24

fish. Despite a stable sea lice level, sea lice treatments in feed have been carried out this quarter to maintain low sea lice
pressure.
The farming cost was NOK 45.5 per kg in Q3 2021, up from NOK 44.2 in Q3 2020 and down from NOK 50.6 per kg in Q2
2021, which is mainly related to higher harvest volume. The farming cost increased from Q3 2020 because of costs
accumulated earlier this year on the harvested fish (caused primarily by winter ulcers) and due to harvesting from small
sites. Cost recognized as abnormal mortality in the income statement was NOK 15 million in Q3 2021 (NOK 1.5 per kg),
which relates to the chlorine spill we communicated in the report for the second quarter, compared to NOK 3 million in Q3
2020 (NOK 1.1 per kg). We expect the farming cost per kg to decrease in Q4 2021 due harvesting from sites with good
biological performance. We are seeing strong performance of our newest generations.
EBIT per kg before production fee and fair value adjustment of biological assets came to NOK 8.1 for the quarter, down
from NOK 9.8 in Q3 2020 and up from NOK -2.2 in Q2 2021.
Employee well-being continues to be highly prioritized. The absence rate of 7.8% was similar to Q2 2021, but up compared
to 6.4% in Q3 2020, mainly due to long-term sickness. We always monitor developments according to our guidelines for
absence from work.
Operational priorities towards 2025
Grieg Seafood Finnmark is focused on improving fish welfare and survival rates, and works towards sustainable
production. 17 out of 18 eligible sites (new sites must reach peak biomass to be considered for certification) were ASC
certified at the end of the quarter, equivalent to 84% of net production for the year. The last site is currently under ASC
audit, and will be ASC certified in Q1 2022.
Solving the most pressing biological challenges, winter ulcers and Infectious Salmon Anemia (ISA), is a high operational
priority. These conditions impact fish welfare, harvesting weight, quality and price achievement negatively. We have
implemented mitigating measures based on insights from conducted analyses. Examples are changes to the timing of
transferring fish to sea, changes to the feed composition and vaccinating the fish against ISA before transfer to sea.
Further, data analyses conducted indicate that reducing the time our salmon spend at sea will reduce risk of both
challenges, supporting our post-smolt strategy. We have also entered a partnership for value added processing capacity,
to secure quality and sales margins should such conditions appear.
We farm smolt at the facilities in Adamselv and Nordnorsk Smolt (50% ownership). We target a capacity increase of 4 000
tonnes of post-smolt by 2025. Increasing the smolt weight will make the fish more robust before being transferred to sea,
and a shorter period in sea will reduce exposure to biological risks.
Flexibility is a requirement to achieve better utilization of our capacity, and we are continuously looking for opportunities
to secure access to new locations.
Grieg Seafood Q3 report 2021 25

NOK MILLION Q3 2021 Q3 2020 YTD 2021 YTD 2020
Harvest volume (tonnes GWT) 9 908 2 730 22 073 15 837
Sales revenues from sale of Atlantic salmon 531.1 147.3 1 075.4 819.5
EBITDA before production fee and fair value adjustment of biological assets 118.0 61.1 145.4 228.7
EBIT before production fee and fair value adjustment of biological assets 80.2 26.7 39.4 118.5
Sales revenue/kg (NOK) 53.6 54.0 48.7 51.7
Farming cost/kg (NOK) 45.5 44.2 46.9 44.3
EBIT/kg (NOK) 8.1 9.8 1.8 7.5
HARVEST AND EBIT/KG
SEA LICE LEVELS
The sea lice counts are calculated as the average number of adult female sea lice per month. Sea lice levels shall stay
below the legal limit of 0.5 adult female per fish. At the green licenses in Finnmark, the limit is 0.25 adult female sea lice
per fish, while during April and June, when wild salmon smolt migrate from the rivers and pass the salmon farms, the
limit is 0.2 adult female sea lice per fish. We report sea lice levels and sea lice treatments to the Directorate of Fisheries
on a weekly basis. This is publicly available information, please see Barentswatch.
Grieg Seafood Q3 report 2021 26

OUR PROGRESSBRITISH COLUMBIA
l Within target t On track to meet target n Unsatisfactory results
PROFIT & INNOVATION
Harvest volume (tonnes GWT)
15 000 tonnes in 2021 t 4 289 5 249 853 2 657 6 648 10 390 18 524
EBIT per kg (NOK)
n/a 20.6 8.4 1.1 6.2 -7.8 12.9 -1.3
Farming cost per kg (CAD)
CAD 7/kg in 2022 n 8.5 8.5 8.8 8.9 8.6 8.5 7.8
HEALTHY OCEAN
ASC certification (# of sites)
All sites (16 eligible) by 2021 t 13 13 11 11 11 n/a n/a
Survival rate at sea
93% by 2022 t 91% 91% 90% 90% 88% n/a n/a
Cost of reduced survival (NOK million)
n/a 7.2 6.8 3.0 6.6 31.3 16.9 59.5
Use of antibiotics (g per tonne LWE) *
No use of antibiotics t 2.0 41.3 92.7 47.6 2.3 48.0 67.1
Use of hydrogen peroxide (kg per tonne LWE) * / **Minimize use of pharmaceutical treatments n 21.5 62.0 31.5 27.9 51.9 39.9 51.1
Sea lice treatments - in feed (g per tonne LWE) *Minimize use of pharmaceutical treatments l 0.9 0.0 0.4 0.0 0.0 0.4 0.3
Sea lice treatments - in bath (g per tonne LWE) *Minimize use of pharmaceutical treatments l 0.0 0.0 0.0 0.0 0.0 0.0 0.0
Escape incidents (# of fish)
Zero escape incidents l 0 1 (1) 0 0 0 1 (1) 0
SUSTAINABLE FEED
High quality product
93% superior share t 89 % 89 % 90 % 78 % 85 % 89 % 87 %
PEOPLE Employees
Headcount (ex contractors) n/a 170 172 167 174 176 n/a n/a
Absence rate
Below 4.5% t 5.1 % 5.5 % 6.2 % 5.9 % 7.3 % 5.6 % 7.1 %
Lost time incident rate
n/a 0 13 12 0 53 8 61
PILLAR KPI & TARGET STATUS Q3 2021 Q2 2021 Q1 2021 Q4 2020 Q3 2020 YTD 2021 YTD 2020
* Amount of active pharmaceutical ingredients (APIs) used (in gr and kg) per tonne of fish produced (LWE).
** As of 01.01.2021, the Government of Canada - Department of Fisheries and Oceans Canada (DFO) changed the calculation formula for the API of hydrogen
peroxide from Paramove 50 from 1 L (Paramove 50) * 1.15 (density) * 0.45 (concentration) = 1 kg H2O2 to 1 L (Paramove 50) * 1.19 (density) * 0.49
(concentration) = 1 kg H2O2, which is now also corresponding to the method used in the UK and in Norway. Previous figures have not been recalculated to
comply with the correct calculation method at their time.
n/a: No set target or data similar to quarter end. ASC certification and number of employees are disclosed per reporting date. Survival rate is defined as the
last twelve months rolling survival, and thus not calculated year-to-date.
Grieg Seafood Q3 report 2021 27

GRIEG SEAFOOD BRITISH COLUMBIAGrieg Seafood BC Ltd farms salmon on the east and west sides of Vancouver Island, and along the Sunshine Coast north of Vancouver. The company has 20 seawater licenses and one license for land-based production of smolt. We do not process our own salmon in BC.
4 289TONNES GWT HARVESTED
20.6EBIT/KG (NOK)
Operational results
Harvest volume in Q3 2021 was 4 289 tonnes, 35% below Q3 2020. The reason is mainly that harvesting volumes vary
significantly every other year in BC due to local production region arrangements and less farms on the West Coast of
Vancouver Island compared to the East Coast. As a consequence, the region's volume vary every other year, regardless of
the underlying biology. Measures are being done to equalize harvest volumes.
Sales revenues for the quarter was NOK 341.5 million. This is at the same level as Q3 2020 (NOK 341.7 million), despite
significantly lower harvest volume. The average spot price according to the Urner Barry (farm raised salmon Seattle West
Coast, fresh, wholefish) was NOK 79.7 per kg in Q3 2021 compared to NOK 53.5 per kg in Q3 2020. Price achievement for
the quarter was NOK 79.6 per kg, compared to NOK 51.4 per kg in Q3 2020, positively impacted by the higher market
prices, good average harvest weight of 4.4 kg and a superior share of 89%.
Our freshwater production has been stable during the quarter. We transferred 0.2 million smolt to sea this quarter, with
an average weight of 340 grams. YTD we have transferred 2.7 million smolt to sea with an average weight of 140 grams.
The seawater performance has been good this quarter. The 12-month rolling survival rate increased from 88% in Q3 2020
to 91% in Q3 2021. We used antibiotics in the quarter for treatment of enteric redmouth disease (ERM), to safeguard the
welfare of the fish. Our use of antibiotics is too high, and we are installing infrastructure that will allow us to lower water
temperatures and salinity to help limit the transmission of diseases. We also pursue non-therapeutic means to manage
disease, such as vaccines and an adapted diet. Our post-smolt strategy will enable us to have better control of the fish’s
environment for a longer period. It will also make the fish more robust when they are transferred to sea, and a shorter
period at sea will reduce exposure to biological risks. This in turn will reduce the risk of disease outbreaks and the need
for antibiotics.
BC is heavily influenced by sea lice pressure each autumn, when the wild salmon pass our farms on their way to the river
to spawn. Here, unlike Norway, the wild salmon population greatly outnumbers the farmed salmon population. We are
using preventative methods such as sea lice skirts and tarps to keep the sea lice level stable. When the sea lice level
Grieg Seafood Q3 report 2021 28

increases, we carry out the type of treatment most appropriate to the biological situation. The sea lice level was stable
during the quarter, and treatment with hydrogen peroxide as well as in-feed treatment were carried out to maintain a
stable level.
The farming cost decreased from CAD 8.6 per kg (NOK 59.2) in Q3 2020 to CAD 8.5 per kg (NOK 59.0) in Q3 2021, despite
lower harvest volume. Compared to Q2 2021, the farming cost was stable. Cost recognized as abnormal mortality in the
income statement (cost of reduced survival) was NOK 7 million in Q3 2021 (NOK 1.7 per kg, or CAD 0.2 per kg), compared
to NOK 31 million in Q3 2020 (NOK 1.7/CAD 0.7 per kg). We expect the farming cost to increase slightly in Q4 2021 due to
harvesting from sites with somewhat elevated mortality and preparing of sites for the next generation, with reductions in
the farming cost in the long term as volume increase.
EBIT per kg before production fee and fair value adjustment of biological assets came to NOK 20.6, compared to NOK -7.8
in Q3 2020 and NOK 8.4 in Q2 2021.
Employee well-being has been and continues to be our priority during the Covid-19 pandemic. We had no major incidents
in the quarter. The absence rate of 5.1% was above our 4.5% target, mainly due to long-term sickness and the fact that we
have increased the sick leave days, as employees are more cautious when it comes to going to work if they feel sick/
having flu symptoms. We always monitor developments according to our guidelines for absence from work.
Operational priorities towards 2025
Access to high-quality smolt is key to ensuring sustainable production growth. With the Gold River smolt facility, Grieg
Seafood BC will increase smolt capacity from 500 tonnes to 900 tonnes. The first smolt transfer from the facility to sea will
be in the spring of 2022.
Grieg Seafood BC aims to have all eligible sites ASC certified within 2021. At the end of Q3 2021, a total of 13 sites out of 16
eligible sites are certified (corresponding to 71% of net production). Obtaining ASC certification is an important signal that
our salmon is a responsible choice, as ASC has strict requirements with respect to minimizing fish farms’ impact on the
natural environment and supporting local communities.
The United Nations Declarations on the Rights of Indigenous Peoples (UNDRIP) is under implementation in BC, giving
Indigenous Peoples rights in their own traditional territory. This is a process of reconciliation between the Government,
businesses and First Nations. Three of our main farming areas in BC are operated under agreements with First Nations.
These relationships are very important to us. The Truth & Reconciliation Commission: Call to Action #92 provide guidance
to us on our role in the reconciliation process. We work to get better at operating with respect for the culture of our First
Nations partners in every way, to deepen our understanding and to provide shared opportunities. Read more about our
journey of reconciliation in BC here.
The Canadian federal government’s plans to transition open-net-pen salmon farming in BC. The Minister of Fisheries,
Oceans and the Canadian Coast Guard published a report this summer outlining an approach on how to move forward on
this transition plan and how to work with the province of BC and Indigenous communities to create a responsible
transition plan. Grieg Seafood is looking forward to participate in the process, and to find solutions together with
stakeholders that will ensure a sustainable aquaculture industry in BC. In line with the transition plan, the federal
regulator Fisheries, Oceans and Canadian Coast Guard has announced that it will not renew licenses in the Discovery
Islands farming area after 30 June 2022. This is not one of our main farming areas. As we have only one farm in that area,
our production plans will not be significantly impacted. Salmon farming companies in BC, including Grieg Seafood BC,
have asked for a judicial review of the Government’s decision process, to better understand the implications. The ultimate
outcome is not known.
Harmful Algae Blooms (HAB) and low oxygen events represent significant biological risks in BC. Algae movements and
oxygen levels are continuously monitored and analyzed using high-grade real-time in pen sensors, and machine learning
with predictive environmental data software. In addition, aeration systems have been installed to enable feeding also
during challenging situations. Mortality related to algae blooms was reduced from 3.4% in 2019 to 0.9% in 2020 and even
Grieg Seafood Q3 report 2021 29

further down to 0.4% so far in 2021. We expect our efforts within algae mitigation and digital monitoring to increase
survival and harvest volume, and reduce cost going forward. This will enable us to reach our cost target of CAD 7 per kg.
QUARTERLY STORY
Grieg and R Harry Fishing Ltd. sign net-washing contract for Nootka Sound salmon farmsDuring the quarter, Grieg Seafood BC has signed a net-washing contract with local business-owner Richard Harry to service our five farms in Nootka Sound as part of its ongoing commitment to reconciliation which includes the creation of Indigenous-owned business opportunities.“For myself and my family, we have always worked on the water. We’ve always been a commercial fishing family and the children pretty much grew up on our boats, so it’s been a lifetime of experience.” – Richard Harry, principal of R Harry Fishing Ltd.
> Read the full story here
Grieg Seafood Q3 report 2021 30

NOK MILLION Q3 2021 Q3 2020 YTD 2021 YTD 2020
Harvest volume (tonnes GWT) 4 289 6 648 10 390 18 524
Sales revenues from sale of Atlantic salmon 341.5 341.7 741.9 1 000.4
EBITDA before production fee and fair value adjustment of biological assets 111.2 -27.0 204.3 54.0
EBIT before production fee and fair value adjustment of biological assets 88.4 -51.6 133.6 -23.8
Sales revenue/kg (NOK) 79.6 51.4 71.4 54.0
Farming cost/kg (CAD) 8.5 8.6 8.5 7.8
Farming cost/kg (NOK) 59.0 59.2 58.6 55.3
EBIT/kg (NOK) 20.6 -7.8 12.9 -1.3
HARVEST AND EBIT/KG
SEA LICE LEVELS
The sea lice counts are calculated as the average number of motile sea lice per salmon. The limit as defined by the
authorities is three motile sea lice per salmon in the period from March to June, recognized as a vulnerable time for wild
salmon migrating out to sea.
Grieg Seafood Q3 report 2021 31

OUR PROGRESSNEWFOUNDLAND
Grieg Seafood Newfoundland is a greenfield project located in Placentia Bay in Newfoundland. At the end of Q3 2021, we have eight seawater licenses and one freshwater license. Additional seawater licenses have been applied for.
Operational results
Our RAS facility in Marystown Marine Industrial Park, close to Placentia Bay, is fully operational. As communicated in the
second quarter report, the transfer of the first fish to sea will take place in the spring and summer of 2022. The current
generation of eggs, received in April and July, has a good development with high survival rates. The first batch of this
generation was successfully transferred to the smolt facility in October. We plan to move three million fish to sea in 2022,
with harvesting commencing in 2023. As a part of the preparations for the seawater phase, a group of our employees
destined for seawater operations will receive training at our farms in BC and/or Norway.
Our seawater licenses in Newfoundland require use of sterile all-female salmon in order to eliminate the risk of genetic
pollution of wild Atlantic salmon in case of escape. We base our operations on developed knowledge and experience about
farming triploid salmon in both Norway and the UK. Best practice we utilize include optimizing the times of the year to
transfer fish to the sea, the feed composition and conditions during the freshwater phase.
During the quarter, we were able to test the resilience of our seawater equipment when a hurricane classified as Category
1 storm swept over eastern Newfoundland. The sea cage site and equipment sustained no damages. The RAS facility also
withstood the Category 1 hurricane winds with no damage. Power outages and other disturbances was handled by our
backup system and caused no disruption on the production.
Operational cost for Q3 2021 totaled NOK -37 million, compared to NOK -45 million in Q2 2021. Operational cost for Q4
2021 will come down.
We are committed to develop the project according to milestones outlined in the permits granted by the authorities. We
are well prepared with equipment, employees and knowledge of biological conditions, which enables us to provide a solid
and safe production. Going forward, we will prepare our seawater operation. We are confident that we will be able to build
a strong farming region in Newfoundland during the next years, creating jobs and value for the local communities.
Grieg Seafood Q3 report 2021 32
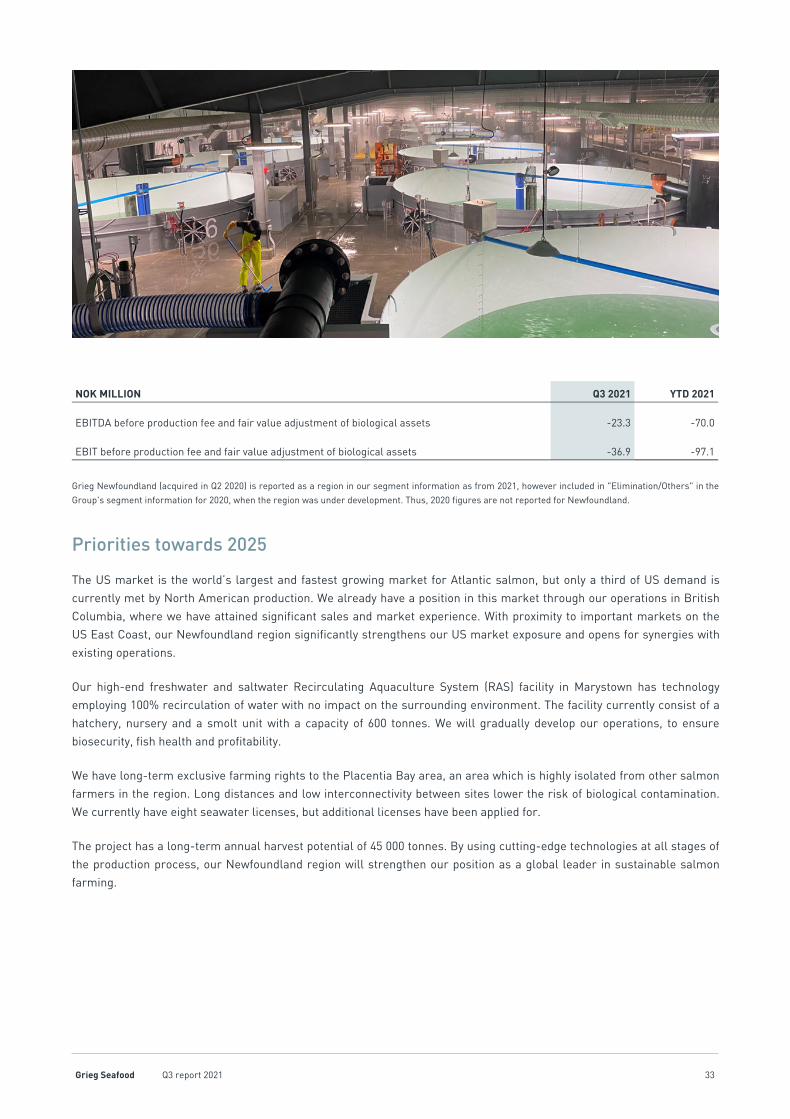
NOK MILLION Q3 2021 YTD 2021
EBITDA before production fee and fair value adjustment of biological assets -23.3 -70.0
EBIT before production fee and fair value adjustment of biological assets -36.9 -97.1
Grieg Newfoundland (acquired in Q2 2020) is reported as a region in our segment information as from 2021, however included in "Elimination/Others" in the
Group's segment information for 2020, when the region was under development. Thus, 2020 figures are not reported for Newfoundland.
Priorities towards 2025
The US market is the world’s largest and fastest growing market for Atlantic salmon, but only a third of US demand is
currently met by North American production. We already have a position in this market through our operations in British
Columbia, where we have attained significant sales and market experience. With proximity to important markets on the
US East Coast, our Newfoundland region significantly strengthens our US market exposure and opens for synergies with
existing operations.
Our high-end freshwater and saltwater Recirculating Aquaculture System (RAS) facility in Marystown has technology
employing 100% recirculation of water with no impact on the surrounding environment. The facility currently consist of a
hatchery, nursery and a smolt unit with a capacity of 600 tonnes. We will gradually develop our operations, to ensure
biosecurity, fish health and profitability.
We have long-term exclusive farming rights to the Placentia Bay area, an area which is highly isolated from other salmon
farmers in the region. Long distances and low interconnectivity between sites lower the risk of biological contamination.
We currently have eight seawater licenses, but additional licenses have been applied for.
The project has a long-term annual harvest potential of 45 000 tonnes. By using cutting-edge technologies at all stages of
the production process, our Newfoundland region will strengthen our position as a global leader in sustainable salmon
farming.
Grieg Seafood Q3 report 2021 33

Board's approvalRelated parties' transactions
There has not been any related parties' transactions during Q3 2021 outside ordinary course of business. See Note 9 for
more information on related parties and related parties transactions.
Events after the balance sheet date
No significant events have been recorded after the balance sheet date.
THE BOARD OF DIRECTORS AND CEOBERGEN, 3 NOVEMBER 2021
Grieg Seafood Q3 report 2021 34
PART 03
RESULTSBy always improving our operational excellence, reflecting
our holistic performance approach, we are driving sustainable value creation.
Grieg Seafood Q3 report 2021 35

Financial statements
INCOME STATEMENT
GRIEG SEAFOOD GROUP NOK 1 000 NOTE Q3 2021 Q3 2020 YTD 2021 YTD 2020
Continuing operations
Sales revenues 3 1 303 202 913 926 3 085 106 3 241 988
Other income 3 27 990 3 844 55 469 26 555
Share of profit from associates 8 -351 1 732 108 1 297
Raw materials and consumables used -496 937 -336 173 -1 160 260 -1 245 458
Salaries and personnel expenses -156 325 -131 253 -404 177 -354 725
Other operating expenses -426 570 -378 558 -1 111 942 -1 146 992
EBITDA before production fee and fair value adjustment of biological assets 3 251 009 73 518 464 304 522 665
Depreciation property, plant and equipment -99 591 -86 403 -282 114 -268 744
Amortization licenses and other intangible assets -1 935 -1 458 -5 200 -4 595
EBIT before production fee and fair value adjustment of biological assets 3 149 483 -14 343 176 989 249 326
Production fee -6 476 — -16 595 —
Fair value adjustment of biological assets 5 120 720 -31 469 386 997 -495 739
EBIT after production fee and fair value adjustment of biological assets 263 727 -45 812 547 391 -246 413
Net financial items 7 -55 018 -10 834 -56 893 -159 782
Profit before tax from continuing operations 208 709 -56 646 490 499 -406 195
Estimated taxation -60 867 10 360 -142 323 85 122
Net profit for the period from continuing operations 147 842 -46 286 348 175 -321 073
Discontinued operations
Net profit for the period from discontinued operations 4 55 868 -72 777 96 007 -292 499
Net profit for the period 203 710 -119 063 444 182 -613 572
Allocated to
Controlling interests 203 710 -127 077 444 182 -631 496
Non-controlling interests — 8 014 — 17 924
Dividend declared and paid per share (NOK) 0.0 0.0 0.0 0.0
Earnings per share attributable to equity holders of Grieg Seafood ASA (NOK)
Earnings per share from continuing operations 1.3 -0.4 3.1 -2.9
Earnings per share from discontinued operations 0.5 -0.7 0.9 -2.8
Earnings per share - total 1.8 -1.1 4.0 -5.6
The Income Statement is prepared for the Group’s continuing operations. See further information in Note 4.
Grieg Seafood Q3 report 2021 36
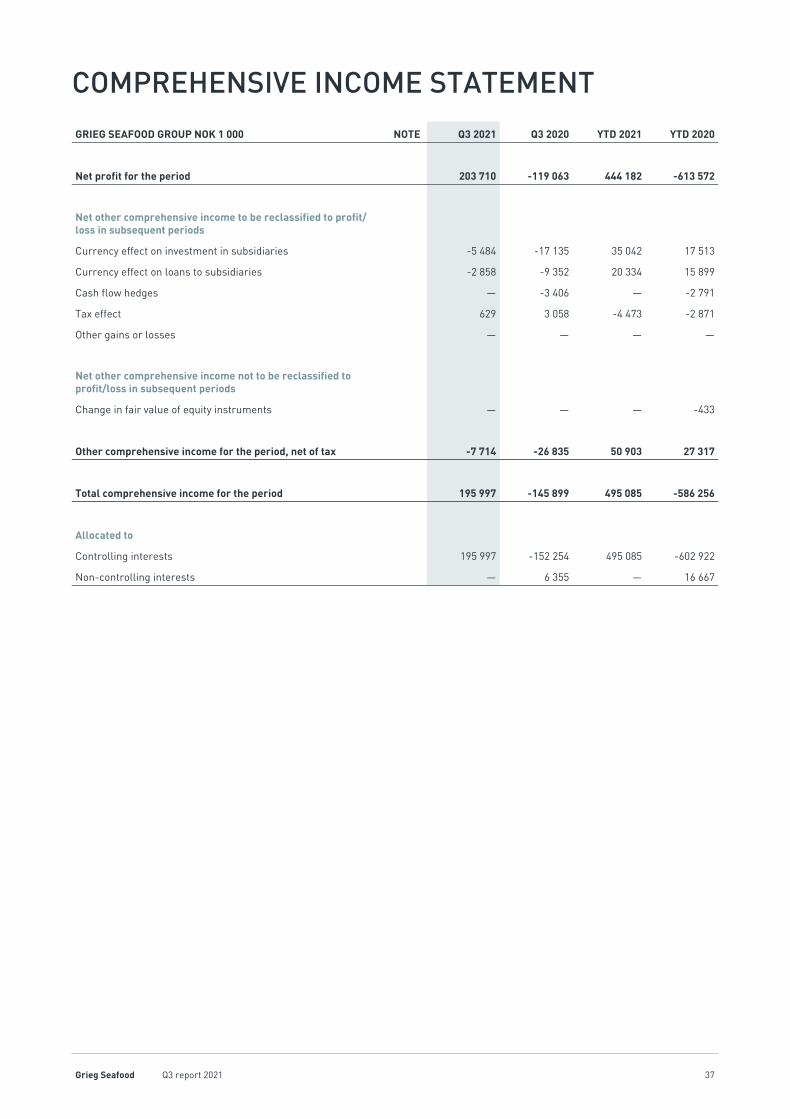
COMPREHENSIVE INCOME STATEMENT
GRIEG SEAFOOD GROUP NOK 1 000 NOTE Q3 2021 Q3 2020 YTD 2021 YTD 2020
Net profit for the period 203 710 -119 063 444 182 -613 572
Net other comprehensive income to be reclassified to profit/loss in subsequent periods
Currency effect on investment in subsidiaries -5 484 -17 135 35 042 17 513
Currency effect on loans to subsidiaries -2 858 -9 352 20 334 15 899
Cash flow hedges — -3 406 — -2 791
Tax effect 629 3 058 -4 473 -2 871
Other gains or losses — — — —
Net other comprehensive income not to be reclassified to profit/loss in subsequent periods
Change in fair value of equity instruments — — — -433
Other comprehensive income for the period, net of tax -7 714 -26 835 50 903 27 317
Total comprehensive income for the period 195 997 -145 899 495 085 -586 256
Allocated to
Controlling interests 195 997 -152 254 495 085 -602 922
Non-controlling interests — 6 355 — 16 667
Grieg Seafood Q3 report 2021 37

STATEMENT OF FINANCIAL POSITION
ASSETS
Deferred tax assets 36 939 108 392 29 293
Goodwill 655 806 667 657 638 019
Licenses incl. warranty licenses 1 530 833 1 719 661 1 508 452
Other intangible assets incl. exclusivity agreement 38 480 51 118 38 015
Property, plant and equipment incl. right-of-use assets 6 3 453 704 4 072 766 3 033 154
Indemnification assets 40 000 — 40 000
Investments in associates 8 87 029 82 368 84 421
Other non-current receivables 32 351 2 935 9 476
Total non-current assets 5 875 141 6 704 897 5 380 830
Inventories 133 211 155 690 78 001
Biological assets excl. the fair value adjustment 5 2 382 447 2 635 725 2 198 676
Fair value adjustment of biological assets 5 831 222 97 580 347 227
Trade receivables 98 732 252 280 179 384
Other current receivables, derivatives and financial instruments 323 603 235 818 217 258
Cash and cash equivalents 6 146 483 334 181 275 427
Total current assets 3 915 699 3 711 273 3 295 972
Assets held for sale 4 1 943 978 170 614 1 972 725
Total assets 11 734 818 10 586 785 10 649 527
EQUITY AND LIABILITIES
Share capital 453 788 453 788 453 788
Treasury shares -4 686 -4 855 -4 686
Contingent consideration (acquisition of Grieg Newfoundland AS) 701 535 701 535 701 535
Retained earnings and other equity 3 715 366 3 225 497 3 220 281
Total controlling interests 4 866 003 4 375 965 4 370 918
Non-controlling interests — 55 641 —
Total equity 4 866 003 4 431 605 4 370 918
Deferred tax liabilities 1 070 044 941 275 908 958
Share based payments 9 884 — 491
Borrowings and lease liabilities 6 3 715 154 3 477 546 3 907 822
Subordinated loans — 59 636 —
Total non-current liabilities 4 795 081 4 478 457 4 817 272
Current portion of borrowings and leasing liabilities 6 892 210 376 286 257 630
Factoring liabilities 6 — 72 044 —
Trade payables 547 369 714 041 562 848
Tax payable 426 193 252 14 791
Other current liabilities, derivatives and financial instruments 273 957 209 572 133 240
Total current liabilities 1 713 963 1 565 196 968 509
Liabilities directly associated with the assets held for sale 4 359 771 111 527 492 829
Total liabilities 6 868 815 6 155 179 6 278 609
Total equity and liabilities 11 734 818 10 586 785 10 649 527
GRIEG SEAFOOD GROUP NOK 1 000 Note 30.09.2021 30.09.2020 31.12.2020
Grieg Seafood Q3 report 2021 38
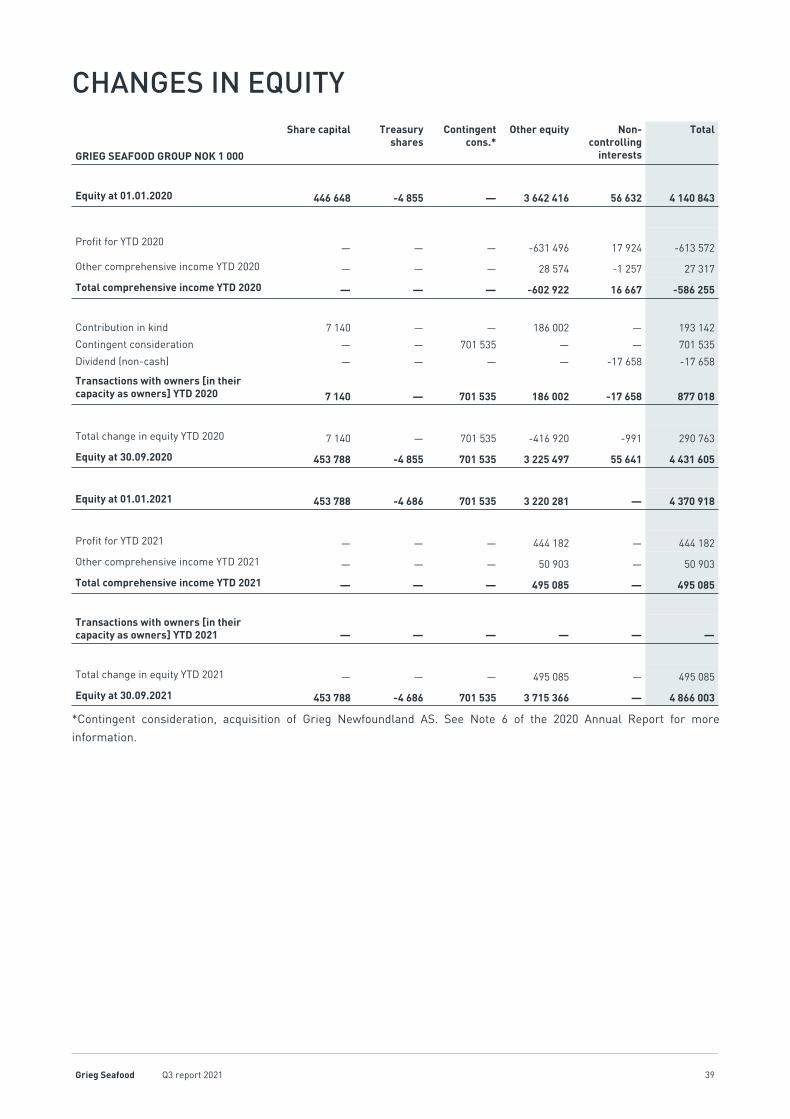
CHANGES IN EQUITY
GRIEG SEAFOOD GROUP NOK 1 000
Share capital Treasury shares
Contingent cons.*
Other equity Non-controlling
interests
Total
Equity at 01.01.2020 446 648 -4 855 — 3 642 416 56 632 4 140 843
Profit for YTD 2020 — — — -631 496 17 924 -613 572
Other comprehensive income YTD 2020 — — — 28 574 -1 257 27 317
Total comprehensive income YTD 2020 — — — -602 922 16 667 -586 255
Contribution in kind 7 140 — — 186 002 — 193 142
Contingent consideration — — 701 535 — — 701 535
Dividend (non-cash) — — — — -17 658 -17 658
Transactions with owners [in their capacity as owners] YTD 2020 7 140 — 701 535 186 002 -17 658 877 018
Total change in equity YTD 2020 7 140 — 701 535 -416 920 -991 290 763
Equity at 30.09.2020 453 788 -4 855 701 535 3 225 497 55 641 4 431 605
Equity at 01.01.2021 453 788 -4 686 701 535 3 220 281 — 4 370 918
Profit for YTD 2021 — — — 444 182 — 444 182
Other comprehensive income YTD 2021 — — — 50 903 — 50 903
Total comprehensive income YTD 2021 — — — 495 085 — 495 085
Transactions with owners [in their capacity as owners] YTD 2021 — — — — — —
Total change in equity YTD 2021 — — — 495 085 — 495 085
Equity at 30.09.2021 453 788 -4 686 701 535 3 715 366 — 4 866 003
*Contingent consideration, acquisition of Grieg Newfoundland AS. See Note 6 of the 2020 Annual Report for more
information.
Grieg Seafood Q3 report 2021 39

CASH FLOW STATEMENT
GRIEG SEAFOOD GROUP NOK 1 000 Note Q3 2021 Q3 2020 YTD 2021 YTD 2020
EBIT after production fee and fair value adj. of biological assets 263 727 -45 812 547 391 -246 413
Depreciation and amortization 101 526 87 861 287 315 273 339
Gain/loss on sale of property, plant and equipment -2 2 519 67 2 415
Share of profit from associates 8 351 -1 732 -108 -1 297
Fair value adjustment of biological assets 5 -120 720 31 469 -386 997 495 739
Change inventory excl. fair value, trade payables and rec. -74 797 99 886 -337 454 29 332
Other adjustments 68 787 -30 373 161 436 -1 631
Taxes paid -842 -1 453 -20 809 -11 855
Net cash flow from operating activities 238 030 142 365 250 841 539 629
Proceeds from sale of property, plant and equipment 38 — 390 714
Payments on purchase of property, plant and equipment -126 408 -205 524 -442 728 -481 263
Payments on purchase of intangible assets incl. licenses — -99 942 — -159 066
Payments on business combinations — — — -620 464
Accumulated cash acquired in business combinations — — — 30 628
Government grant 6 — — 8 443 —
Investment in associates and other invest. 8 — — -2 500 20
Net cash flow from investing activities -126 370 -305 466 -436 396 -1 229 431
Revolving credit facility (net draw-down/repayment) 6 -110 000 -135 865 -196 222 254 135
Proceeds of long-term int. bearing debt 6 — — 627 399 1 018 560
Proceeds of short-term int. bearing debt 6 — 23 020 — 23 020
Repayment long-term int. bearing debt 6 -50 599 -51 175 -101 602 -102 147
Repayment lease liabilities 6 -44 905 -41 430 -132 868 -145 447
Net interest and other financial items 7 -56 202 -34 626 -154 224 -75 413
Net cash flow from financing activities -261 705 -240 076 42 483 972 708
Net change in cash and cash equivalents -150 045 -403 178 -143 072 282 906
Cash and cash equivalents - opening balance 204 260 742 805 275 427 214 497
Currency translation of cash and cash equivalents 162 -1 089 694 -856
Discontinued operations, other cash flow items 4 92 107 -4 357 13 434 -162 366
Cash and cash equivalents - closing balance 146 483 334 181 146 483 334 181
The Cash Flow Statement is presented for the Group’s continuing operations. See further information in Note 4.
Grieg Seafood Q3 report 2021 40
SELECTED NOTES
NOTE 1 ACCOUNTING PRINCIPLES
Grieg Seafood ASA (the Group) comprises Grieg Seafood ASA and its subsidiaries, including the Group’s share of
associated companies. The financial report for the third quarter of 2021 has been prepared in accordance with the
International Financial Reporting Standards (IFRS) and interpretations approved by the EU, including IAS 34. The report
does not include all information required in a complete annual report and should therefore be read in conjunction with the
Group’s recent annual report (2020).
The financial report for the third quarter of 2021 is unaudited.
Management is required to make estimates and assumptions concerning the future that affect the accounting policies and
recognized amounts of assets, liabilities, income and expenses. Significant estimates relate to valuation of biological
assets and intangible assets. Estimates and underlying assumptions are continuously evaluated and are based on
historical experience and other factors, including expectations of future events that are believed to be probable under the
present circumstances. The final outcomes may deviate from these estimates. Changes in estimates are reflected in the
accounts as they occur.
Additional accounting principles
The following accounting principles supplement the Group’s accounting principles disclosed in our recent annual report
(2020).
Production fee
As from 1 January 2021, a fixed rate of NOK 0.40/kg (gutted weight) is charged on fish harvested in Norway. The
production fee is presented on a separate line item "Production fee" in the income statement, and included in EBIT after
production fee and fair value adjustment on biological assets. Production fee for Q3 2021 totaled NOK 2.5 million for
Rogaland, and NOK 4.0 million for Finnmark, in total NOK 6.5 million. YTD 2021, production fee for Rogaland totals NOK
7.8 million, and NOK 8.8 million for Finnmark, in total NOK 16.6 million. The Norwegian production fee is accrued
throughout the current year, and payable in 2022 (included in "Other current liabilities, derivatives and financial
instruments" in the balance sheet).
In UK, Crown Estate Scotland charges GBP 27.50/tonnes (gutted weight), with a 10 % reduction on Outer Isle farms (Outer
Hebrides, Orkney and Shetland). In 2021, and applied retrospectively, the Crown Estate Scotland production fee is
reported in line with the Norwegian production fee. As at 30 September 2021, as in 2020, the Group classifies the Shetland
assets at assets held for sale, as such the effect of the retrospective change in accounting policy for the Crown Estate
Scotland charges is limited to the note disclosure of discontinued operations (Note 4).
Government grants
Government grants are recognized when it is reasonably certain that the company will meet the conditions stipulated for
the grants and that the grants will be received. Operating grants are recognized systematically during the grant period.
Grants are deducted from the cost which the grant is meant to cover. Investment grants are capitalized and recognized
systematically over the asset’s useful life. Investment grants are recognized either as deferred income or as a deduction
of the asset’s carrying amount.
In Q1 2021 the Group made drawdown on a preferred shares agreement with the Province of Newfoundland and Labrador,
Canada. The preferred shares are classified as a loan, while the below-market rate of interest is treated as a government
grant, measured as the difference between the initial carrying value of the loan and the proceeds received. In Q1 2021 the
grant was classified as a subordinate loan, subsequently classified as property, plant and equipment in Q2 2021, as
deduction of the acquisition cost of the freshwater facility in Newfoundland.
Grieg Seafood Q3 report 2021 41

NOTE 2 RISKS AND UNCERTAINTIES
The Group is exposed to risks in numerous areas, such as biological production, the effects of climate change,
degradation of nature, compliance risk, the risk of accidents, changes in salmon prices, and the risk of politically
motivated trade barriers. The current Covid-19 pandemic poses a material risk to most of the Group's operational areas.
The Group’s internal controls and risk exposure are subject to continuous monitoring and improvement, and efforts to
reduce risk in different areas have a high priority. Management has established a framework for managing and
eliminating most of the risks that could prevent the Group from attaining its goals. See the Group’s risk overview here. A
summary of some of these risks, in the context on the short- and medium term as from Q3 2021, is included below.
OPERATIONAL RISK
The greatest operational risk relates to biological developments within the Group’s aquaculture operations. The book
value of live fish at cost at quarter-end was NOK 2 382 million (20% of the balance sheet value). Biological risks include
oxygen depletion, diseases, viruses, bacteria, parasites, algae blooms, jelly fish and other contaminants. To reduce this
risk, the Group focuses on improving fish health and welfare through several initiatives, including joint fallowing and area-
based management, switching from pharmaceutical to mechanical delousing treatment methods, and use of sensor
technology to reduce algae challenges. The Group’s post-smolt strategy, where fish are grown to a larger size on land,
thereby shortening the time they spend in open sea pens, is an important part to reduce the biological risk.
During the quarter, the biological seawater situation has been good in our regions, with increasing survival rates. As at
quarter end, Grieg Seafood Rogaland had three sites infected by Pancreas Disease (PD). The sea lice pressure has been
stable or lower in all regions compared to the same period last year.
In the beginning of the quarter, infectious salmon anemia (ISA) was detected on one fish during a routine sampling in
our freshwater facility in Newfoundland. The first generation of close to one million fish was culled (cost accrued
last quarter), postponing the transfer of fish to seawater from 2021 to 2022, as a precautionary approach and to
reduce risk. The second generation of eggs has developed as planned. Production at our other freshwater facilities have
been good during the quarter.
The feed industry is characterized by large global suppliers operating under cost plus contracts, and feed prices are
accordingly directly linked to the global markets for fishmeal, vegetable meal, animal proteins and fish/vegetable/animal
oils which are the main ingredients in fish feed. Access to feed raw materials was limited during the quarter, resulting in
increased feed prices for all our regions. We expect the limitation to persist also into 2022.
MARKET RISK
The salmon market seems to be recovering from the Covid-19 pandemic, with high demand and good prices. During Q3
2021, the global supply of Atlantic salmon increased by approximately 7% compared to Q3 2020, and the average
NQSALMON (less distributor margin of NOK 0.75) was NOK 54.5 per kg in Q3 2021 compared to NOK 47.1 per kg in Q3
2020. A decrease in supply of fish to the US market has pushed prices, contributing to a strong price achievement in BC.
We expect a strong demand and good market prices going forward.
We target a fixed price contract share of 20-50%. Estimated contract share for Q4 is 20%, or 29% for the year 2021, of the
Norwegian harvest volume. We do not have fixed price contracts in BC.
This is the second quarter where our new sales and market organization sold all of our fish. We have established a value
added department and secured value-added processing capacity in Norway, as a step towards repositioning the company
in the market.
COMPLIANCE RISK
In February 2019, the European Commission launched an investigation to explore potential anti-competitive behavior in
the Norwegian salmon industry. Grieg Seafood is one of the companies under investigation. Based on the EU investigation,
US competition authorities launched their own investigation into the matter in November 2019. Two class-action lawsuits
Grieg Seafood Q3 report 2021 42

(not yet certified as class-action) has been filed by direct and indirect customers in the USA and three in Canada. Grieg
Seafood is not aware of any anti-competitive behavior within the Group, neither in Norway, the EU, the USA, nor in Canada.
We are fully collaborating with European and American authorities in this matter and will follow up the lawsuits in the USA
and Canada accordingly. NOK 7.3 million was spent on lawyer fees related to these investigation during the quarter. The
cost is included as ownership cost, see Note 3.
In Q3, we had a chlorine leak at our harvesting facility in Grieg Seafood Finnmark. During the incident, 15 000 liters of
chlorine unfortunately leaked into the fjord, and 96 000 fish, who were in the pens at the harvesting plant, died. An
independent assessment of the environmental impact has been, concluding that the spill was local and has not spread
outside the fjord. We cooperate fully with authorities, and await their investigation into the course of events that led to the
spill.
FINANCIAL RISK
Financing risk
Our business and future plans are capital intensive. Management monitors the Group's liquidity reserve, which comprises
a bond, loan facility, bank deposits, and cash equivalents, based on expected cash flows. The Group has as at
30 September 2021 NOK 600 million in bridge loan financing, maturing in Q1 2022, and a syndicated debt of NOK 425
million and EUR 43 million, maturing in Q1 2023. Our green bond issue of NOK 1 500 million matures in Q2 2025. A debt
refinancing process is currently ongoing.
In November 2020, the Group was granted an amendment to its loan covenants through the third quarter of 2021, which
gave management greater room for maneuver in an uncertain market affected by Covid-19. The next measurement date
of the financial covenant NIBD/EBITDA is 31 December 2021.
On 29 June 2021 Grieg Seafood entered into an agreement with Scottish Sea Farms Ltd for the divestment of our Shetland
assets. The transaction is expected to be finalized before year end, depending on UK competition authorities. The
transaction is expected to make a positive contribution on the Group's liquidity, leverage ratio and financial flexibility.
Liquidity risk
The Group has invested substantial amounts during the last year, such as the acquisition of Grieg Newfoundland and the
build-up of its biomass. The Group utilizes factoring agreements to finance its trade receivables. The trade financier
purchases 100% of the credit-insured trade receivables from the Norwegian sales organization, transferring significant
(95%) risk and control to the credit insurer. The purchased receivables by the trade financier are derecognized from the
statement of financial position of the Group.
At the end of Q3 2021, the Group had NOK 800 million in available undrawn liquidity. The revolving credit is flexible, as it
can be drawn upon within a month, or for a longer period, depending on the Group´s need for liquidity. Management
monitors the Group’s liquidity reserve, which comprises a loan facility, bank deposits, and cash equivalents, based on
expected cash flows. This is carried out at group level in collaboration with the operating companies. Management and the
Board seek to maintain a high equity ratio (41% at 30 September 2021), to be well positioned to meet financial and
operational challenges.
Currency risk
The Group is primarily impacted by currency exposure to CAD, USD, GBP and EUR. The production companies sell in local
currencies to the sales organization, which hedges its transactions against currency fluctuations related to CAD/USD,
EUR/NOK, GBP/EUR and USD/NOK, and other currencies if required. However, the Group may not be successful in
hedging against currency fluctuations and significant fluctuations may have a material adverse effect on the Group's
financial results and business.
Interest rate risk
The Group is exposed to interest rate risk through its borrowing activities, and to fluctuating interest rate levels in
connection with the financing of its activities in the various regions. The Group's existing loans are at floating interest
Grieg Seafood Q3 report 2021 43

rates, but separate fixed-rate contracts have been entered into to reduce interest rate risk. Grieg Seafood’s policy is to
have 20–50% of interest-bearing debt hedged through interest rate swap agreements. A given proportion shall be at
floating rates, while consideration will be given to entering and exiting hedging contracts for the remainder.
Credit risk
Credit risk is managed at Group level. Credit risk arises from transactions involving derivatives and deposits in banks and
financial institutions, transactions with customers, including trade receivables, and fixed contracts as well as loans to
associates. The Group has procedures to ensure that products are only sold to customers with satisfactory
creditworthiness. The Group normally sells to new customers solely against presentation of a letter of credit or against
advance payment, and credit insurance is used when deemed necessary.
CLIMATE AND NATURE RELATED RISK
The UN Climate Change report released this August, concludes, amongst others, that the world is likely to hit 1.5C
warming limit within 20 years, and that the extreme weather events are likely to become more severe. The climate plays
an important role in Grieg Seafood’s operations. We have performed climate-related scenario analysis, and identified
possible physical risks such as damage caused by extreme weather, biological challenges due to higher or fluctuating
seawater temperature, and limited access to feed ingredients. Transition risks identified includes regulatory risk related
to carbon reduction requirements and carbon taxes, financial risk/to access to capital, market risk related to
requirements from customers and consumers, and reputational risk related to environmental impact. Several of our
ongoing initiatives target climate challenges, such as utilizing technology to manage and mitigate seawater issues and
post-smolt to reduce the time in sea and thereby reduce the risk of biological challenges. We report our greenhouse gas
emissions for Scope 1, 2 and 3, and our carbon emission targets are approved by the Science-Based Targets initiative.
During the quarter, Grieg Seafood joined the Taskforce on Nature-related Financial Disclosures (TNFD), with the purpose
of developing a risk management and financial disclosure framework on nature-related risks. Alongside global financial
institutions and businesses, Grieg Seafood will take part in the initiative as a Taskforce Member. The aim of TNFD is to
support a shift in global financial flows away from nature-negative outcomes and towards nature-positive outcomes. The
finalized framework is earmarked for release in late 2023. For further information, visit the TNFDs website.
Grieg Seafood Q3 report 2021 44
NOTE 3 SEGMENT INFORMATION
The operating segments are identified on the basis of the reports which Group management uses to assess performance
and profitability at a strategic level. Group management assesses business activities from a geographical perspective,
based on the location of assets. The Group has one production segment: Production of farmed salmon. Earnings from the
sales companies in the Group is reported per producer. Geographically, management assesses the results of production
in Rogaland – Norway, Finnmark – Norway and BC – Canada, and - as from Q1 2021 - Newfoundland - Canada. In Q4 2020,
Grieg Seafood defined the reporting segment "Shetland-UK" as part of the disposal group "Shetland", currently classified
as held for sale (see Note 4).
Group management evaluates the results from the segments based on EBIT before production fee and fair value
adjustments of biological assets. The operating segments are divided geographically by country or region, based on the
reporting applied by Group management when assessing performance and profitability at a strategic level.
The method of measurement excludes the effect of non-recurring costs, such as restructuring costs, legal costs on
acquisition and amortization of goodwill and intangible assets when amortization is attributable to an isolated event which
is not expected to recur. The measurement method also excludes the effect of share based payments, as well as
unrealized gains and losses on financial instruments, and ownership costs. These gains/losses and costs are reported in
the "Elim/Other" column in the segment information of Grieg Seafood.
Elim./Other items comprise, in addition to intercompany eliminations, the profit/loss from activities conducted by the
parent company or other Group companies not geared for production.
In the segment reporting, sales revenue on regional level include revenue from sale of Atlantic salmon. On regional level,
other income include sale of bi-products (such as ensilage), as well as income from sale of smolt, fry and roe. On Group
level, such income are reclassified to sales revenue in the "Elim/Other"-column in the Group's segment information.
Other income also include, both on regional and Group level, rental income and income from overcapacity of operational
assets. Other gains/losses are in the segment information included in the line "other income", such as gains/losses from
the sale of fixed assets and other equipment.
Sales revenue/kg reported in the segment information is equal to the sum of sales revenue of the regions divided by the
related harvest volume.
Farming cost/kg reported in the segment information contributes all cost directly related to production and harvest of
salmon, divided by the related harvest volume. Thus, on regional level, farming costs equal the operational costs. Other
income are included in the farming cost metric, thus considered as cost reduction activities. Group farming cost is
calculated based on the farming operation of the Group, excluding ownership costs and costs from Group companies not
geared for production.
Other costs incl. ownership and headquarter costs/kg reported in the segment information include all costs and revenue
not directly related to production and harvest of salmon, hereof the costs from activities conducted by the parent company
and other Group companies not geared for production, divided by the Group's harvest volume. In addition, until the first
harvest in Newfoundland is carried out, costs attributable to the Newfoundland region are included as other costs/kg.
EBIT/kg reported in the segment information is equal to the EBIT before production fee and fair value adjustment of
biological assets divided by the related harvest volume.
Grieg Seafood Q3 report 2021 45

Q3 2021FARMING EUROPE FARMING NORTH
AMERICAELIM./OTHER
GROUP
GEOGRAPHICAL SEGMENTS (NOK 1 000)
ROGALANDNORWAY
FINNMARKNORWAY
BCCANADA
NLCANADA
Sales revenues 322 866 531 081 341 543 — 107 713 1 303 202
Other income 10 870 16 240 956 2 842 -2 917 27 990
EBITDA 54 678 117 962 111 235 -23 307 -9 560 251 009
EBIT before production fee and fair value adjustment of biological assets 30 609 80 225 88 411 -36 933 -12 830 149 483
Harvest volume tonnes GWT 6 282 9 908 4 289 — — 20 479
Sales revenue/kg 51.4 53.6 79.6 — — 58.4
Farming cost/kg 46.5 45.5 59.0 — — 48.7
Other costs incl. ownership and headquarter costs/kg — — — — — 2.4
EBIT/kg 4.9 8.1 20.6 — — 7.3
EBITDA % 17% 22% 33% 0% -9% 19%
EBIT % 9% 15% 26% 0% -12% 11%
In Q3 2021, the ownership cost includes lawyer fees related to the EU commission investigation of NOK 7.3 million.
Q3 2020FARMING EUROPE FARMING NORTH
AMERICAELIM./OTHER
GROUP
GEOGRAPHICAL SEGMENTS (NOK 1 000)
ROGALANDNORWAY
FINNMARKNORWAY
BCCANADA
Sales revenues 273 267 147 305 341 700 151 654 913 926
Other income 10 835 6 929 — -13 920 3 844
EBITDA 74 930 61 073 -26 980 -35 505 73 518
EBIT before production fee and fair value adjustment of biological assets 49 854 26 654 -51 605 -39 246 -14 343
Harvest volume tonnes GWT 5 039 2 730 6 648 — 14 416
Sales revenue/kg 54.2 54.0 51.4 — 52.9
Farming cost/kg 44.3 44.2 59.2 — 51.2
Other costs incl. ownership and headquarter costs/kg — — — — 2.7
EBIT/kg 9.9 9.8 -7.8 — -1.0
EBITDA % 27% 41% -8% -23% 8%
EBIT % 18% 18% -15% -26% -2%
Grieg Seafood Q3 report 2021 46

YTD 2021FARMING EUROPE FARMING NORTH
AMERICAELIM./OTHER
GROUP
GEOGRAPHICAL SEGMENTS (NOK 1 000)
ROGALANDNORWAY
FINNMARKNORWAY
BCCANADA
NLCANADA
Sales revenues 1 031 065 1 075 354 741 880 — 236 807 3 085 106
Other income 40 694 34 371 6 969 3 408 -29 973 55 469
EBITDA 232 565 145 442 204 308 -70 032 -47 978 464 304
EBIT before production fee and fair value adjustment of biological assets 158 556 39 353 133 589 -97 144 -57 364 176 989
Harvest volume tonnes GWT 19 411 22 073 10 390 — — 51 874
Sales revenue/kg 53.1 48.7 71.4 — — 54.9
Farming cost/kg 44.9 46.9 58.6 — — 48.5
Other costs incl. ownership and headquarter costs/kg — — — — — 3.0
EBIT/kg 8.2 1.8 12.9 — — 3.4
EBITDA % 23% 14% 28% 0% -20% 15%
EBIT % 15% 4% 18% 0% -24% 6%
YTD 2020FARMING EUROPE FARMING NORTH
AMERICAELIM./OTHER
GROUP
GEOGRAPHICAL SEGMENTS (NOK 1 000)
ROGALANDNORWAY
FINNMARKNORWAY
BCCANADA
Sales revenues 953 478 819 536 1 000 413 468 560 3 241 988
Other income 54 764 36 899 3 666 -68 775 26 555
EBITDA 336 913 228 745 53 989 -96 983 522 665
EBIT before production fee and fair value adjustment of biological assets 261 627 118 503 -23 812 -106 992 249 326
Harvest volume tonnes GWT 16 510 15 837 18 524 — 50 872
Sales revenue/kg 57.8 51.7 54.0 — 54.5
Farming cost/kg 41.9 44.3 55.3 — 47.5
Other costs incl. ownership and headquarter costs/kg — — — — 2.1
EBIT/kg 15.8 7.5 -1.3 — 4.9
EBITDA % 35% 28% 5% -21% 16%
EBIT % 27% 14% -2% -23% 8%
NL-CANADA: Newfoundland. Acquired in Q2 2020, reported as a region as from 2021 and included in "Elim/Other" through 2020.
Grieg Seafood Q3 report 2021 47

NOTE 4 NON-CURRENT ASSETS HELD FOR SALE AND DISCONTINUED OPERATIONS
All note disclosures in this financial report for Q3 2021 have been prepared for the Group’s continuing operations if not
otherwise explicitly stated in the note disclosures. This Note is prepared for the Group's discontinued operations only.
The Group’s Income Statement and Cash Flow Statement have been re-presented for the comparative figures for Q3 2020
for the effects of the disposal group's Shetland. The Statement of Financial Position is not re-presented for the
comparative 30 September 2020 figures. Intercompany balances and transactions between the entities within the disposal
group's, as well with other Group Companies, have been eliminated if not otherwise explicitly mentioned below.
SHETLAND
In November 2020, we announced that we will divest our investment and operations in Shetland, as we will focus on our
operations in Norway and Canada going forward. On 29 June 2021, Grieg Seafood ASA entered into an agreement with
Scottish Sea Farms Ltd for the disposal of all shares in Grieg Seafood Hjaltland UK Ltd, the parent company of Grieg
Seafood ASA's Shetland business. The enterprise value is set to GBP 164 million, assuming a normalized working capital,
and to be adjusted for cash and debt. The transaction is subject to certain customary closing conditions. The transaction is
expected to close within Q4 2021, as the Competition and Markets Authority (CMA) in the UK announced the launch of its
merger inquiry by notice to the parties on 20 October 2021, and the current statutory deadline by when the phase 1
decision will be announced is 15 December 2021. At phase 1, the CMA determines whether it believes that the merger
results in a realistic prospect of a substantial lessening of competition. We can not see there are any, and expect that the
transaction will be closed at the end of fourth quarter.
The net asset values booked in the quarterly report directly associated with the Shetland assets held for sale amounts to
NOK 1 584 million. Estimated transaction fee is not booked as at 30 September 2021 as the transaction is not finalized,
and the transaction fee mechanism is "no cure, no pay". A disposal group held for sale is measured at the lower of book
value and fair value less cost of sale. No impairment has been charged in the Shetland assets as at 30 September 2021.
The operations defined as discontinued are presented as held for sale at 30 September 2021, and the discontinued
operations of Shetland are defined as the farming and sales operations by Grieg Seafood in Shetland. Thus, the
discontinued operation of Shetland includes the prior reporting segment of Shetland UK, in addition to the UK sales
operations.
Grieg Seafood Shetland harvested 4 029 tonnes in Q3 2021, a decrease of 40% compared to Q3 2020. YTD 2021 harvest
volume in Shetland was 11 206 tonnes (12 602 tonnes). Following a period of restructuring and operational improvement,
production on mainland Shetland has developed positively. Measures undertaken includes control of the sea lice situation
by means of aeration systems, sea lice skirts and freshwater treatments. In addition, a new vaccination strategy to
improve smolt quality have significantly increased the survival rate for smolt transferred to the sea. The last fish on the
Isle of Skye, which have been impacted by severe biological challenges in prior periods and impacted our results, was
harvested in Q2 2021. Operating income from the disposal group Shetland amounted to NOK 293.3 million in Q3 2021, with
an EBITDA of NOK 53 million. The Shetland asset financials are prepared in line with IFRS 5, thus amortization and
depreciation of property, plant and equipment and right-of-use assets hasn't been carried out (NOK 33 million for Q3
2021). As from Q3 2021, some of the invoiced intercompany services from Grieg Seafood ASA to Grieg Seafood Shetland
has not been eliminated, and thus is included in the discontinued operations' result. These costs are considered directly
associated with the assets held for sale, and will cease following the finalization of the sale transaction.
SHETLAND: BIOLOGICAL ASSETS AT 30.09.2021
NUMBER OF FISH (1 000)
BIOMASS (TONNES)
COST OF PRODUCTION
(NOK 1 000)
FAIR VALUE ADJUSTMENT
(NOK 1 000)
CARRYING AMOUNT
(NOK 1 000)
Biomass onshore 3 066 57 26 056 — 26 056
Biological assets with round weight < 4.60 kg 4 633 8 363 423 487 39 489 462 976
Biological assets with round weight > 4.60 kg — — — — —
Total 7 699 8 420 449 543 39 489 489 032
Grieg Seafood Q3 report 2021 48

The fair value adjustment of biological assets in Grieg Seafood Shetland has been calculated using a discount factor of 3.5 %. See Note 5 for information on
the fair value assessment considerations, which also applies for Grieg Seafood Shetland.
OCEAN QUALITY
On 23 May 2020, we entered into an agreement with Bremnes Fryseri to dissolve the Ocean Quality sales partnership. The
transaction was finalized at year-end 2020. See Note 5 of the 2020 Annual Report for more information on the Ocean
Quality disposal group.
Financial information for the held for sale disposal groups
SHETLAND* OCEAN QUALITY**
Q3 2021 Q3 2020 YTD 2021 YTD 2020 Q3 2021 Q3 2020 YTD 2021 YTD 2020
Operating income 293 307 355 610 755 314 767 002 — 685 608 — 2 334 750
Operating expenses -240 772 -530 772 -648 221 -964 792 — -678 599 — -2 320 728
EBIT before production fee and fair value adjustment of biological assets 52 534 -175 162 107 093 -197 790 — 7 010 — 14 022
Production fee*** -1 296 -2 122 -4 364 -4 240 — — — —
Fair value adjustment of biological assets 8 712 73 106 57 775 -199 101 — — — —
EBIT after production fee and fair value adjustment of biological assets 59 950 -104 178 160 504 -401 131 — 7 010 — 14 022
Net financial items -1 440 -134 -3 662 4 367 — 2 018 — 7 630
Profit before tax from discontinued operations 58 510 -104 312 156 842 -396 764 — 9 028 — 21 652
Estimated taxation -2 642 24 506 -60 835 87 325 — -1 999 — -4 713
Net profit for the period from discontinued operations 55 868 -79 806 96 007 -309 438 — 7 029 — 16 939 Gain on the sale of the subsidiary after income tax — — — — — — — —
Net profit for the period from discontinued operations 55 868 -79 806 96 007 -309 438 — 7 029 — 16 939
PROFIT (LOSS) FROM DISCONTINUED OPERATIONS (NOK 1 000)
*Depreciation ceased from 1 October 2020, in accordance with IFRS 5.
**Transaction with Bremnes Fryseri AS completed 31 December 2020. 2021 is thus n/a for the Ocean Quality disposal group.
***See Note 1
TOTAL PROFIT (LOSS) FROM DISCONTINUED OPERATIONSTOTAL (NOK 1 000) Q3 2021 Q3 2020 YTD 2021 YTD 2020
Shetland disposal group 55 868 -79 806 96 007 -309 438
Ocean Quality disposal group — 7 029 — 16 939
Net profit for the period from discontinued operations 55 868 -72 777 96 007 -292 499
Grieg Seafood Q3 report 2021 49

CLASSES OF ASSETS AND LIABILITIES OF THE DISPOSAL GROUP (NOK 1 000)
TOTAL (SHETLAND)
TOTAL (OCEAN
QUALITY)
30.09.2021 30.09.2020
Classes of assets and liabilities of the disposal group
Deferred tax assets 21 081 —
Intangible assets 559 836 —
Property, plant and equipment and right-of-use assets 746 844 6 512
Biological assets incl fair value 489 032 —
Inventories 18 288 17 690
Trade receivables and other receivables 103 147 70 363
Cash and cash equivalents 5 750 76 050
Assets directly related with disposal group 1 943 978 170 614
Non-current liabilities 163 296 9 651
Current liabilities 196 475 101 876
Liabilities directly associated with disposal group 359 771 111 527
Net assets directly associated with disposal group 1 584 207 59 087
As at 30 September 2021 the net assets classified as held for sale attributes fully to the Shetland disposal group, while the net assets classified as held for
sale as at 30 September 2020 attributes fully to the Ocean Quality disposal group.
TOTAL (SHETLAND)
TOTAL (OCEAN
QUALITY)
Amounts included in accumulated OCI associated with the disposal group (NOK 1 000) 30.09.2021 30.09.2020
Currency effect on investment in subsidiaries 3 857 860
Currency effects on loans to subsidiaries 94 860 —
Other gains and losses -636 —
Cash flow hedges — -1 261
Tax effects -20 869 -277
Reserve of disposal group classified as held for sale 77 212 -678
CASH FLOWS FROM DISCONTINUED OPERATIONS (NOK 1 000)
CASH FLOWS FROM DISCONTINUED OPERATIONS (NOK 1 000)
SHETLAND OCEAN QUALITY
Q3 2021 Q3 2020 YTD 2021 YTD 2020 Q3 2021 Q3 2020 YTD 2021 YTD 2020Net cash flow from operating activities 120 201 53 048 165 834 -8 555 — 64 640 — 38 774
Net cash flow from investing activities -8 856 -14 767 -18 547 -48 883 — -657 — -657
Net cash flow from financing activities -17 229 -43 007 -129 039 -68 126 — -304 — -2 494
Net change in cash and cash equivalents 94 116 -4 725 18 249 -125 564 — 63 678 — 35 623
TOTAL CASH FLOWS FROM DISCONTINUED OPERATIONS (NOK 1 000) Q3 2021 Q3 2020 YTD 2021 YTD 2020
Net change in cash and cash equivalents 94 116 58 953 18 249 -89 940
Specification of "Discontinued operations" in Continued Operations Cash Flow Statement:
Other changes in cash — 7 503 — 70 039
Usage of Group Account, Shetland* -92 107 -3 146 -13 434 92 327
Discontinued operations -92 107 4 357 -13 434 162 366
*Grieg Seafood Shetland, included in the disposal group "Shetland", is part of Grieg Seafood ASA' group account (cash pool) arrangement with banks.
Grieg Seafood Q3 report 2021 50
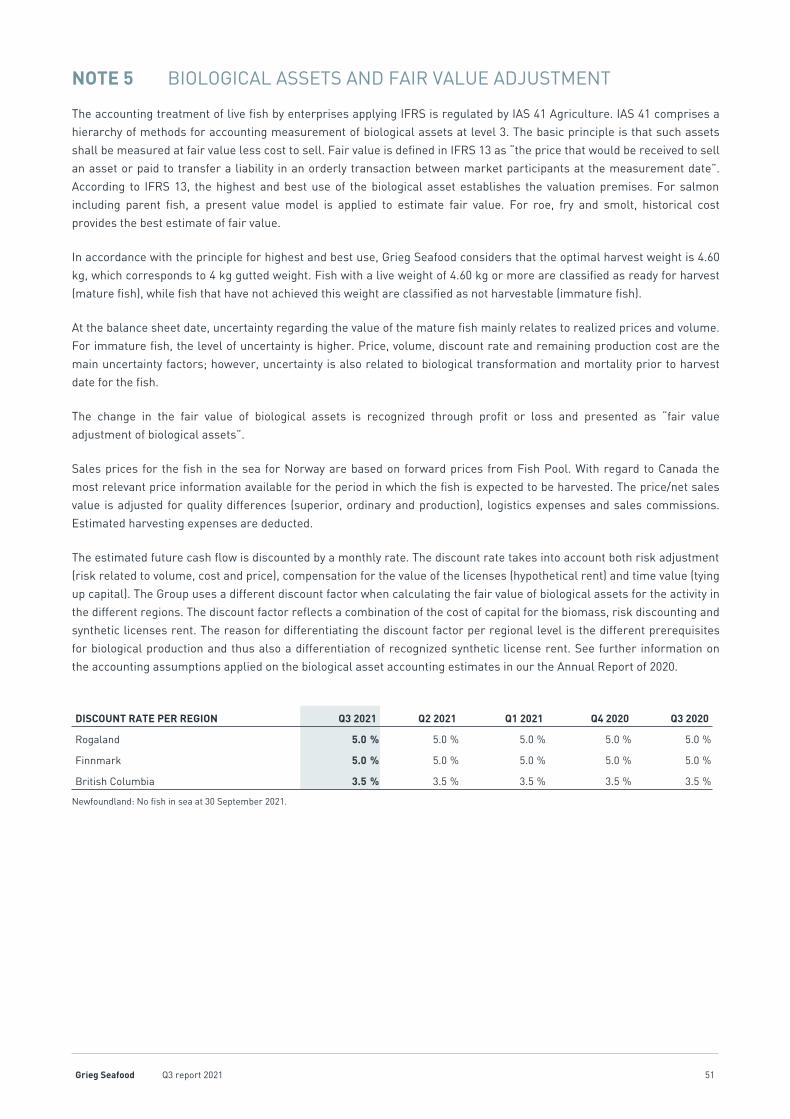
NOTE 5 BIOLOGICAL ASSETS AND FAIR VALUE ADJUSTMENT
The accounting treatment of live fish by enterprises applying IFRS is regulated by IAS 41 Agriculture. IAS 41 comprises a
hierarchy of methods for accounting measurement of biological assets at level 3. The basic principle is that such assets
shall be measured at fair value less cost to sell. Fair value is defined in IFRS 13 as “the price that would be received to sell
an asset or paid to transfer a liability in an orderly transaction between market participants at the measurement date”.
According to IFRS 13, the highest and best use of the biological asset establishes the valuation premises. For salmon
including parent fish, a present value model is applied to estimate fair value. For roe, fry and smolt, historical cost
provides the best estimate of fair value.
In accordance with the principle for highest and best use, Grieg Seafood considers that the optimal harvest weight is 4.60
kg, which corresponds to 4 kg gutted weight. Fish with a live weight of 4.60 kg or more are classified as ready for harvest
(mature fish), while fish that have not achieved this weight are classified as not harvestable (immature fish).
At the balance sheet date, uncertainty regarding the value of the mature fish mainly relates to realized prices and volume.
For immature fish, the level of uncertainty is higher. Price, volume, discount rate and remaining production cost are the
main uncertainty factors; however, uncertainty is also related to biological transformation and mortality prior to harvest
date for the fish.
The change in the fair value of biological assets is recognized through profit or loss and presented as “fair value
adjustment of biological assets”.
Sales prices for the fish in the sea for Norway are based on forward prices from Fish Pool. With regard to Canada the
most relevant price information available for the period in which the fish is expected to be harvested. The price/net sales
value is adjusted for quality differences (superior, ordinary and production), logistics expenses and sales commissions.
Estimated harvesting expenses are deducted.
The estimated future cash flow is discounted by a monthly rate. The discount rate takes into account both risk adjustment
(risk related to volume, cost and price), compensation for the value of the licenses (hypothetical rent) and time value (tying
up capital). The Group uses a different discount factor when calculating the fair value of biological assets for the activity in
the different regions. The discount factor reflects a combination of the cost of capital for the biomass, risk discounting and
synthetic licenses rent. The reason for differentiating the discount factor per regional level is the different prerequisites
for biological production and thus also a differentiation of recognized synthetic license rent. See further information on
the accounting assumptions applied on the biological asset accounting estimates in our the Annual Report of 2020.
DISCOUNT RATE PER REGION Q3 2021 Q2 2021 Q1 2021 Q4 2020 Q3 2020
Rogaland 5.0 % 5.0 % 5.0 % 5.0 % 5.0 %
Finnmark 5.0 % 5.0 % 5.0 % 5.0 % 5.0 %
British Columbia 3.5 % 3.5 % 3.5 % 3.5 % 3.5 %
Newfoundland: No fish in sea at 30 September 2021.
Grieg Seafood Q3 report 2021 51
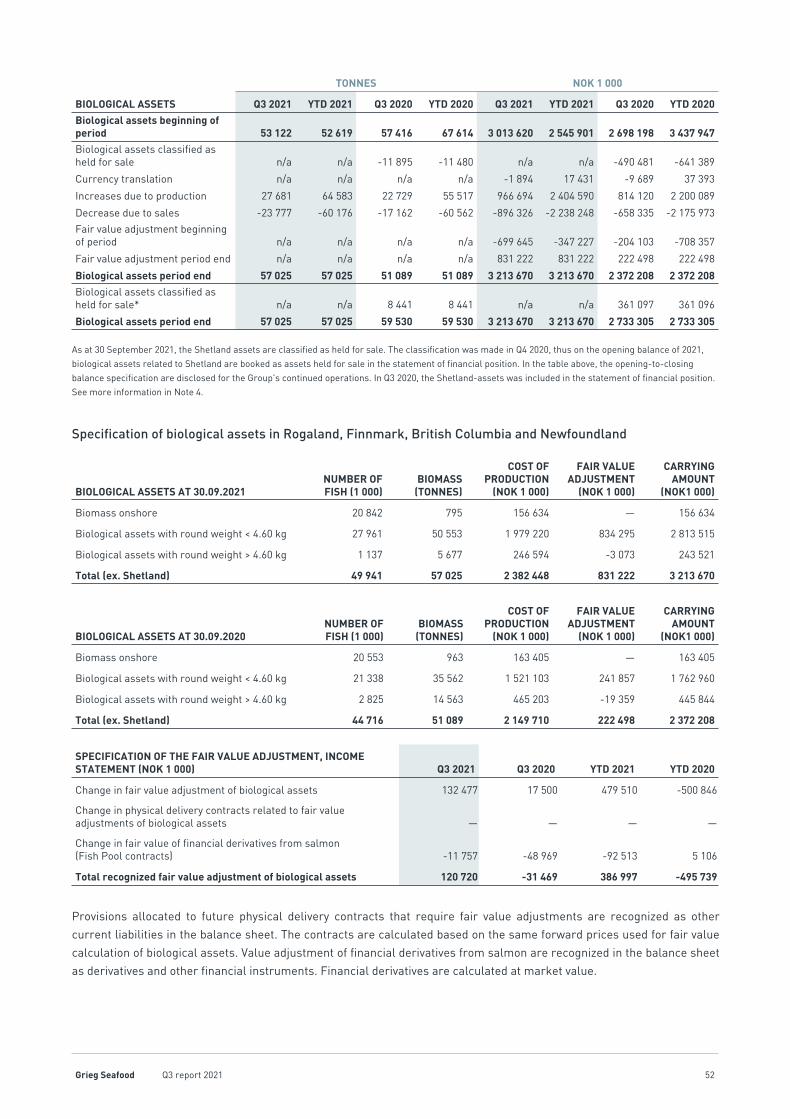
BIOLOGICAL ASSETS
TONNES NOK 1 000
Q3 2021 YTD 2021 Q3 2020 YTD 2020 Q3 2021 YTD 2021 Q3 2020 YTD 2020Biological assets beginning of period 53 122 52 619 57 416 67 614 3 013 620 2 545 901 2 698 198 3 437 947Biological assets classified as held for sale n/a n/a -11 895 -11 480 n/a n/a -490 481 -641 389
Currency translation n/a n/a n/a n/a -1 894 17 431 -9 689 37 393
Increases due to production 27 681 64 583 22 729 55 517 966 694 2 404 590 814 120 2 200 089
Decrease due to sales -23 777 -60 176 -17 162 -60 562 -896 326 -2 238 248 -658 335 -2 175 973
Fair value adjustment beginning of period n/a n/a n/a n/a -699 645 -347 227 -204 103 -708 357
Fair value adjustment period end n/a n/a n/a n/a 831 222 831 222 222 498 222 498
Biological assets period end 57 025 57 025 51 089 51 089 3 213 670 3 213 670 2 372 208 2 372 208Biological assets classified as held for sale* n/a n/a 8 441 8 441 n/a n/a 361 097 361 096
Biological assets period end 57 025 57 025 59 530 59 530 3 213 670 3 213 670 2 733 305 2 733 305
As at 30 September 2021, the Shetland assets are classified as held for sale. The classification was made in Q4 2020, thus on the opening balance of 2021,
biological assets related to Shetland are booked as assets held for sale in the statement of financial position. In the table above, the opening-to-closing
balance specification are disclosed for the Group's continued operations. In Q3 2020, the Shetland-assets was included in the statement of financial position.
See more information in Note 4.
Specification of biological assets in Rogaland, Finnmark, British Columbia and Newfoundland
BIOLOGICAL ASSETS AT 30.09.2021NUMBER OF FISH (1 000)
BIOMASS (TONNES)
COST OF PRODUCTION
(NOK 1 000)
FAIR VALUE ADJUSTMENT
(NOK 1 000)
CARRYING AMOUNT
(NOK1 000)
Biomass onshore 20 842 795 156 634 — 156 634
Biological assets with round weight < 4.60 kg 27 961 50 553 1 979 220 834 295 2 813 515
Biological assets with round weight > 4.60 kg 1 137 5 677 246 594 -3 073 243 521
Total (ex. Shetland) 49 941 57 025 2 382 448 831 222 3 213 670
BIOLOGICAL ASSETS AT 30.09.2020NUMBER OF FISH (1 000)
BIOMASS (TONNES)
COST OF PRODUCTION
(NOK 1 000)
FAIR VALUE ADJUSTMENT
(NOK 1 000)
CARRYING AMOUNT
(NOK1 000)
Biomass onshore 20 553 963 163 405 — 163 405
Biological assets with round weight < 4.60 kg 21 338 35 562 1 521 103 241 857 1 762 960
Biological assets with round weight > 4.60 kg 2 825 14 563 465 203 -19 359 445 844
Total (ex. Shetland) 44 716 51 089 2 149 710 222 498 2 372 208
SPECIFICATION OF THE FAIR VALUE ADJUSTMENT, INCOME STATEMENT (NOK 1 000) Q3 2021 Q3 2020 YTD 2021 YTD 2020
Change in fair value adjustment of biological assets 132 477 17 500 479 510 -500 846
Change in physical delivery contracts related to fair value adjustments of biological assets — — — —
Change in fair value of financial derivatives from salmon (Fish Pool contracts) -11 757 -48 969 -92 513 5 106
Total recognized fair value adjustment of biological assets 120 720 -31 469 386 997 -495 739
Provisions allocated to future physical delivery contracts that require fair value adjustments are recognized as other
current liabilities in the balance sheet. The contracts are calculated based on the same forward prices used for fair value
calculation of biological assets. Value adjustment of financial derivatives from salmon are recognized in the balance sheet
as derivatives and other financial instruments. Financial derivatives are calculated at market value.
Grieg Seafood Q3 report 2021 52

NOTE 6 NET INTEREST-BEARING LIABILITIES AND EQUITY ACCORDING TO COVENANTS
Grieg Seafood ASA was in Q4 2020 granted an amendment to the covenants through the third quarter of 2021, and the next
measurement date of NIBD/EBITDA is 31 December 2021 (see the Annual Report for 2020 for information on Grieg
Seafood's financial covenant requirement for NIBD/EBITDA). In the period up until and including Q3 2021, Grieg Seafood is
required to have a minimum free liquidity of NOK 200 million including undrawn and available commitments under
overdraft and revolving facilities. Temporary requirements for 12 month rolling EBITDA have been set for the period. Grieg
Seafood ASA was in compliance with these temporary amended terms at 30 September 2021.
The equity ratio requirement according to the financial covenants of the syndicated loan agreement is 35%, calculated
excl. the effects of IFRS 16. At 30 September 2021, the Group had an equity ratio (according to IFRS) of 41%, while the
equity ratio according to financial covenants was 43% (45%), compared to 43% at 31 December 2020.
The green bond (GSF01 G, listed at Euronext) matures on 25 June 2025. The bond carries a coupon rate of 3 months
NIBOR + 3.4% p.a. The bond's financial covenant is an equity-ratio requirement of minimum 30%, measured consistent
with the Group’s equity-ratio financial covenants as defined in its syndicated loan agreement with secured lenders. The
syndicated debt matures in February 2023, and carries an interest rate of 3M NIBOR + 3.5 % p.a.
NET INTEREST-BEARING LIABILITIES ACCORDING TO COVENANTS (NOK 1 000) 30.09.2021 30.09.2020 31.12.2020
Bond loan (1) 1 500 000 1 000 000 1 500 000
Non-current borrowings incl. syndicate term loan and revolving facility (1), (2) 1 647 694 1 786 394 1 918 946
Lease liabilities (operating leases according to IFRS in force prior to 1 January 2019) 301 710 357 294 176 226
Lease liabilities (finance leases according to IFRS in force prior to 1 January 2019) 302 338 360 282 355 417
Total non-current interest-bearing liabilities (3) 3 751 742 3 503 970 3 950 589
Current portion of borrowings incl. overdraft 705 069 105 832 104 435
Lease liabilities (operating leases according to IFRS in force prior to 1 January 2019) 114 321 171 951 75 426
Lease liabilities (finance leases according to IFRS in force prior to 1 January 2019) 72 820 76 348 77 769
Factoring liabilities — 72 044 —
Total current interest-bearing liabilities 892 210 449 196 257 630
Gross interest-bearing liabilities 4 643 952 3 953 165 4 208 219
Cash and cash equivalents -146 483 -410 231 -275 427
Loans to associates -2 085 -1 910 -1 910
Net interest-bearing liabilities 4 495 384 3 541 024 3 930 882
Factoring liabilities — -72 044 —
Quote of Bremnes' share of cash Ocean Quality AS (40%) (4) — 76 050 —
Lease liabilities (5) -416 030 -529 245 -251 653
Non-current debt to the Province of Newfoundland and Labrador, Canada (2) -26 178 — —
Net interest-bearing liabilities according to covenants 4 053 175 3 015 785 3 679 230
NIBD/EBITDA (6) n/a 4.2 n/a
1) Bond loan and non-current borrowings incl. syndicate term loan and revolving facility as presented above, are exclusive of amortized loan borrowing costs.
2) In Q1 2021, Her Majesty in Right of Newfoundland and Labrador in Canada has been issued preference shares in the Canadian holding company of Grieg
Newfoundland. The arrangement are in line with the Newfoundland project plan. The preference shares are in substance deemed as debt financing. The
consideration will be repaid as from 2026. Repayment schedule based on free cash flow and balloon payment if not repaid within 2039.
3) Total non-current interest-bearing liabilities according to this table is ex. amortized loan costs, which explain the difference between Total non.current
interest-bearing liabilities in this table, and non-current borrowings and lease liabilities in the Statement of Financial Position.
Grieg Seafood Q3 report 2021 53
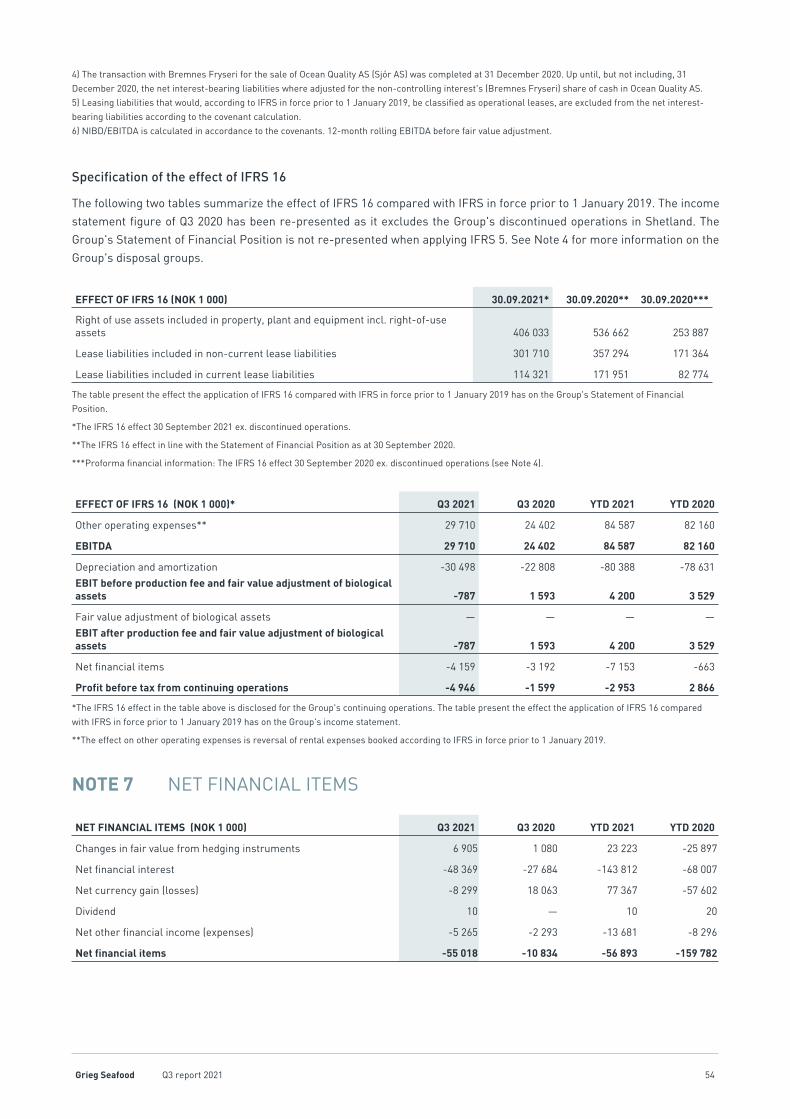
4) The transaction with Bremnes Fryseri for the sale of Ocean Quality AS (Sjór AS) was completed at 31 December 2020. Up until, but not including, 31
December 2020, the net interest-bearing liabilities where adjusted for the non-controlling interest's (Bremnes Fryseri) share of cash in Ocean Quality AS.
5) Leasing liabilities that would, according to IFRS in force prior to 1 January 2019, be classified as operational leases, are excluded from the net interest-
bearing liabilities according to the covenant calculation.
6) NIBD/EBITDA is calculated in accordance to the covenants. 12-month rolling EBITDA before fair value adjustment.
Specification of the effect of IFRS 16
The following two tables summarize the effect of IFRS 16 compared with IFRS in force prior to 1 January 2019. The income
statement figure of Q3 2020 has been re-presented as it excludes the Group's discontinued operations in Shetland. The
Group's Statement of Financial Position is not re-presented when applying IFRS 5. See Note 4 for more information on the
Group's disposal groups.
EFFECT OF IFRS 16 (NOK 1 000) 30.09.2021* 30.09.2020** 30.09.2020***
Right of use assets included in property, plant and equipment incl. right-of-use assets 406 033 536 662 253 887
Lease liabilities included in non-current lease liabilities 301 710 357 294 171 364
Lease liabilities included in current lease liabilities 114 321 171 951 82 774
The table present the effect the application of IFRS 16 compared with IFRS in force prior to 1 January 2019 has on the Group's Statement of Financial
Position.
*The IFRS 16 effect 30 September 2021 ex. discontinued operations.
**The IFRS 16 effect in line with the Statement of Financial Position as at 30 September 2020.
***Proforma financial information: The IFRS 16 effect 30 September 2020 ex. discontinued operations (see Note 4).
EFFECT OF IFRS 16 (NOK 1 000)* Q3 2021 Q3 2020 YTD 2021 YTD 2020
Other operating expenses** 29 710 24 402 84 587 82 160
EBITDA 29 710 24 402 84 587 82 160
Depreciation and amortization -30 498 -22 808 -80 388 -78 631
EBIT before production fee and fair value adjustment of biological assets -787 1 593 4 200 3 529
Fair value adjustment of biological assets — — — —
EBIT after production fee and fair value adjustment of biological assets -787 1 593 4 200 3 529
Net financial items -4 159 -3 192 -7 153 -663
Profit before tax from continuing operations -4 946 -1 599 -2 953 2 866
*The IFRS 16 effect in the table above is disclosed for the Group's continuing operations. The table present the effect the application of IFRS 16 compared
with IFRS in force prior to 1 January 2019 has on the Group's income statement.
**The effect on other operating expenses is reversal of rental expenses booked according to IFRS in force prior to 1 January 2019.
NOTE 7 NET FINANCIAL ITEMS
NET FINANCIAL ITEMS (NOK 1 000) Q3 2021 Q3 2020 YTD 2021 YTD 2020
Changes in fair value from hedging instruments 6 905 1 080 23 223 -25 897
Net financial interest -48 369 -27 684 -143 812 -68 007
Net currency gain (losses) -8 299 18 063 77 367 -57 602
Dividend 10 — 10 20
Net other financial income (expenses) -5 265 -2 293 -13 681 -8 296
Net financial items -55 018 -10 834 -56 893 -159 782
Grieg Seafood Q3 report 2021 54

NOTE 8 INVESTMENT IN ASSOCIATED COMPANIES
Associates that are closely related to the Group's operations and included in the Group´s value chain are classified on a
separate line in EBIT when the relevant associates operate in the same position in the value chain as the Group.
The investment in Tytlandsvik Aqua AS, Nordnorsk Smolt AS and Årdal Aqua AS are classified on the separate line
“Investments in associates” in the statement of financial position, and the share of profit is included in EBIT, presented on
the line item “Share of profit from associates” in the income statement. No investments were classified on a separate line
below the financial statement line of EBIT in the income statement.
ASSOCIATES CLASSIFIED AS OPERATIONS
EQUITY INTEREST
EQUITY INTEREST BOOK VALUE
SHARE OF PROFIT FROM ASSOCIATES
OTHER CHANGES IN THE PERIOD BOOK VALUE
01.01.2021 30.09.2021 01.01.2021 YTD 2021 YTD 2021 30.09.2021
Nordnorsk Smolt AS 50.00% 50.00% 41 264 -4 249 — 37 015
Tytlandsvik Aqua AS 33.33 % 33.33 % 43 158 4 780 — 47 938
Årdal Aqua AS 0.00 % 37.04 % — -423 2 500 2 077
Total associates classified as operations 84 421 108 2 500 87 029
The Group owns, through Grieg Seafood Finnmark AS, a 50.00% ownership interest in Nordnorsk Smolt AS together with
Norway Royal Salmon ASA (50.00%). At 30 September 2021, Grieg Seafood Finnmark has an outstanding long-term loan to
Nordnorsk Smolt AS, amounting to NOK 2.1 million (NOK 1.9 million at 31 December 2020), which is included in the
Group’s other non-current receivables in the Statement of Financial Position. Nordnorsk Smolt AS is located in Troms and
Finnmark county in Northern Norway. Nordnorsk Smolt has an annual production capacity of 800 tonnes.
The Group owns, through Grieg Seafood Rogaland AS, a 33.33% ownership interest in Tytlandsvik Aqua AS, together with
Bremnes Seashore AS (33.33%) and Vest Havbruk AS (33.33%). Tytlandsvik Aqua AS has a current annual production
capacity of 3 400 tonnes, of which Grieg Seafood Rogaland's share of the volume is 50%.
New investment in 2021
In 2021, the Group invested, through Grieg Seafood Rogaland AS, NOK 2.5 million for an ownership interest of 37.04% in
Årdal Aqua AS. The other shareholders of Årdal Aqua AS are Vest Havbruk AS and Omfar AS. Årdal Aqua is currently in the
design development phase of a land-based farming facility in Rogaland in Norway.
Grieg Seafood Q3 report 2021 55

NOTE 9 RELATED PARTIES
Related parties’ transactions
The Group has transactions with companies controlled by Grieg Maturitas II AS, who is the parent company of Grieg Aqua
AS, majority owner of Grieg Seafood ASA. Grieg Seafood ASA rents office premises from Grieg Gaarden AS and acquires
other administrative services from Grieg Group Resources AS. The office rental agreement runs for a period of ten years.
Grieg Kapital AS has share holdings in Ryfylke Rensefisk AS, from which Grieg Seafood acquires lumpfish. Grieg Seafood
ASA buys fuel from Eidsvaag AS, which is a related party to a Board member.
All transactions, including both sale and purchase of goods and services, are made on an arm’s length basis.
SHARES CONTROLLED BY THE BOARD MEMBERS AND MANAGEMENT AT 30.09.2021 NO. OF SHARESSHARE-
HOLDING
Board of directors
Per Grieg Jr. * 60 354 324 53.20%
Tore Holand 2 000 0.00%
Marianne Ødegaard Ribe — 0.00 %
Katrine Trovik — 0.00 %
Group management
CEO 39 489 0.03%
CFO 24 532 0.02%
COO Farming Europe 22 489 0.02%
COO Farming North America 23 889 0.02%
CCO 324 0.00 %
CTO 23 831 0.02%
CHRO 12 060 0.01%
Global Communications Manager 324 0.00 %
Total shares controlled by Board members and Group management 60 503 262 53.33%
*Shares owned by the following companies are controlled by Per Grieg jr. and closely related people
(Verdipapirhandelloven § 2-5):
SHARES OWNED BY PER GRIEG JR. AND CLOSELY RELATED NO. OF SHARESSHARE-
HOLDING
Grieg Aqua AS 56 914 355 50.17%
Ystholmen Felles AS 2 428 197 2.14%
Kvasshøgdi AS 996 772 0.88%
Per Grieg jr. private 15 000 0.01%
Total shares owned by Per Grieg jr. and closely related 60 354 324 53.20%
Grieg Seafood Q3 report 2021 56

NOTE 10 SHARE CAPITAL AND SHAREHOLDERS
As at 30 September 2021, the Company had 113 447 042 shares with a nominal value of NOK 4.00 per share. All shares
issued by the Company are fully paid-up. There is one class of shares and all shares confer the same rights.
SHARE CAPITAL AND NUMBER OF SHARESNOMINAL VALUE
PER SHARE (NOK)
TOTAL SHARE CAPITAL
(NOK 1 000)
NUMBER OF ORDINARY
SHARES
Total 4.00 453 788 113 447 042
Holding of treasury shares 4.00 -5 000 -1 250 000
Sale of treasury shares to employees 2018-2020 4.00 314 78 506
Total excl. treasury shares 4.00 449 102 112 275 548
Treasury shares
In June 2011, the Company purchased 1 250 000 treasury shares at NOK 14.40 per share. From 2018 trough 2020, the
treasures has been sold to employees for use in the share savings program. As at 30 September 2021, the Company has
1 171 494 treasury shares.
THE 20 LARGEST SHAREHOLDERS IN GRIEG SEAFOOD ASA AT 30.09.2021 NO. OF SHARESSHARE-
HOLDING
Grieg Aqua AS 56 914 355 50.17%
OM Holding AS 4 713 957 4.16%
Folketrygdfondet 4 042 389 3.56%
Ystholmen Felles AS 2 428 197 2.14%
State Street Bank and Trust Comp (nominee) 2 062 826 1.82%
Clearstream Banking S.A. (nominee) 1 791 369 1.58%
The Bank of New York Mellon SA/NV (nominee) 1 554 500 1.37%
Six Sis AG (nominee) 1 536 358 1.35%
Ferd AS 1 456 453 1.28%
Banque Degroof Petercam Lux. SA (nominee) 1 173 128 1.03%
Grieg Seafood ASA 1 171 494 1.03%
JPMorgan Chase Bank, N.A., London (nominee) 1 038 543 0.92%
Kvasshøgdi AS 996 772 0.88%
State Street Bank and Trust Comp (nominee) 935 657 0.82%
Ronja Capital II AS 845 004 0.74%
State Street Bank and Trust Comp (nominee) 778 059 0.69%
Verdipapirfondet Pareto Investment 758 500 0.67%
Danske Invest Norge Vekst 561 000 0.49%
Pictet Cie (Europe) S.A. 528 697 0.47%
DZ Privatbank S.A. 452 300 0.40%
Total 20 largest shareholders 85 739 558 75.58%
Total others 27 707 484 24.42%
Total number of shares 113 447 042 100.00%
Grieg Seafood Q3 report 2021 57

ALTERNATIVE PERFORMANCE MEASURES (APM)
EBIT = EBIT before production fee and fair value adjustment of biological assets
Operating profit incl. amortization and depreciation ex. production fee and fair value adjustment of biological assets.
Unless otherwise specified, EBIT before production fee and fair value adjustment of biological assets is shortened to EBIT (earnings before interest and taxes). This also applies to all key figures where EBIT is a component, including: EBIT-margin (%), EBIT/ kg GWT and ROCE.
EBIT before production fee and fair value adjustment provides a more informative result as it does not consider country-specific taxation charged on harvest volume and future gains or losses on fish not yet sold. The fair value adjustment has a non-operational nature and can affect the comparability of our performance from period to period. This EBIT metric is generally considered the industry measure for profitability.
EBITDA = EBITDA before production fee and fair value adjustment of biological assets
Operating profit before amortization and depreciation ex. production fee and fair value adjustment of biological assets.
Unless otherwise specified, EBITDA before production fee and fair value adjustment of biological assets is shortened to EBITDA. This also applies to all key figures where EBITDA is a component. including: EBITDA-margin (%), and NIBD/EBITDA.
EBITDA before production fee and fair value adjustment provides a more informative result as it does not consider future gains or losses on fish not yet sold. The fair value adjustment has a non-operational nature and can affect the comparability of our performance from period to period.
Equity ratio Equity ratio equals equity divided by total assets.
Up until year-end 2020, the equity ratio was calculated both with and without consolidation of Ocean Quality entities. The bank syndicate equity covenant definition is excluding Ocean Quality. It covers only Grieg Seafood companies both with regards to equity and total liabilities. As from 31.12.2020, the investment in Ocean Quality is divested, in the equity-ratio is calculated without the excl. of sales companies. The equity ratio according to covenants are calculated excluding the effect of IFRS 16 compared with IFRS in force prior to 1 January 2019.
The equity ratio is applied to measure financial solidity in accordance with the Group's covenant requirements.
NIBD Net interest-bearing debt (NIBD) comprises non-current and current debt to financial institutions, after deducting cash and cash equivalents. Shetland assets and related liabilities are not included in the NIBD calculation of Grieg Seafood.
NIBD is calculated in three ways:1) For ROCE calculation: including all long-term and current debt
to credit institutions, incl. IFRS 16 effect (compared with IFRS in force prior to 1 January 2019) and factoring liabilities.
2) For covenant calculation as required by the bank syndicate: NIBD as in 1) but excl. the effect of IFRS 16 compared with IFRS in force prior to 1 January 2019, and excl. factoring. This method is used for calculation of NIBD/EBITDA.
NIBD/EBITDA is a measure of solidity and one of the covenants in our bank agreement. When calculating NIBD/ EBITDA, NIBD is calculated according to method 2 and EBITDA is before production fee and fair value adjustment of biological assets.
ROCE Return on capital employed (ROCE) is calculated using EBIT before fair value adjustment of biological assets (including production fee).EBIT included in the ROCE calculation is excl. Shetland, while equity is calculated before fair value adjustment of biological assets, incl. the biological assets at Shetland classified as held for sale.Quarterly ROCE is calculated as quarterly EBIT before fair value adjustment of biological assets, but including production fee, divided by the average of NIBD plus equity before fair value adjustment of biological assets from opening- to closing balance of the quarter. ROCE for year-to-date (YTD) is calculated using the same methodology. The EBIT-figure described above is annualized by grossing it up (4/1 for quarterly ROCE and 4/current quarter number for YTD). NIBD is calculated according to method 1, described in the NIBD section above.
ROCE measures the return on invested capital. Fair value adjustment of biological assets is extracted, as this reflects future gains or losses on fish not yet sold, which can affect the comparability of performance from period to period.
FARMING COST/KG
Farming cost per kg is the farming cost directly related to production and harvest of salmon (head-on-gutted), divided by the related harvest volume of the farming operation. We disclose our farming cost figures for year-to-date and quarter-to-date, per region and Group level.
Farming cost on Group level is calculated on the farming operation of the Group, e.g. excluding headquarter/ownership costs.
Each generation of salmon tie up net-working capital (production cost recognized as biological assets) for a considerable time, while the sales prices in the markets are highly dependent on the prevailing spot prices. We track and measure our farming cost level for the Group as a whole, and per region level, to evaluate our profitability and operational performance.
APM DEFINITION AND CALCULATION REASON FOR APPLYING APM
Grieg Seafood Q3 report 2021 58

About Grieg Seafood
Grieg Seafood ASA is one of the world's leading salmon farmers, targeting 130 000 tonnes of harvest (GWT) in 2025.
Our farms are in Finnmark and Rogaland in Norway, British Columbia
and Newfoundland in Canada, and Shetland in the UK. Our headquarter
is located in Bergen, Norway. Grieg Seafood ASA was listed at the Oslo
Stock Exchange in June 2007. More than 900 people work in the
Company throughout our regions. Sustainable farming practices are the
foundation of Grieg Seafood’s operations. The lowest possible
environmental impact and the best possible fish welfare is both an
ethical responsibility and a drive for economic profitability. Towards
2025, we aim for global growth, cost improvements and to evolve from a
pure salmon supplier to an innovation partner for selected customers.
GRIEG SEAFOOD ASA
Postal address P.O. Box 234 Sentrum. 5804 Bergen
Visiting addressGrieg-Gaarden. C. Sundts gt. 17/19. 5004 Bergen
Telephone + 47 55 57 66 00
Website www.griegseafood.com
Organization number NO 946 598 038 M
Board of Directors Group Management Financial calendar
Per Grieg jr.Chair
Tore HolandVice chair
Katrine TrovikBoard member
Marianne Ødegaard RibeBoard member
Andreas KvameCEO
Atle Harald SandtorvCFO
Alexander KnudsenCOO Farming Europe
Roy-Tore RikardsenCOO Farming North America
Erik HolvikChief Commercial Director
Knut UtheimCTO
Kathleen O. MathisenCHRO
Kristina FurnesGlobal Communications Manager
Q4 202115 February 2022
Annual Report 202131 March 2022
Q1 202213 May 2022
Q2 202223 August 2022
Q3 202211 November 2022
The Company reserves the right to make
amendments to the financial calendar.